

Introduction
While Christian nationalism has dominated headlines and fueled fierce debate in American politics, the story of those who reject it remains largely untold. Yet these Americans constitute a clear majority — a broad coalition spanning political parties, religious traditions, demographic groups, and geographic regions. In collaboration with the Meanings of Democracy Lab of the SNF Agora Institute at Johns Hopkins University, which has been tracking resistance to Christian nationalism, this report turns the lens toward these resisters: who they are, where they live, and what their resistance reveals about the future of American democracy.
Drawing on more than 22,000 interviews from PRRI’s 2025 American Values Atlas, this report updates PRRI and the Meanings of Democracy Lab’s 2024 analysis of resistance to Christian nationalism with new national and state-level estimates, using the five-item scale PRRI first developed in 2022. The report breaks new ground by examining how the partisan composition of state legislatures and religious diversity shape resistance across the 50 states. It also profiles the Americans most likely to reject or express skepticism toward Christian nationalism and explores their views on democracy, political violence, religious and racial pluralism, immigration, gender, abortion, and pronatalism.
Executive Summary
Nearly two-thirds of Americans resist Christian nationalism, qualifying as Christian nationalism Rejecters or Skeptics.
- In 2025, nearly two-thirds of Americans qualified as Christian nationalism Rejecters (27%) or Skeptics (37%), compared with roughly three in ten who qualified as Sympathizers (21%) or Adherents (11%).
- The share of Rejecters declined slightly from 29% at the end of 2022 to 26% at the end of 2025, while the share of Sympathizers increased from 19% to 21%. Changes in the shares of Skeptics and Adherents were minor and not statistically significant.
Resistance to Christian nationalism varies widely across the 50 states, ranging from a low of 42% in Arkansas to a high of 80% in Massachusetts.
- Resistance to Christian nationalism is strongest in Western states such as Washington (77%), California (74%), Oregon (73%), and Nevada (70%), as well as Northeastern states such as Massachusetts (80%), New Jersey (74%), and New York (73%).
- The smallest shares of Christian nationalism resisters are concentrated in the Midwest and South: Arkansas (42%), Mississippi (43%), and West Virginia (46%) sit at the bottom of the ranking, with Oklahoma (49%) also falling below the majority threshold.
At the state level, resistance to Christian nationalism is strongly correlated with Democratic representation in state legislatures and with religious diversity.
- There is a strong positive correlation between the proportion of Democrats in a state’s legislature and Christian nationalism resistance scores. In Massachusetts, where Christian nationalism resistance is high (0.77), Democrats hold 84% of state legislative seats, compared with just 19% in Arkansas, with an average resistance score of 0.48.
- Religious diversity at the state level is also highly correlated with resistance to Christian nationalism. New Jersey and New York rank among the most religiously diverse states and have some of the highest average resistance scores (0.74 and 0.73), compared with Arkansas, among the least diverse states, with an average resistance score of 0.48.
Resistance to Christian nationalism is highest among younger Americans, the college-educated, Democrats, and liberals.
- Resistance decreases with age and increases with education. Large majorities of Americans under 50 and those with college and postgraduate degrees resist Christian nationalist beliefs, compared with smaller shares of Americans ages 50 and older and those with a high school education or less.
- Large majorities of Democrats (82%) and independents (72%) resist Christian nationalist beliefs, compared with 40% of Republicans. Similarly, an overwhelming majority of liberals (89%) and moderates (70%) qualify as Rejecters or Skeptics, compared with 43% of conservatives.
- More than eight in ten Americans who most trust newspapers for news qualify as Rejecters (37%) or Skeptics (46%), while those who most trust the radio, Fox News, or far-right news outlets are the least likely to resist Christian nationalism.
Resistance to Christian nationalism is strongest among non-Christians, but majorities of numerous Christian traditions also resist it.
- Roughly eight in ten or more Unitarian Universalists (94%), Jewish Americans (88%), religiously unaffiliated Americans (87%), Buddhists (81%), Hindus (79%), and Muslims (79%) resist Christian nationalist beliefs.
- Majorities of several Christian groups also qualify as Rejecters or Skeptics, including Hispanic Catholics (71%), white Catholics (62%), white mainline/non-evangelical Protestants (61%), and Orthodox Christians (60%).
- Black Protestants (52%) and Latter-day Saints (49%) are more divided, while Hispanic Protestants (42%), Jehovah’s Witnesses (42%), and white evangelical Protestants (30%) are the least likely to resist.
- Most Americans who seldom or never attend religious services qualify as Rejecters (40%) or Skeptics (39%), compared with four in ten of those who attend weekly (8% Rejecters, 32% Skeptics). Similar patterns hold for prayer and Scripture reading.
Christian nationalism Rejecters are the most familiar with the term “Christian nationalism” — and the most likely to view it unfavorably.
- The share of Americans who say they have never heard of the term “Christian nationalism” declined from 35% in 2022 to 32% in 2025. Rejecters are the least likely to say they have never heard of the term (19%), compared with Skeptics (37%), Sympathizers (40%), and Adherents (35%).
- Americans are twice as likely to hold an unfavorable view of the term “Christian nationalism” (43%) as a favorable one (21%). Most Rejecters (79%) view the term unfavorably, compared with Skeptics (43%), Sympathizers (19%), and Adherents (11%). Rejecters (19%) are also the least likely to say they have not heard of the term, compared with Skeptics (37%), Sympathizers (40%), and Adherents (35%).
Christian nationalism resisters score low on right-wing authoritarianism and strongly oppose efforts to erode democratic norms.
- A majority of Christian nationalism Rejecters and Skeptics (59%) score low or very low on the Right-Wing Authoritarianism Scale (RWAS), with Rejecters (78%) significantly more likely than Skeptics (43%) to do so. By contrast, most Adherents (65%) score high or very high.
- Opposition to amending the Constitution to allow presidents to serve more than two terms is strongest among Rejecters (94%) and Skeptics (83%), compared with Sympathizers (74%) and Adherents (61%).
- Large majorities of Rejecters (87%) and Skeptics (72%) disagree that President Donald Trump should postpone the 2026 midterm elections if states cannot get voter fraud under control, compared with Sympathizers (60%) and Adherents (44%).
- Most Rejecters (85%) agree that the right to freely criticize the government seems less protected than in previous years, and disagree that the system of checks and balances is working as it should (74%).
Christian nationalism resisters remain the least likely Americans to support political violence.
- While support for political violence among Rejecters increased in December 2025 to reach the same level as Skeptics (17% each), both groups remain far less likely than Sympathizers (25%) and Adherents (28%) to agree that true American patriots may have to resort to violence to save the country.
Christian nationalism resisters overwhelmingly embrace religious and racial pluralism and hold welcoming views of immigrants.
- Overwhelming majorities of Rejecters (94%) and Skeptics (77%) prefer the U.S. to be a nation made up of people belonging to a wide variety of religions, compared with fewer Sympathizers (47%) and Adherents (27%).
- Overwhelming majorities of Rejecters (92%) and Skeptics (80%) say America is best understood as a nation built on the idea that all people have equal rights and freedoms, compared with 69% of Sympathizers and 65% of Adherents.
- Rejecters (84%) and Skeptics (55%) are the most likely to agree that newcomers strengthen American society, and the least likely to agree that immigrants are invading the country and replacing its cultural and ethnic background (8% and 32%, respectively).
- Most Rejecters and Skeptics agree that immigrants, regardless of legal status, should have the right to challenge their deportation in court (87% and 62%, respectively) and favor birthright citizenship (88% and 69%, respectively).
Christian nationalism resisters reject traditional gender hierarchies, support abortion legality, and oppose pronatalist policies.
- Large majorities of Rejecters (91%) and Skeptics (78%) disagree that the gains women have made in recent years have come at the expense of men, and also reject the idea that men and women should stick to the jobs they are naturally suited for and that society has become too soft and feminine.
- Nearly all Rejecters (93%) and two-thirds of Skeptics (66%) say abortion should be legal in all or most cases, compared with far fewer Sympathizers (37%) and Adherents (22%).
- Rejecters (70%) are the most likely to oppose policies that encourage more Americans to have children, compared with Skeptics (52%), Sympathizers (50%), and Adherents (48%), who are more divided.
While Rejecters and Skeptics diverge on most issues compared with Adherents and Sympathizers, Rejecters often hold significantly more progressive views than Skeptics across a range of political and social issues.
- Among Americans who qualify as Christian nationalism Rejecters or Skeptics, a majority (59%) score low or very low on the Right-Wing Authoritarian Scale, with Rejecters (78%) significantly more likely than Skeptics (43%) to do so.
- Most Christian nationalism Rejecters (74%) disagree with the statement “The system of checks and balances in our government is working as it should to limit one branch of government from becoming too powerful,” compared with half of Skeptics (49%).
- Rejecters (82%) are significantly more likely than Skeptics (55%) to disagree with the statement “Society as a whole has become too soft and feminine,” while around four in ten Americans (42%) agree.
- Rejecters are also more likely than Skeptics to oppose abortion and pronatalist policies and reject the Great Replacement theory. They are also more likely to hold more positive views of immigrants, favor birthright citizenship, and believe immigrants should have the right to challenge their deportation in court.
Measuring Christian Nationalism
PRRI uses a battery of five questions about the relationship between Christianity, American identity, and the U.S. government to measure views on Christian nationalism.[1] PRRI asks survey respondents whether they completely agree, mostly agree, mostly disagree, or completely disagree with each of the following statements:
- The U.S. government should declare America a Christian nation.
- U.S. laws should be based on Christian values.
- If the U.S. moves away from our Christian foundations, we will not have a country anymore.
- Being Christian is an important part of being truly American.
- God has called Christians to exercise dominion over all areas of American society.
Based on their answers to these five questions, each respondent receives a composite score on the Christian nationalism scale (with a range of 0 to 1) and is then assigned to one of four groups:
Christian nationalism Rejecters (Score 0): These Americans completely disagree with all five statements in the scale. This group includes 27% of Americans.
Christian nationalism Skeptics (Score 0.01-0.49): These Americans disagree with most statements in the scale, but, unlike Rejecters, do not completely disagree with all statements. This group includes 37% of Americans.
Christian nationalism Sympathizers (Score 0.5–0.74): These Americans agree with most statements in the scale, but they are less likely than Adherents to completely agree. This group includes 21% of Americans.
Christian nationalism Adherents (Score 0.75–1): These Americans completely or mostly agree with all five statements in the scale. This group includes 11% of Americans.

At the end of 2025, nearly two-thirds of Americans were either Rejecters (26%) or Skeptics (38%). Although the share of Rejecters declined modestly from 29% at the end of 2022 to 26% at the end 2025, the proportion of Skeptics remained unchanged. The shares of Sympathizers increased from 19% to 21%, while the share of Adherents also remained virtually the same over the same period.
Christian Nationalism Resistance: Who Are Most Likely to Resist Christian Nationalism?
Demographics
Age
Resistance to Christian nationalism decreases with age, with a clear break around age 50. Two-thirds of Americans ages 18-29 (33% of Rejecters and 34% of Skeptics) and ages 30-49 (30% of Rejecters and 37% of Skeptics) resist Christian nationalism beliefs, compared with six in ten of those ages 50-64 (22% of Rejecters and 39% of Skeptics) and senior Americans ages 65+ (20% of Rejecters and 38% of Skeptics).

Education
Resistance to Christian nationalism is positively correlated with educational attainment. Americans with a postgraduate degree (38% of Rejecters and 40% of Skeptics) or a college degree (33% of Rejecters and 37% of Skeptics) are considerably more likely than those with some college (25% of Rejecters and 35% of Skeptics) or a high school education or less (19% of Rejecters, 37% of Skeptics) to resist Christian nationalism beliefs.

Race/Ethnicity
Asian Americans and Pacific Islanders (AAPI) are the most likely to resist Christian nationalism beliefs (37% of Rejecters and 39% of Skeptics), followed by over six in ten Hispanic Americans (26% of Rejecters and 40% of Skeptics), multiracial Americans (31% of Rejecters and 34% of Skeptics), and white Americans (27% of Rejecters and 36% of Skeptics). AAPI Americans are notably more likely to identify as non-Christians. Black Americans resist Christian nationalism at slightly lower rates than other racial groups (21% of Rejecters and 38% of Skeptics).

Political Orientation and Media Consumption
Party Affiliation
A large majority of Democrats (82%) and independents (72%) reject Christian nationalist beliefs, compared with 40% of Republicans. By contrast, a majority of Republicans qualify as Christian nationalism Adherents or Sympathizers (56%).

Political Ideology
An overwhelming majority of liberals (89%) and moderates (70%) reject Christian nationalist beliefs, compared with 43% of conservatives. By contrast, most conservatives qualify as Christian nationalism Adherents or Sympathizers (54%).

Media Trust
PRRI’s 2025 American Values Survey asked which news sources Americans trust most to provide accurate information about politics and current events. Over eight in ten Americans who most trust newspapers qualify as either Christian nationalism Rejecters (37%) or Skeptics (46%), followed by those who most trust mainstream media outlets (35% of Rejecters and 37% of Skeptics) and social media (32% of Rejecters and 40% of Skeptics). Additionally, at least six in ten Americans who most trust YouTube or podcasts qualify as Rejecters (30%) or Skeptics (36%), as well as those who most trust other news sources (32% of Rejecters and 32% of Skeptics) or those who do not trust the news (25% of Rejecters and 36% of Skeptics). Those who most trust the radio (8% of Rejecters and 39% of Skeptics), Fox News (6% of Rejecters and 38% of Skeptics), and far-right news (4% of Rejecters and 30% of Skeptics) are the least likely to resist Christian nationalism ideology.

Religious Identity and Practices
Religious Tradition
Given that Christian nationalism centers Christianity as a defining feature of American identity, it is unsurprising that non-Christian groups are especially resistant to it. Overall, roughly eight in ten or more Unitarian Universalists (94%), Jewish Americans (88%), religiously unaffiliated Americans (87%), Hindus (79%), Buddhists (81%), and Muslims (79%) resist Christian nationalist beliefs.
Although non-Christians are among the groups most likely to reject Christian nationalism, they are not alone in their resistance. There is also a cluster of groups associated with Christian traditions who resist Christian nationalism ideals. Around six in ten or more Hispanic Catholics (71%), white Catholics (62%), white mainline/non-evangelical Protestants (61%), and Orthodox Christians (60%) qualify as Rejecters or Skeptics. By contrast, Black Protestants (52%) and Latter-day Saints (49%) are more divided on their resistance. Hispanic Protestants (42%), Jehovah’s Witnesses (42%), and white evangelical Protestants (30%) are the least likely to qualify as Rejecters or Skeptics.[2]

Religious Practices: Church Attendance, Prayer, Bible Reading
Christian nationalism Adherents and Sympathizers engage in more religious practice than Christian nationalism resisters. Christian nationalism Adherents and Sympathizers are more likely than Skeptics and Rejecters to pray regularly, read the Bible, and attend church on a weekly basis.

Resistance to Christian nationalism is more prevalent among Americans who participate less frequently in religious practices. Most Americans who seldom or never attend religious services qualify as Christian nationalism Rejecters (40%) or Skeptics (39%), compared with six in ten of those who attend monthly or a few times a year (18% of Rejecters and 41% of Skeptics) and four in ten of those who attend services weekly (8% of Rejecters and 32% of Skeptics). This negative correlation between frequency of religious practice and resistance to Christian nationalism also holds for the practices of prayer and Scripture reading. Resistance to Christian nationalism declines among more religious Americans.

Resistance to Christian Nationalism at the State Level
Patterns of Resistance to Christian Nationalism Resistance Across All 50 States
The share of Americans who resist Christian nationalism, defined as Christian nationalism Rejecters and Skeptics, differs considerably across states, ranging from a low of 42% in Arkansas to a high of 80% in Massachusetts (see Appendix A for a table showing Christian nationalism groups in all 50 states).
Resistance to Christian nationalism is strongest in blue states like Massachusetts (80%), Washington (77%), California (74%), New Jersey (74%), New York (73%), Oregon (73%), and Rhode Island (73%). Battleground states also contain large shares of residents who resist Christian nationalism. Of these, only Nevada has a higher share of Christian nationalism resisters (70%) than the country as a whole (64%). Similar shares of residents in Michigan (64%), Wisconsin (63%), Arizona (61%), Pennsylvania (61%), and North Carolina (60%) resist Christian nationalism, while Georgia (52%) has a notably lower share. Just one red state — Utah (68%) — has a slightly higher proportion of Christian nationalism resisters than the country as a whole.
When looking at Christian nationalism Skeptics in particular (see Appendix A), some interesting outliers also emerge. The red states Utah (46%) and Nebraska (45%) include some of the highest shares of Christian nationalism Skeptics in the country, followed by the blue states of Rhode Island (44%), New Hampshire (44%), and Maine (44%), and the battleground state of Wisconsin (42%).
Patterns of Resistance to Christian Nationalism by Religious Affiliation in Red, Blue, and Battleground States
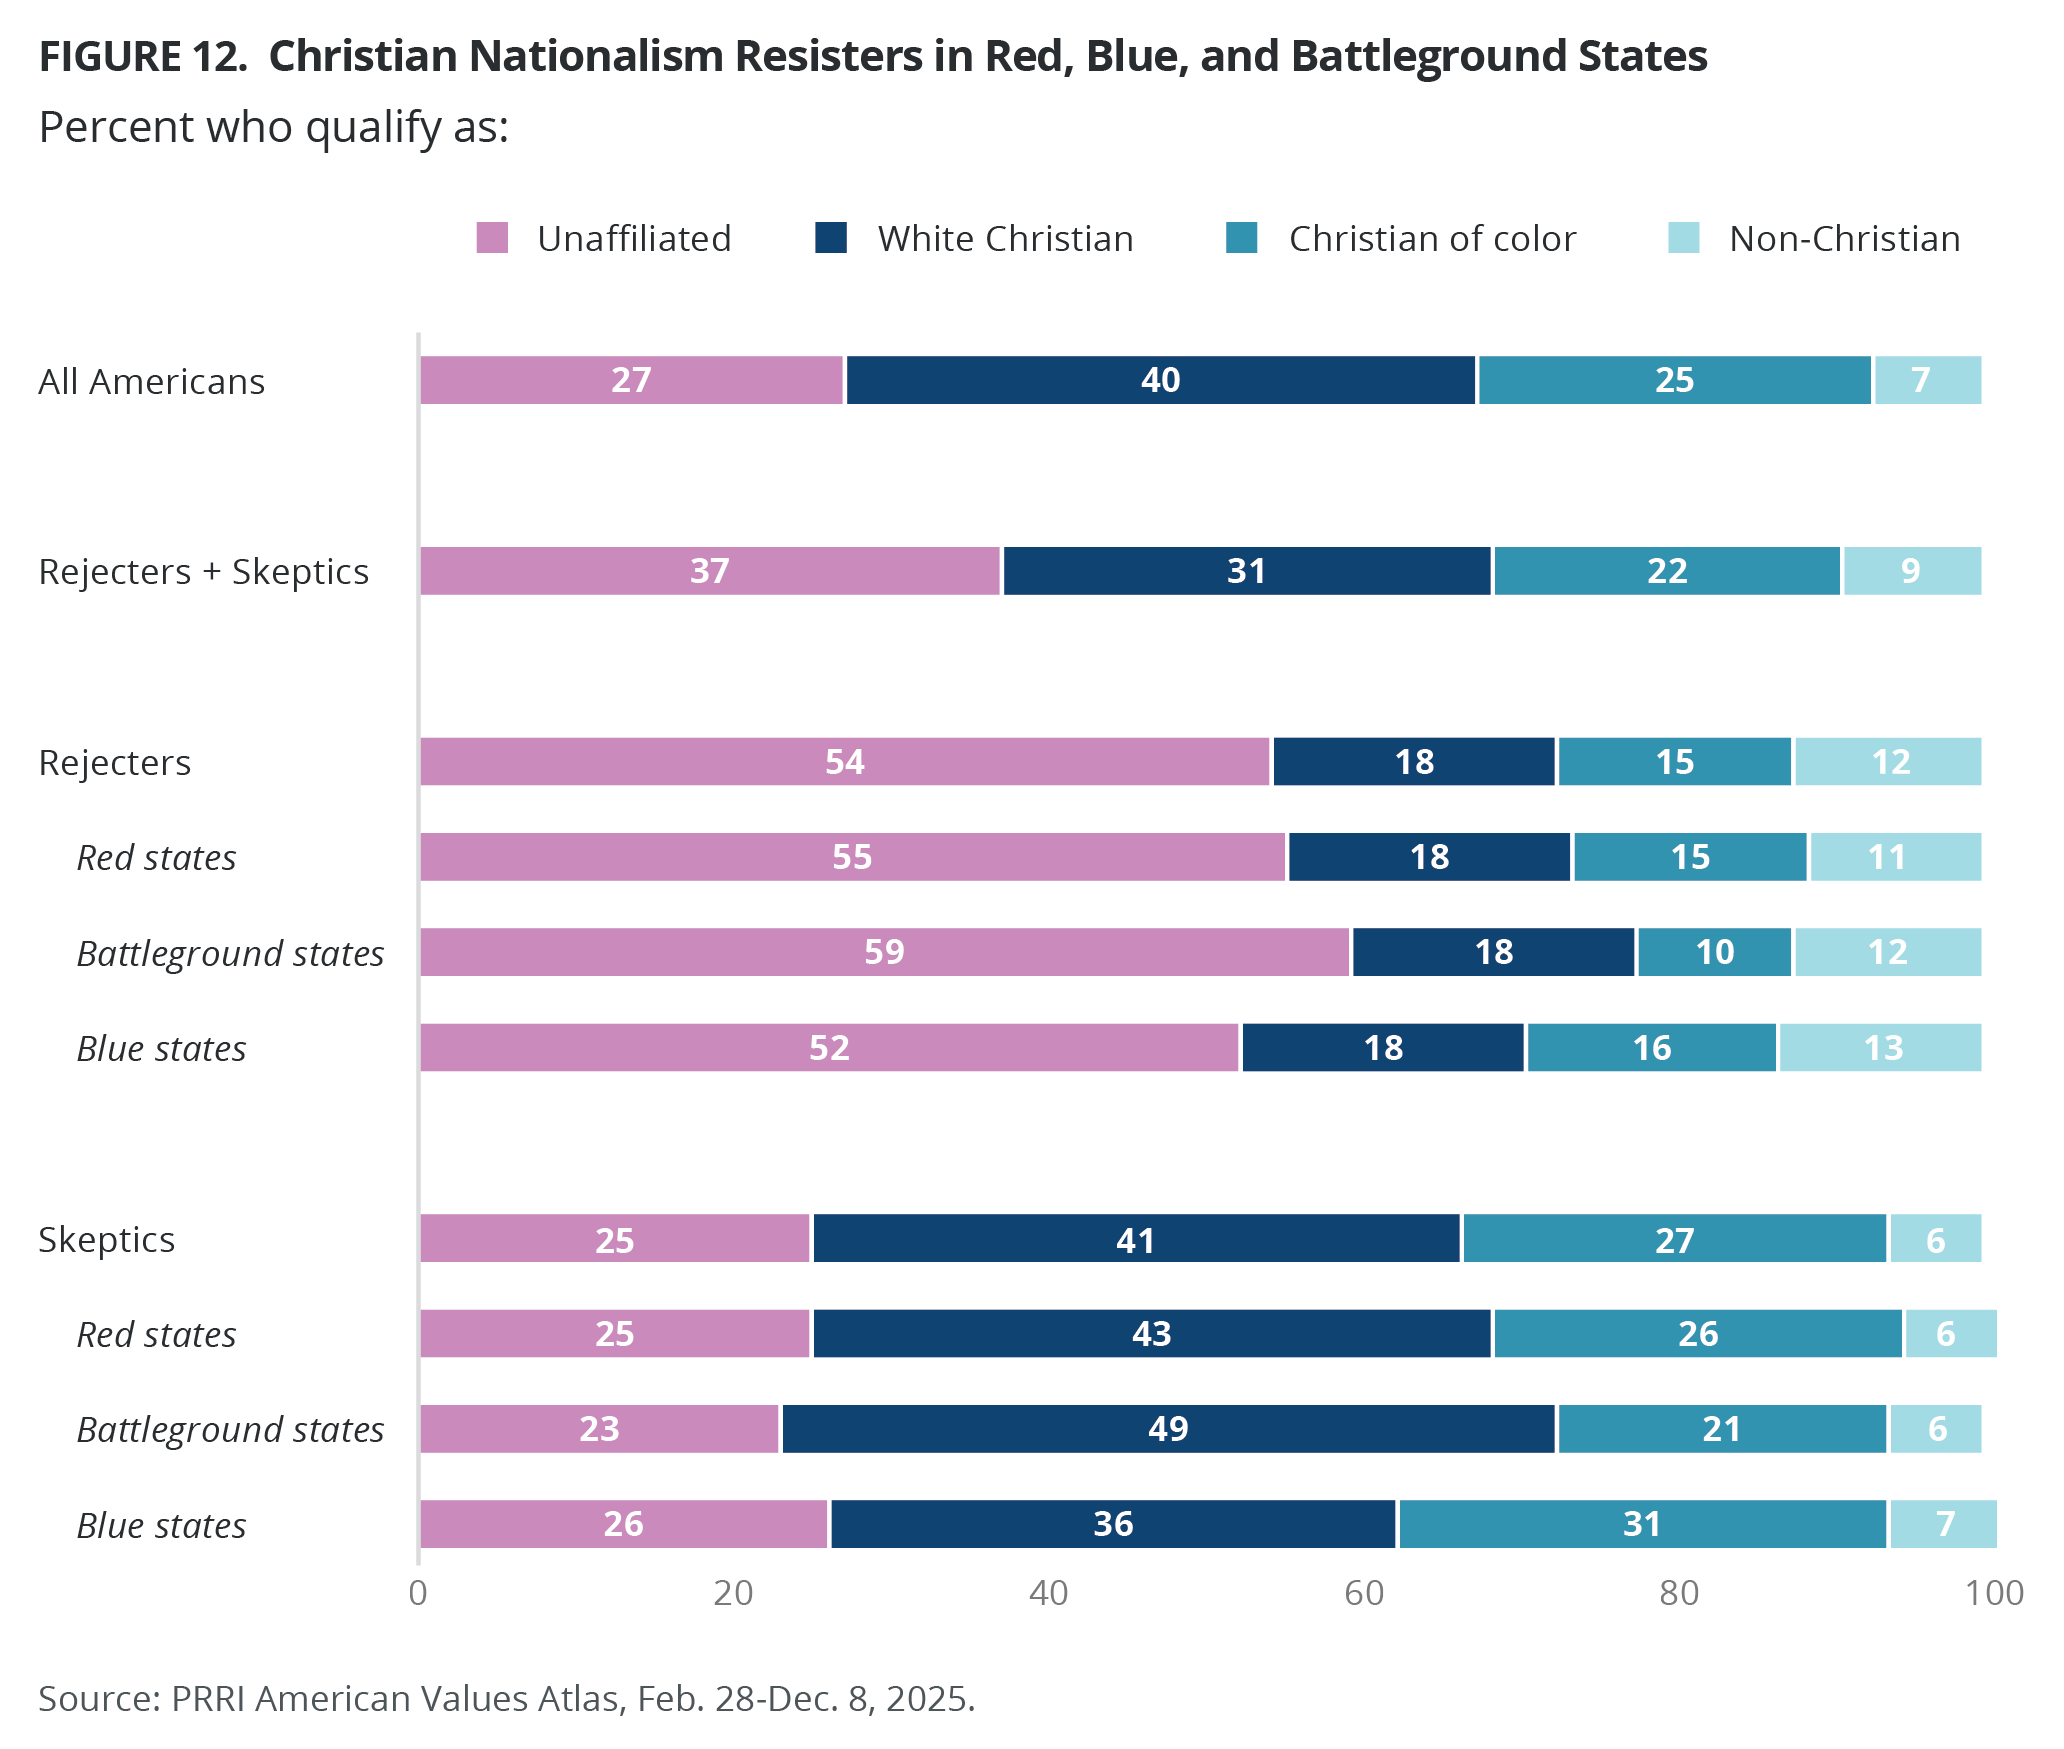
Across red, battleground, and blue states, unaffiliated Americans consistently make up the majority of Christian nationalism Rejecters (55%, 59%, and 52%, respectively). Non-Christians (11%, 12%, and 13%, respectively) and white Christians (18% across all three state types) also represent similar shares of Rejecters, regardless of whether they live in red, battleground, or blue states. Christians of color make up a slightly lower share of Rejecters in battleground states (10%) than in red (15%) or blue (16%) states.
In addition, white Christians make up a larger share of Christian nationalism Skeptics in battleground states (49%) than in red (43%) or blue (36%) states, while Christians of color are better represented among Christian nationalism Skeptics in blue states (31%) than in red states (26%) or battleground states (21%). There are no differences among unaffiliated or non-Christian Skeptics in red (25% and 6%), battleground (23% and 6%), or blue (26% and 7%) states.
Resistance to Christian Nationalism and Democratic Representation in State Legislatures
Christian nationalism resisters are concentrated in states where Democrats hold larger majorities in their state legislatures.[3] Figure 13 shows a strong positive correlation between the proportion of Democrats in a state’s legislature and scores on the Christian Nationalism Resistance Scale.[4] For example, Massachusetts and Washington have average Christian nationalism resistance scores of 0.77 and 0.76, respectively, with Democrats representing 84% and 60% of their state legislatures. Similarly, California and New York have comparable average resistance scores (0.72 and 0.73, respectively), with Democratic lawmakers holding 75% and 67% of state legislative seats. In contrast, Arkansas, with an average Christian nationalism resistance score of 0.48, has Democrats holding only 19% of seats in its state legislature.
Resistance to Christian Nationalism and Religious Diversity at the State Level
Religious diversity at the state level is also highly correlated with Christian nationalism resistance. The Religious Diversity Index is calculated in a way that a score of 1 indicates complete diversity — every multiple religious group are of equal size — and a score of 0 indicates a complete lack of diversity and one religious group makes up the entire population of a given state.[5] Figure 14 shows, for example, New Jersey and New York have index scores of 0.86 and 0.85, respectively, and average Christian nationalism resistance scores of 0.74 and 0.73. Similarly, California and Massachusetts show relatively high levels of religious diversity (0.83 and 0.81, respectively) with some of the nation’s highest average of Christian nationalism resistance scores (0.72 and 0.77). In contrast, Arkansas, with a Religious Diversity Index score of 0.64, has an average Christian nationalism resistance score of 0.48.
Christian Nationalism Resistance and Perceptions of Christian Nationalism Term
The term “Christian nationalism” has gained more attention in public discourse, as more Americans have become familiar with it and apply the term to themselves and others. PRRI first asked about Americans’ familiarity with and view of the term “Christian nationalism” in 2022, when more than one-third of Americans (35%) indicated they had never heard of it. By 2025, that share had declined to 32%. Christian nationalism Rejecters were the least likely to say they have never heard of the term (19%), compared with Skeptics (37%), Sympathizers (40%), and Adherents (35%).

Moreover, overall Americans are more likely to hold an unfavorable view of the term “Christian nationalism” (43%) than a favorable one (21%). Most Christian nationalism Rejecters (79%) hold unfavorable views of the term, compared with Skeptics (43%), Sympathizers (19%), and Adherents (11%). Since December 2022, the share of Rejecters and Skeptics who hold unfavorable views of the term “Christian nationalism” has remained largely unchanged.
Authoritarianism, Democracy and Resisting Political Violence
How Do Christian Nationalism Resisters Score on Authoritarianism?
Right Wing Authoritarianism
PRRI’s 2025 American Values Survey finds that most Americans do not hold highly authoritarian views. A little over one-third of Americans (35%) score very high or high on the Right-Wing Authoritarian Scale (RWAS), compared with 41% who score low or very low; nearly one in four Americans qualify as having mixed opinions (23%).
Among Americans who qualify as Christian nationalism Rejecters or Skeptics, a majority (59%) score low or very low on the RWAS, with Rejecters (78%) significantly more likely than Skeptics (43%) to do so. By contrast, nearly two-thirds of Christian nationalism Sympathizers and Adherents (65%) score high or very high on the RWAS.

Support for Extending Presidential Term Limits and Delaying the 2026 Congressional Elections
A large majority of Americans (79%) disagree with the statement “The U.S. Constitution should be amended to allow presidents to serve more than two terms in office.” Opposition is strongest among Christian nationalism Rejecters (94%), followed by Skeptics (83%), Sympathizers (74%), and Adherents (61%).
Similarly, the majority of Americans disagree with the statement “If states can’t get voter fraud under control, President Trump should postpone the 2026 midterm elections for Congress” (69%). Again, except for Christian nationalism Adherents (44%), majorities across all other Christian nationalism groups disagree with this statement, especially Rejecters (87%) and Skeptics (72%).

Christian Nationalism Resistance and Democracy
Ability to Criticize the Government and Checks and Balances
PRRI’s 2025 American Values Survey asked questions on democratic freedoms and checks and balances. Strong majorities of Americans (69%) agreed with the statement “The ability of Americans to freely criticize the government without fear of punishment is a right that seems less protected than in previous years,” especially those who qualify as Christian nationalism Rejecters (85%), followed by Skeptics (66%), Sympathizers (65%), and Adherents (65%).
In addition, Americans are divided on whether “the system of checks and balances in our government is working as it should to limit one branch of government from becoming too powerful” (46% agree vs. 50% disagree). However, most Christian nationalism Rejecters (74%) disagree, compared with half of Skeptics (49%) and just about one-third of Sympathizers (35%) and Adherents (30%).

Christian Nationalism Resistance and Political Violence
The vast majority (79%) of Americans disagree that “because things have gotten so far off track, true American patriots may have to resort to violence in order to save our country,” while just 17% agree. Since PRRI started asking this question, Rejecters and Skeptics have been consistently the least likely to support political violence. While support among Rejecters increased in December 2025 to reach the same levels as Skeptics (17%), both groups remained far less likely than Sympathizers (25%) and Adherents (28%) to agree that political violence may be necessary to save the country.

Christian Nationalism Resistance and Religious and Racial Pluralism
Religious Pluralism
Two-thirds of Americans (67%) say they would prefer the U.S. to be a nation “made up of people belonging to a wide variety of religions,” while around three in ten would prefer the U.S. to be a nation “primarily made up of people who follow the Christian faith” (29%). The overwhelming majority of Christian nationalism Rejecters (94%) and Skeptics (77%) agree with the first statement, compared with fewer Christian nationalism Sympathizers (47%) and Adherents (27%).

Racial Pluralism
Nearly eight in ten Americans (78%) believe America is best understood as a nation “built around the idea that all people, regardless of the circumstances of their birth or station in life, have equal rights and freedoms,” compared with less than two in ten who say the country is best understood as a nation “comprised of people with a shared heritage and homeland” (19%). Majorities across all Christian nationalism groups agree with the first statement, though agreement is significantly higher among Rejecters (92%) and Skeptics (80%).

Christian Nationalism Resistance and Immigration Views
Perceptions of Immigrants
Most Americans (57%) agree that the growing number of newcomers from other countries strengthens American society, especially Christian nationalism Rejecters (84%) and Skeptics (55%). Just four in ten Christian nationalism Sympathizers (41%) and one-third of Adherents (31%) agree. All these groups experienced a slight decrease in agreement with the statement since it was first asked in December 2022.
The opposite pattern emerges when Americans are asked whether immigrants are invading the country and replacing its cultural and ethnic background, or the so-called “great replacement theory.” Just about one-third of Americans (32%) agree with this idea, with the weakest support among Christian nationalism Rejecters (8%) and Skeptics (32%). By contrast, majorities of both Christian nationalism Sympathizers (51%) and Adherents (67%) agree.

Immigration Policies
PRRI’s 2025 American Values Survey also shows that most Americans (61%) agree that “immigrants, regardless of legal status, should have the right to challenge their deportation in court,” compared with 36% who disagree. Most Christian nationalism Rejecters (87%) and Skeptics (62%) agree, compared with far fewer Sympathizers (45%) and Adherents (37%).

Majorities of Americans (67%) favor the U.S. Constitution’s existing guarantee that all children who are born in the United States are automatically granted U.S. citizenship, regardless of their parents’ citizenship status. Most Christian nationalism Rejecters (88%) and Skeptics (69%) favor birthright citizenship, while Sympathizers (55%) and Adherents (49%) are divided.

Christian Nationalism Resistance, Gender Views, Abortion Legality, and Pronatalism
Gender Views
Three-fourths of Americans (75%) disagree with the statement “The gains that women have made in recent years have come at the expense of men,” while around two in ten agree (21%). The vast majority of Christian nationalism resisters disagree with the statement, particularly Rejecters (91%) and Skeptics (78%), compared with roughly six in ten Christian nationalism Sympathizers (67%) and Adherents (59%).
Most Americans disagree (58%) that “society is better off when men and women stick to the jobs and tasks they are naturally suited for,” compared with less than four in ten who agree (37%). Christian nationalism Rejecters (86%) and Skeptics (62%) are substantially more likely to disagree with this statement than Sympathizers (38%) and Adherents (31%).
A slim majority of Americans (54%) disagree with the statement “Society as a whole has become too soft and feminine,” while around four in ten agree (42%). Rejecters (82%) are significantly more likely than Skeptics (55%) to disagree. The difference between Christian nationalism Sympathizers (39%) and Adherents (25%) is less pronounced.

Abortion Legality
Six in ten Americans (61%) say abortion should be legal in all or most cases, while more than one-third say it should be illegal in all or most cases (36%); one in ten Americans (8%) say abortion should be illegal in all cases. Nearly all Christian nationalism Rejecters (93%) say abortion should be legal in all or in most cases, compared with 66% of Skeptics. By contrast, Christian nationalism Sympathizers (37%) and Adherents (22%) are far less likely to say abortion should be legal in all or in some cases.
Pronatalism
A slim majority of Americans oppose policies that encourage more Americans to have children (54%), compared with 41% who favor them. Christian nationalism Rejecters (70%) are the most likely to oppose pronatalism policies, compared with Skeptics (52%), Sympathizers (50%), and Adherents (48%), who are more divided.
PRRI conducted a question-wording experiment on this item, asking half of the sample about these policies as described above and asking the other half the same question but specifying “policies that encourage only certain Americans to have children to help preserve the country’s current demographic makeup.” An overwhelming majority of Americans oppose this policy (86%), with just 10% in favor, including most Christian nationalism groups.

APPENDIX A. Resistance to Christian Nationalism by State, Coded by Red, Blue, and Battleground States in the 2024 Election
The following table is sorted in descending order by the proportion of residents in each state who identify as Christian nationalism Rejecters or Skeptics. Additionally, rows are coded blue for Democratic states, red for Republican states, and tan for 2024 battleground states. As the pattern demonstrates, the proportion of Christian nationalism Rejecters and Skeptics in each state is strongly correlated with the state’s partisan tilt.

Appendix B. Survey Methodology
The survey was designed and conducted by PRRI. The survey was made possible through the generous support of the Wilbur & Hilda Glenn Family Foundation, the William and Flora Hewlett Foundation, and the Unitarian Universalist Veatch Program at Shelter Rock. The survey was carried out among a random representative sample of 22
Respondents are recruited to the KnowledgePanel using an addressed-based sampling methodology from the Delivery Sequence File of the USPS – a database with full coverage of all delivery addresses in the U.S. As such, it covers all households regardless of their phone status, providing a representative online sample. Unlike opt-in panels, households are not permitted to “self-select” into the panel; and are generally limited to how many surveys they can take within a given time period.
The initial sample drawn from the KnowledgePanel was adjusted using pre-stratification weights so that it approximates the adult U.S. population defined by the 2024 March Supplement of the Current Population Survey (CPS), except language proficiency, which is not available from CPS, were obtained from the 2023

To reduce the effects of any non-response bias, a post-stratification adjustment was applied based on demographic distributions from the CPS, plus language proficiency from the ACS and party affiliation from Pew’s National Public Opinion Reference Survey (NPORS). The post-stratification weight rebalanced the sample based on the following benchmarks: gender, by age, by race/ethnicity, Census division, metro area by race/ethnicity, education by race/ethnicity, and income by race/ethnicity, language proficiency, party affiliation, and state population size. The sample weighting was accomplished using an iterative proportional fitting (IFP) process that simultaneously balances the distributions of all variables. Weights were trimmed to prevent individual interviews from having too much influence on the final results. In addition to an overall national weight, separate weights were computed for certain states (AZ, FL, GA, MI, MN, NC, NV, PA, TX, and WI) to ensure that the demographic characteristics of the sample closely approximate the demographic characteristics of the target populations.
These weights from the KnowledgePanel cases were then used as the benchmarks for the additional opt-in sample in a process called “calibration.” This calibration process is used to correct for inherent biases associated with nonprobability opt-in panels. The calibration methodology aims to realign respondents from nonprobability samples with respect to a multidimensional set of measures to improve their representation.
The margin of error for the national survey is +/- 0.87 percentage points at the 95% level of confidence, including the design effect for the survey of 1.7. In addition to sampling error, surveys may also be subject to error or bias due to question wording, context, and order effects. Additional details about the KnowledgePanel can be found on the Ipsos website: https://www.ipsos.com/en-us/solution/knowledgepanel
[1] For more information about how measures are constructed, please see our report: “A Christian Nation? Understanding the Threat of Christian Nationalism to American Democracy and Culture.”
[2] Because the sample size for Orthodox Christians is small (n = 93), these findings should be interpreted with caution.
[3] Data on state legislatures are from Ballotpedia.
[4] PRRI finds a strong positive Pearson correlation (r=0.77) between the proportion of Democrats in a state legislature and Christian nationalism resistance.
[5] PRRI also finds a strong positive Pearson correlation (r = 0.74) between religious diversity at the state level and scores on the Christian Nationalism Resistance Scale. We calculated the religious diversity for each state using the Religious Diversity Index, a variant of the Herfindahl-Hirschman Index, a widely used measure of diversity among human and biological populations. See “The Herfindahl-Hirschman Index: A Concentration Measure Taking the Consumer’s Point of View,” Charles R. Laine, The Antitrust Bulletin, June 22, 1995. For this report, the Religious Diversity Index is based on nine overall religious categories: Protestants, Catholics, Orthodox, Jewish Americans, Muslims, Buddhists, Hindus, unaffiliated, and other religions. For more information about religious diversity at the county level see, our report “2023 PRRI Census of American Religion: County-Level Data on Religious Identity and Diversity.”