
View the Press Release | View as a PDF.
Executive Summary
Despite media stories to the contrary, religious affiliation among Americans has changed little in the past year.
- In 2025, the percentages of Americans who identify as white evangelical Protestants (13%), white mainline/non-evangelical Protestants (13%), and white Catholics (12%) remain unchanged from 2024.
- Fewer than 1% of Americans identify as Orthodox Christian in 2025 — similar to the 2024 rate.
- The percentages of Christians of color and members of non-Christian religions, including Judaism, Islam, Hinduism, Buddhism, Unitarian Universalists, and other world religions, show little change in the past year, and have remained largely consistent since 2013.
- After years of consistent growth, the percentage of religiously unaffiliated in America has plateaued: In 2025, 28% of Americans identify as having no religious tradition, similar to the previous year’s rate.
There is little evidence that Americans are returning to church in higher numbers.
- Over the past decade, religious service attendance has declined, with fewer Americans saying they attend religious services at least once a week and more saying they seldom or never attend religious services.
- Roughly one in four Americans attend church weekly in 2025 (26%) — a figure that remains unchanged from 2024. In 2013, 31% of Americans attended church weekly.
- The share of Americans who seldom or never attend religious services has increased substantially, rising from 42% in 2013 to 53% in 2025.
Young men (ages 18-29) have not become more religious in the past year; among young women, religious disaffiliation continues to grow.
- The percentage of young Americans who are religiously unaffiliated has remained unchanged in the past year, shifting from 38% in 2024 to 39% in 2025.
- The percentage of young men (18-29) who identify as religiously unaffiliated has largely stayed the same since 2013, with 35% identifying as a “none” in 2013 and 35% identifying as a “none” in 2025.
- In contrast, young women have steadily grown less likely to identify with a religious tradition since 2013, when 29% identified as religiously unaffiliated. In 2024, that figure grew to 40%, and in 2025, it increased to 43%. Most of that growth has resulted from a decline in religious affiliation among young women of color.
- Just one in five young men (20%) and women (21%) attended church weekly in 2025, which matched their rates of weekly church attendance in 2024. These rates of church attendance among younger Americans have remained largely unchanged since 2013.
- Younger Americans continue to be less religious than older Americans, in terms of both religious affiliation and regular church attendance.
The religious makeup of the political parties differs dramatically.
- Republicans are more likely to identify as white Christians (68%) than independents (36%) and Democrats (23%).
- Democrats are more likely to identify as Christians of color (34%) than independents (24%) and Republicans (16%).
- Democrats (8%) and independents (7%) are twice as likely as Republicans (4%) to identify with a non-Christian religion. Democrats (34%) and independents (33%) are also more likely to identify as religiously unaffiliated than Republicans (13%).
Religious Demographics Evolving: Updates and Analysis
The 2025 PRRI Census of American Religion is an annual update to the 2023 PRRI Census of American Religion, which provides reliable, comprehensive county-level estimates on religious affiliation and diversity across the United States. View the 2023 PRRI Census of American Religion county-level estimates.
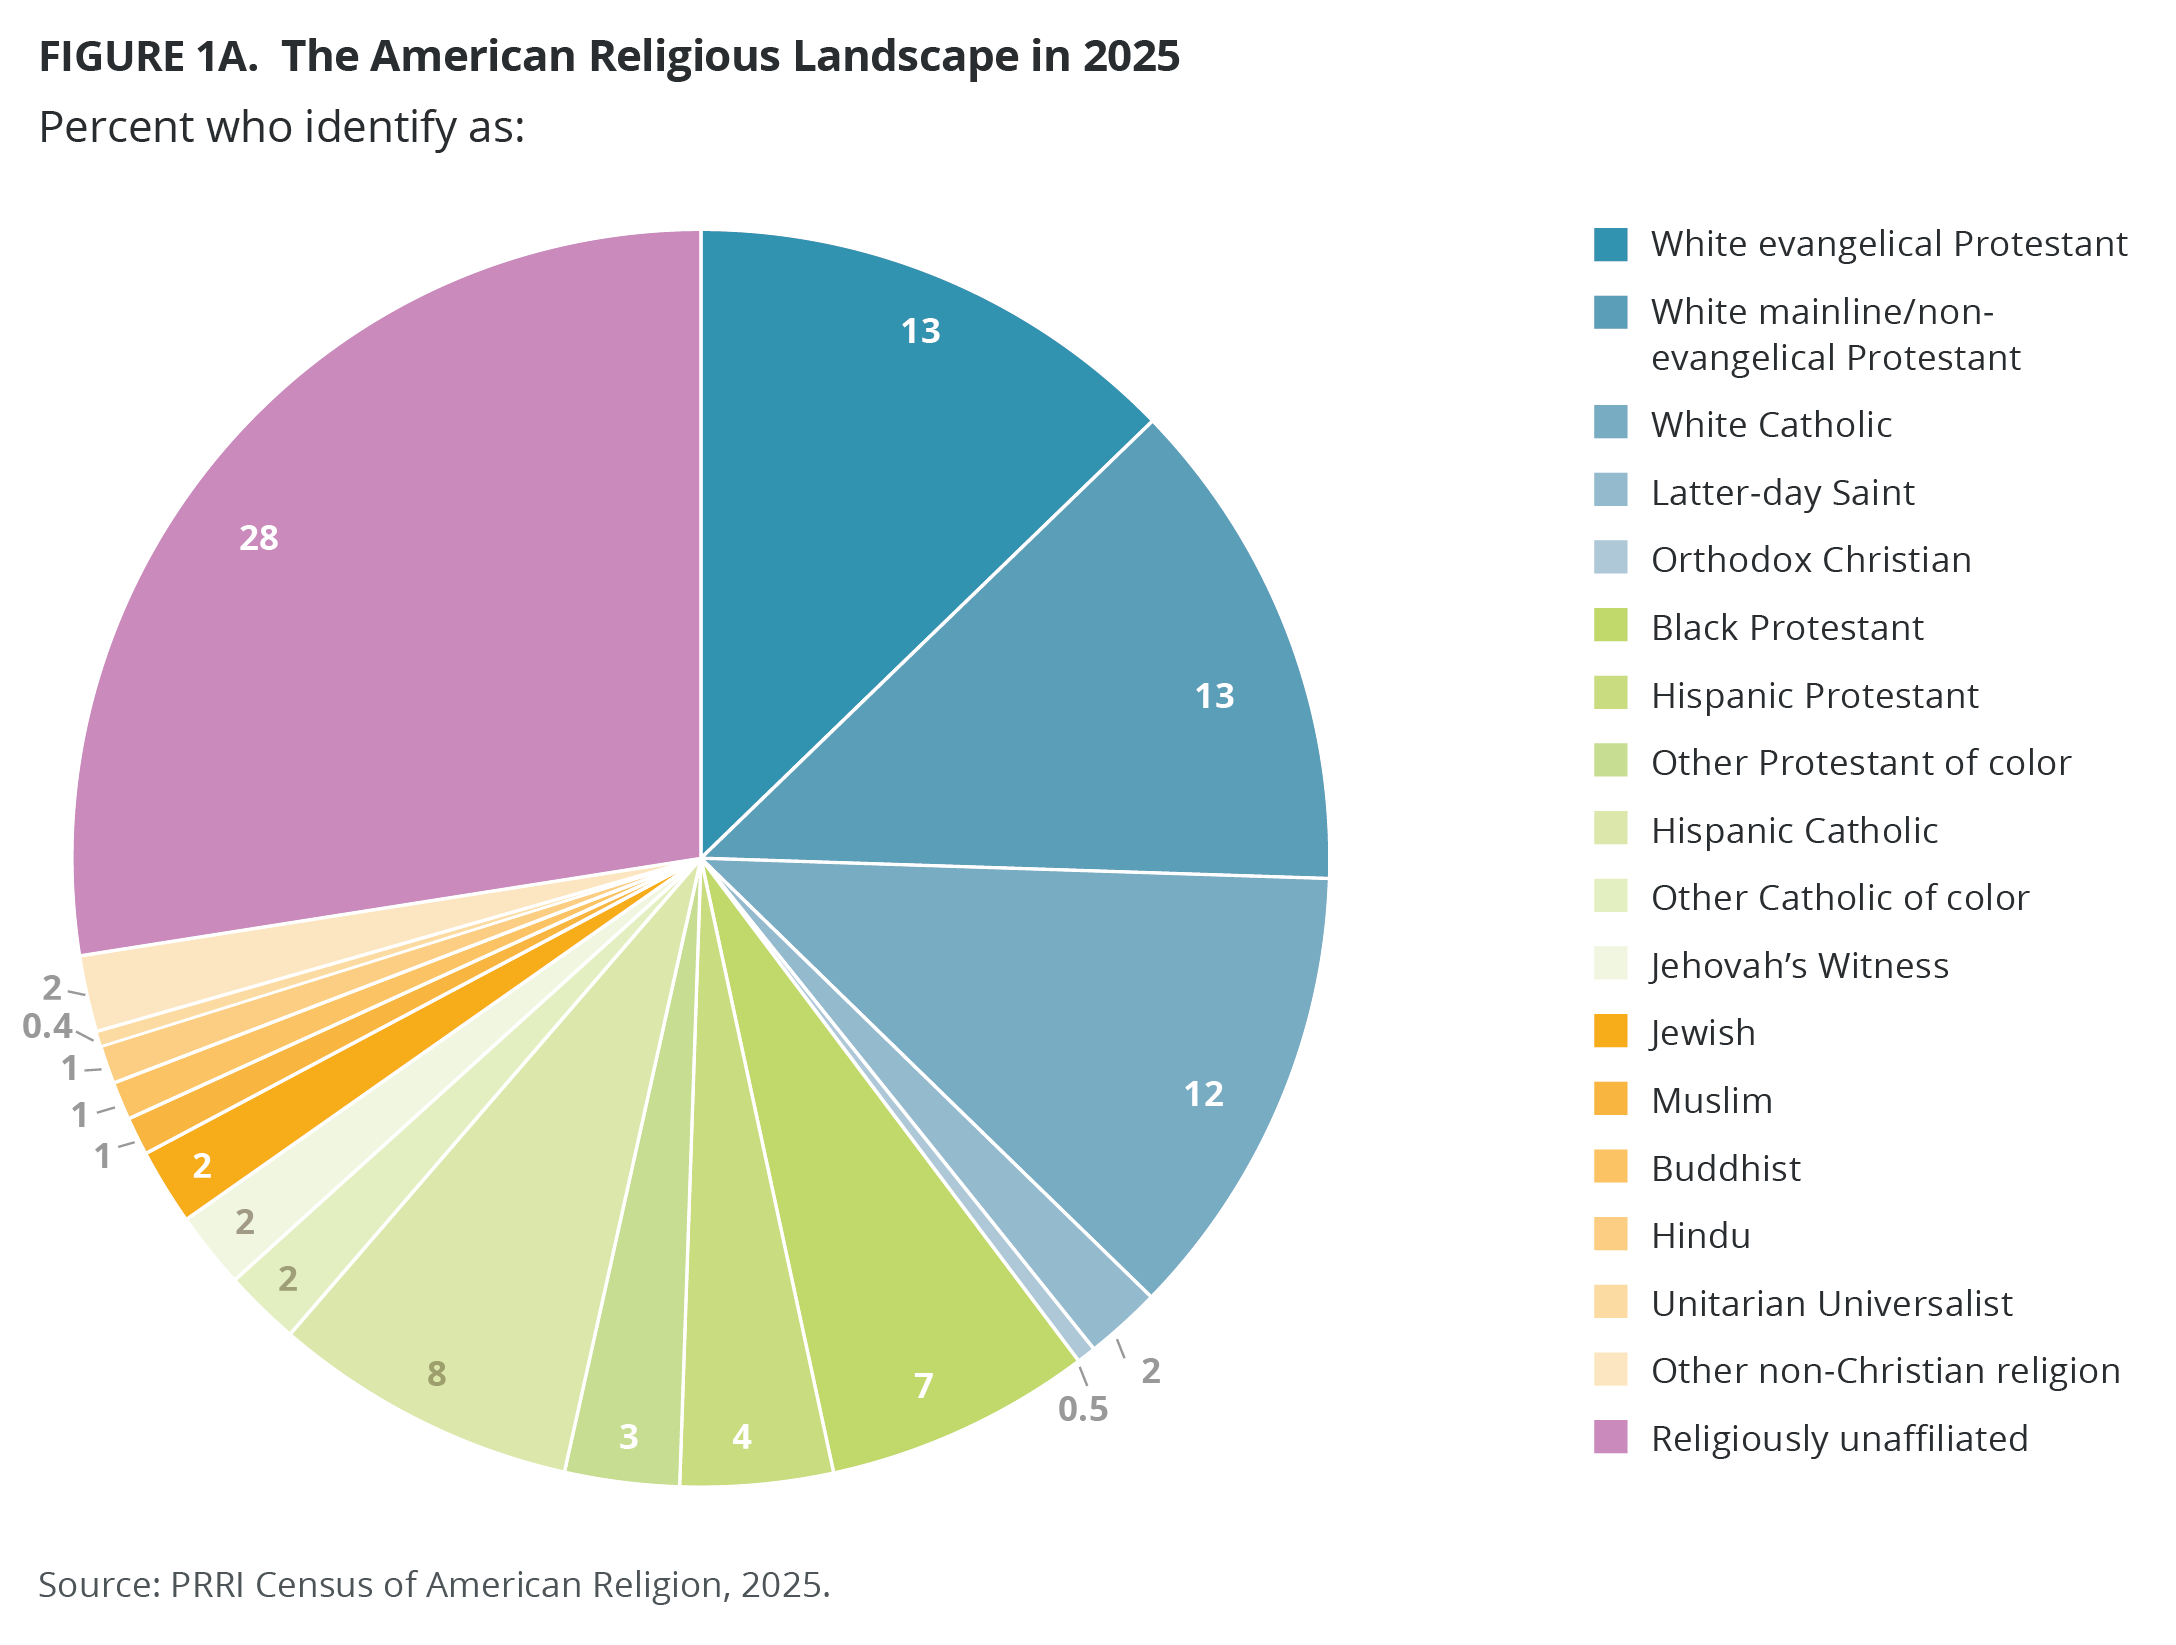
The 2025 PRRI Census of American Religion, which includes a random sample of 40,000 Americans who are part of the Ipsos KnowledgePanel, reveals that most national-level trends in American religious affiliation saw little change between 2024 and 2025. Overall, two-thirds of Americans (66%) continue to identify as Christian, including 41% who identify as white Christian and 25% who identify as Christians of color. Roughly three in ten Americans (28%) are religiously unaffiliated and 6% identify with a non-Christian religion. These percentages closely mirror those from 2024.
The American Religious Landscape Since 2013
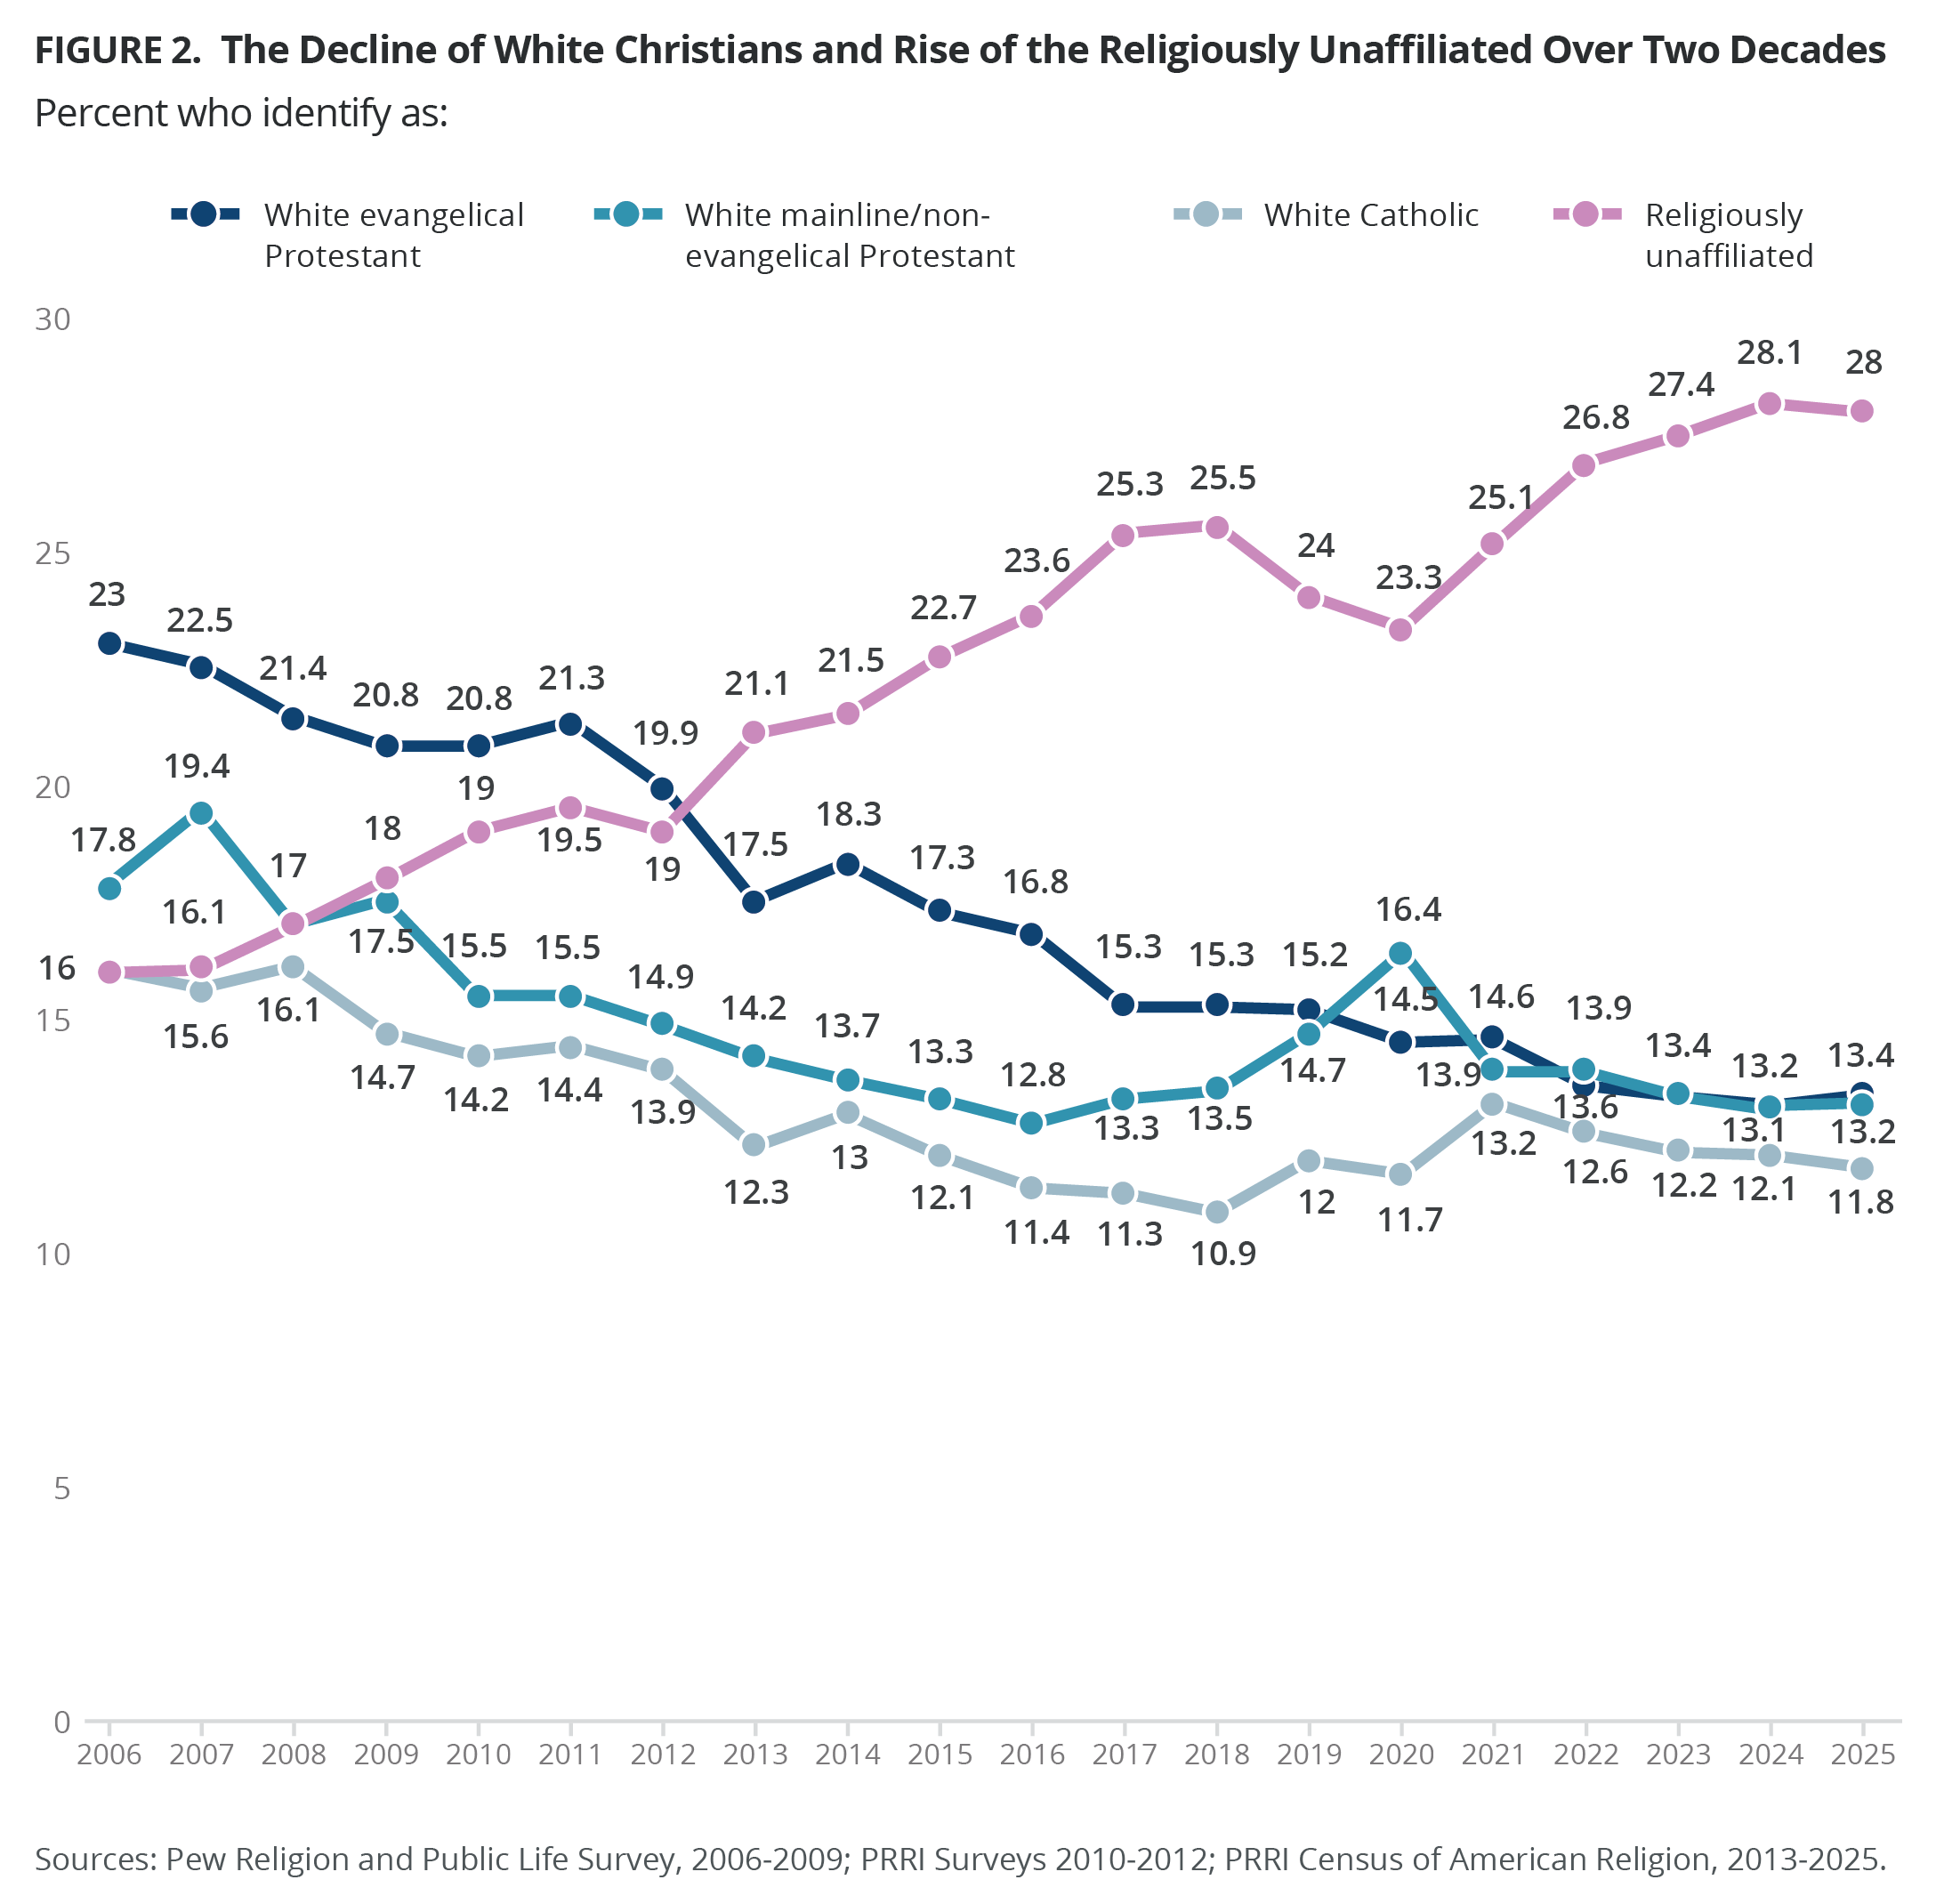
Though the percentage of white Christians has remained stable since 2023, this group has seen a gradual decrease from 46% in 2013. In contrast, the percentage of religiously unaffiliated Americans has steadily increased, rising from 21% in 2013 to 28% in 2025. Notably, after steady growth among the religiously unaffiliated through 2024, their presence has plateaued in 2025.
Christians of color and members of non-Christian religions, including Judaism, Islam, Hinduism, Buddhism, Unitarian Universalists, and other world religions, have remained consistent since 2013, showing no significant shifts in the past year.[1]
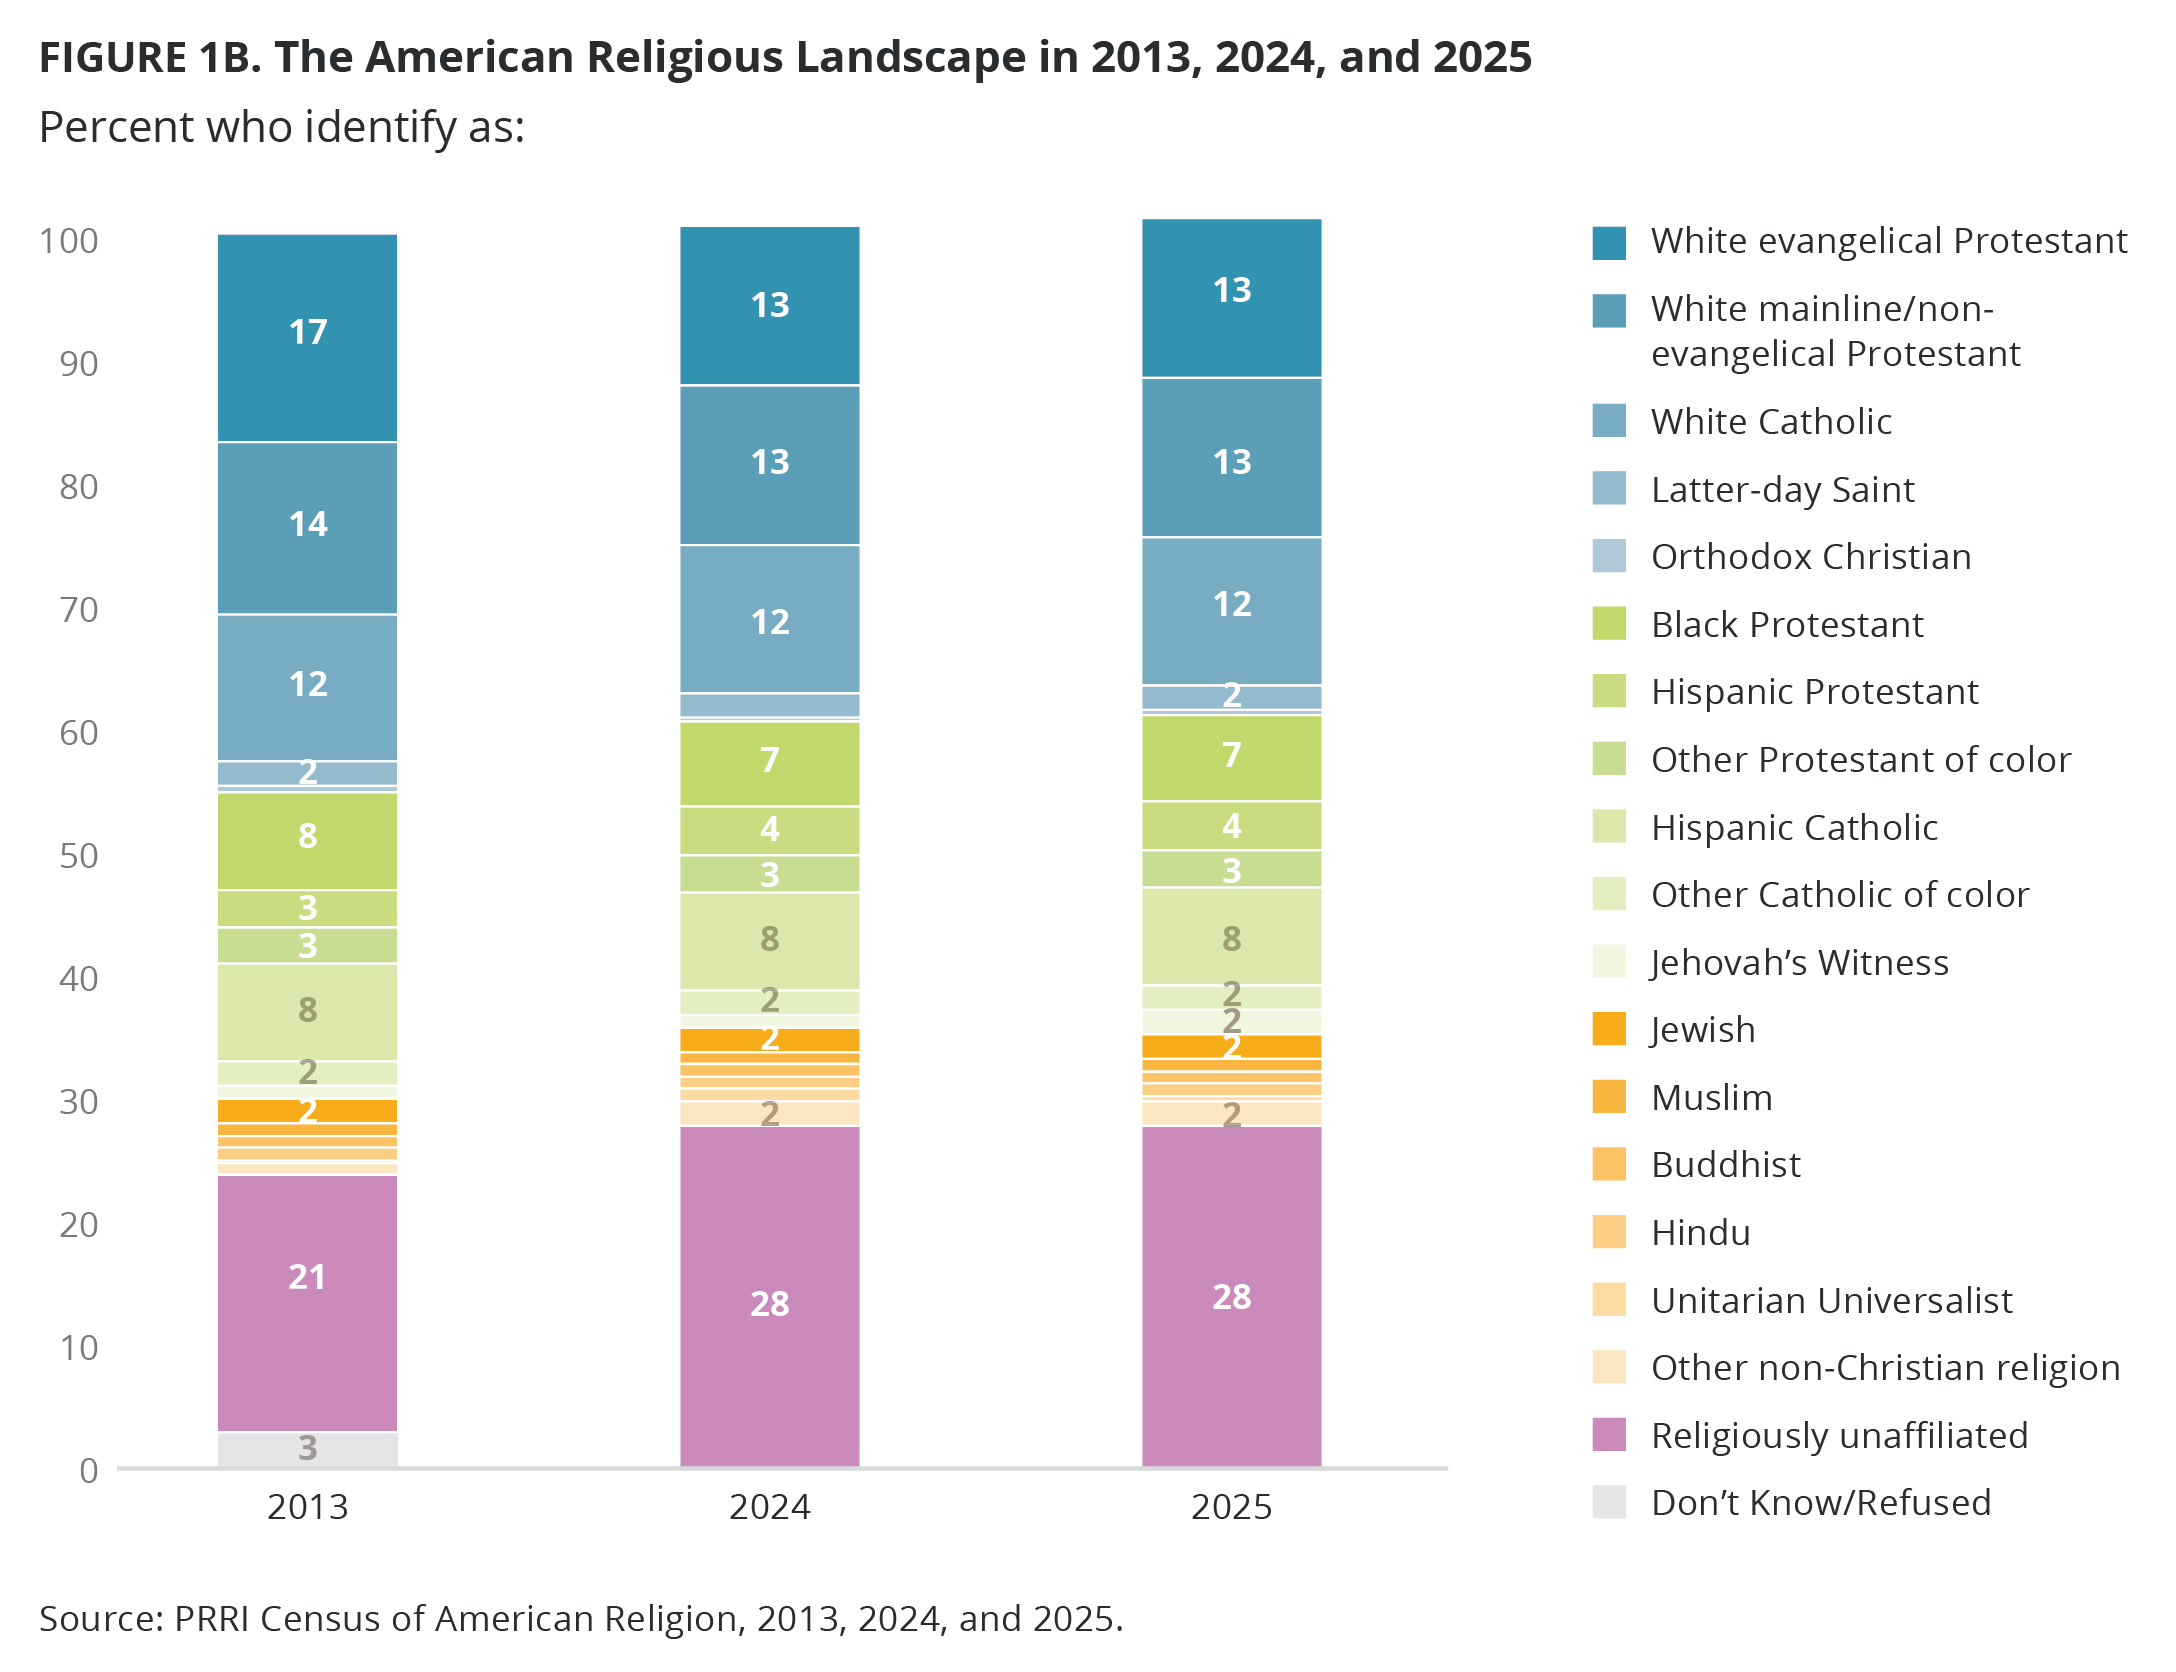
In 2025, white Christians include 13% of Americans who identify as evangelical Protestants, another 13% as mainline/non-evangelical Protestants, and 12% as Catholics, with smaller shares identifying as Latter-day Saints (2%) or Orthodox Christians (less than 1%). There is no change among those categories since 2024. Moreover, there has been little growth among Orthodox Christians (0.5% in both 2013 and 2025). Since 2013, the percentage of white evangelical Protestants has decreased by 4 percentage points from 17%. White mainline/non-evangelical Protestants and white Catholics have also gradually decreased since 2013.
Age and Religious Affiliation
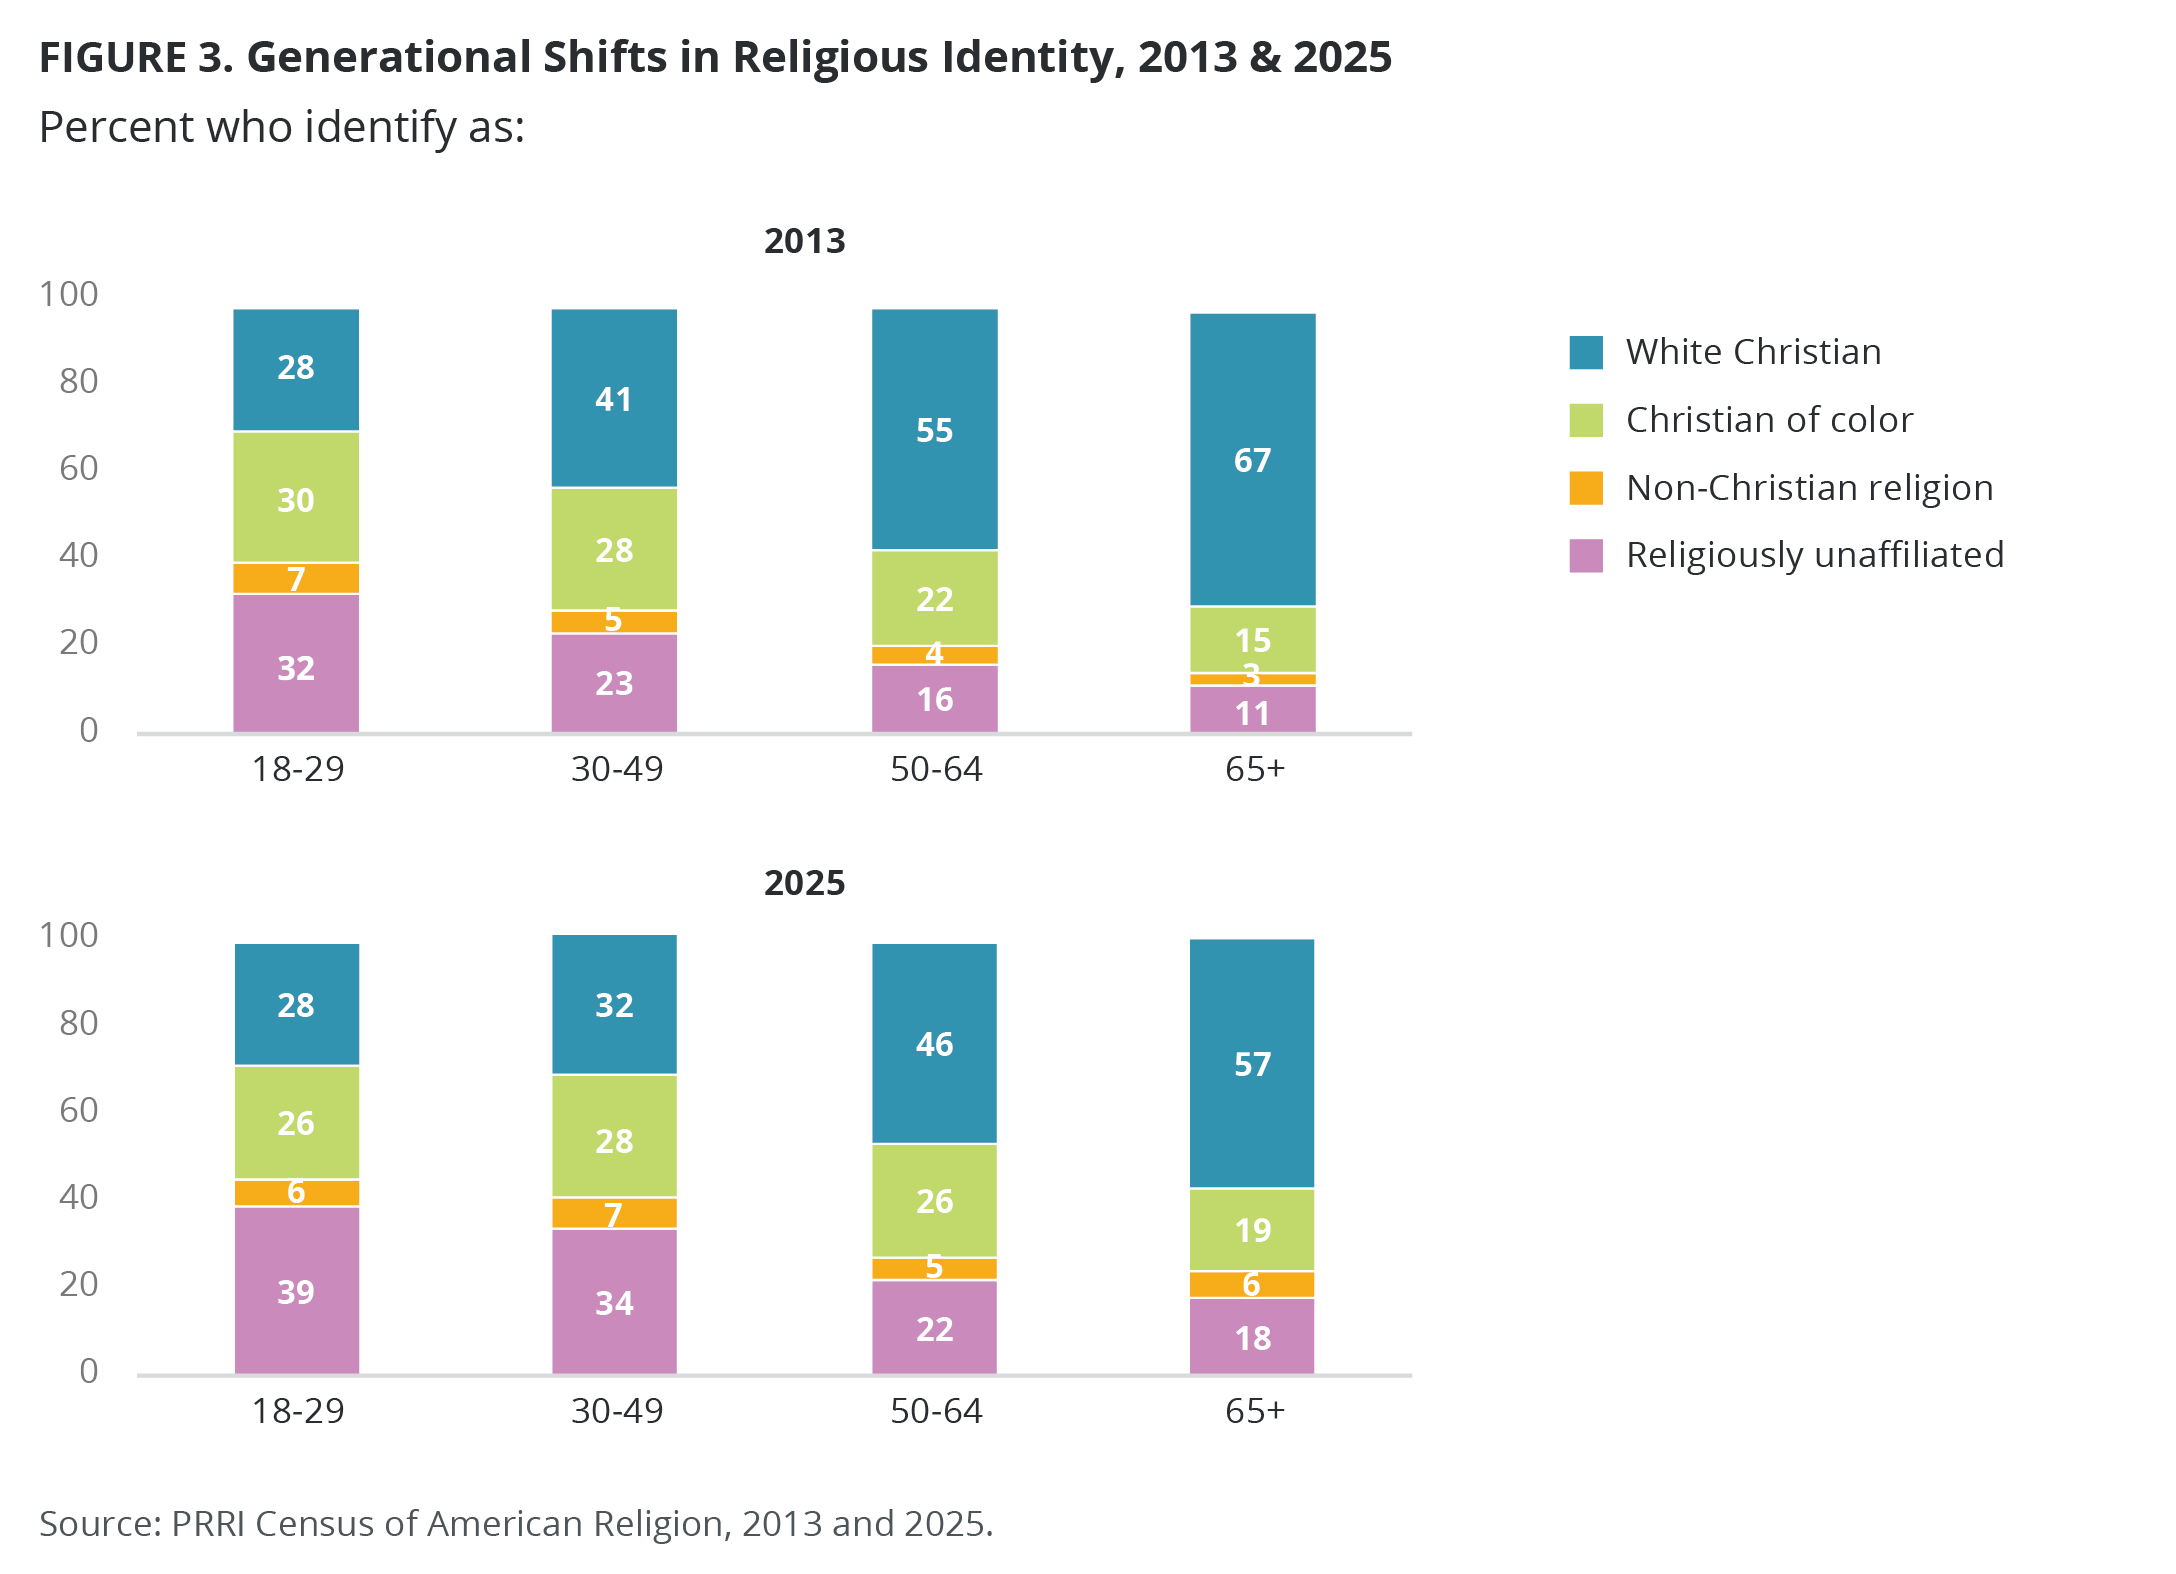
Overall, younger Americans are less likely to identify as Christian than older Americans, a trend that has held true since 2013. Around three-fourths of Americans ages 65 and older (76%) and 50-64 (72%) identify as Christian, compared with 60% of Americans 30-49 and 54% of ages 18-29. Though Christian identity has declined in each age cohort since 2013, Americans ages 30-49 have seen the largest decrease, from 69% in 2013 to 60% in 2025, followed by Americans 65 and older, from 82% to 76%; Americans 50-64, from 77% to 72%; and Americans 18-29, from 58% to 54%.
Americans 65 and older are more likely than younger age groups to identify as white Christians and less likely to identify as Christians of color: nearly six in ten Americans 65 and older (57%) identify as white Christians, compared with 46% of those ages 50-64, 32% of those ages 30-49, and 28% of those ages 18-29. In contrast, 19% of Americans 65 and older identify as Christians of color, compared with 26% of those ages 50-64, 28% of those ages 30-49, and 26% of those ages 18-29.
Not identifying with a religion is negatively correlated to age, with nearly four in ten Americans ages 18-29 identifying as religiously unaffiliated, followed by 34% of those ages 30-49, 22% of those ages 50-64, and 18% of those ages 65 and older. Since 2013, each group has seen gradual increases in unaffiliated identity, while there are little differences among age cohorts who identify with non-Christian religions.
Party Affiliation and Religious Identity
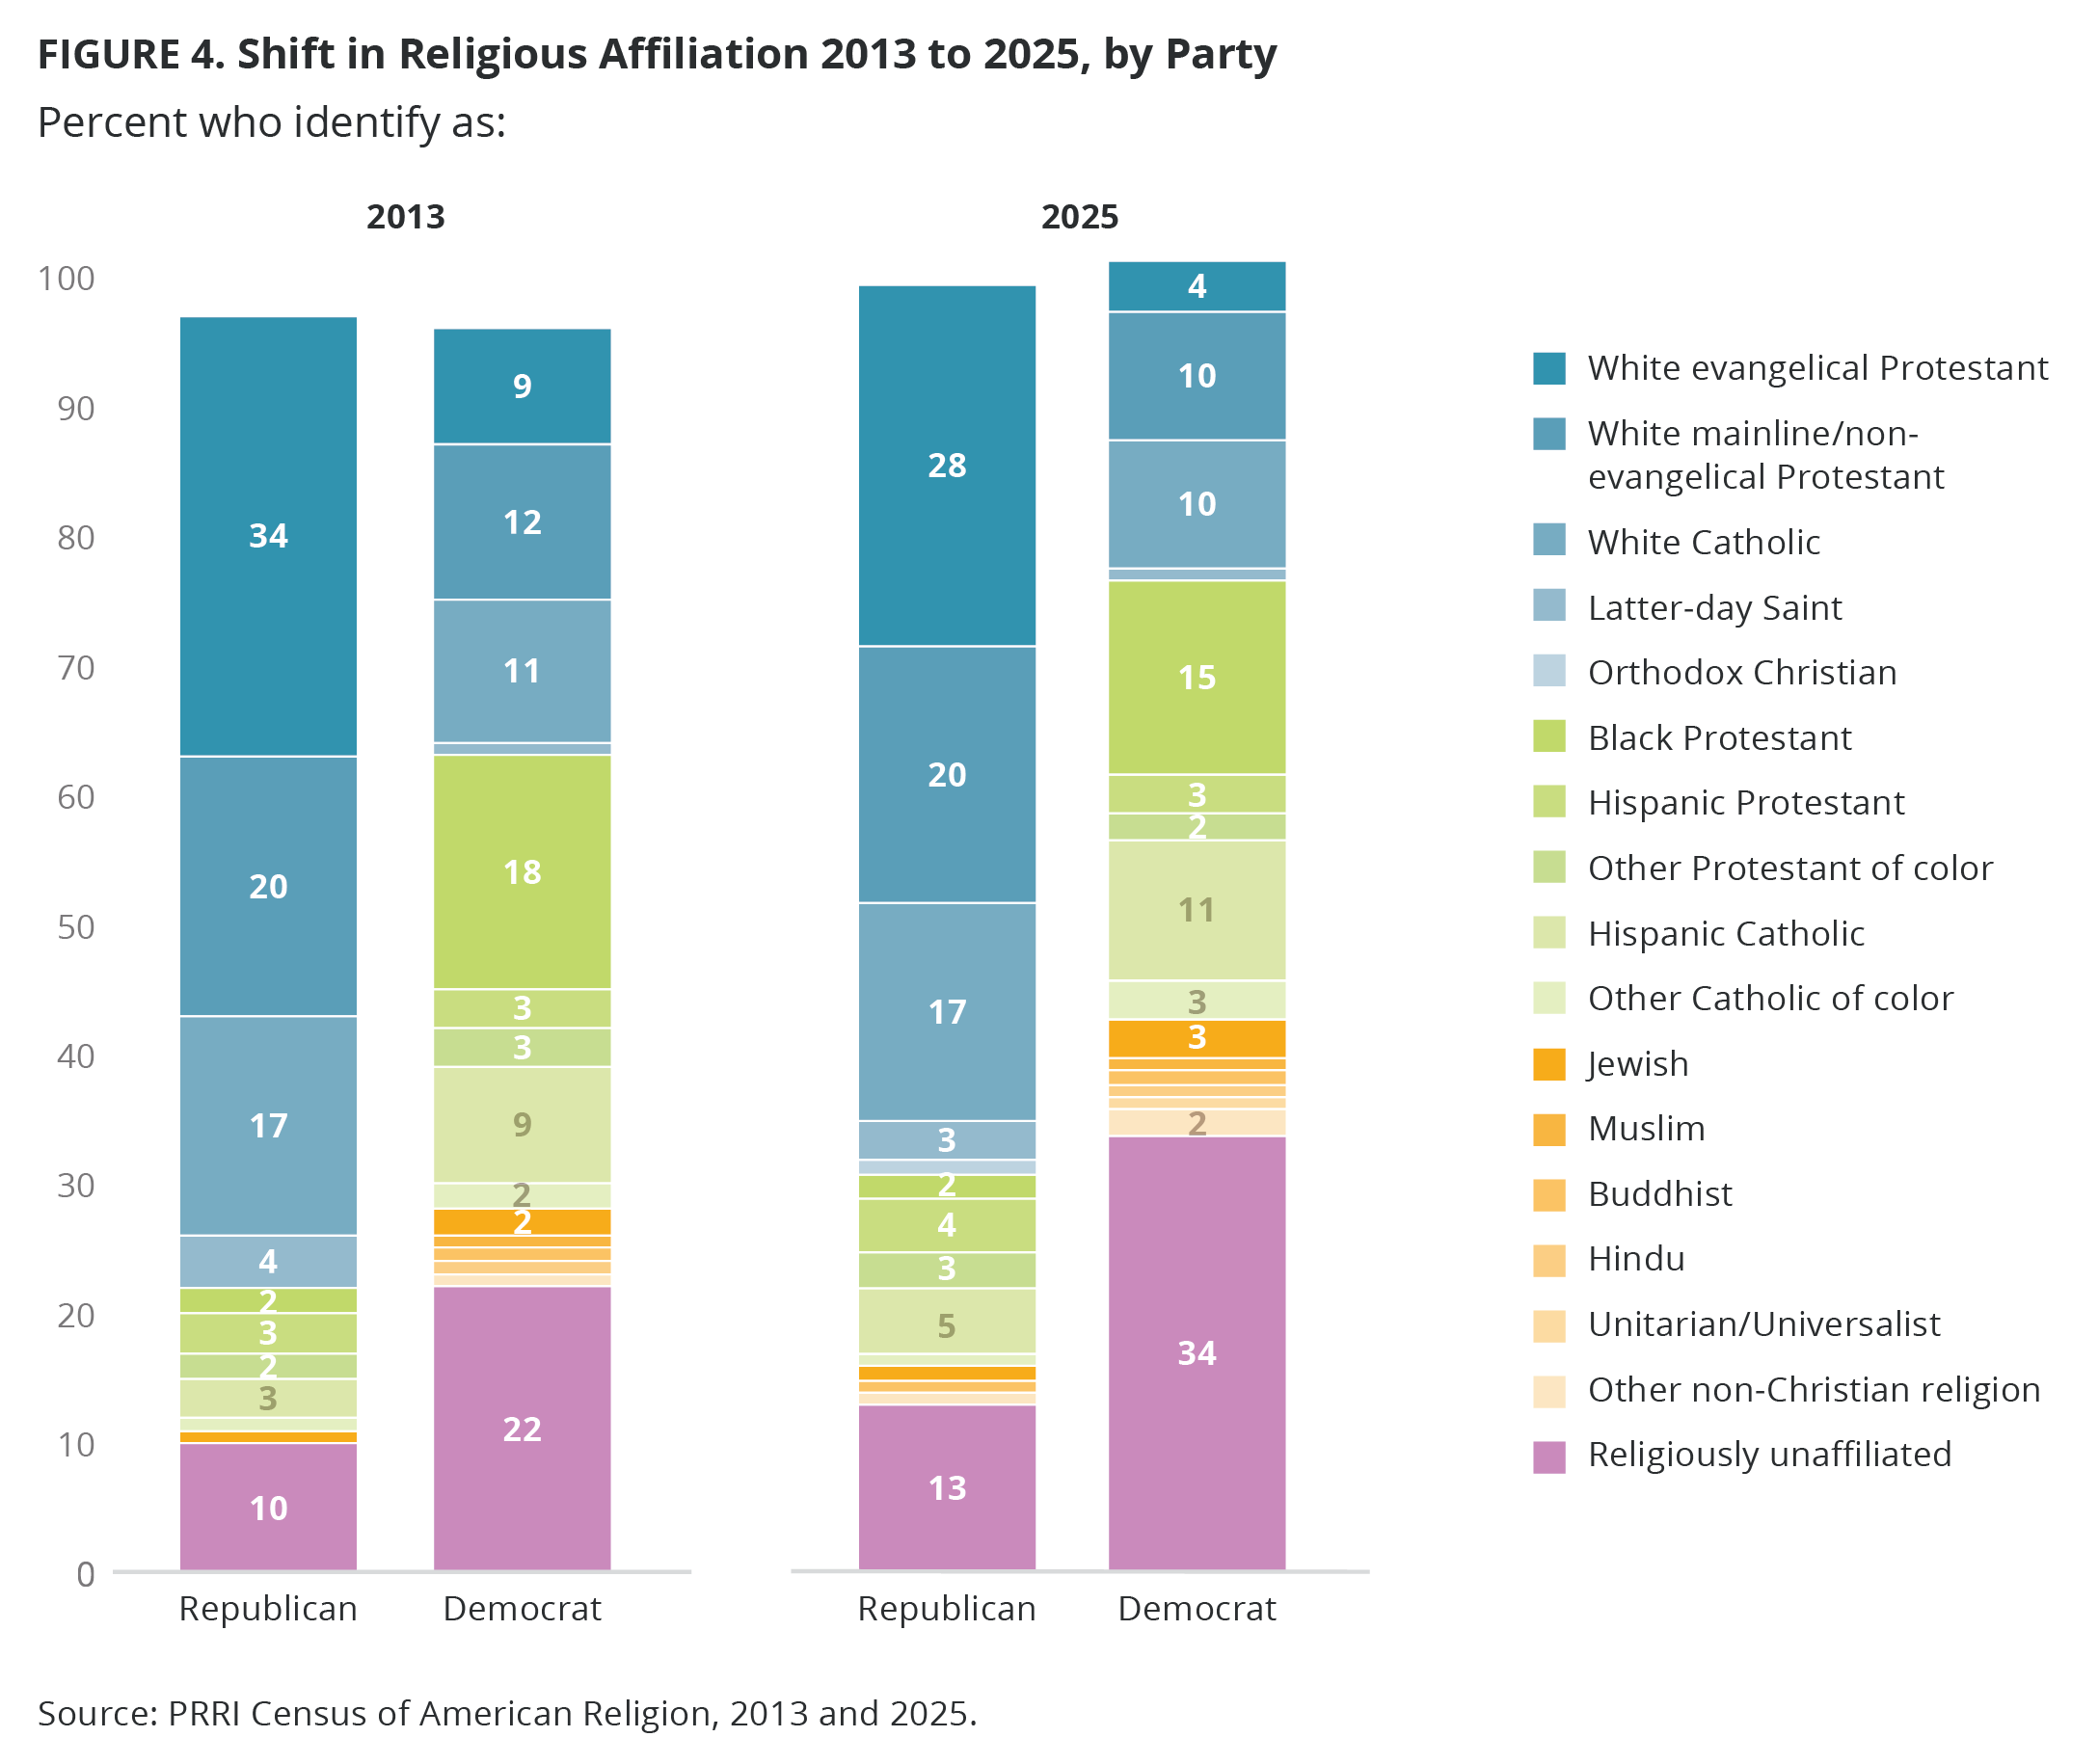
Since 2013, the share of Republicans who identify as Christians has remained consistent (86% in 2013 vs. 84% in 2025), while independents have seen a decrease from 65% to 60%. Democrats, however, have seen the largest decline, from 70% to 57% in 2025. Republicans are more likely to identify as white Christians (68%) than independents (36%) and Democrats (23%). Democrats, by contrast, are more likely to identify as Christians of color (34%) than independents (24%) and Republicans (16%).
Democrats (8%) and independents (7%) are twice as likely as Republicans (4%) to identify with a non-Christian religion. Democrats (34%) and independents (33%) are also more likely to identify as religiously unaffiliated than Republicans (13%).
Partisanship, Religious Identity, and Age
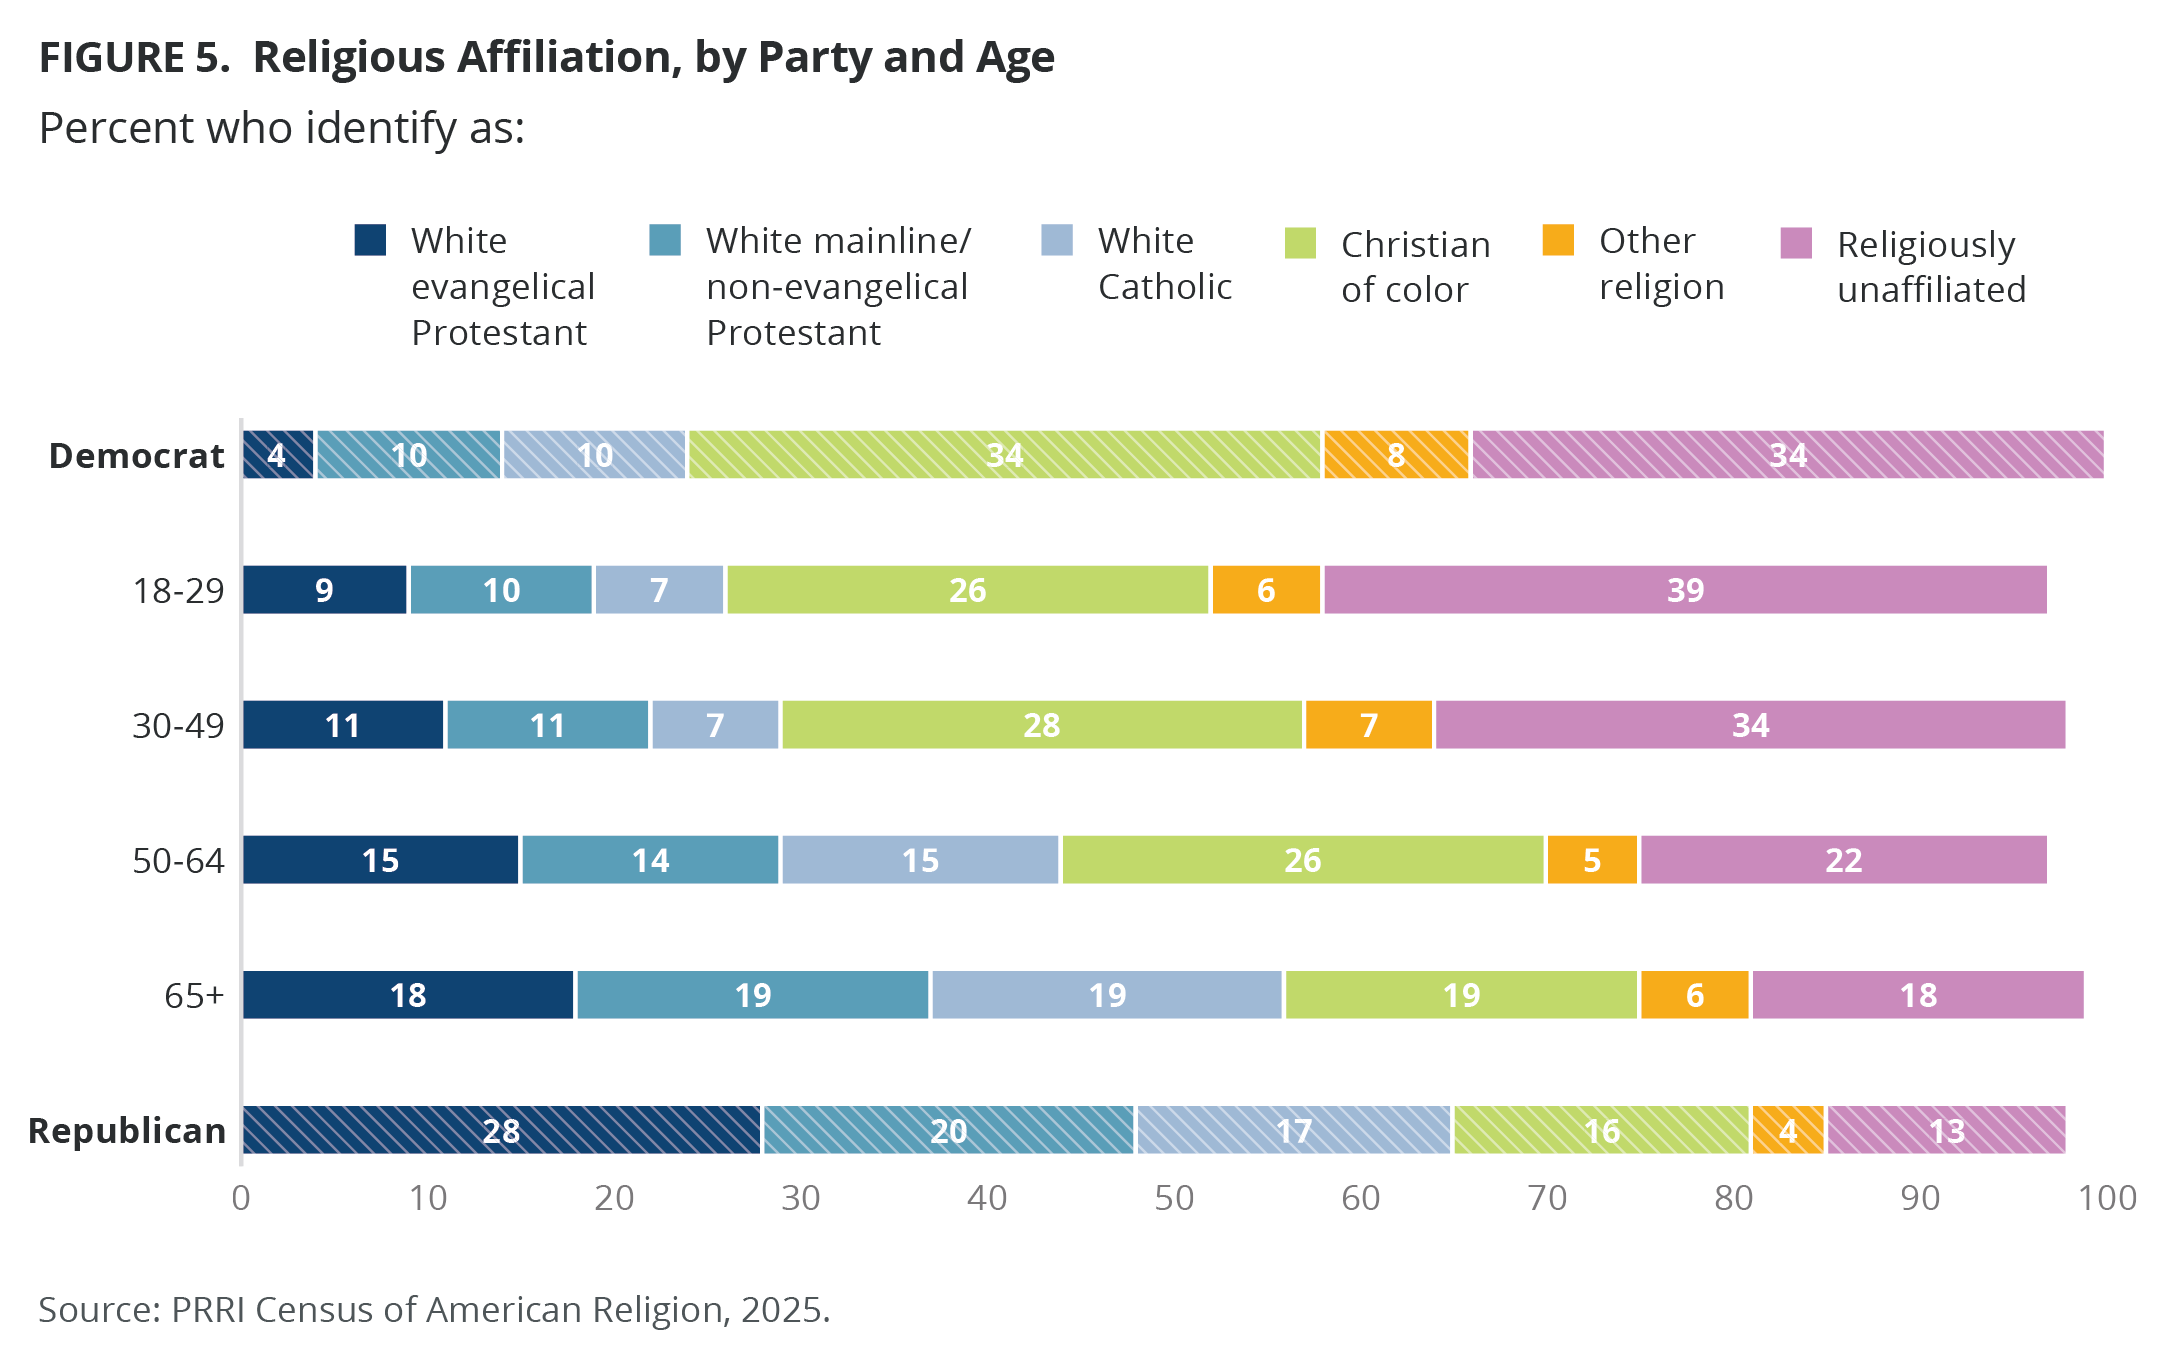
The Democratic Party’s religious composition broadly resembles that of younger Americans (ages 18-29). Among Democrats, 23% identify as white Christians, 34% as Christians of color, 8% as non-Christians, and 34% as religiously unaffiliated. A slightly higher percentage of Americans ages 18-29 also identify as white Christians (28%), followed by 26% as Christians of color, 6% as non-Christians, and 39% as religiously unaffiliated.
By contrast, the Republican Party’s religious composition more closely mirrors that of older Americans (ages 65 and older). Over two-thirds of Republicans identify as white Christians (68%), 16% as Christians of color, 4% as non-Christians, and 13% as religiously unaffiliated. The majority of senior Americans also identify as white Christians (57%), followed by 19% as Christians of color, 6% as non-Christians, and 18% as religiously unaffiliated.
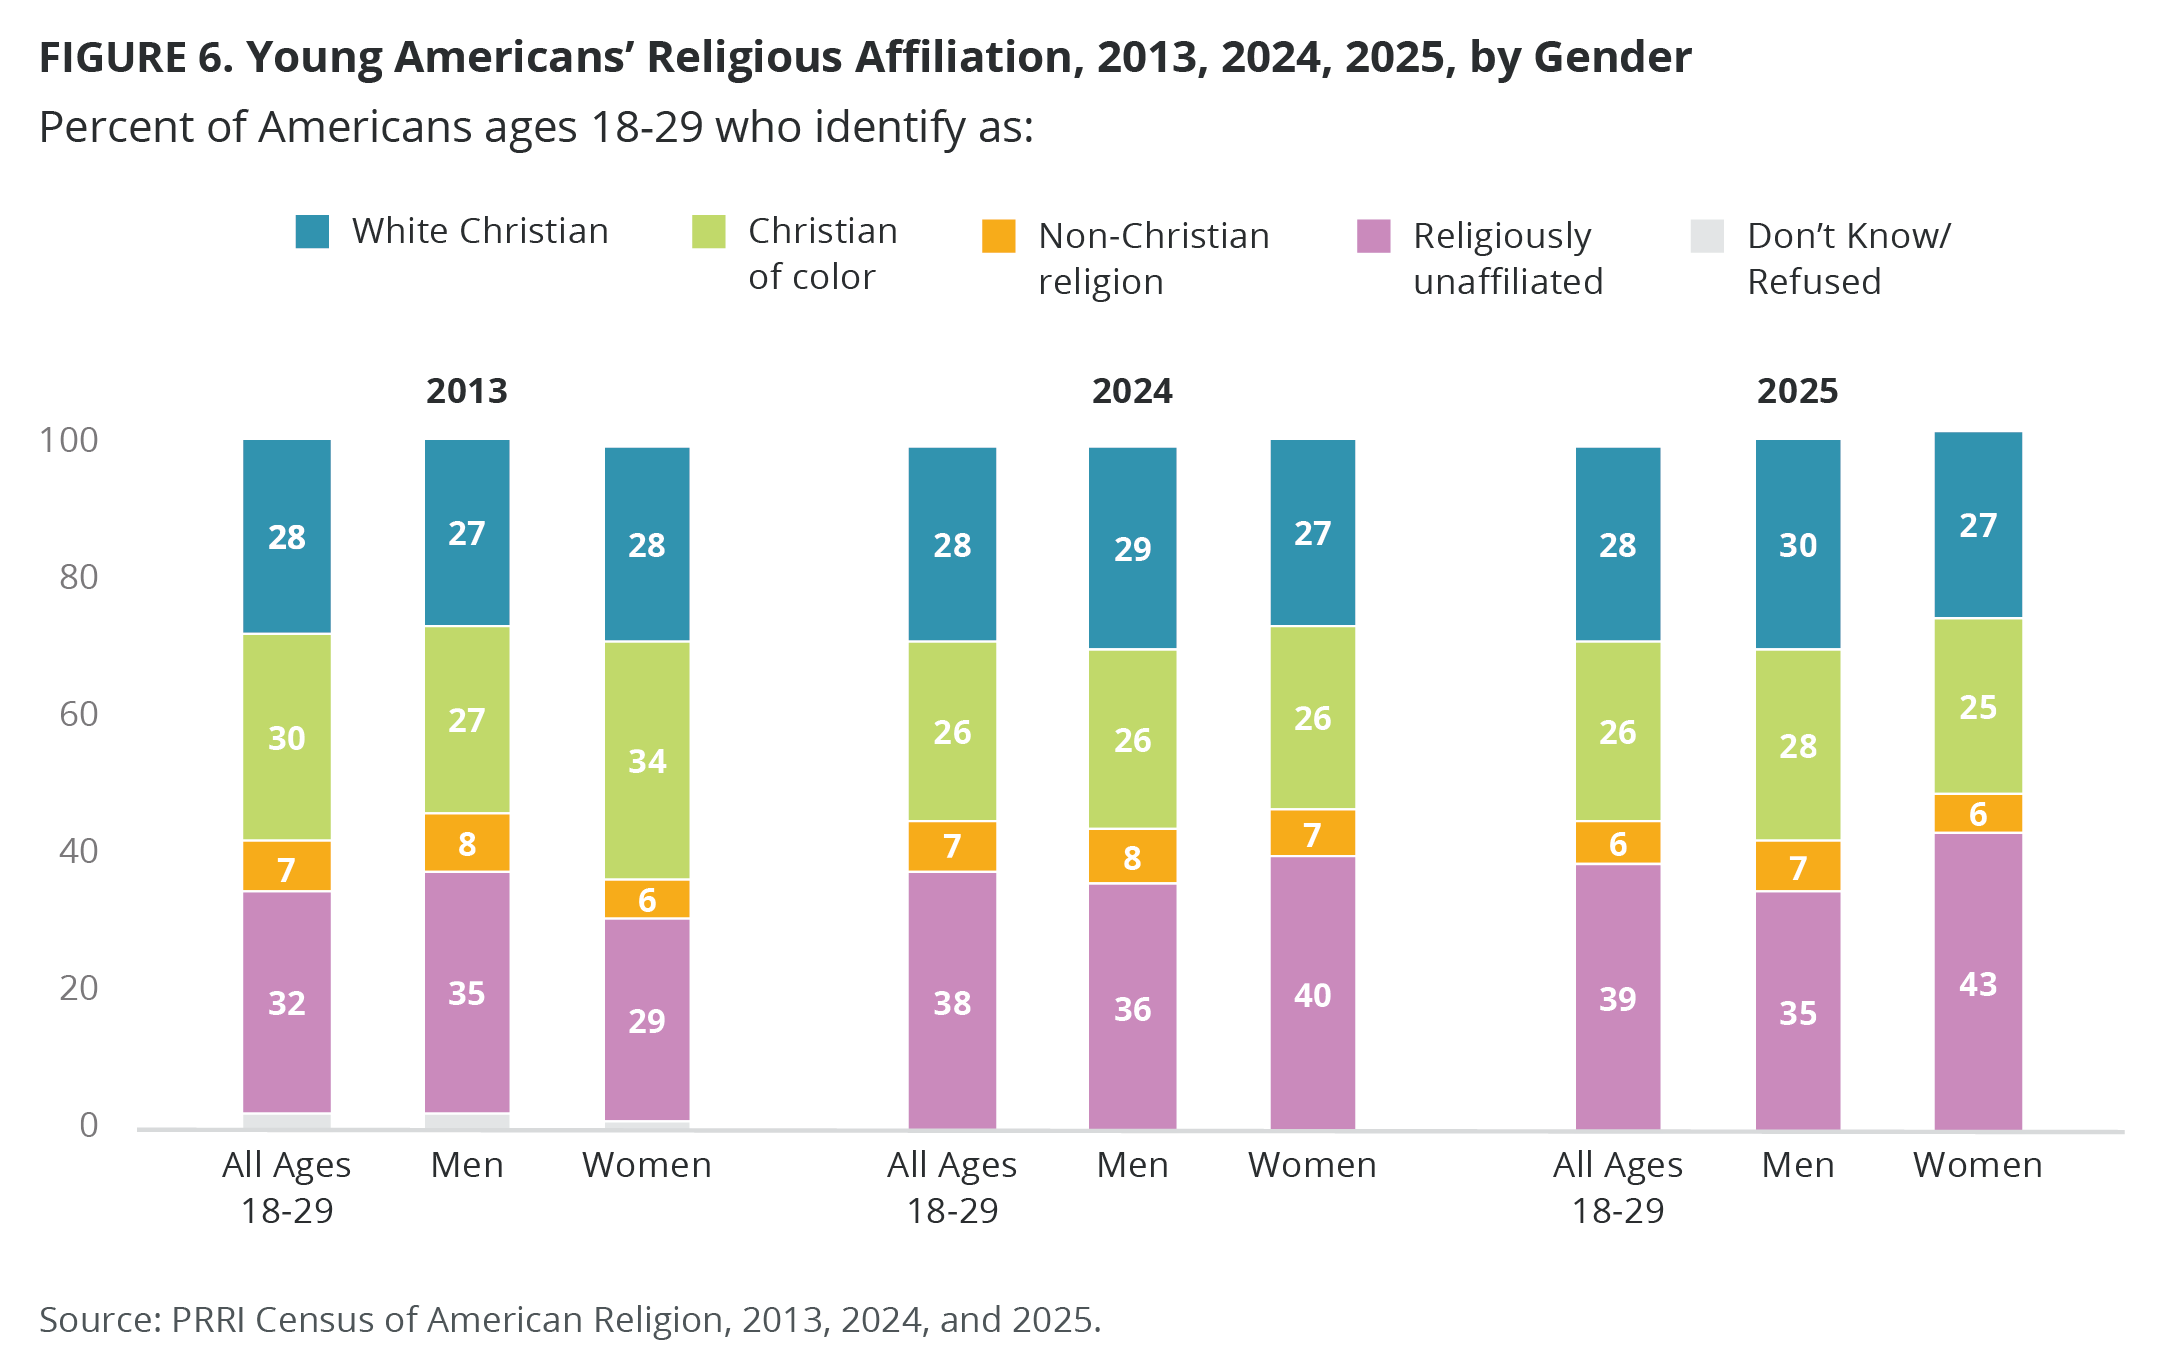
Over the past decade, the religious composition of young Americans has shifted notably, driven primarily by growth in the religiously unaffiliated (from 32% in 2013 to 38% in 2024 and 39% in 2025). This increase is especially pronounced among young women, 43% of whom identify as unaffiliated in 2025, compared with 35% of young men. By contrast, the share of young Christians of color has slightly declined, from 30% in 2013 to 26% in both 2024 and 2025, a trend driven primarily by young women. At the same time, the shares of young white Christian men and women have remained relatively stable.
LGBTQ Identity and Religious Affiliation
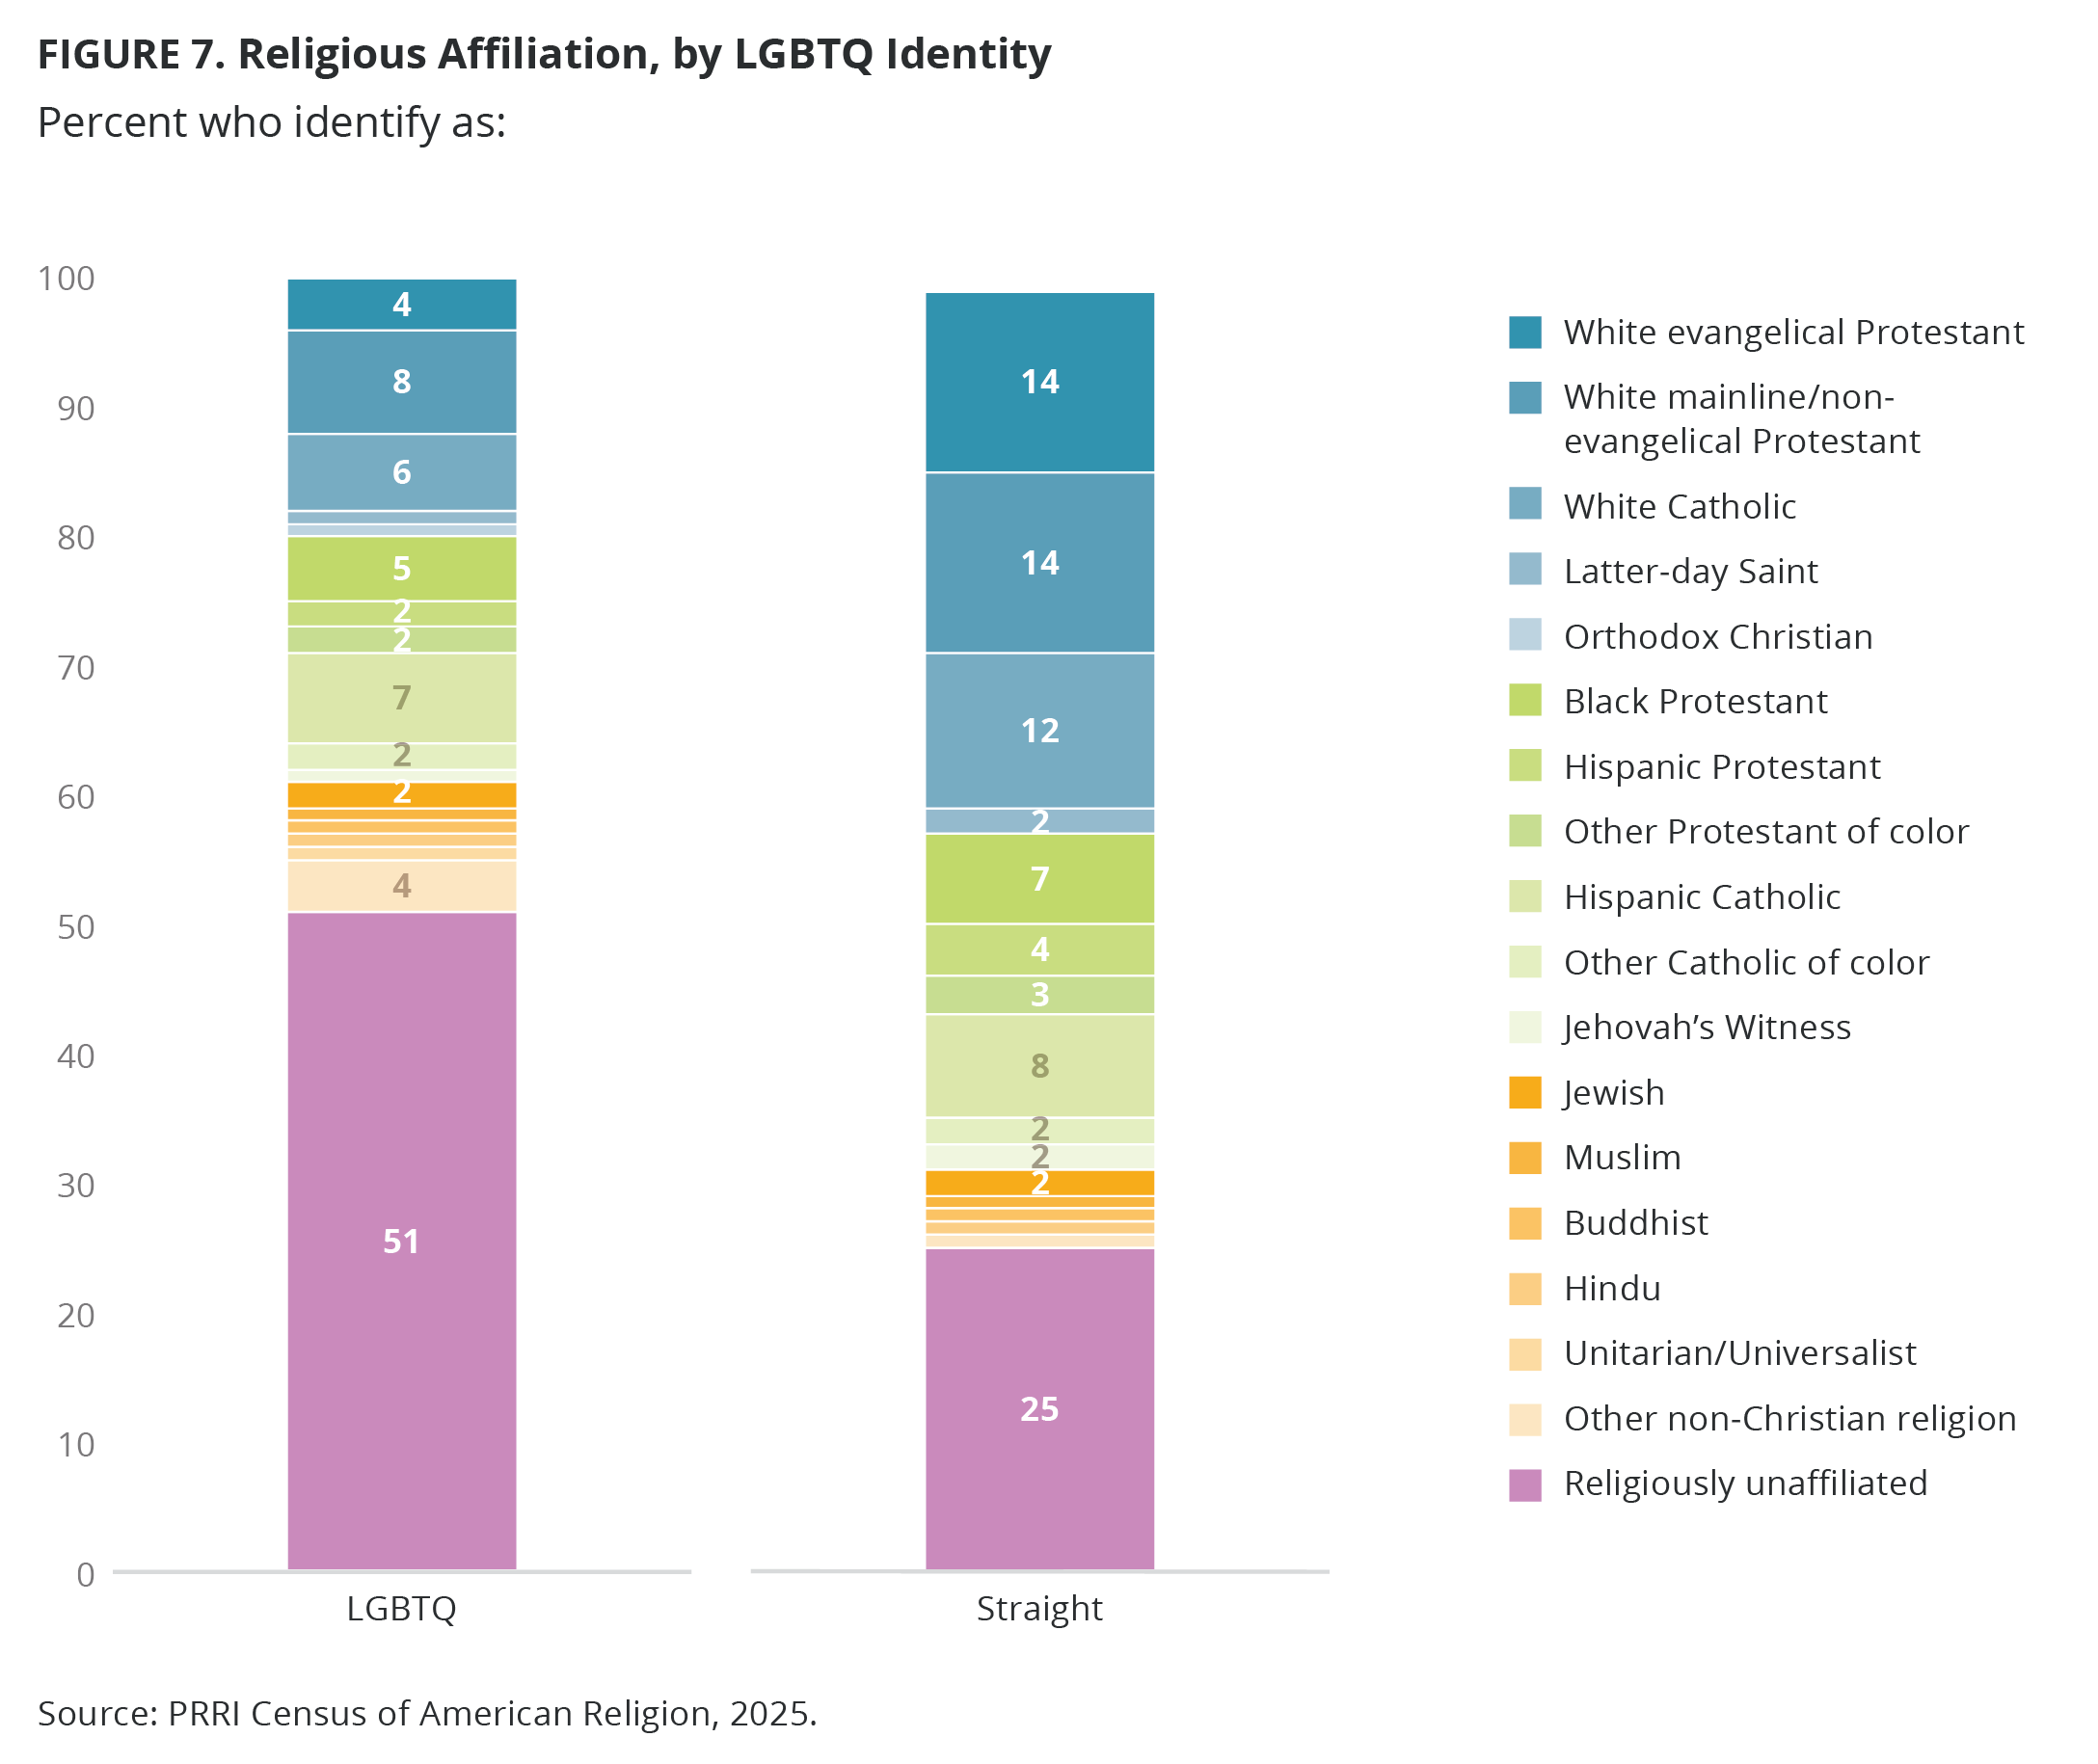
Less than four in ten LGBTQ Americans (38%) identify as Christian, compared with nearly seven in ten straight Americans (69%). Straight Americans are significantly more likely than LGBTQ Americans to identify as white Christians (43% vs. 19%) or as Christians of color (26% vs. 19%). LGBTQ Americans are twice as likely to identify as religiously unaffiliated than straight Americans (51% vs. 25%). Membership in other religious groups among both LGBTQ and straight Americans has remained consistent since 2016.
Religiosity Among Americans
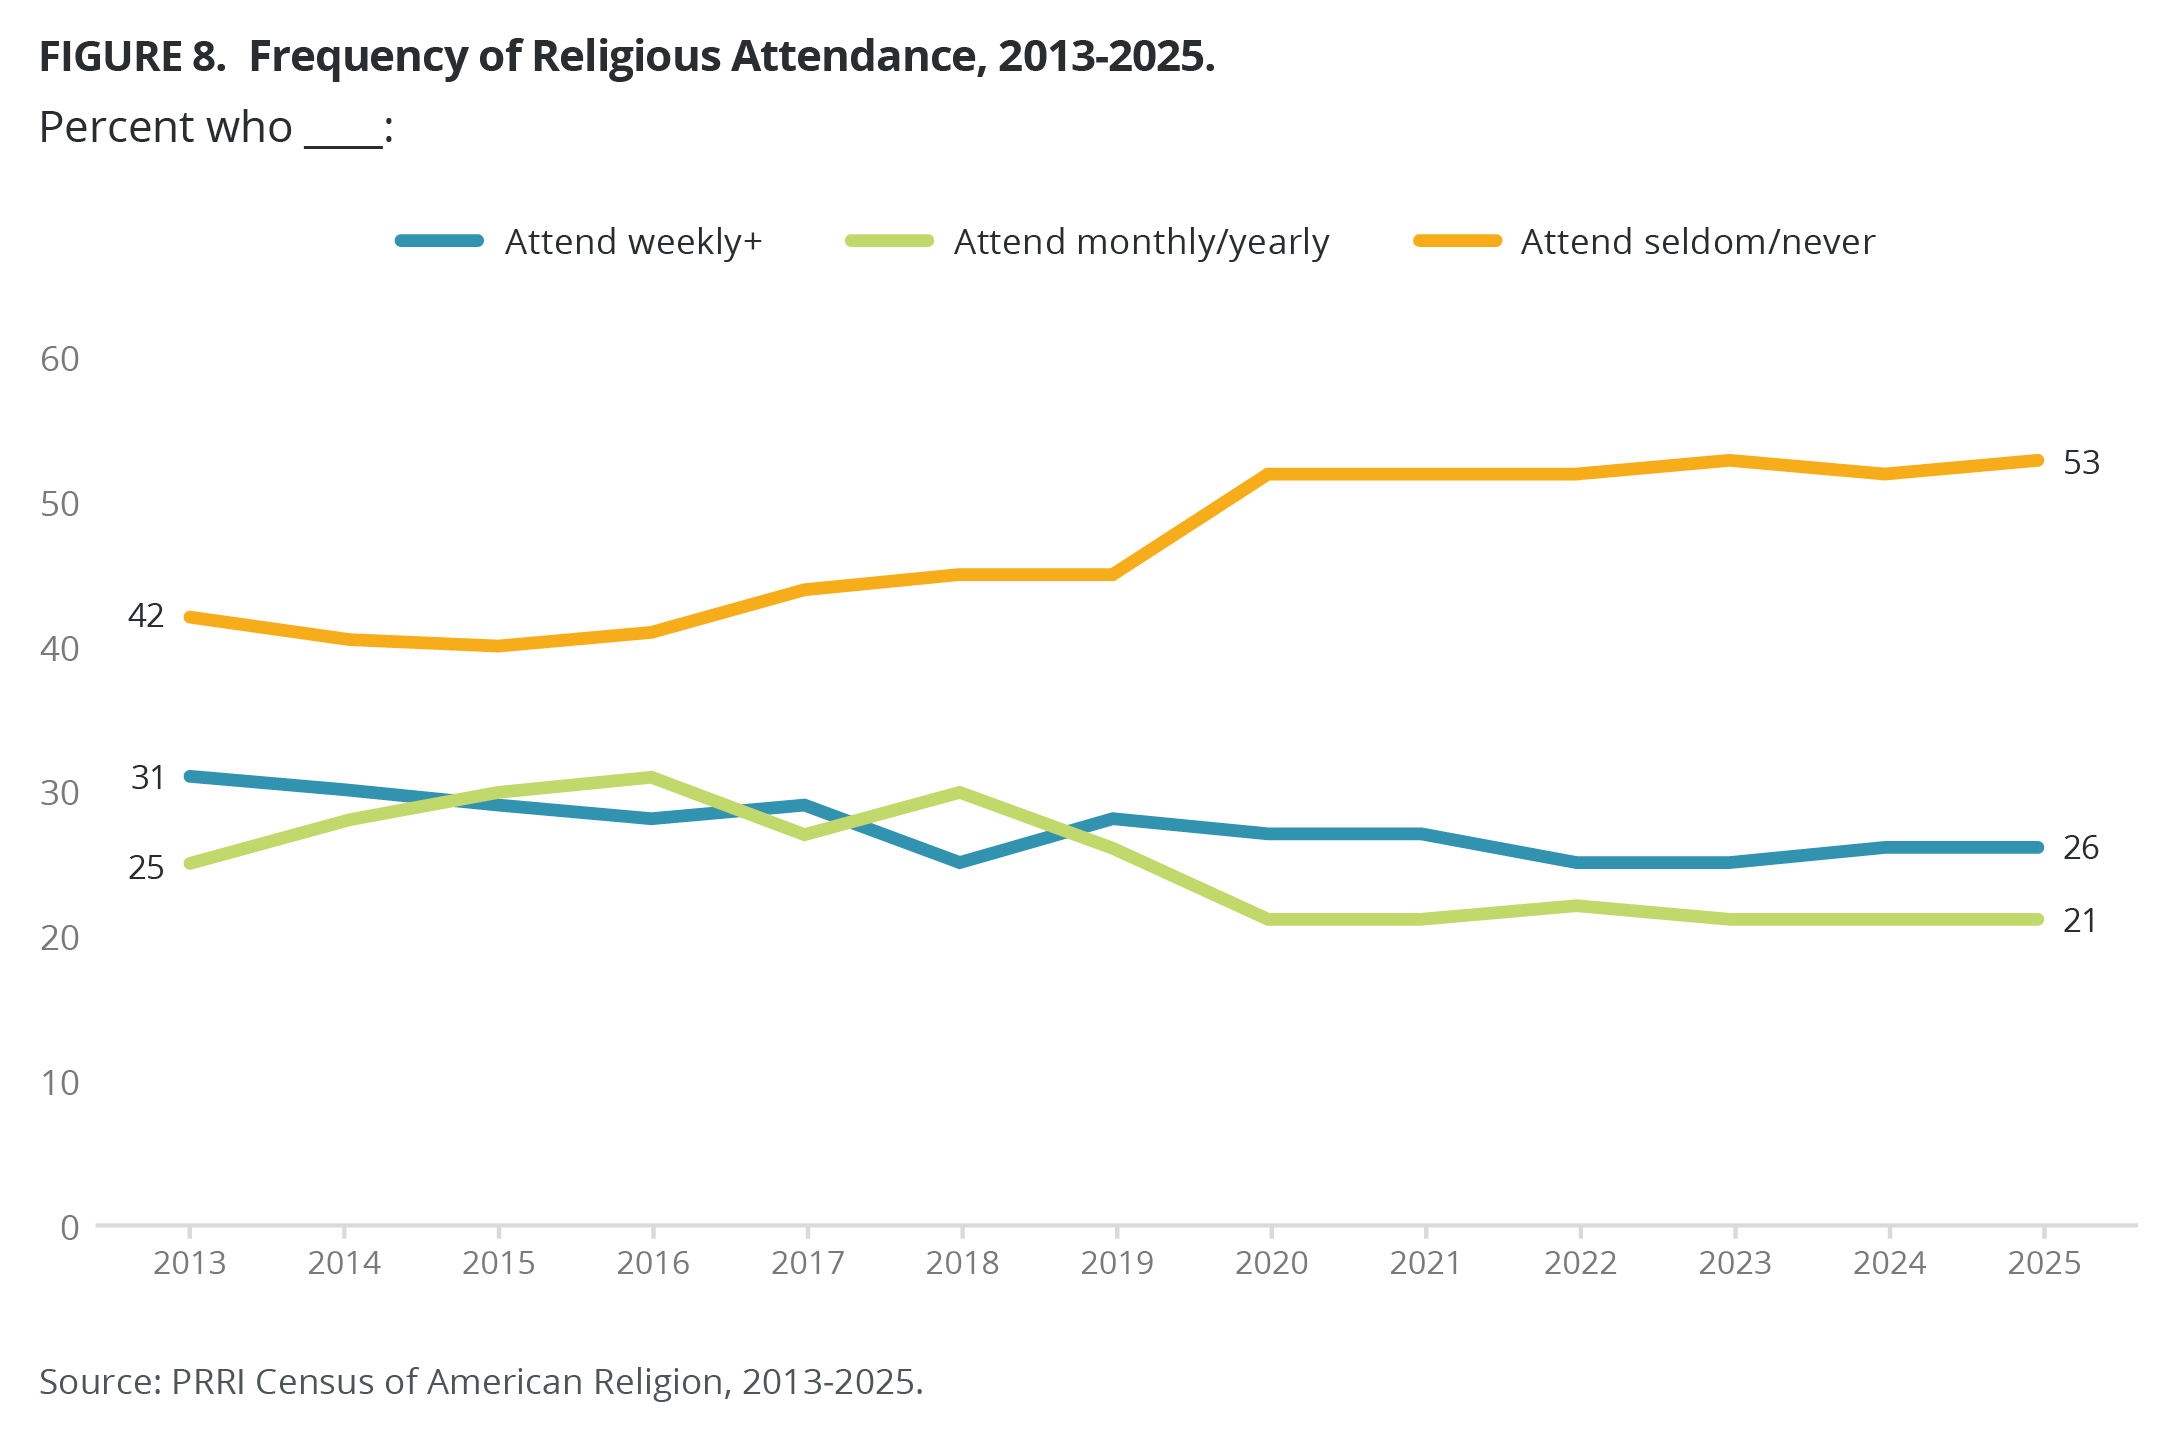
Over the past decade, religious service attendance has declined, with fewer Americans saying they attend religious services at least once a week and more saying they attend seldom or never. The share attending religious services at least weekly has consistently declined, from 31% in 2013 to 26% in 2025. In contrast, the share of Americans who seldom or never attend religious services has increased substantially, rising from 42% in 2013 to 53% in 2025.
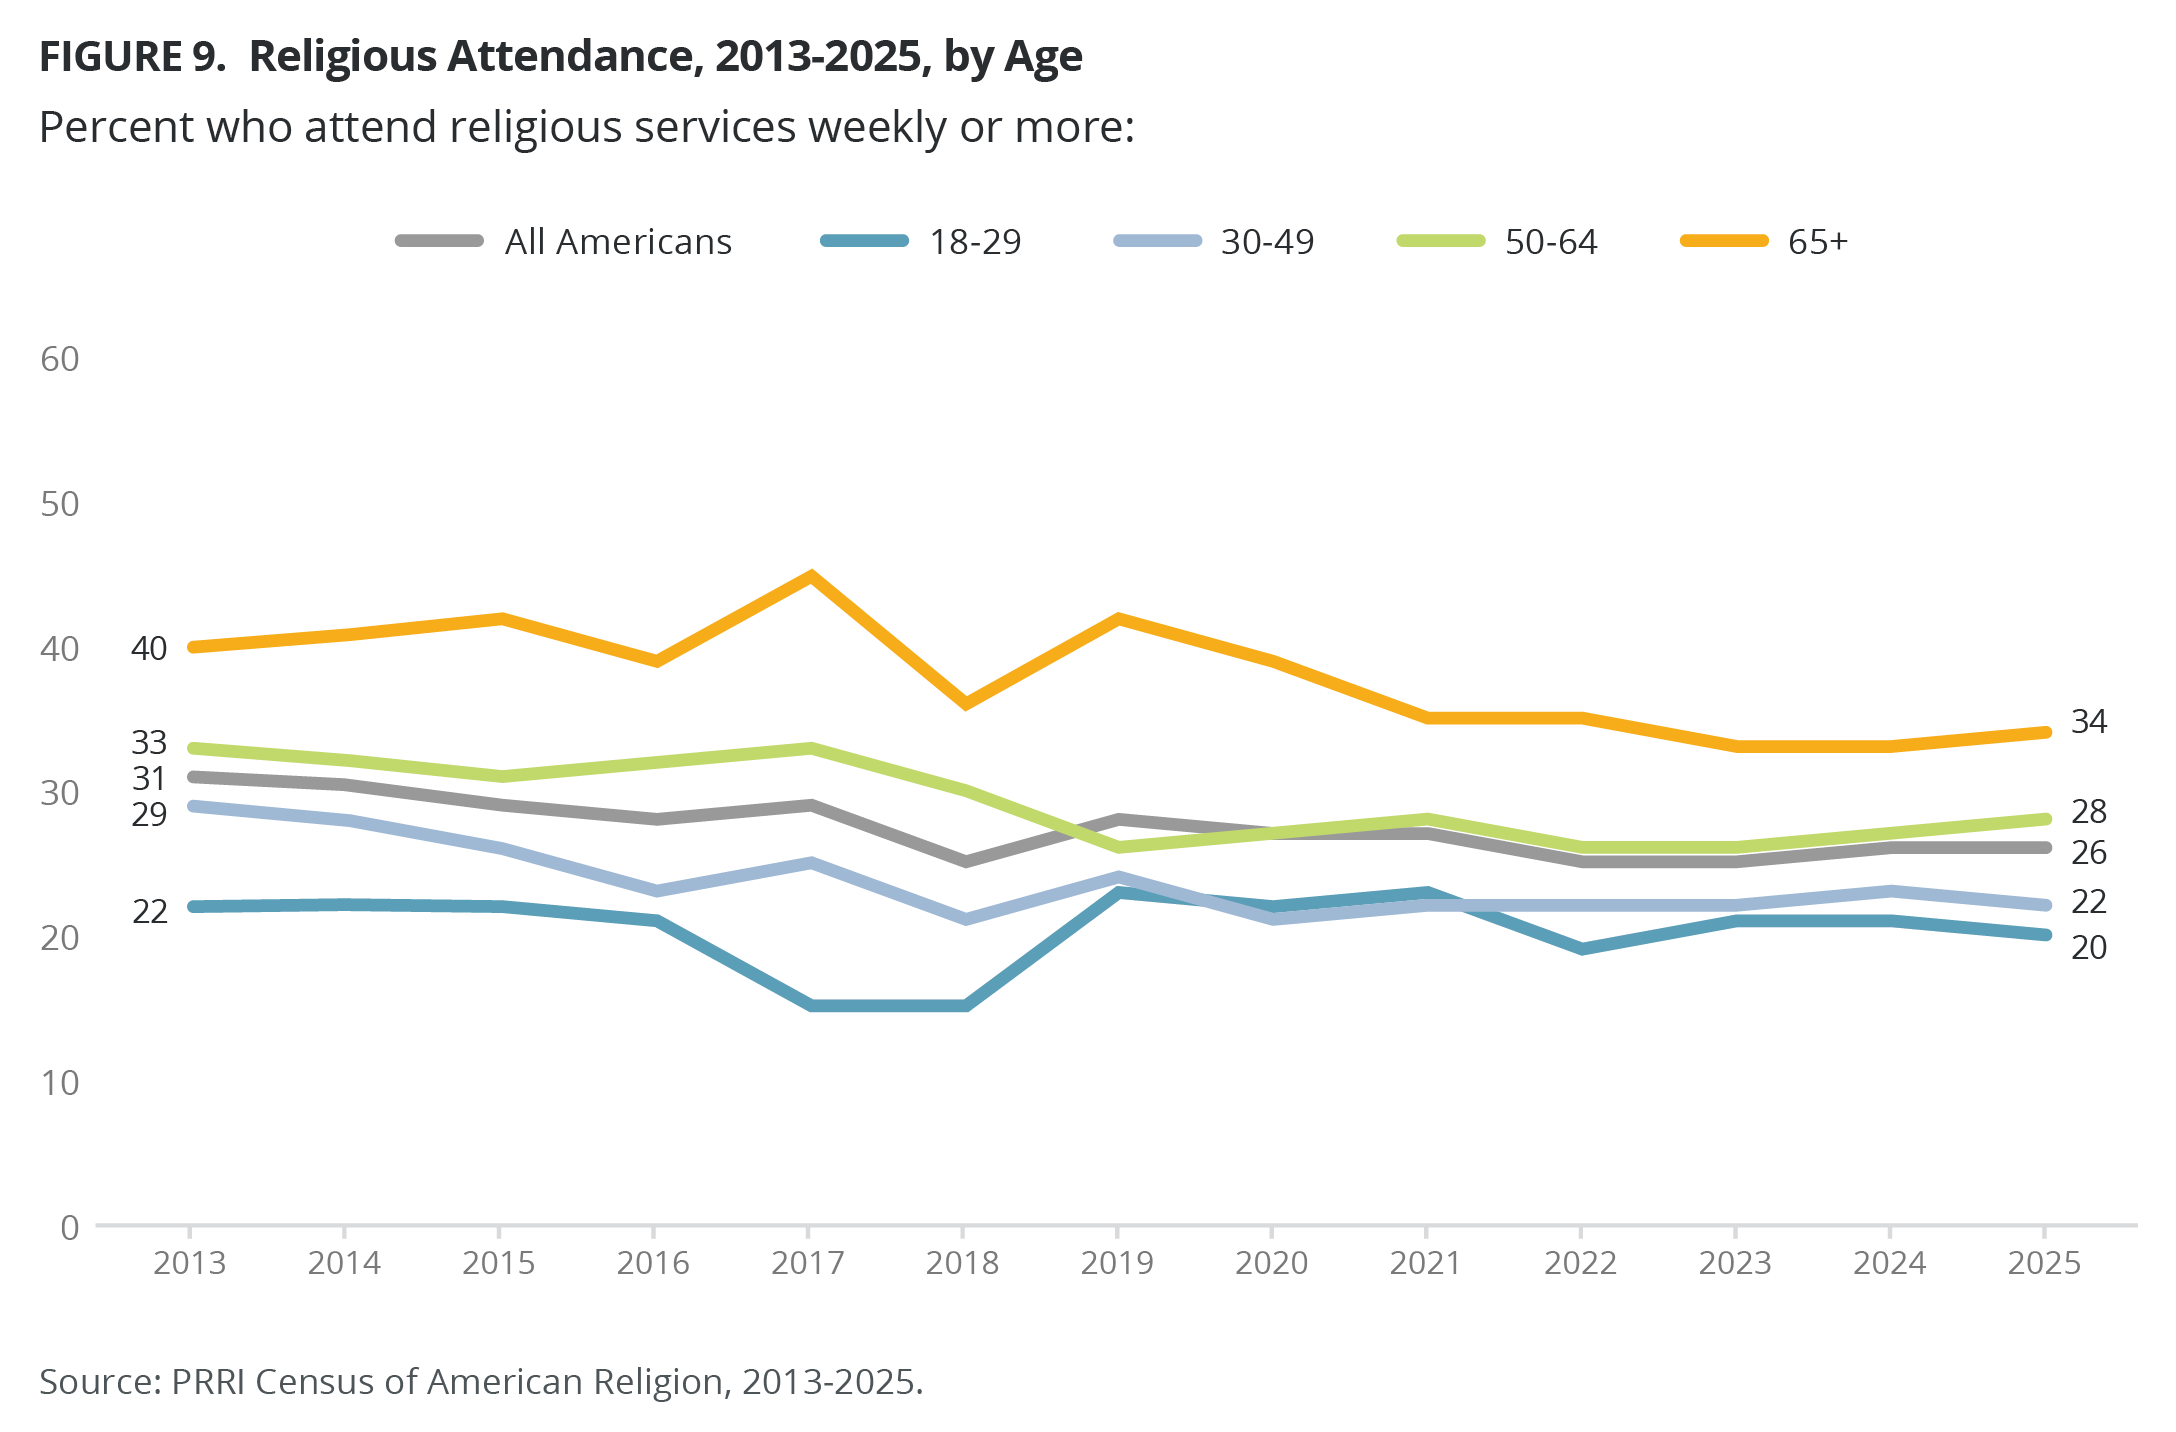
Across age groups, weekly church attendance has generally declined over time, with Americans over 50 consistently more likely than younger Americans under 50 to attend services regularly. The share of young Americans (ages 18-29) church attenders has remained relatively stable over the past decade, dipping in 2017 and 2018, while church attenders ages 30-49 have consistently declined, from 29% in 2013 to 22% in 2025. By contrast, older Americans remain much more likely to attend services regularly, though their attendance has also declined in recent years, particularly since 2020.
A Profile of Religious Groups, 2013 vs. 2025
With over 40,000 respondents, the 2025 PRRI Census of American Religion provides a comprehensive profile of each American religious group by partisanship, political ideology, educational attainment, median age, and race/ethnicity, as well as any significant shifts from 2013.
A Profile of White Christians
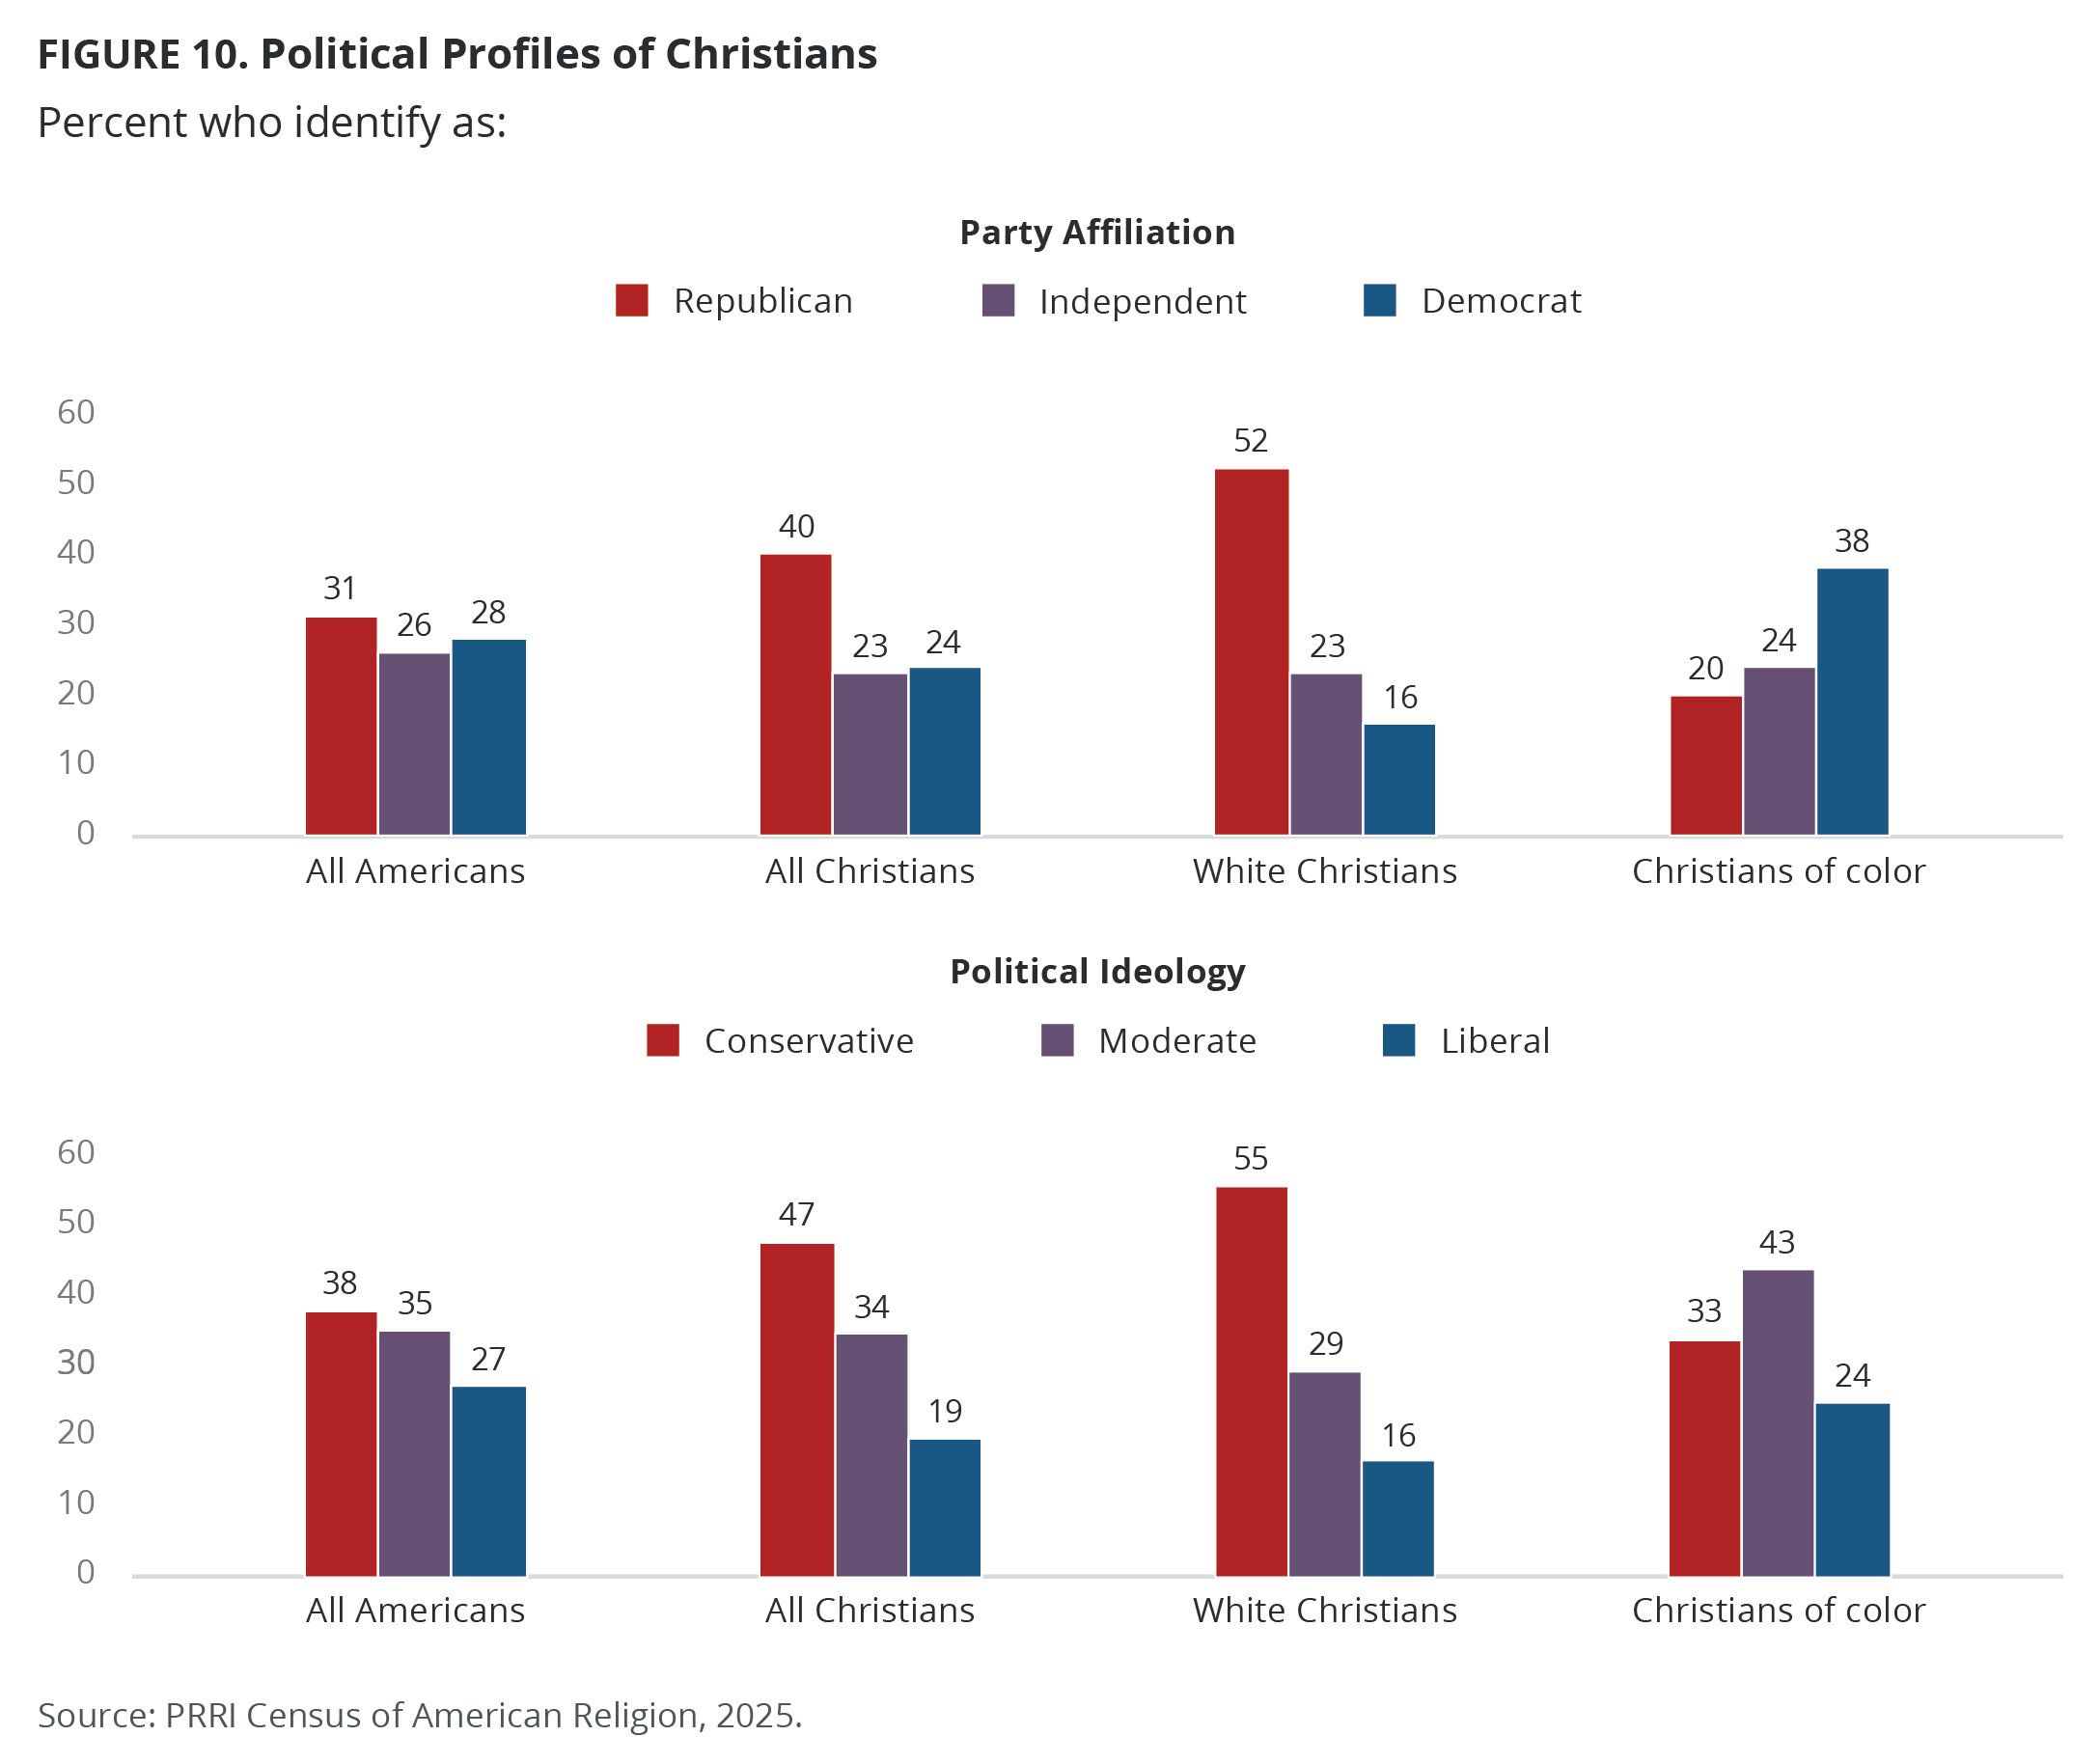
- White Christians include white evangelical Protestants, white mainline/non-evangelical Protestants, and white Catholics.
- White Christians include most Orthodox Christians (79% identify as white) and Latter-day Saints (77% identify as white).
- White Christians also include around one-third of Jehovah’s Witnesses (34% identify as white).
- Since 2013, the share of white Christians who identify as Republicans has increased significantly, from 35% to 52%, while the shares of independents and Democrats have declined, from 35% to 23%, and from 23% to 16%, respectively.
- Since 2013, the share of white Christians who identify as conservative has increased slightly, from 48% to 55%. The shares identifying as liberals and moderates have remained stable, at 16% and 29%, respectively.
- Since 2013, white Christians have grown more likely to hold a four-year college degree or higher, from 31% to 40%. In 2025, 60% of white Christians do not hold a college degree.
- The median age of white Christians is 56, compared with 53 in 2013. White Christians are the only religious groups to be substantially older than the median age of all Americans (48).
A Profile of Christians of Color
- Christians of color include the following groups: Black Protestants, Hispanic Protestants, other Protestants of color, Hispanic Catholics, other Catholics of color, and Jehovah’s Witnesses.
- Christians of color also include the approximately two in ten Latter-day Saints and Orthodox Christians who identify as non-white (23% and 21%, respectively).
- Christians of color also include 66% of Jehovah’s Witnesses who identify as non-white.
- From 2013 to 2025, Christians of color were more likely to identify as Democrats (46% vs. 38%) and less likely to identify as independents (32% vs. 24%), Republicans (10% vs. 20%), or with another party or no party at all (11% vs. 17%).
- In addition, Christians of color have remained equally likely to identify as conservative (33%) and liberal (24%) but have grown more moderate during that same period (29% to 43%).
- College-educated Christians of color have increased from 18% in 2013 to 28% in 2025. Currently, the majority of Christians of color (72%) do not have a four-year college degree.
- The median age of Christians of color is 46, slightly below the median age of all Americans, 48.
View a more detailed analysis of Christians of color and Jehovah’s Witnesses.
A Profile of Non-Christians
- Non-Christians include the following groups: Jewish Americans, Muslims, Buddhists, Hindus, Unitarian Universalists, and those who identify as members of another non-Christian religion.
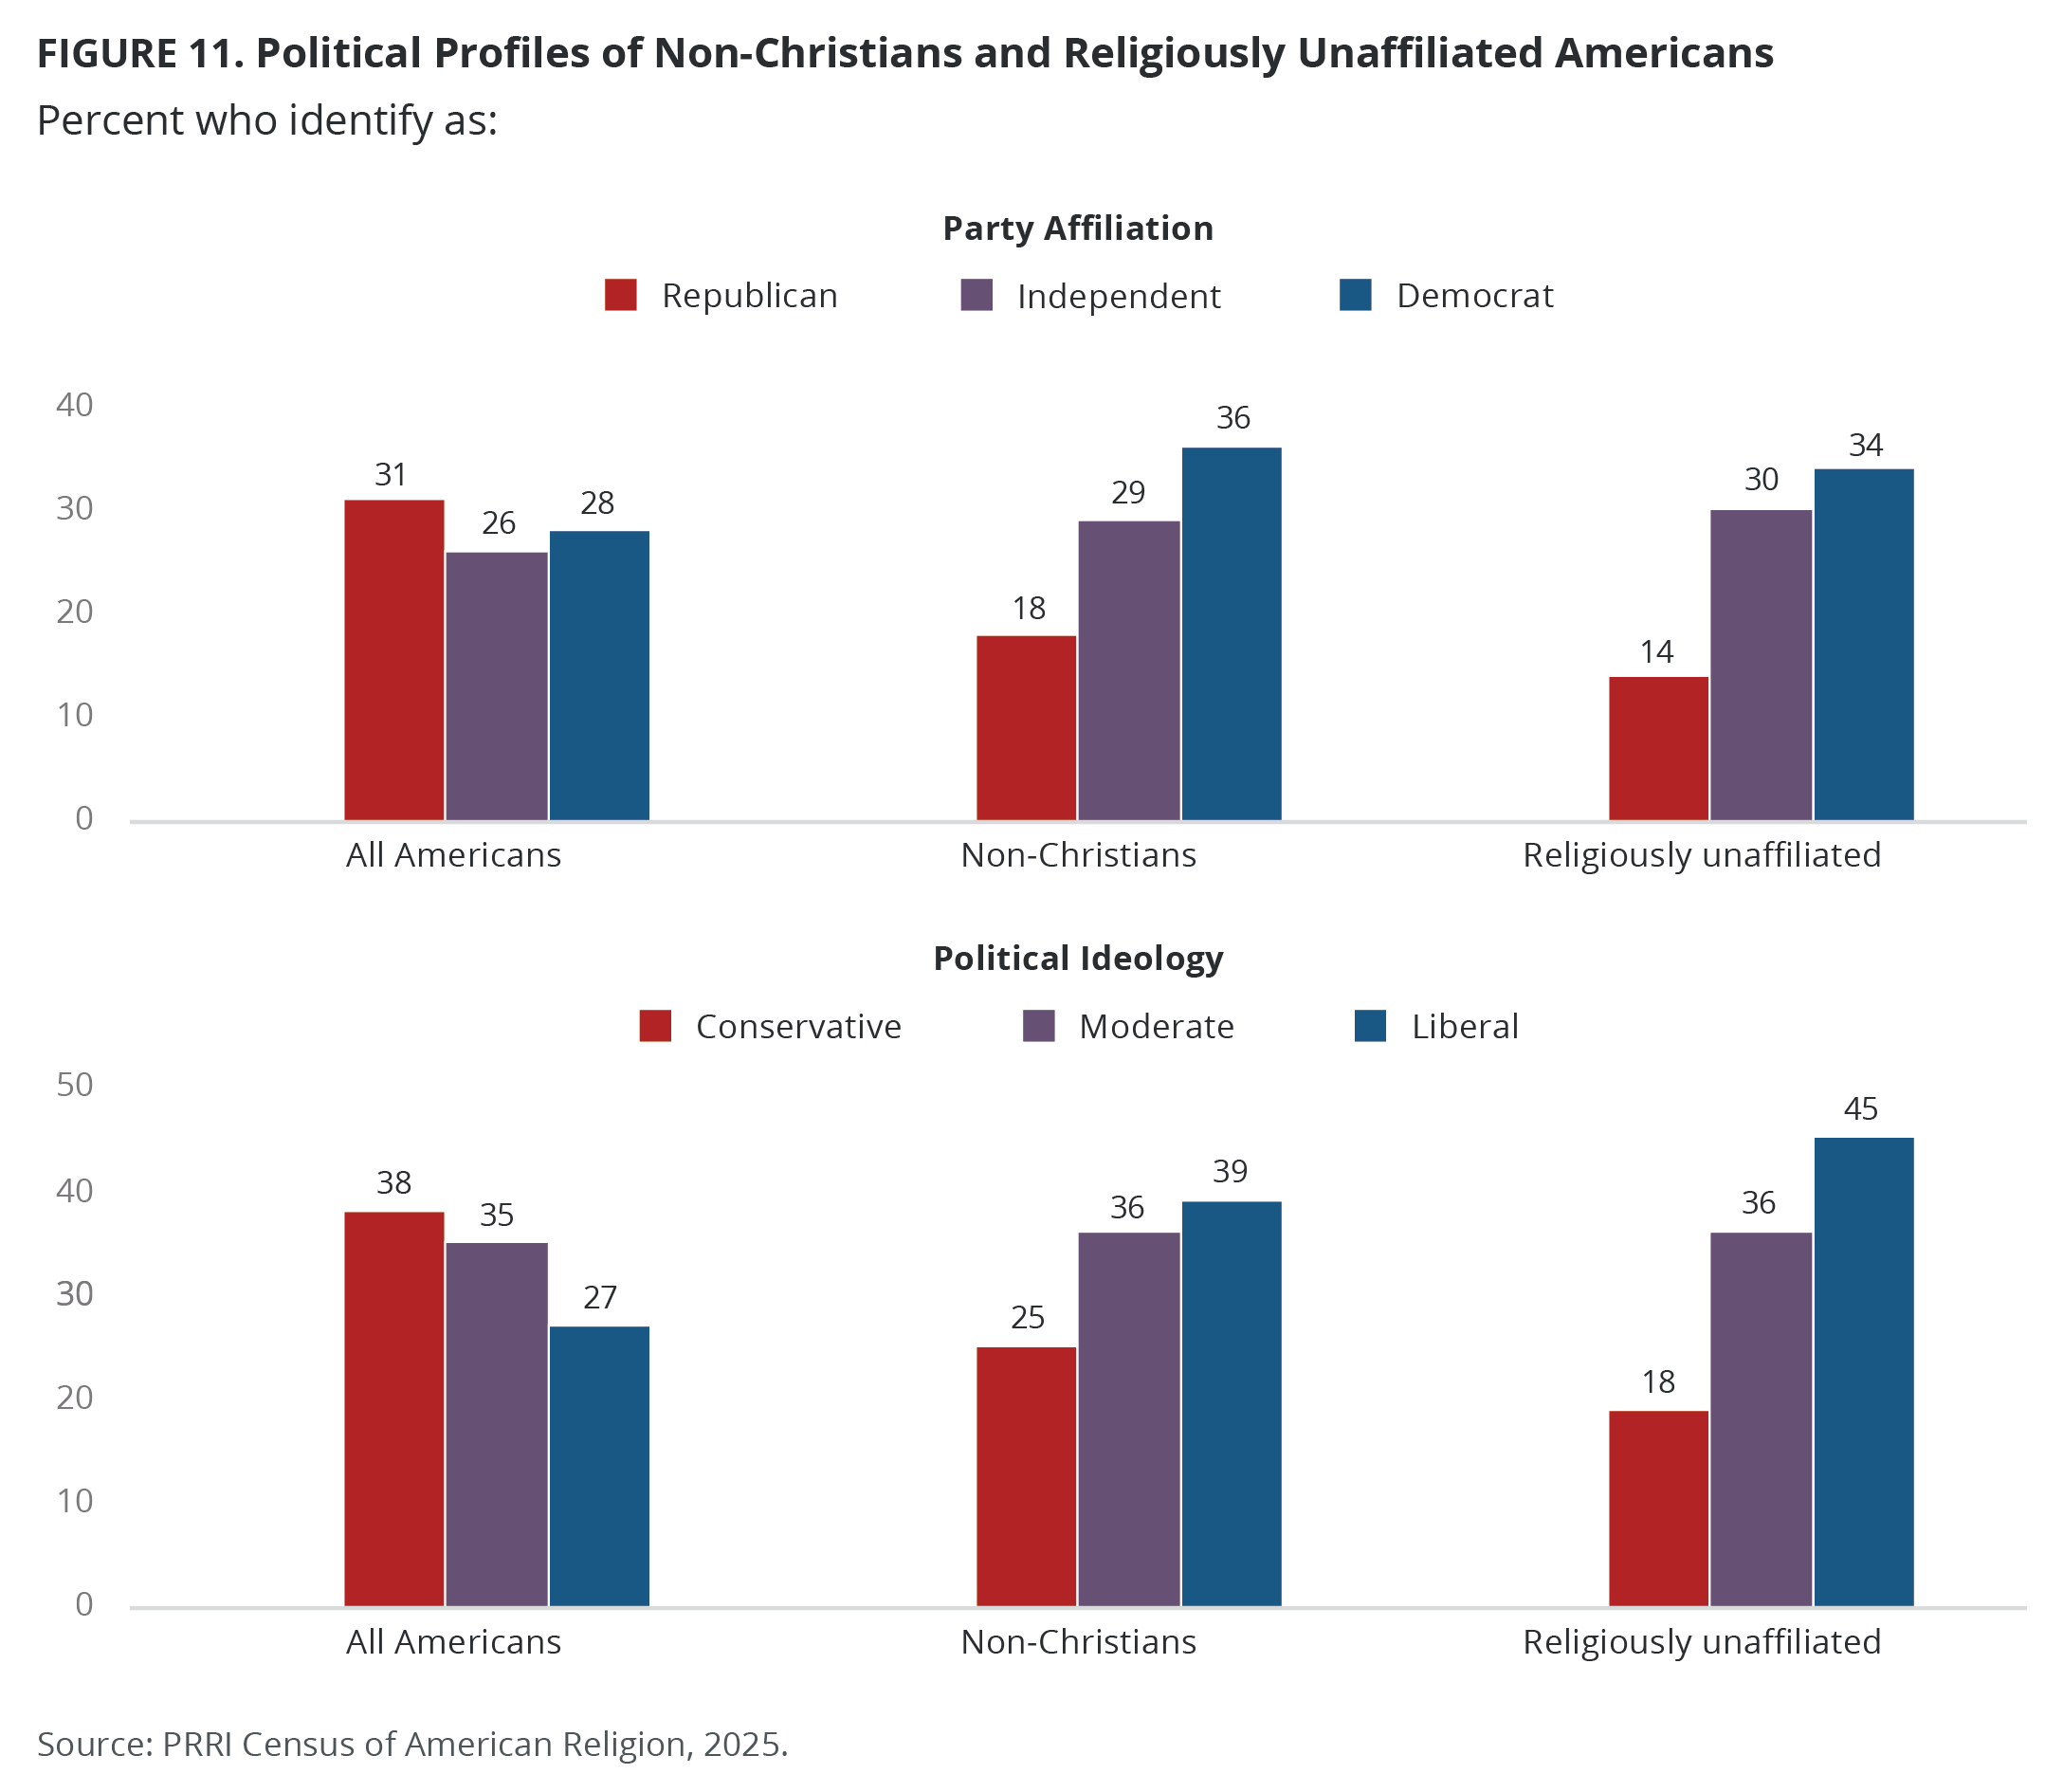
- From 2013 to 2025, the share of non-Christians identifying as Democrats (43% vs. 36%) and independents (38% vs. 29) has declined, while the share identifying as Republicans has increased from 10% to 18%.
- In addition, the share of non-Christians who identify as liberal has declined from 44% to 39%, while those who identify as moderate has increased from 27% to 36%. The share of non-Christians who identify as conservative has remained the same, at 25%.
- The majority of non-Christians (53%) have a four-year college degree or higher, up from 46% in 2013. Today, less than half non-Christians do not hold a college education (47%).
- The median age of non-Christians is 45, slightly below the median age of all Americans, 48.
View a more detailed analysis of non-Christian Americans.
A Profile of Religiously Unaffiliated Americans
- Religiously unaffiliated Americans include atheists, agnostics, and those who identify as nothing in particular.
- Around one-third of unaffiliated Americans (34%) are Democrats, followed by 30% who are independents (a decline from 49% in 2013) and 14% who are Republicans; another 21% identify with another party or do not affiliate with any partisan group (an increase from 9% in 2013).
- Since 2013, unaffiliated Americans have become more liberal (40% to 45%) and moderate (29% to 36%), but less conservative (22% to 18%).
- The majority of unaffiliated Americans (63%) do not have a four-year college degree, while 37% hold a four-year degree or higher, up from 29% in 2013.
- The median age of religiously unaffiliated Americans is 41, significantly below the median age of all Americans, 48.
View a more detailed analysis of religiously unaffiliated Americans.
The Racial Makeup of Different Religious Groups
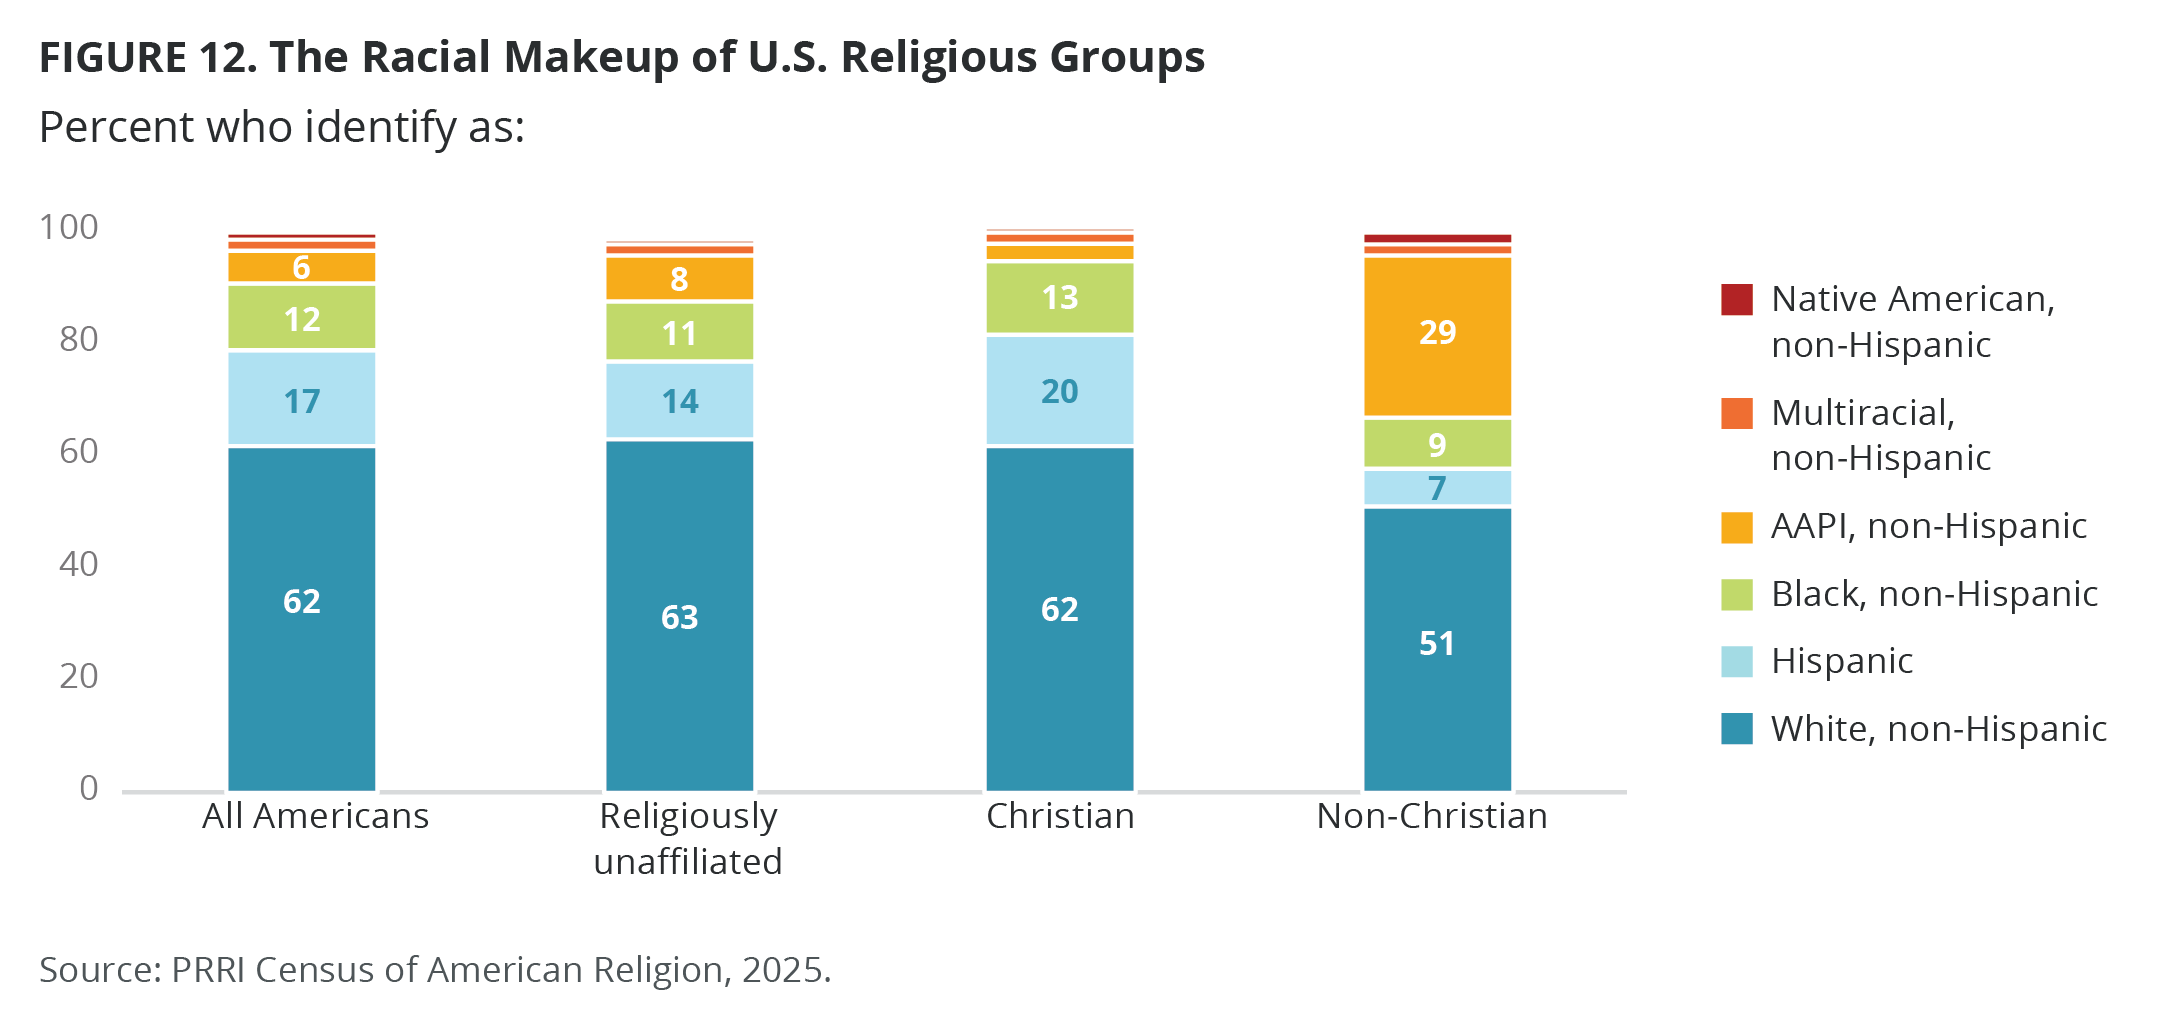
- Among all Christians, racial identity mirrors closely that of all Americans: Around six in ten Christians (62%) identify as white, followed by 20% as Hispanic, 13% as Black, 3% as AAPI, 2% as multiracial, and 1% as Native American.
- A slim majority of non-Christians identify as white (51%), followed by three in ten as AAPI (29%), around one in ten as Black (9%) or Hispanic (7%), and 2% each as multiracial or Native American.
- More than six in ten unaffiliated Americans (63%) identify as white, followed by 14% as Hispanic, 11% as Black, 8% as AAPI, 2% each as multiracial or Native American.
Survey Methodology
The 2025 Census of Religion of America consists of demographic information drawn from a random sample of 40,000 adults (age 18 and up) living in all 50 states and the District of Columbia who are part of the Ipsos KnowledgePanel.
The KnowledgePanel’s recruitment process uses an address-based sampling methodology to select households from the United States Postal Service’s Delivery Sequence File — a database that contains all delivery addresses in the country. As such, it covers all households regardless of their phone status, providing a representative sample. Unlike opt-in panels, households are not permitted to “self-select” into the panel, and participants are generally limited on the number of surveys they can take within a given time period.
This sample of 40,000 adults was selected based on panelists who provided their religious affiliation to KnowledgePanel between January 1, 2025, and December 31, 2025. The sample was weighted to be representative of the U.S. adult population based on these dimensions with additional nesting of dimensions as well: age, race and ethnicity, gender, Census region, metropolitan status, state, education, household income, language dominance, political party affiliation, and 2024 presidential vote choice using an iterative proportional fitting (IPF) process that simultaneously balances the distributions of all variables. The needed benchmarks were from the 2024 March Supplement of the Current Population Survey (CPS), except language dominance, which is not available from CPS and was obtained from the 2023 American Community Survey (ACS). Additionally, political party affiliation benchmark was obtained from the Pew’s 2025 National Public Opinion Reference Survey (NPORS) and 2024 presidential vote choice benchmark came from the official 2024 presidential general election results. Weights were trimmed to prevent individual interviews from having too much influence on the final results.
The margin of error for the national survey is +/- 0.73 percentage points at the 95% level of confidence, including the design effect for the survey of 2.20. In addition to sampling error, surveys may also be subject to error or bias due to question wording, context, and order effects. Additional details about KnowledgePanel can be found on the Ipsos website: https://www.ipsos.com/en-us/solution/knowledgepanel
[1] Among Christians of color, “other Protestants of color” include AAPI, multiracial, and American Indian or Alaska Native individuals, while “other Catholics of color” include Black, AAPI, multiracial, and American Indian or Alaska Native groups.