

To view a PDF of findings presented during our webinar January 20, 2026, click here. To watch the webinar recording featuring a discussion of the survey’s findings, click here.
Executive Summary
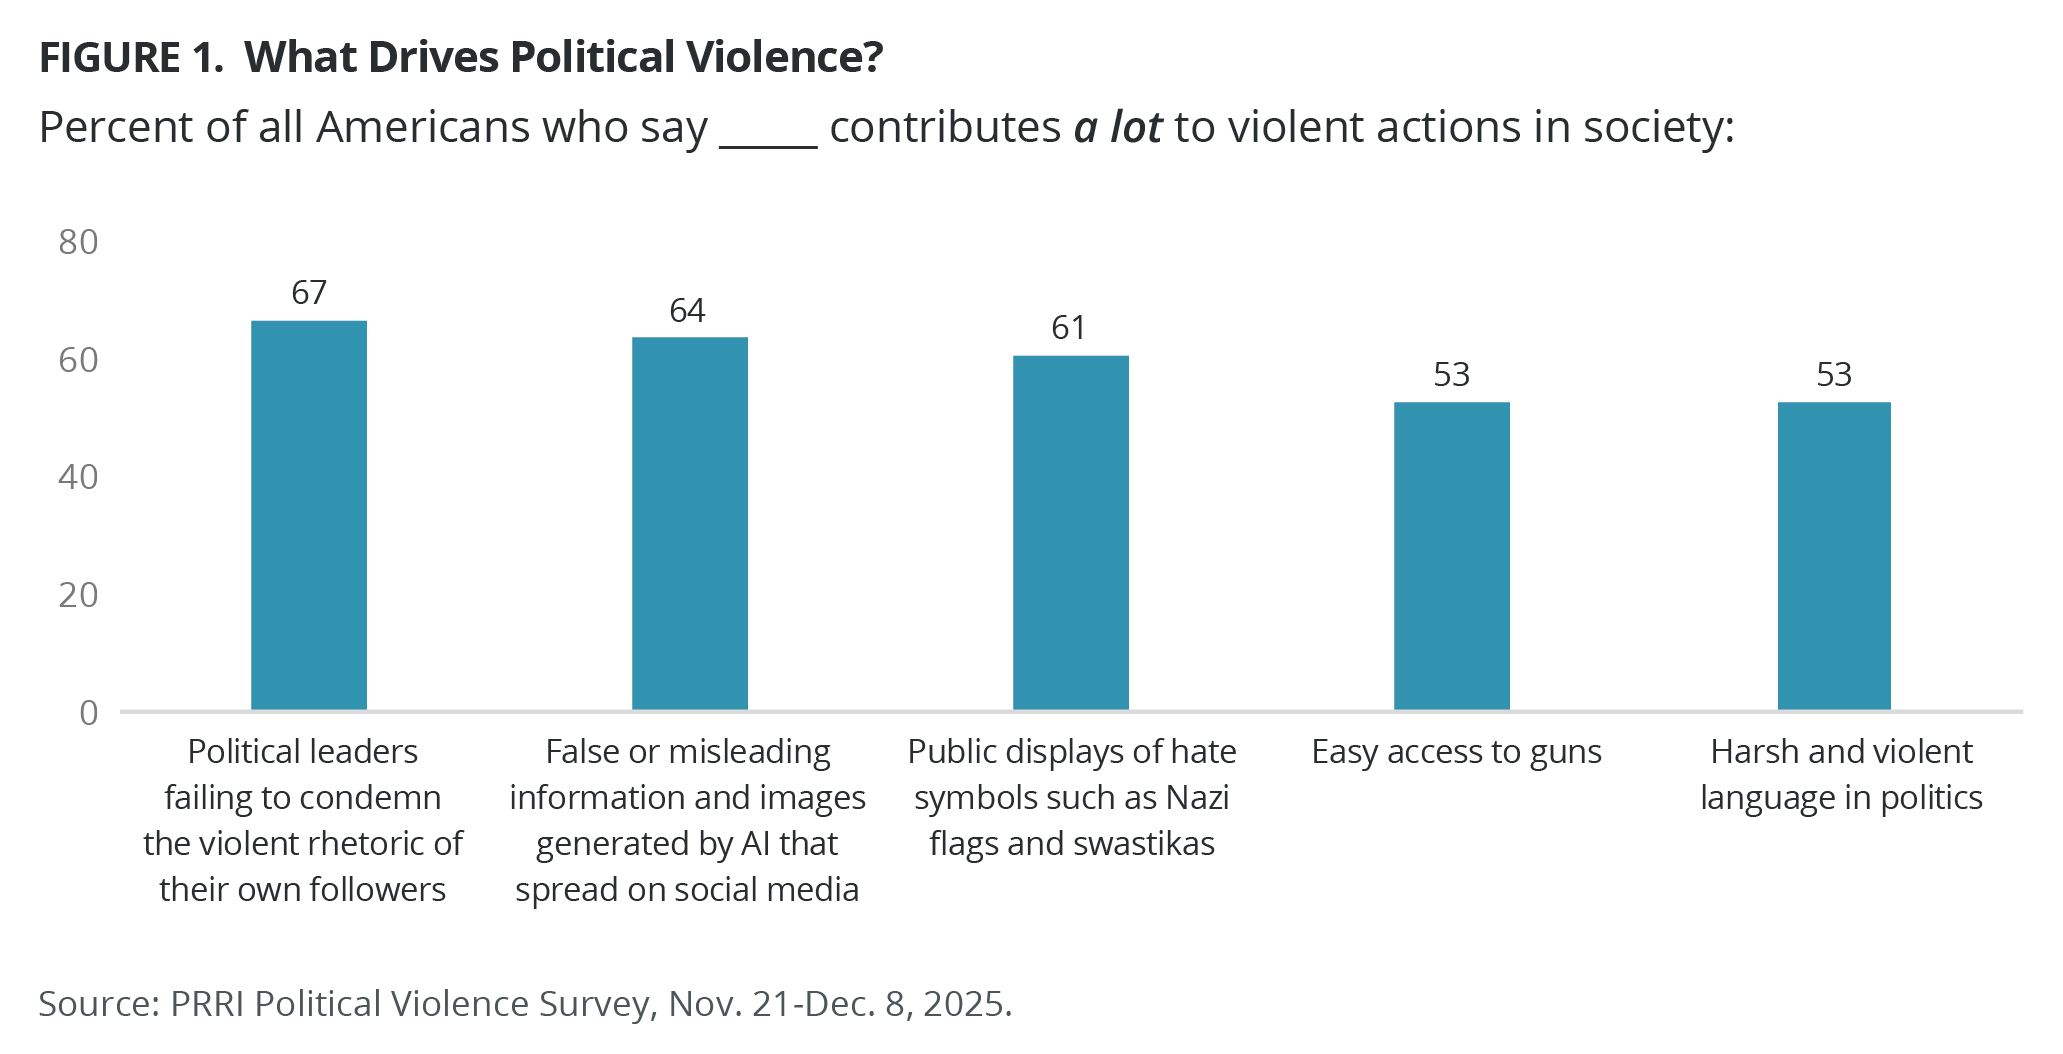
Two-thirds of Americans (67%) believe political leaders’ failure to condemn violent rhetoric contributes a lot to violent actions in society.
- Majorities of Americans also believe that false or misleading information generated by AI (64%) and public displays of hate symbols (61%) contribute a lot to violent actions in society, while smaller majorities believe easy access to guns and harsh and violent political language are also drivers (both 53%).
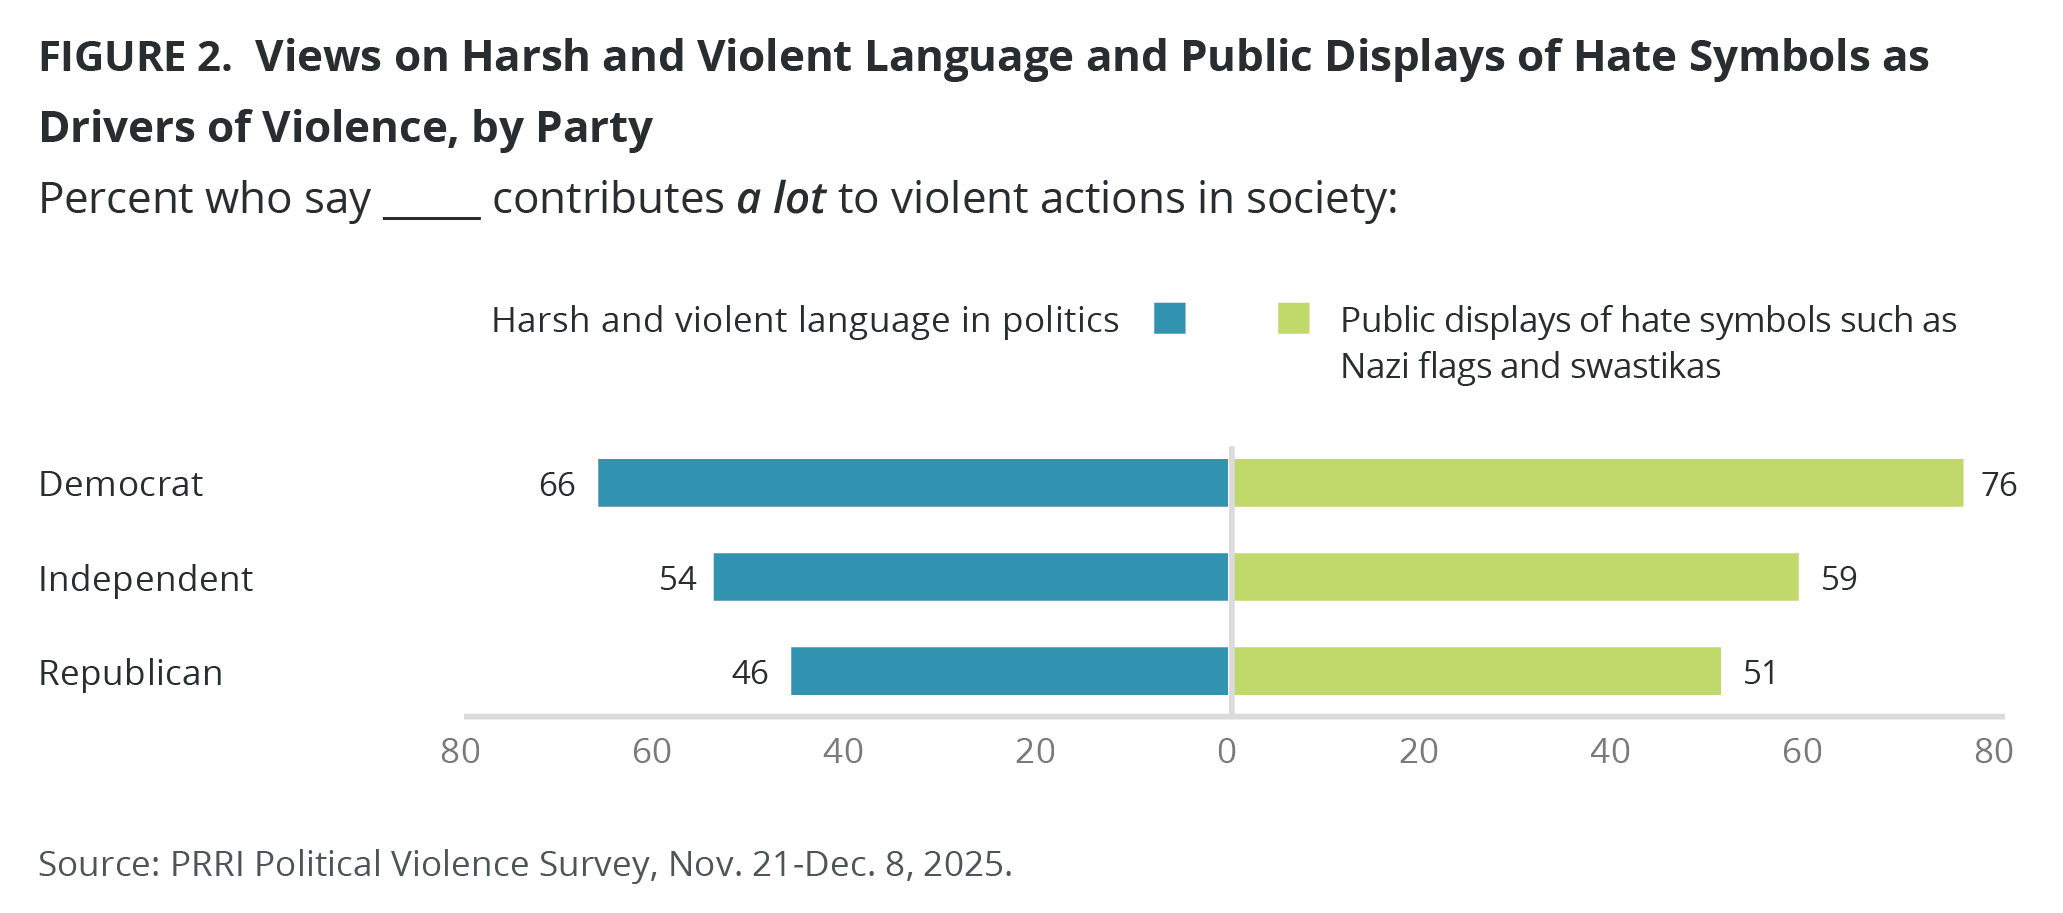
- While 51% of Republicans believe public displays of hate symbols contribute a lot to violence, 76% of Democrats do.
- Fewer than half of Republicans (46%) believe that harsh and violent political language contributes a lot to violence in society; white evangelical Protestants are the only group of religious Americans in which a minority (45%) share that view.
Very few Americans support hostile and violent actions by their political allies to advance important political goals.
- Very few Americans justify imprisoning a political opponent without a trial if that person poses a clear danger to the country (12%); damaging or destroying property as a form of protest (7%); pushing, shoving, or punching a political opponent (6%); posting the home address or private phone number of a political opponent online so their family will be harassed (5%); or killing a political opponent if that person poses a clear danger to the country (5%).
- While very strong majorities of Americans over the age of 50 completely disagree that violent and harsh actions may justify political outcomes, such sentiments are less widely shared among younger Americans, especially those who are under 30.
More than three in four Americans disagree that violence may be needed to save the country; views are similar across partisan groups, though they have shifted some throughout the year.
- Most Americans (77%) disagree that “because things have gotten so far off track, true American patriots may have to resort to violence in order to save our country,” compared with 20% of those who agree.
- Agreement about the potential need for political violence has decreased significantly among Republicans since President Donald Trump’s reelection in November 2024; agreement among Democrats has remained low over time but increased slightly in the past year.
- Since early 2021, support for political violence has varied across religious groups. Support among white Christians has declined since the 2024 election, though white evangelical Protestants continue to show higher support than white Christians overall.
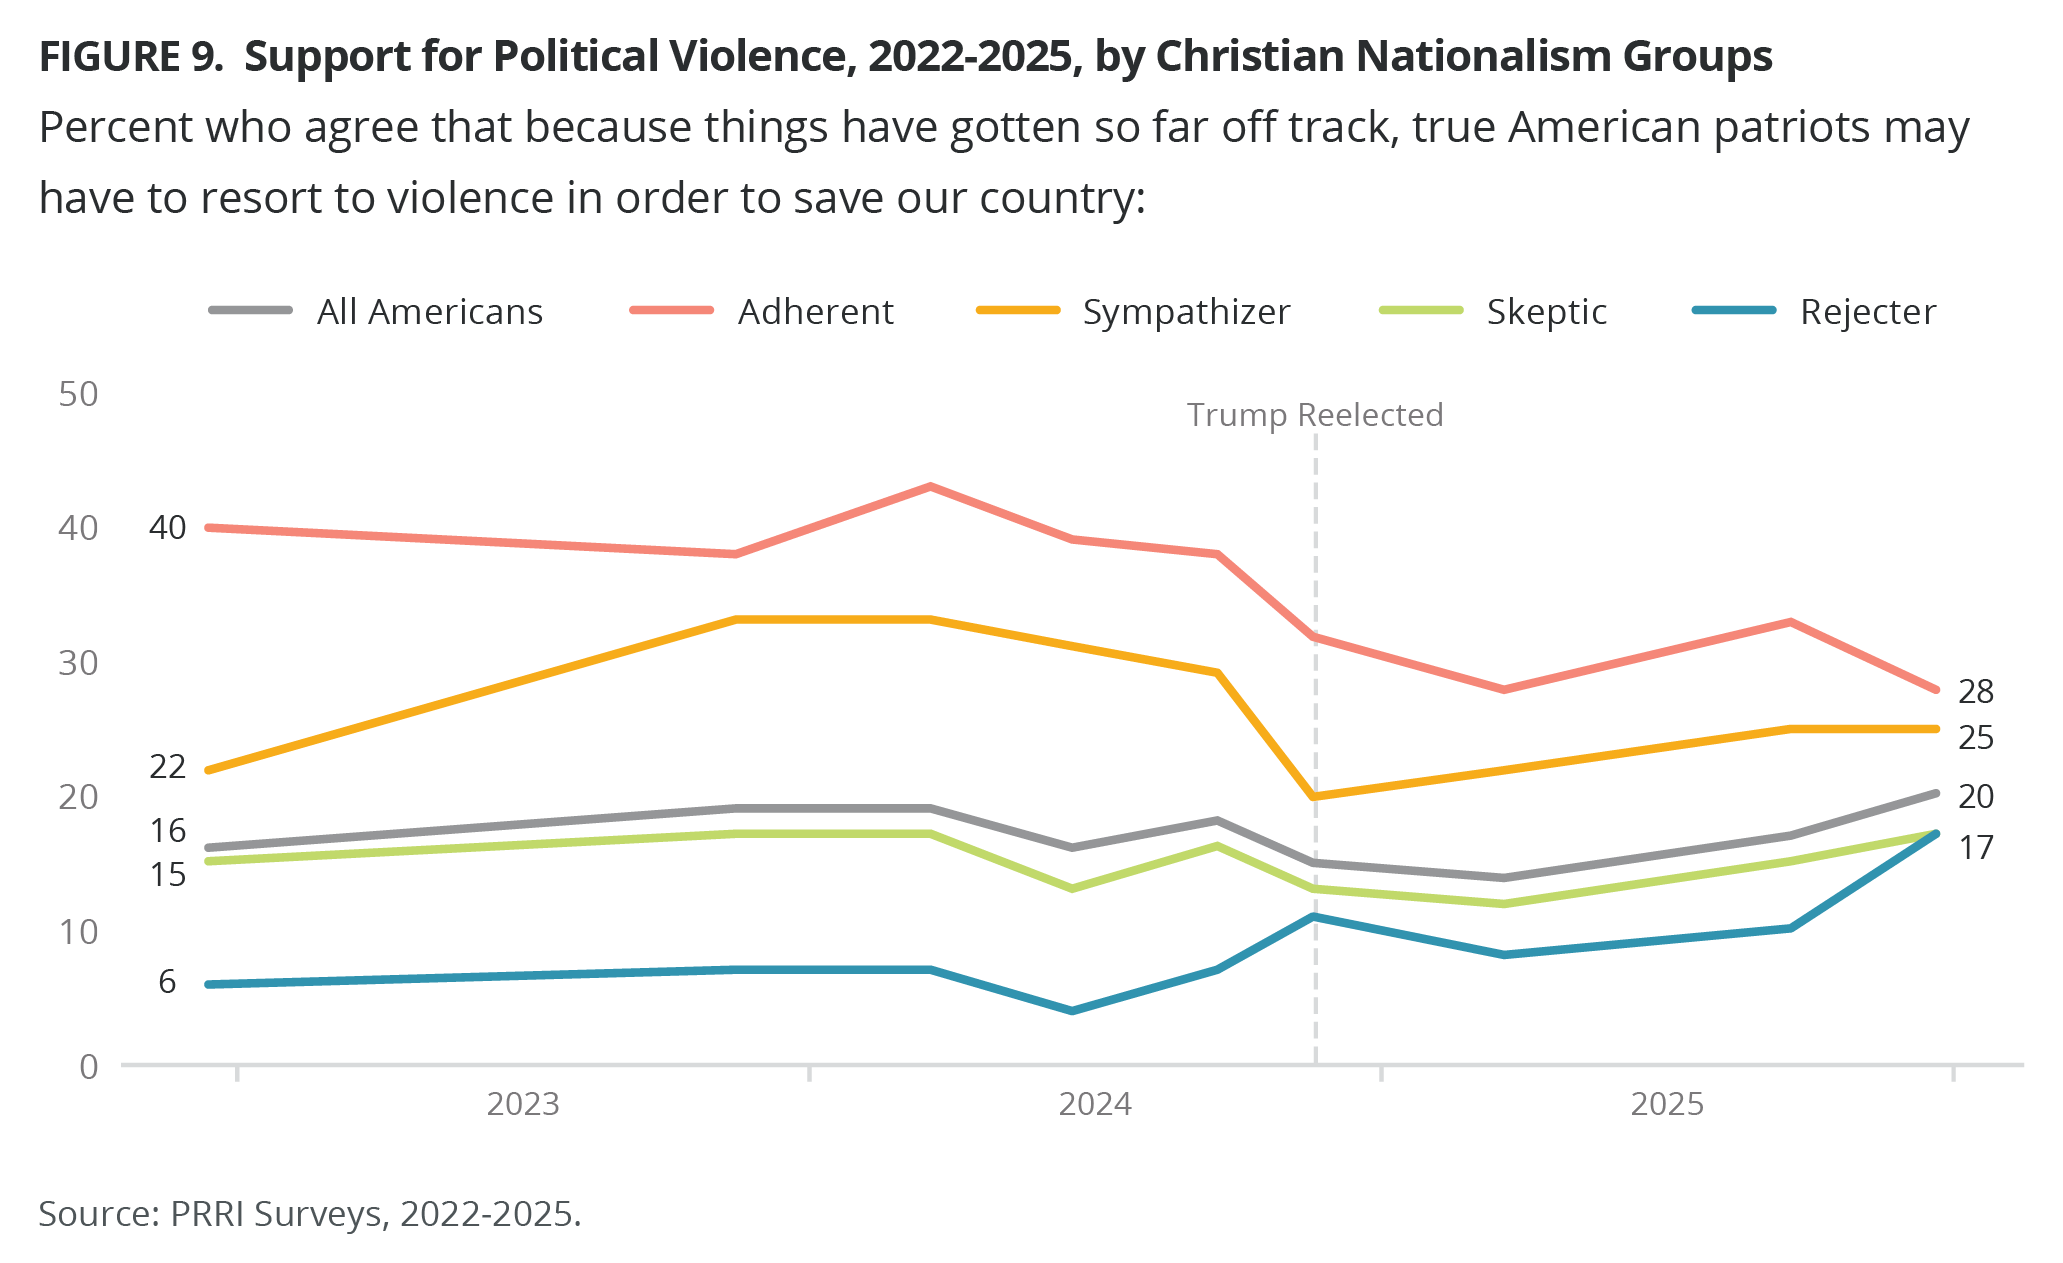
- Support for political violence remains highest among Christian nationalism Adherents and lowest among Rejecters.
Americans’ views on who is most responsible for political violence are deeply polarized, split largely along partisan and religious lines.
- Democrats overwhelmingly attribute most responsibility for political violence to right-wing groups (73%), while Republicans attribute most responsibility to left-wing groups (72%).
- While more Christians of color and non-Christians attribute most responsibility to right-wing groups for most political violence today, white Christian groups attribute most responsibility to left-wing groups.
- Most Christian nationalism Adherents (73%) and Sympathizers (64%) attribute responsibility to left-wing groups, while most Rejecters (72%) attribute responsibility to right-wing groups. Christian nationalism Skeptics are divided.
Americans’ views are strongly divided by party and religion on whether National Guard deployments in American cities cause more violence than they prevent.
- A slim majority of Americans (52%) agree that deploying the National Guard to patrol American cities may cause more violence than it prevents. Democrats (80%) and independents (60%) are far more likely than Republicans (23%) to agree.
- Most Christians of color and non-Christians agree that these deployments cause more violence, while white Christian groups are far less likely to do so. Agreement is particularly lower among white evangelical Protestants (29%).
- Christian nationalism Rejecters (80%) are the most likely to agree, followed by Skeptics (54%), Sympathizers (37%), and Adherents (26%).
Opposition to Trump’s Jan. 6 pardons is widespread, with notable exceptions among Republicans, white Christian groups, and Christian nationalism Adherents and Sympathizers.
- Most Americans (68%) oppose “President Trump’s pardoning of over 1,500 people convicted for their role in the attacks on the U.S. Capitol on January 6, 2021,” compared with 29% who favor it. Republicans (63%) are far more likely to favor these pardons than independents (22%) and Democrats (4%).
- White Christian groups, particularly white evangelical Protestants (58%), are more likely than non-Christians (24%), Christians of color (19%), and unaffiliated Americans (18%) to favor Trump’s Jan. 6 pardons, as are Christian nationalism Adherents (61%) and Sympathizers (49%), compared with Skeptics (25%) and Rejecters (8%).
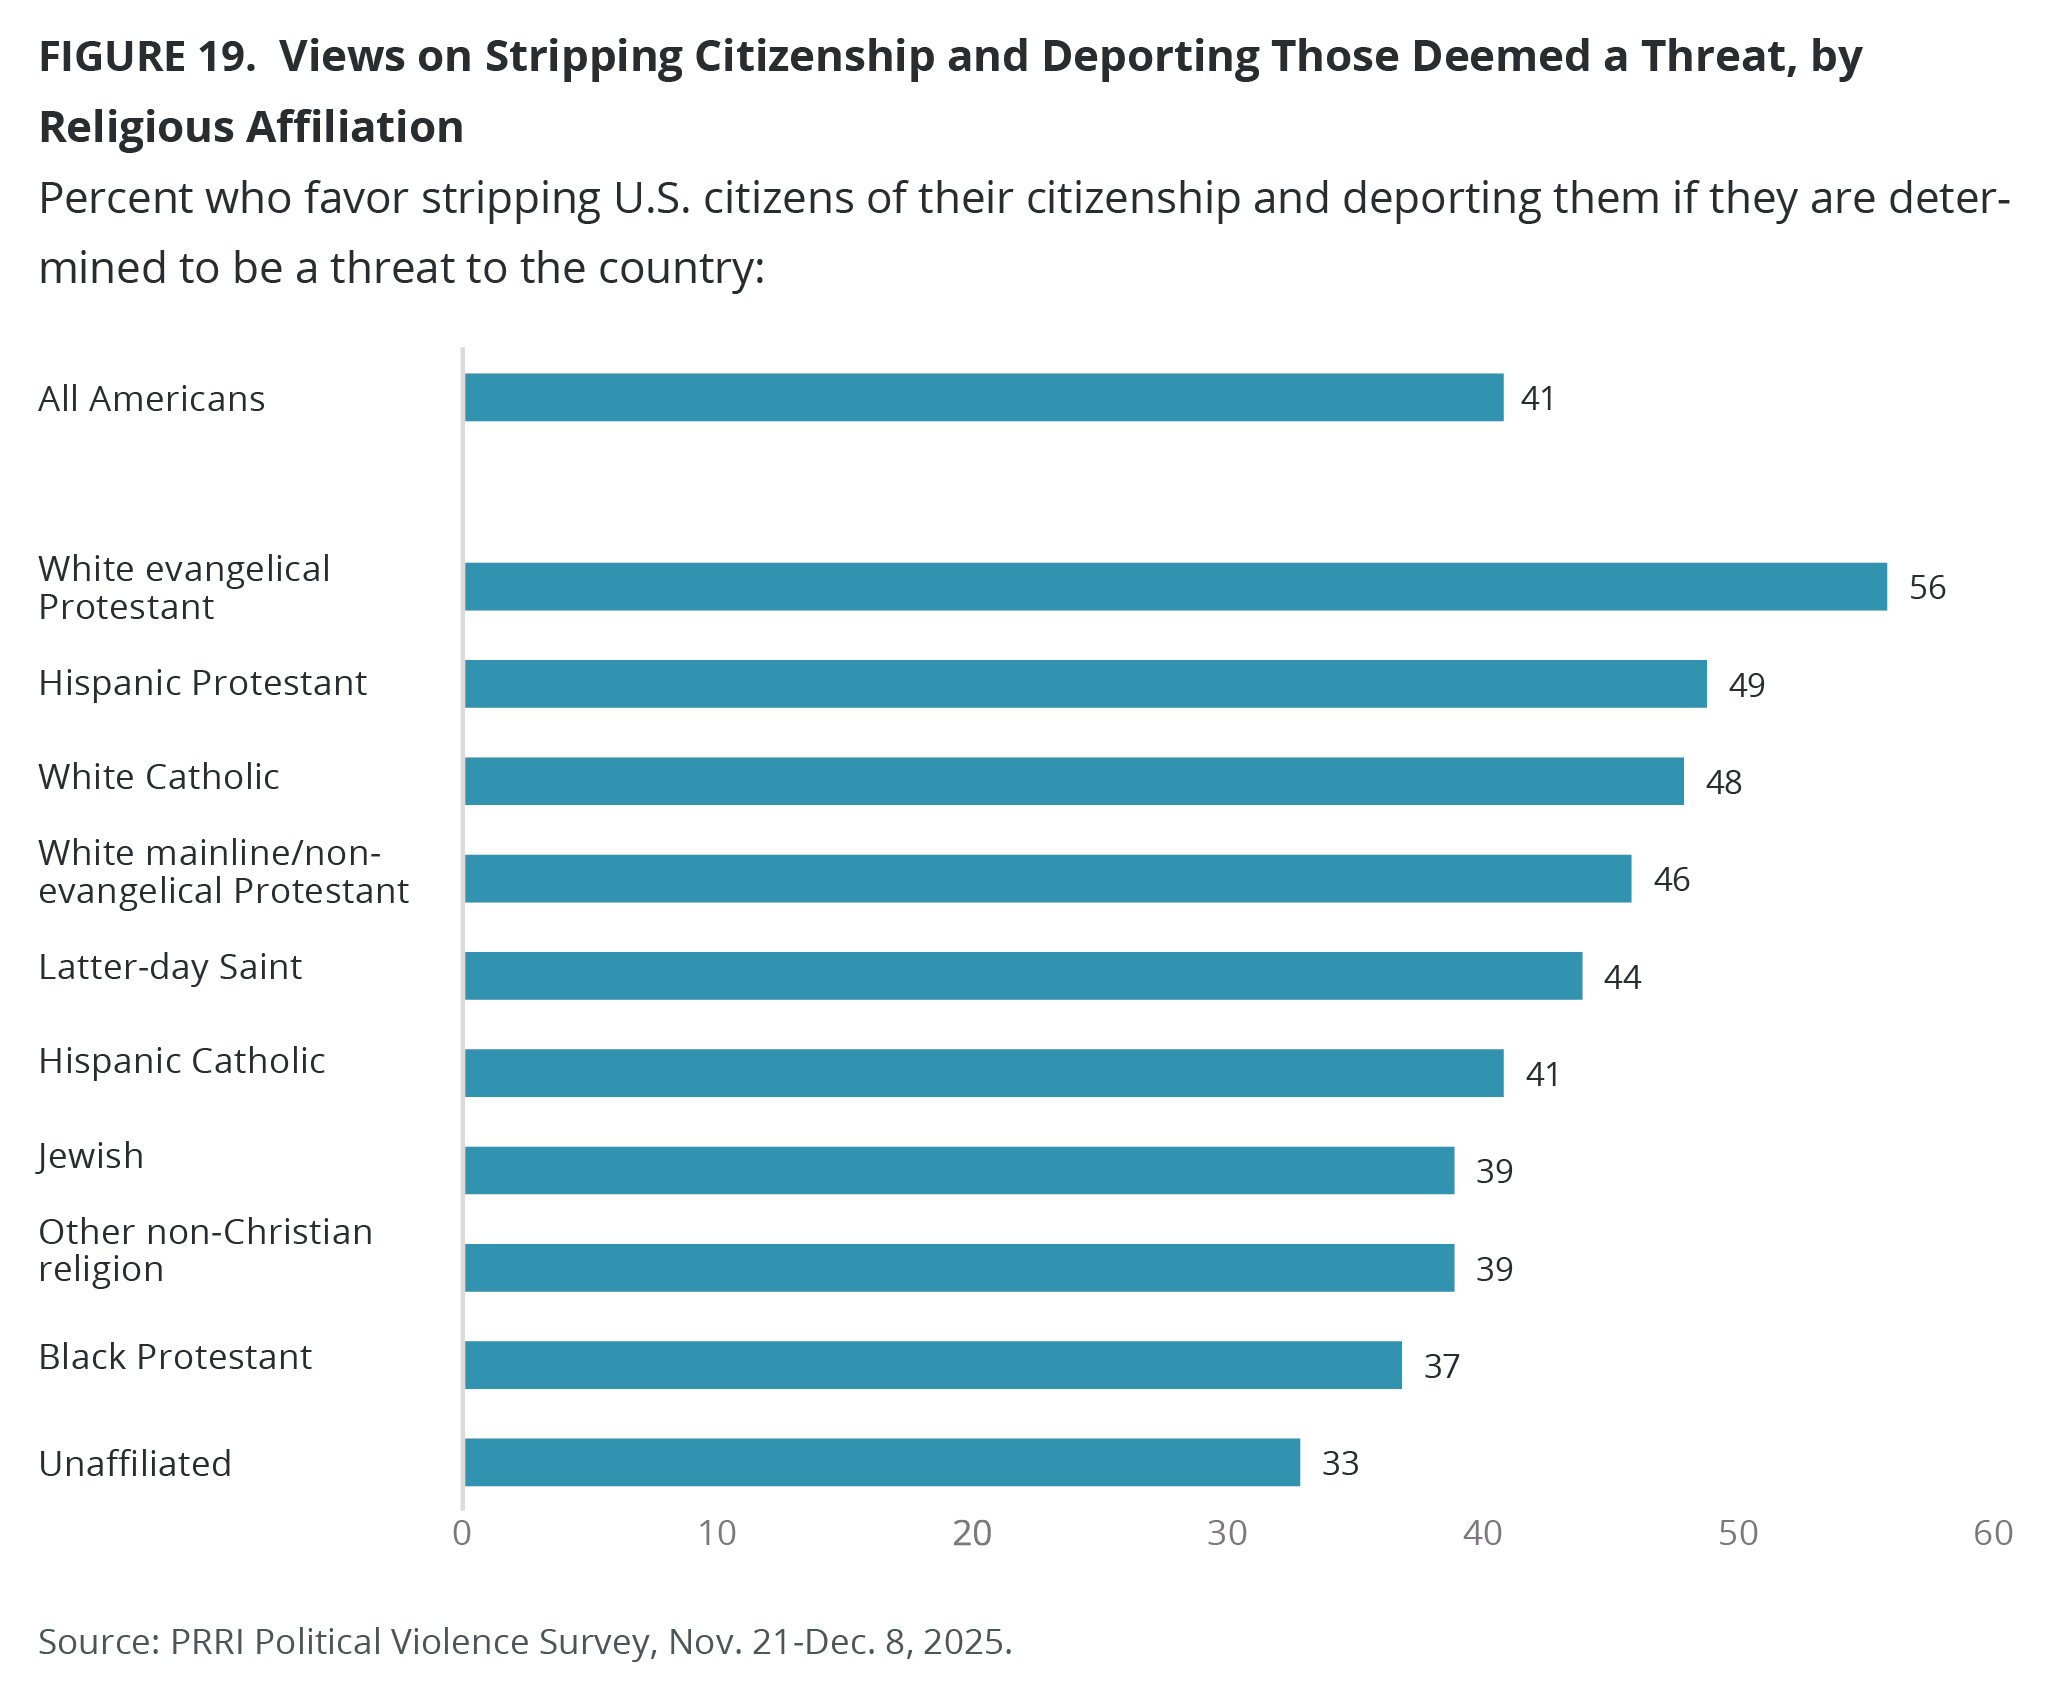
Opposition to stripping citizenship and deporting U.S. citizens deemed a threat is widespread, with notable exceptions among Republicans, white evangelical Protestants, and Christian nationalism Adherents and Sympathizers.
- Four in ten Americans (41%) favor “stripping U.S. citizens of their citizenship and deporting them if they are determined to be a threat to the country.” Republicans (60%) are roughly twice as likely as independents (38%) and Democrats (27%) to agree.
- White evangelical Protestants (56%) are the only religious group with majority support for stripping U.S. citizens of their citizenship and deporting them, compared with fewer Hispanic Protestants (49%), white Catholics (48%), and white mainline Protestants (46%). Support among other religious groups is notably lower.
- Christian nationalism Adherents (67%) and Sympathizers (57%) are notably more likely than Skeptics (40%) and Rejecters (23%) to favor stripping U.S. citizens of their citizenship.
Drivers of Violent Actions in Society
Broad Concern About Political Violence, With Sharp Partisan Divides Over Its Causes
Solid majorities of most Americans believe political leaders failing to condemn the violent rhetoric of their own followers (67%), false or misleading information and images generated by AI that spread on social media (64%), and public displays of hate symbols such as Nazi flags and swastikas (61%) contribute a lot to violent actions in society. Fewer Americans, but still majorities, believe that easy access to guns and harsh and violent language in politics contribute to violence a lot (both 53%).
However, Americans are divided along partisan lines in their views about drivers of political violence. Democrats (80%) are 20 percentage points more likely than Republicans (60%) to agree that the failure of political leaders to condemn violent rhetoric contributes to violent actions in society and are 10 points more likely (72%) than Republicans (62%) to blame false and misleading AI-generated information.
Partisan divides are wider concerning the role that public displays of hate symbols play in provoking political violence, with three in four Democrats (76%) agreeing that such symbols contribute a lot to political violence, compared with roughly half of Republicans (51%).
Republicans are more than 50 percentage points less likely than Democrats to believe that easy access to guns contributes to violent actions in society (28% vs. 81%).
Republicans are also less likely than Democrats to agree that harsh and violent language in politics contributes a lot to violent actions in society (46% to 66%).
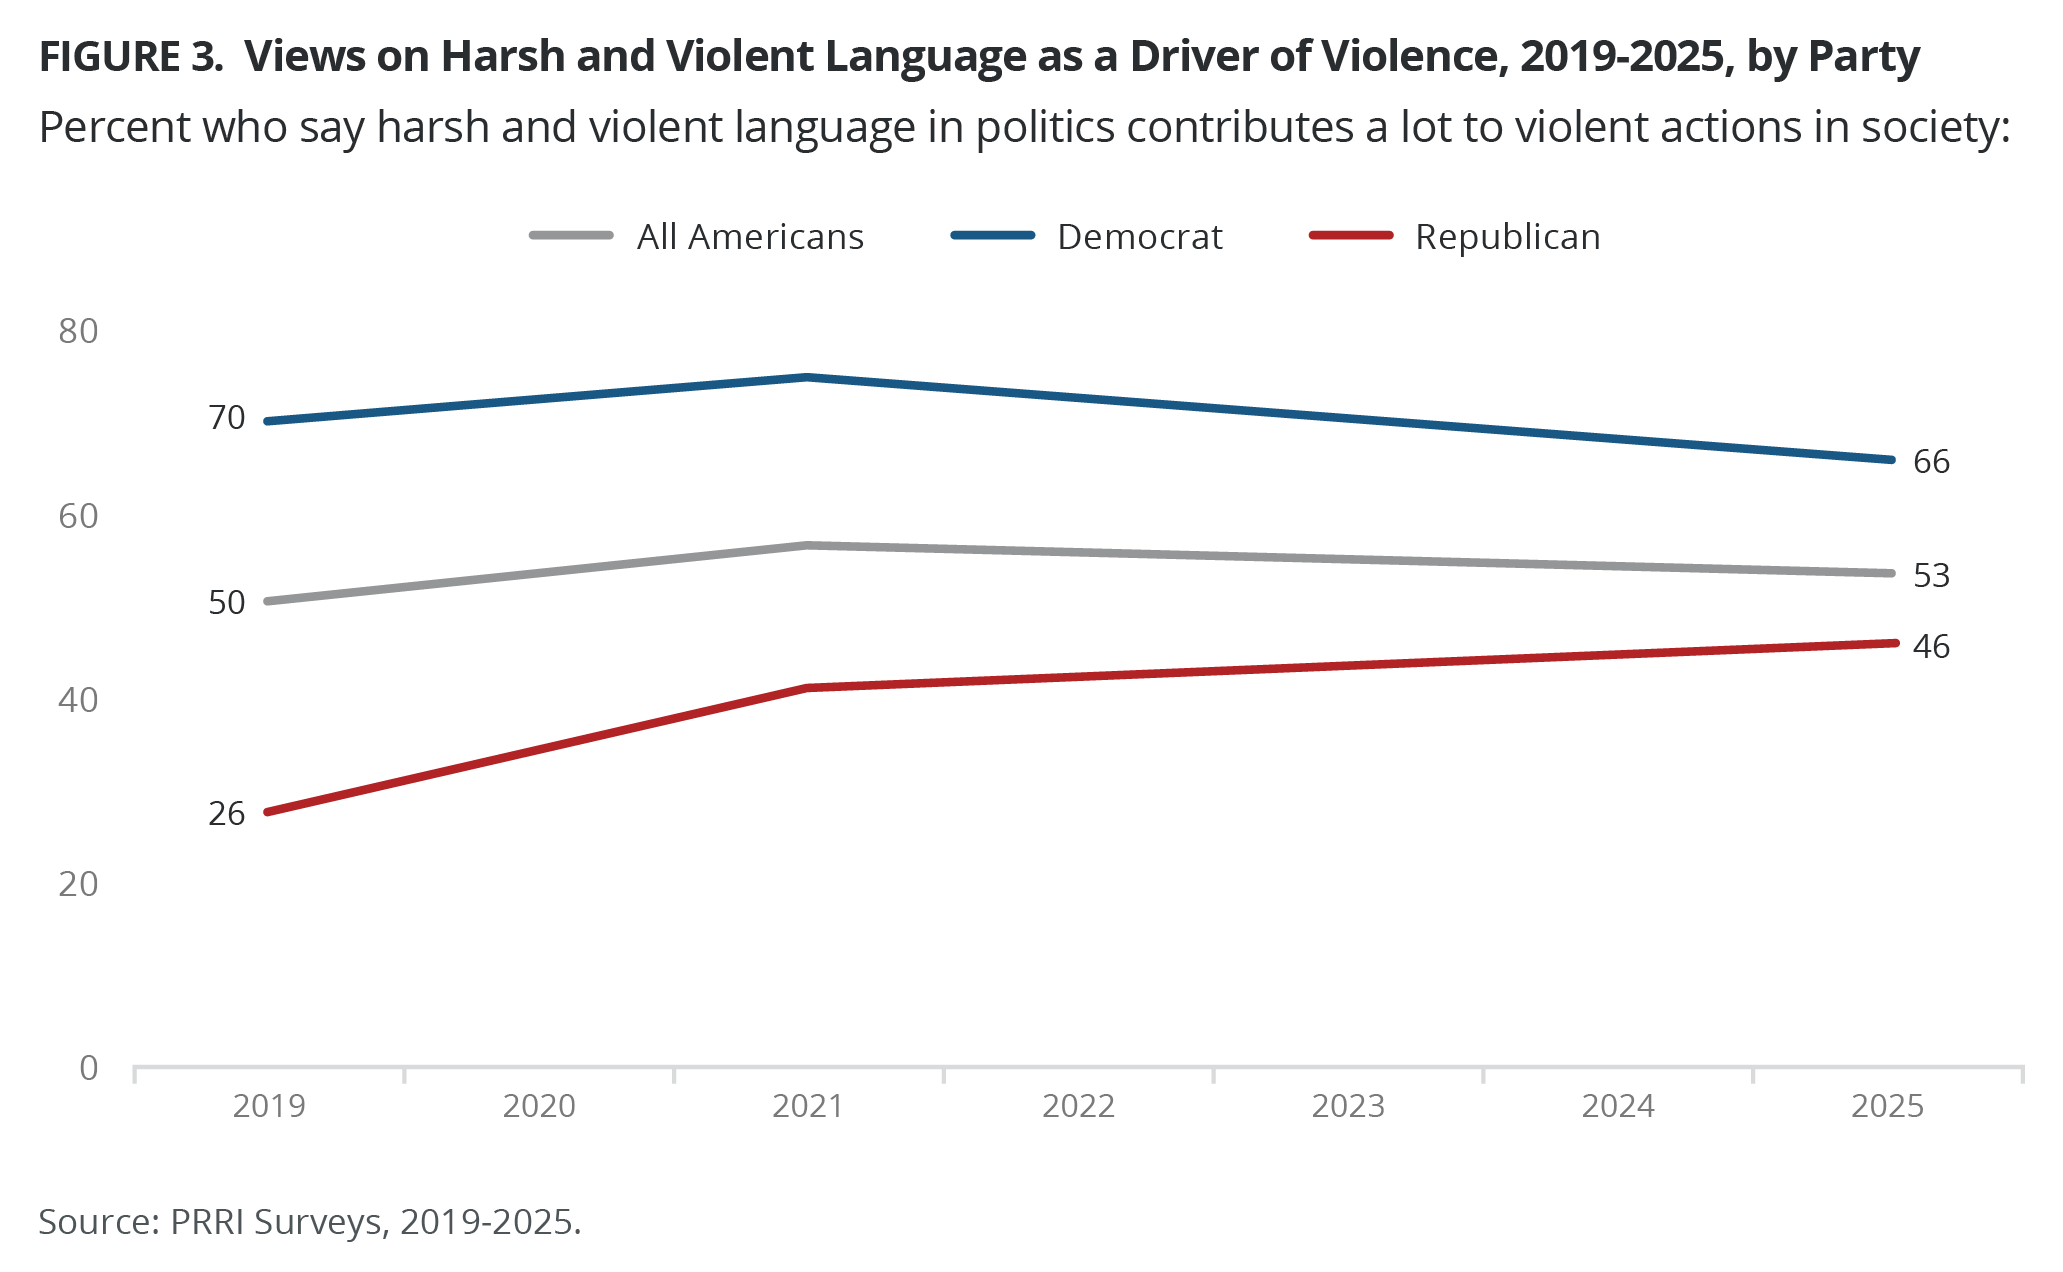
PRRI first began asking Americans their views on the role of harsh and violent language in politics and its link to violent actions in society in September 2019. Since that time, more than half of Americans believe such language contributes to violence, peaking in January 2021 following the Capitol riots, and then returning to slightly lower but still majority levels thereafter. While Democrats have become slightly less likely to say that harsh and violent political language contributes a lot to violent actions in society, Republicans have become 20 percentage points more likely to say so since 2019.
Majorities of all religious groups believe political leaders failing to condemn violent rhetoric of their own followers and false or misleading information and images generated by AI that spread on social media contribute a lot to violent actions in society. Similarly, majorities of all religious groups also agree that the public displays of hate symbols such as Nazi flags and swastikas contribute to political violence, except for Latter-day Saints (46%).

There is more variation across religious groups with respect to harsh and violent language in politics and easy access to guns. Except for white evangelical Protestants (45%), at least half of most religious groups say that harsh and violent language in politics contributes a lot to political violence. White Christian groups are the least likely to agree that easy access to guns contributes a lot to violence in society, with half of white Catholics (50%), 44% of white mainline/non-evangelical Protestants, and roughly one in four Latter-day Saints (28%) and white evangelical Protestants (25%) in agreement.
Across most Christian nationalism, racial, educational attainment, gender, and age groups, majorities believe political leaders failing to condemn violent rhetoric of their own followers, AI-generated false or misleading information that spreads on social media, and public displays of hate symbols such as Nazi flags and swastikas contribute a lot to violent actions in society.[1]
Views are more divided over easy access to guns as a factor in stoking political violence across such groups. Fewer white (45%) and multiracial Americans (48%), as well as Christian nationalism Adherents (36%) and Sympathizers (37%), believe easy access to guns contributes a lot to violent actions in society, compared with majorities of other racial categories and Christian nationalist groups. Fewer than half of non-college graduates (49%), Americans ages 18-29 (44%), and Americans ages 30-39 (45%) agree that harsh and violent rhetoric contributes a lot to political violence.
Belief that all five factors contribute a lot to violent actions in society increases steadily with age, especially among those ages 65 and older, and is consistently higher among women than men.
Justification of Political Violence to Advance Political Goals
Few Americans Support the Use of Violence by Political Allies to Advance Their Political Goals
Very few Americans justify the following actions by people who share their political beliefs to advance important political goals: imprisoning a political opponent without a trial if that person poses a clear danger to the country (12%); damaging or destroying property as a form of protest (7%); pushing, shoving, or punching a political opponent (6%); posting the home address or private phone number of a political opponent online so their family will be harassed (5%); or killing a political opponent if that person poses a clear danger to the country (5%).

There are few differences across party, religion, Christian nationalism groups, race, education, and gender when it comes to agreement that such violent or hostile actions, when committed by people with similar political beliefs, are justified to advance important political goals.
Very few older and younger Americans agree that such violent and hostile actions may be justified to advance political goals. However, while very strong majorities of Americans over the age of 50 disagree that violent and harsh actions may justify political outcomes, such sentiments are less widely shared among younger Americans, especially those under 30.
Roughly half of Americans ages 18-29 completely disagree that damaging or destroying property as a form of protest (50%) or pushing, shoving or punching a political opponent (54%) is justified; nearly six in ten completely disagree that killing a political opponent without a trial if they pose a danger to the country (59%) and doxxing (62%) is justified. Roughly four in ten younger Americans completely disagree that imprisoning a political opponent without a trial if that person poses a clear danger to the country is justified.

Opposition to Political Violence Remains Widespread, Despite Modest Partisan Shifts Since Trump’s First Year in Office
Most Americans (77%) disagree that “because things have gotten so far off track, true American patriots may have to resort to violence in order to save our country,” compared with 20% of those who agree. These percentages have remained stable since the question was first asked in March 2021, except for a peak in support at 23% in 2023.
While there is little difference among Republicans (19%), independents (19%), and Democrats (17%) in support for political violence today, support has varied among Democrats and Republicans since the first time the question was asked in 2021.
During Joe Biden’s presidency, support among Republicans was significantly higher, ranging from a low of 27% to a high of 35% in August 2021. Today, roughly one year into President Donald Trump’s second term, 19% of Republicans agree that true American patriots may have to resort to violence to save the country. Democrats’ support for political violence has been consistently low, ranging from a low of 7% to a high of 13%, but has increased since September 2025 from 12%. Independents’ support for political violence has been consistent since March 2021.

Since early 2021, support for political violence has fluctuated across religious groups. Support for political violence has dissipated among white Christians since Trump’s election in November 2024 — although, overall, support among white evangelical Protestants has tended to be higher. In December 2025, about one-quarter of non-Christians (27%) and Hispanic Catholics (23%) support political violence in order to save the country. Support is lower among unaffiliated Americans (22%), white evangelical Protestants (21%), Black Protestants (17%), white Catholics (15%), and white mainline/non-evangelical Protestants (13%).[2]

Support for political violence has consistently been highest among Christian nationalism Adherents and lowest among Rejecters, with Sympathizers and Skeptics falling in between. From late 2022 through 2025, support among Adherents has declined, while Sympathizers have remained relatively stable, with higher support throughout much of 2024. Support among Skeptics has also remained stable, while support among Rejecters, though still comparatively low, has more than doubled since PRRI first asked this question.
Younger Americans and those without a four-year college degree are more likely than older Americans to agree, “because things have gotten so far off track, true American patriots may have to resort to violence in order to save our country.” It is notable that Americans ages 18-29 have remained relatively stable in their support since PRRI first asked this question in March 2021 (17%), with a peak in the fall of 2023 (25%) and again in December 2025 (27%). Older age groups have also varied over time, with an increase in support since March 2025.
In this survey, we included a wording variation to evaluate whether the question’s use of the term “true American patriots” influences responses: “Because things have gotten so far off track, everyday Americans may have to resort to violence in order to save our country.” Here, we found that 77% of Americans disagree, compared with 21% who agree. Results across party, religion, Christian nationalism groups, race, education, age, and gender do not differ significantly from those for our standard question.
Who Is Responsible for Political Violence?
Are Right-Wing or Left-Wing Groups Most Responsible?
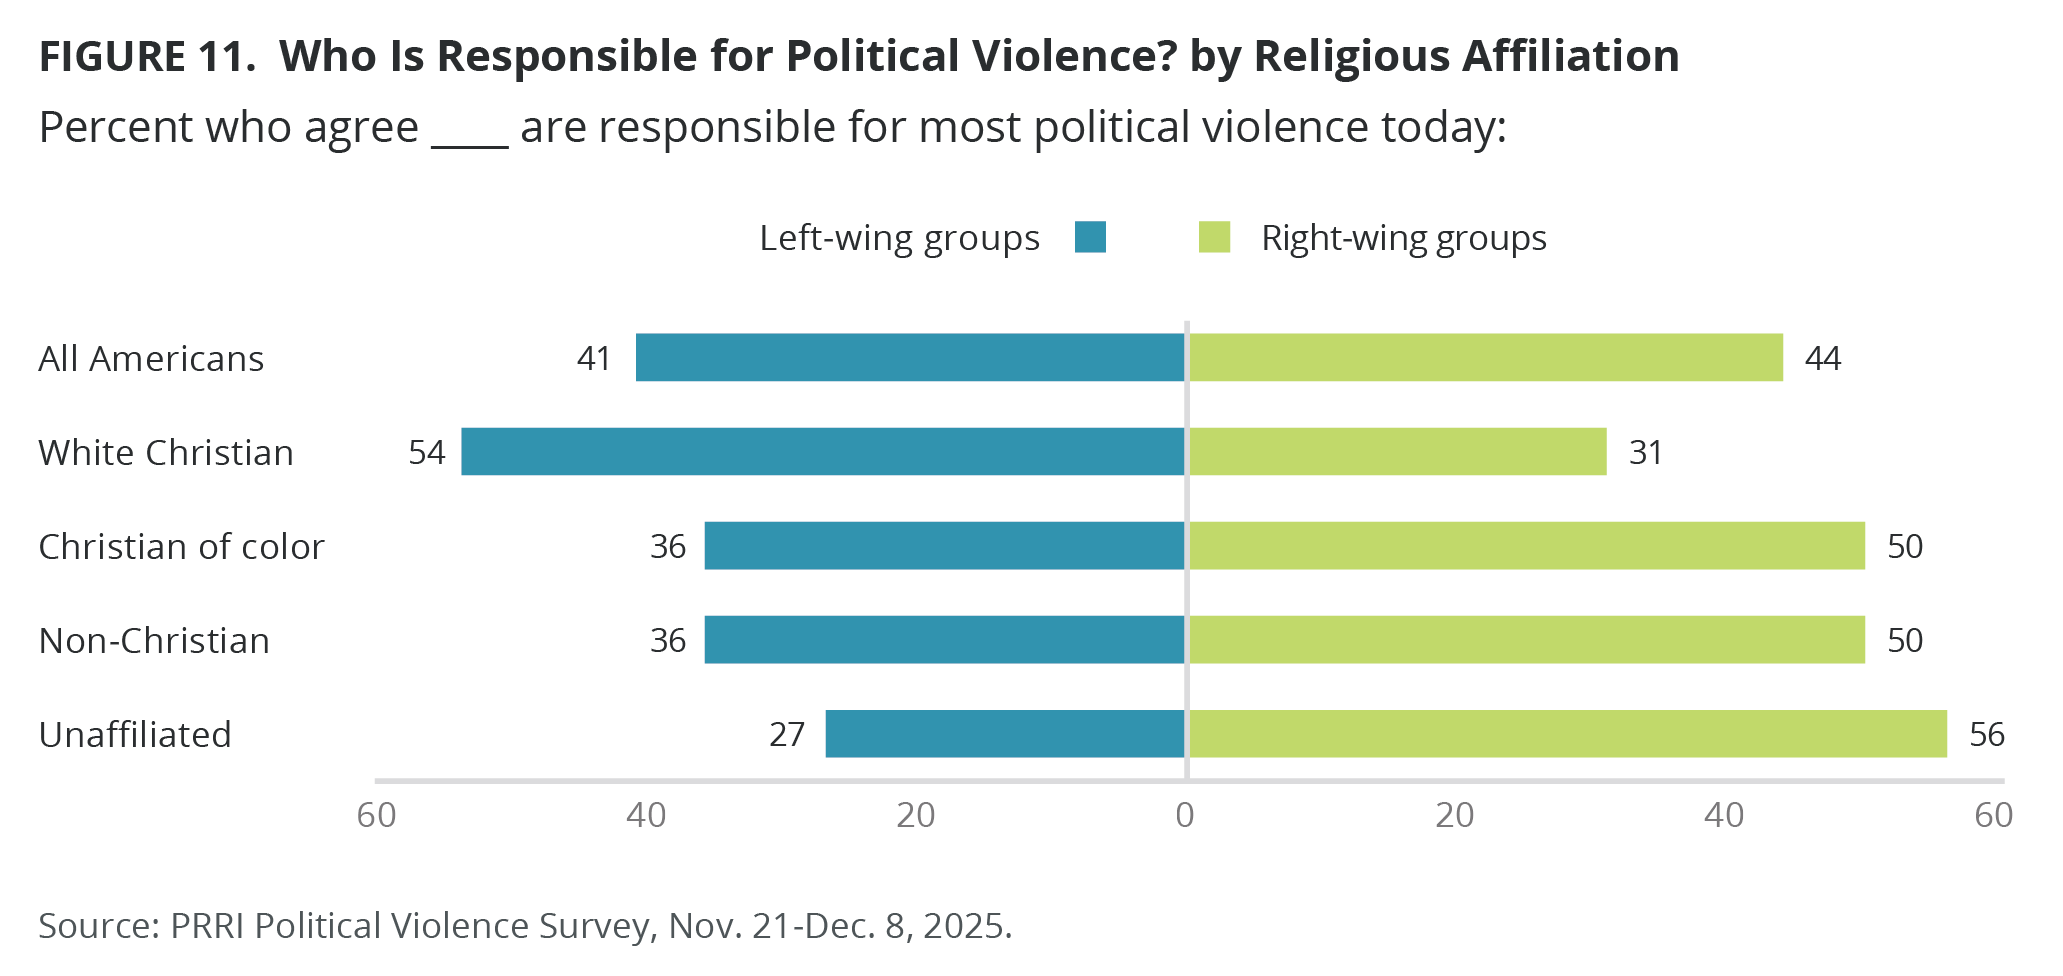
Americans are roughly split as to whether right-wing groups (44%) or left-wing groups (41%) are responsible for most political violence today. However, Democrats overwhelmingly attribute responsibility to right-wing groups (73%), while Republicans attribute responsibility to left-wing groups (72%). Independents are 10 percentage points more likely to say that right-wing groups (45%) are the most responsible for political violence today than left-wing groups (35%).

While both Christians of color and non-Christians are more likely to attribute responsibility to right-wing than left-wing groups for most political violence today (both 50% vs. 36%), white Christian groups attribute more responsibility to left-wing than right-wing groups (54% vs. 31%). Religiously unaffiliated Americans are more than twice as likely to attribute responsibility to right-wing than left-wing groups (56% vs. 27%).
Attribution of blame for political violence differs most dramatically among Christian nationalist groups. Most Christian nationalism Adherents (73%) and Sympathizers (64%) attribute responsibility to left-wing groups, while most Rejecters (72%) attribute responsibility to right-wing groups. Skeptics are divided, with roughly similar shares blaming left-wing (38%) and right-wing (42%) groups.
About half or more Americans of color, including multiracial Americans (48%), Hispanic Americans (49%), Black Americans (51%), and AAPI (53%), attribute more responsibility to right-wing groups than left-wing groups (36% of both Hispanic and multiracial Americans, 29% of AAPI, and 27% of Black Americans), while white Americans attribute more responsibility to left-wing groups (45%) than right-wing groups (39%).
Views of responsibility for political violence slightly differ by education. College graduates are more likely than non-college graduates to attribute responsibility to right-wing groups, while non-college graduates are slightly more likely to blame left-wing groups.
A Slim Majority of Americans Express Concerns About Deploying the National Guard to Patrol American Cities
A slim majority of Americans (52%) agree that the deployment of the National Guard to patrol American cities may cause more violence than it prevents, while 44% disagree — yet both Democrats (80%) and independents (60%) are far more likely to agree than Republicans (23%).

While over six in ten religiously unaffiliated Americans (65%), Christians of color (61%), and non-Christians (61%) agree that deploying the National Guard to patrol American cities may cause more violence than it prevents, just 39% of white Christians share this view. Notably, white evangelical Protestants are the least likely to agree (29%), compared with white Catholics (42%) and white non-evangelical Protestants (44%).
Christian nationalism Rejecters (80%) are the most likely to agree that deploying the National Guard to patrol American cities may cause more violence than it prevents, followed by Skeptics (54%), Sympathizers (37%), and Adherents (26%).

Education, race, and age also shape such attitudes. College-educated Americans, Americans of color, and Americans under 50 are more likely than non-college graduates, white Americans, and Americans over 50 to agree that deploying the National Guard may cause more violence than it prevents.
Views on Trump's Jan. 6 Pardons, Protesters, and Stripping Citizenship
Most Americans Oppose Trump’s Jan. 6 Pardons
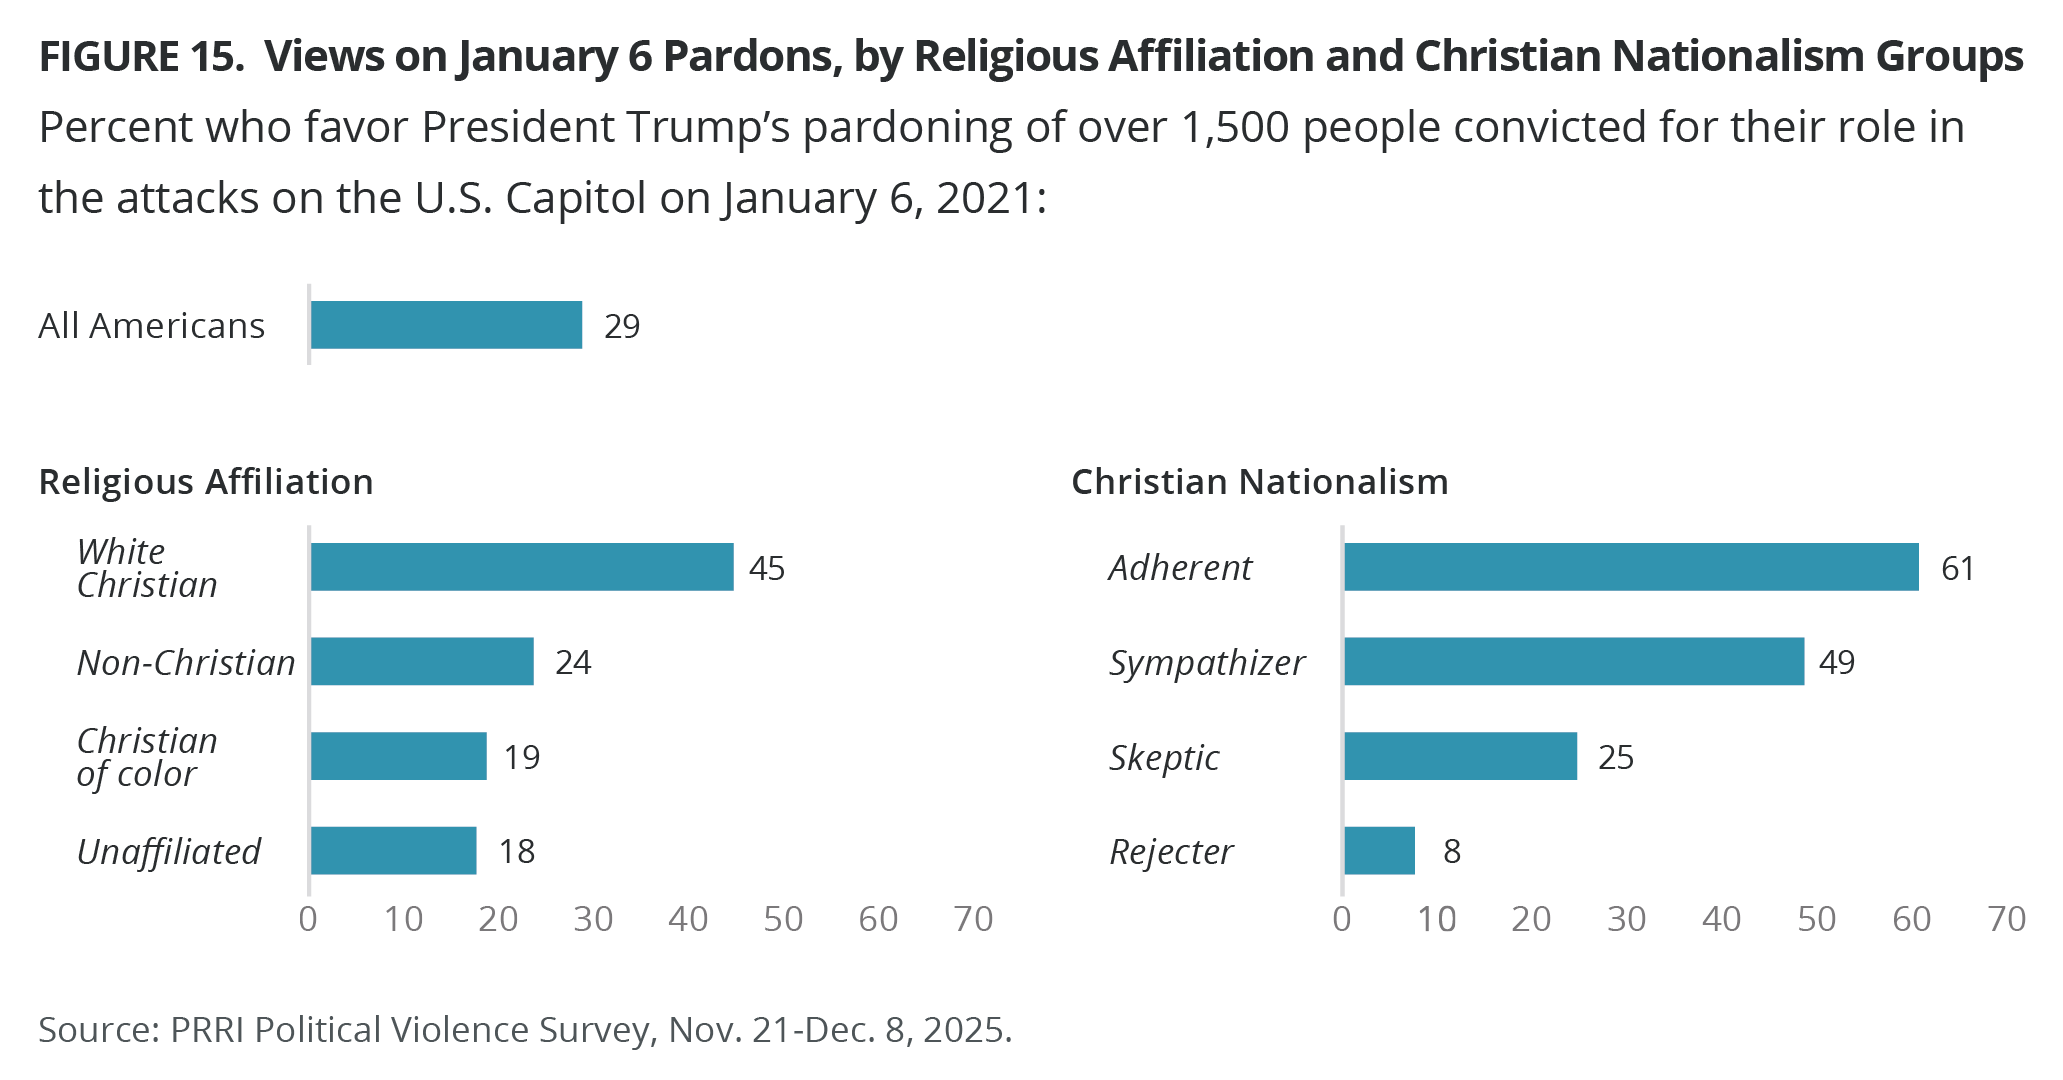
Nearly seven in ten Americans (68%) oppose “President Trump’s pardoning of over 1,500 people convicted for their role in the attacks on the U.S. Capitol on January 6, 2021,” compared with 29% who favor it. Republicans (63%) are far more likely to favor these pardons than independents (22%) and Democrats (4%).

White Christian groups (45%), particularly white evangelical Protestants (58%), are more likely than non-Christians (24%), Christians of color (19%), and unaffiliated Americans (18%) to favor Trump’s Jan. 6 pardons. Similarly, Christian nationalism Adherents (61%) and Sympathizers (49%) are significantly more likely than Skeptics (25%) and Rejecters (8%) to favor these pardons.
Across racial, age, gender, and educational attainment groups, majorities of Americans oppose Trump’s Jan.6 pardons.
Americans who agree that “because things have gotten so far off track, true American patriots may have to resort to violence in order to save our country” are 10 percentage points more likely than those who disagree to favor Jan. 6 pardons (37% vs. 27%).
Most Americans View Protesters as Making Our Country Better
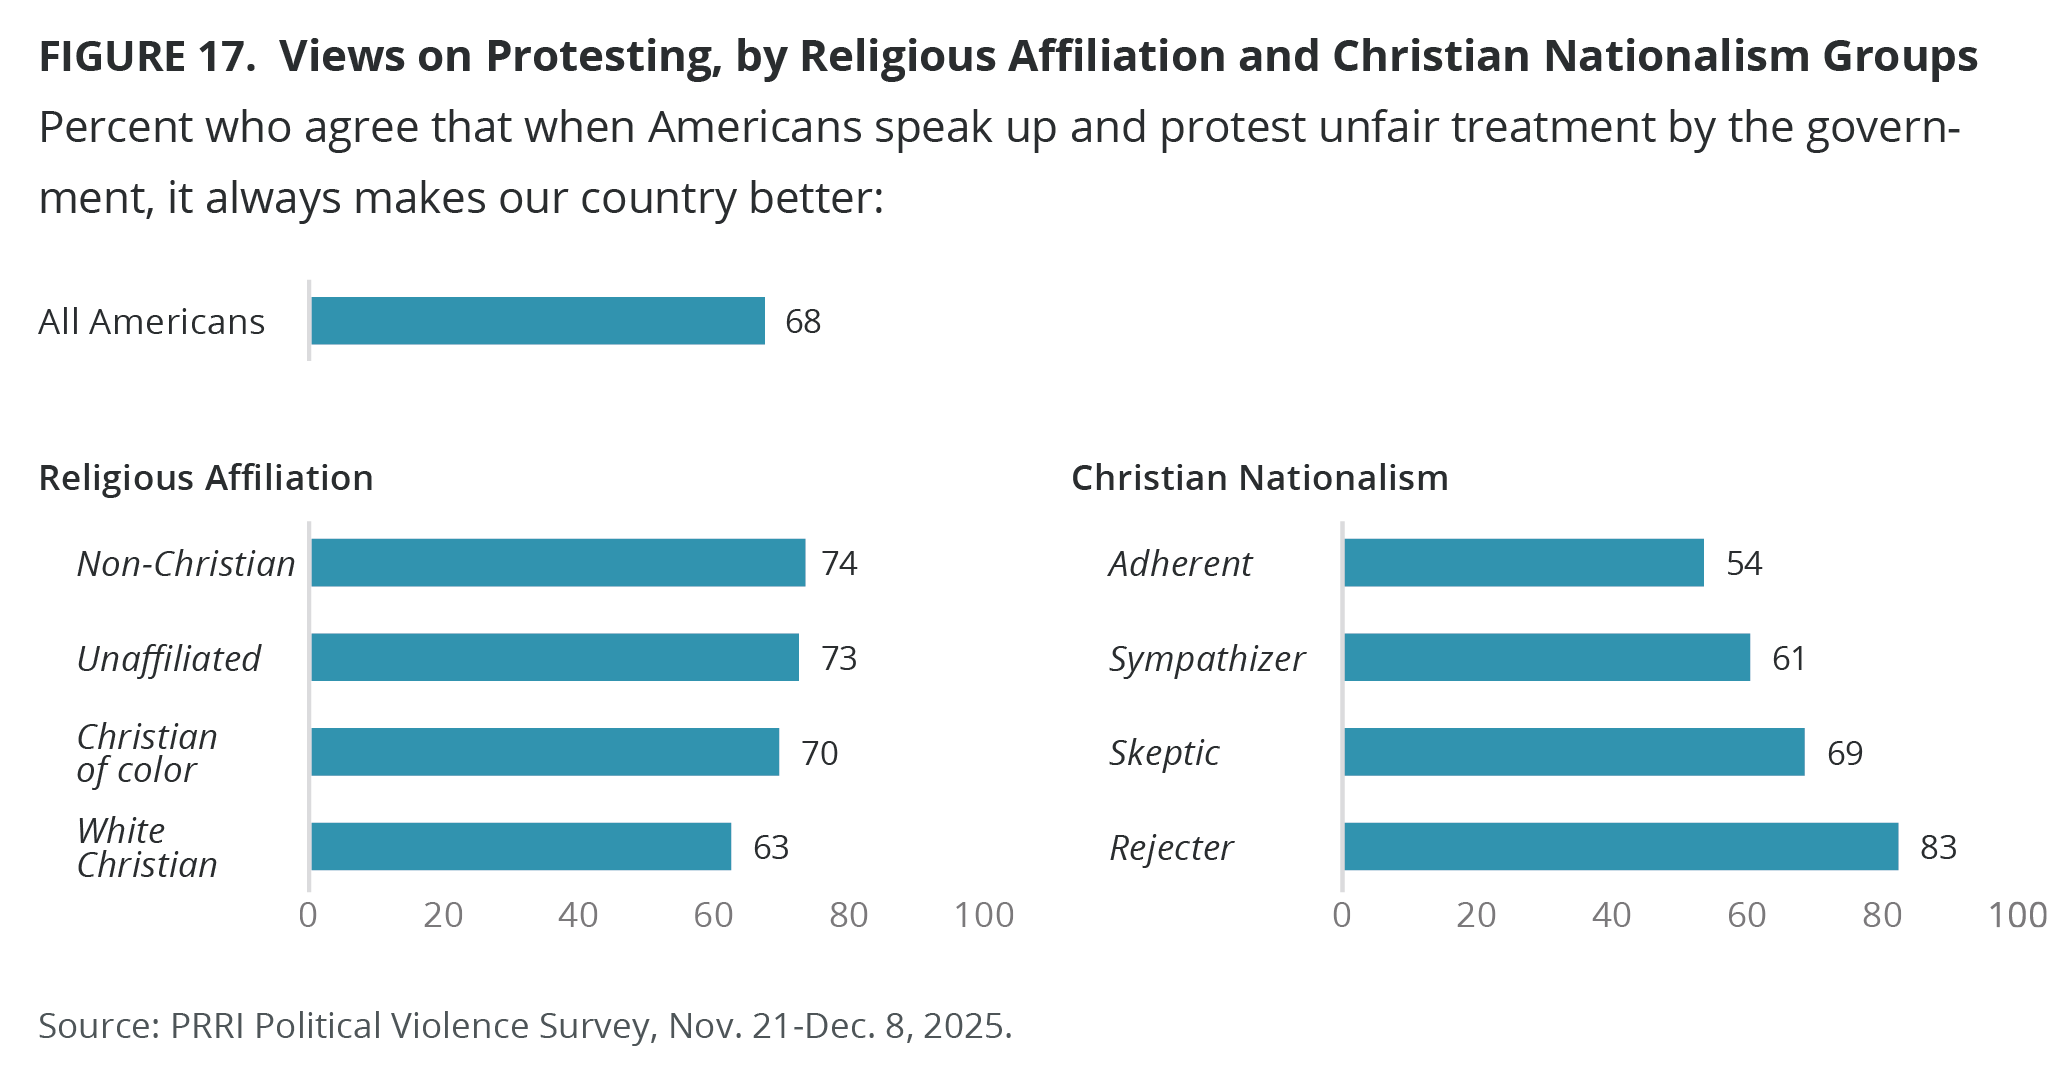
Most Americans (68%) agree that “when Americans speak up and protest unfair treatment by the government, it always makes our country better,” compared with 29% who disagree. Agreement increased since 2015 (63%) when the question was first asked.
Though majorities of partisans agree that protesting unfair treatment by the government makes our country better, Democrats (82%) and independents (72%) are more likely than Republicans (56%) to agree. Agreement has increased consistently among Democrats since 2015, while among Republicans, it declined significantly in 2020 before rising again in 2025. Independents closely mirror all Americans, with slightly higher agreement in 2025.

Solid majorities of all religious groups also agree that protesting unfair treatment by the government makes the country better, though agreement ranges from 59% among white evangelical Protestants to more than 70% among Hispanic Catholics (72%), Black Protestants (72%), religiously unaffiliated Americans (73%), and other non-Christians (77%).
While majorities of Christian nationalism groups also agree that protesting unfair treatment by the government makes our country better, there are significant differences based on groups: Rejecters (83%) are nearly 30 points more likely than Adherents (54%) to agree, compared with 69% of Skeptics (61%) and Sympathizers (61%).
Across racial, age, gender, and educational attainment groups, majorities of Americans agree that speaking up and protesting unfair treatment by the government makes the country better.
Opposition to Stripping Citizenship and Deporting U.S. Citizens Deemed a Threat to the Country Is Widespread, With Some Exceptions
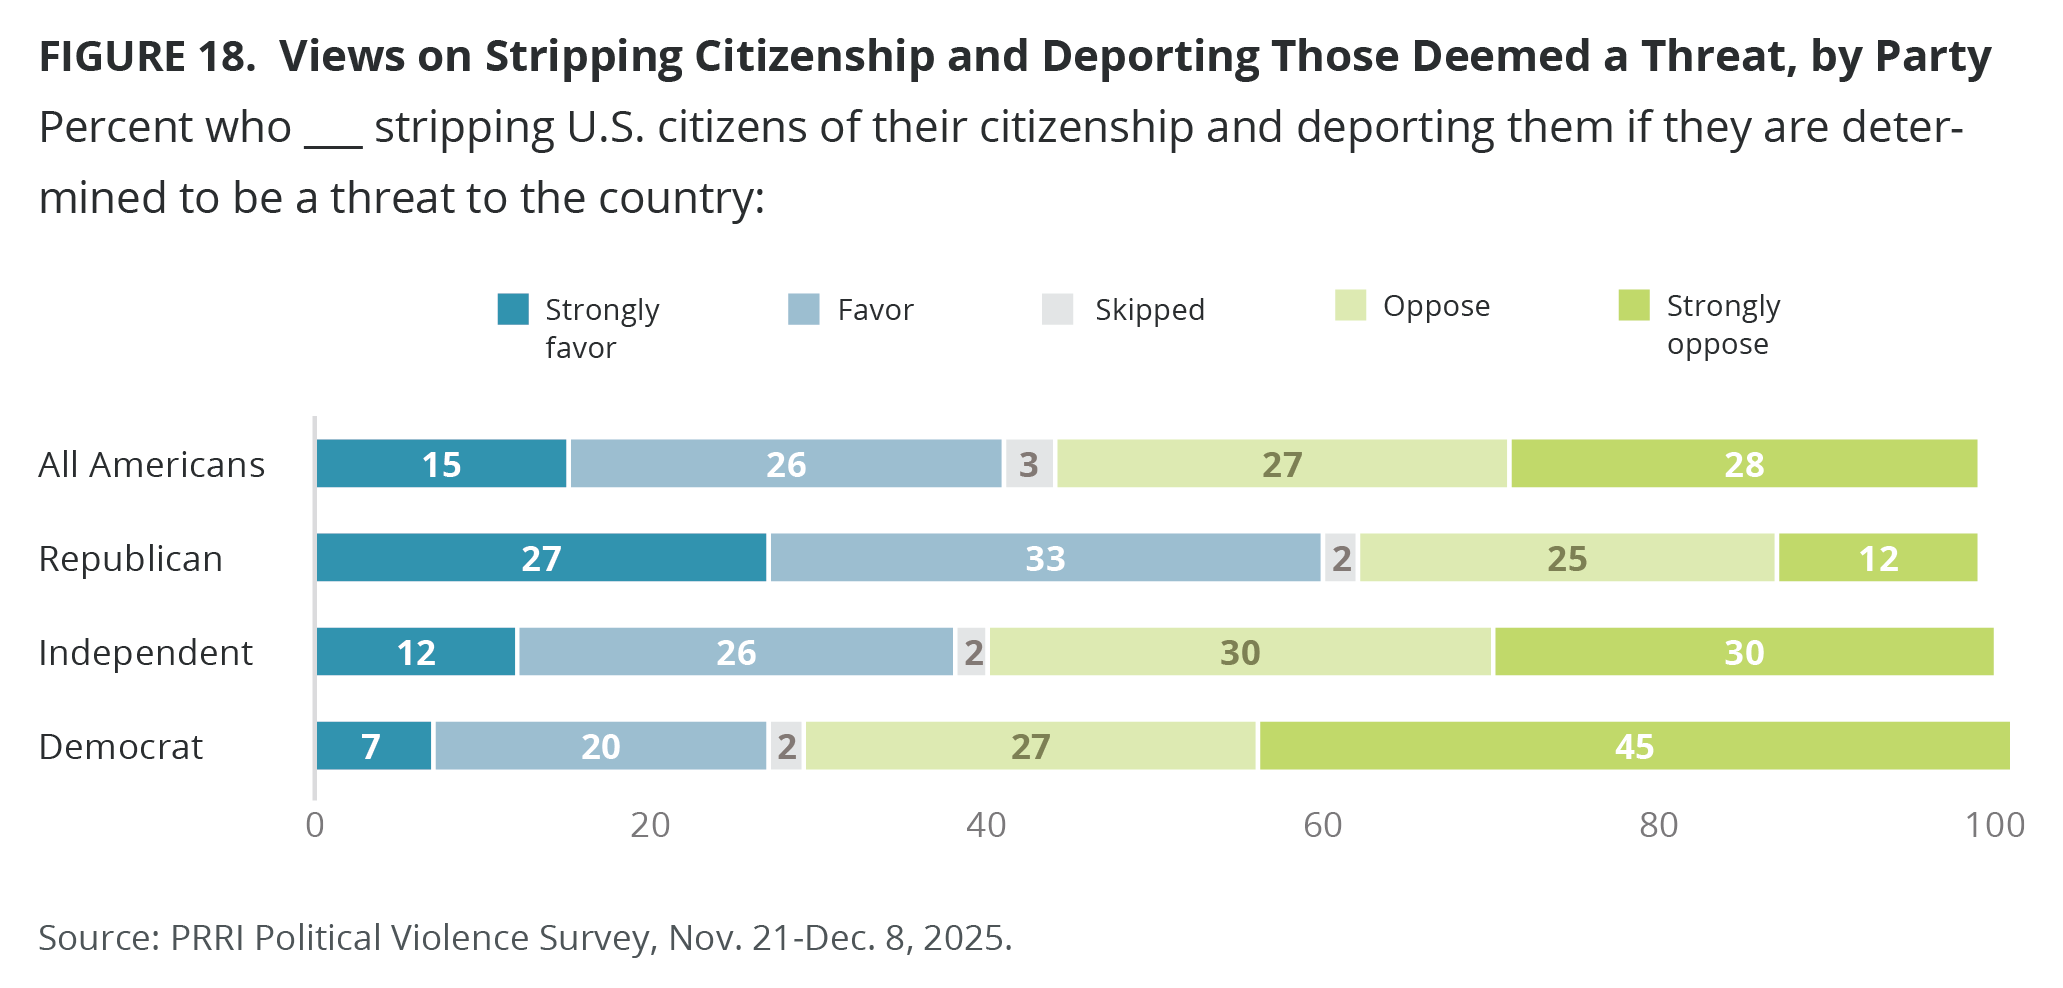
Four in ten Americans (41%) favor “stripping U.S. citizens of their citizenship and deporting them if they are determined to be a threat to the country,” compared with a majority (55%) who oppose this policy. Republicans (60%) are roughly twice as likely as independents (38%) and Democrats (27%) to agree with this policy.
White evangelical Protestants (56%) are the only religious group with majority support for stripping U.S. citizens of their citizenship and deporting them, compared with roughly half of Hispanic Protestants (49%), white Catholics (48%), and white mainline Protestants (46%). Support among other religious groups is notably lower. Christian nationalism Adherents (67%) or Sympathizers (57%) are notably more likely than Skeptics (40%) and Rejecters (23%) to favor stripping U.S. citizens of their citizenship.
College graduates, younger Americans, and men are less likely than non-college graduates, older Americans, and women to favor stripping U.S. citizens of their citizenship.
Americans who agree that “because things have gotten so far off track, true American patriots may have to resort to violence in order to save our country” are about 10 percentage points more likely than those who disagree to favor stripping U.S. citizens of their citizenship if they are determined a threat to the country (51% vs. 40%).
[1] To measure Christian nationalism, PRRI used a battery of five questions based on respondents’ answers to (1) The U.S. government should declare America a Christian nation, (2) U.S. laws should be based on Christian values, (3) If the U.S. moves away from our Christian foundations, we will not have a country anymore, (4) Being Christian is an important part of being truly American, and (5) God has called Christians to exercise dominion over all areas of American society. Each respondent receives a composite score on the Christian nationalism scale (with a range of 0 to 1) and is then assigned to one of the four groups. For more information about how measures are constructed and Christian nationalism more generally, please see our previous reports: A Christian Nation? Understanding the Threat of Christian Nationalism to American Democracy and Culture, Support for Christian Nationalism in All 50 States: Findings from PRRI’s 2023 American Values Atlas, and Christian Nationalism Across All 50 States: Insights from PRRI’s 2024 American Values Atlas.
[2] Jewish Americans are combined with other non-Christians due to low sample size
APPENDIX. Survey Methodology
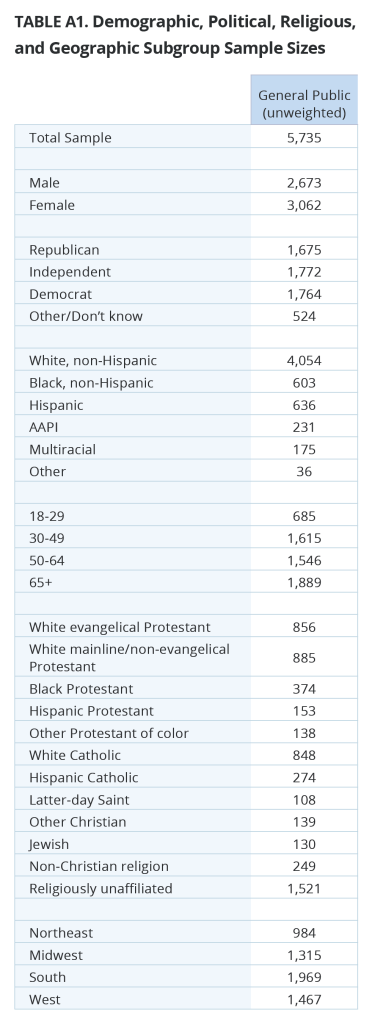
The survey was designed and conducted by PRRI. The survey was conducted among a representative sample of 5,547 adults (age 18 and up) living in all 50 states in the United States, who are part of Ipsos’s KnowledgePanel and an additional 188 who were recruited by Ipsos using opt-in survey panels to increase the sample sizes in smaller states. Interviews were conducted online between November 21 – December 8, 2025.
 Respondents are recruited to the KnowledgePanel using an address-based sampling methodology from the Delivery Sequence File of the USPS – a database with full coverage of all delivery addresses in the U.S. As such, it covers all households regardless of their phone status, providing a representative online sample. Unlike opt-in panels, households are not permitted to “self-select” into the panel; and are generally limited to how many surveys they can take within a given time period.
The initial sample drawn from the KnowledgePanel was adjusted using pre-stratification weights so that it approximates the adult U.S. population. Next, a probability proportional to size (PPS) sampling scheme was used to select a representative sample.
To reduce the effects of any non-response bias, a post-stratification adjustment was applied. The needed benchmarks were obtained from the latest 2024 March supplement of the Current Population Survey (CPS), except language proficiency, which is not available from CPS, and was obtained from the 2023 American Community Survey (ACS). Additionally, the 2024 vote choice benchmark was obtained from the Associated Press Tabulation of Certified Results. The post-stratification weight rebalanced the sample based on the following benchmarks: gender by age, race/ethnicity, education, income, language proficiency, Census region by metropolitan status, and 2024 presidential vote choice. Additionally, we included individual states (50 states plus D.C.) to account for the oversampling of some states.
The margin of error for the national survey is +/- 1.58 percentage points at the 95% level of confidence, including the design effect for the survey of 1.5. In addition to sampling error, surveys may also be subject to error or bias due to question wording, context, and order effects. Additional details about the KnowledgePanel can be found on the Ipsos website: https://www.ipsos.com/en-us/solution/knowledgepanel.


