

President-elect Donald Trump has outlined an aggressive immigration agenda aimed at intensifying border security and enforcing existing laws. Key components of this plan include deporting undocumented immigrants, cutting federal funding to jurisdictions that limit cooperation with immigration authorities, terminating birthright citizenship, and reinstating travel bans on certain countries. While these measures are designed to address concerns among Americans who prioritize stricter immigration control, many Americans remain opposed to such measures. This Spotlight Analysis examines Americans’ views on three specific immigration policies tracked by PRRI over time: (1) providing a pathway to citizenship for undocumented immigrants, (2) granting legal resident status to immigrants brought illegally to the U.S. as children, and (3) building a wall along the U.S. border with Mexico. In addition, through a multivariate analysis, this Spotlight explores how a variety of factors, including political affiliation, religion, and media consumption, shape attitudes toward restrictive immigration policies today.
Immigration Policies
Pathway to Citizenship
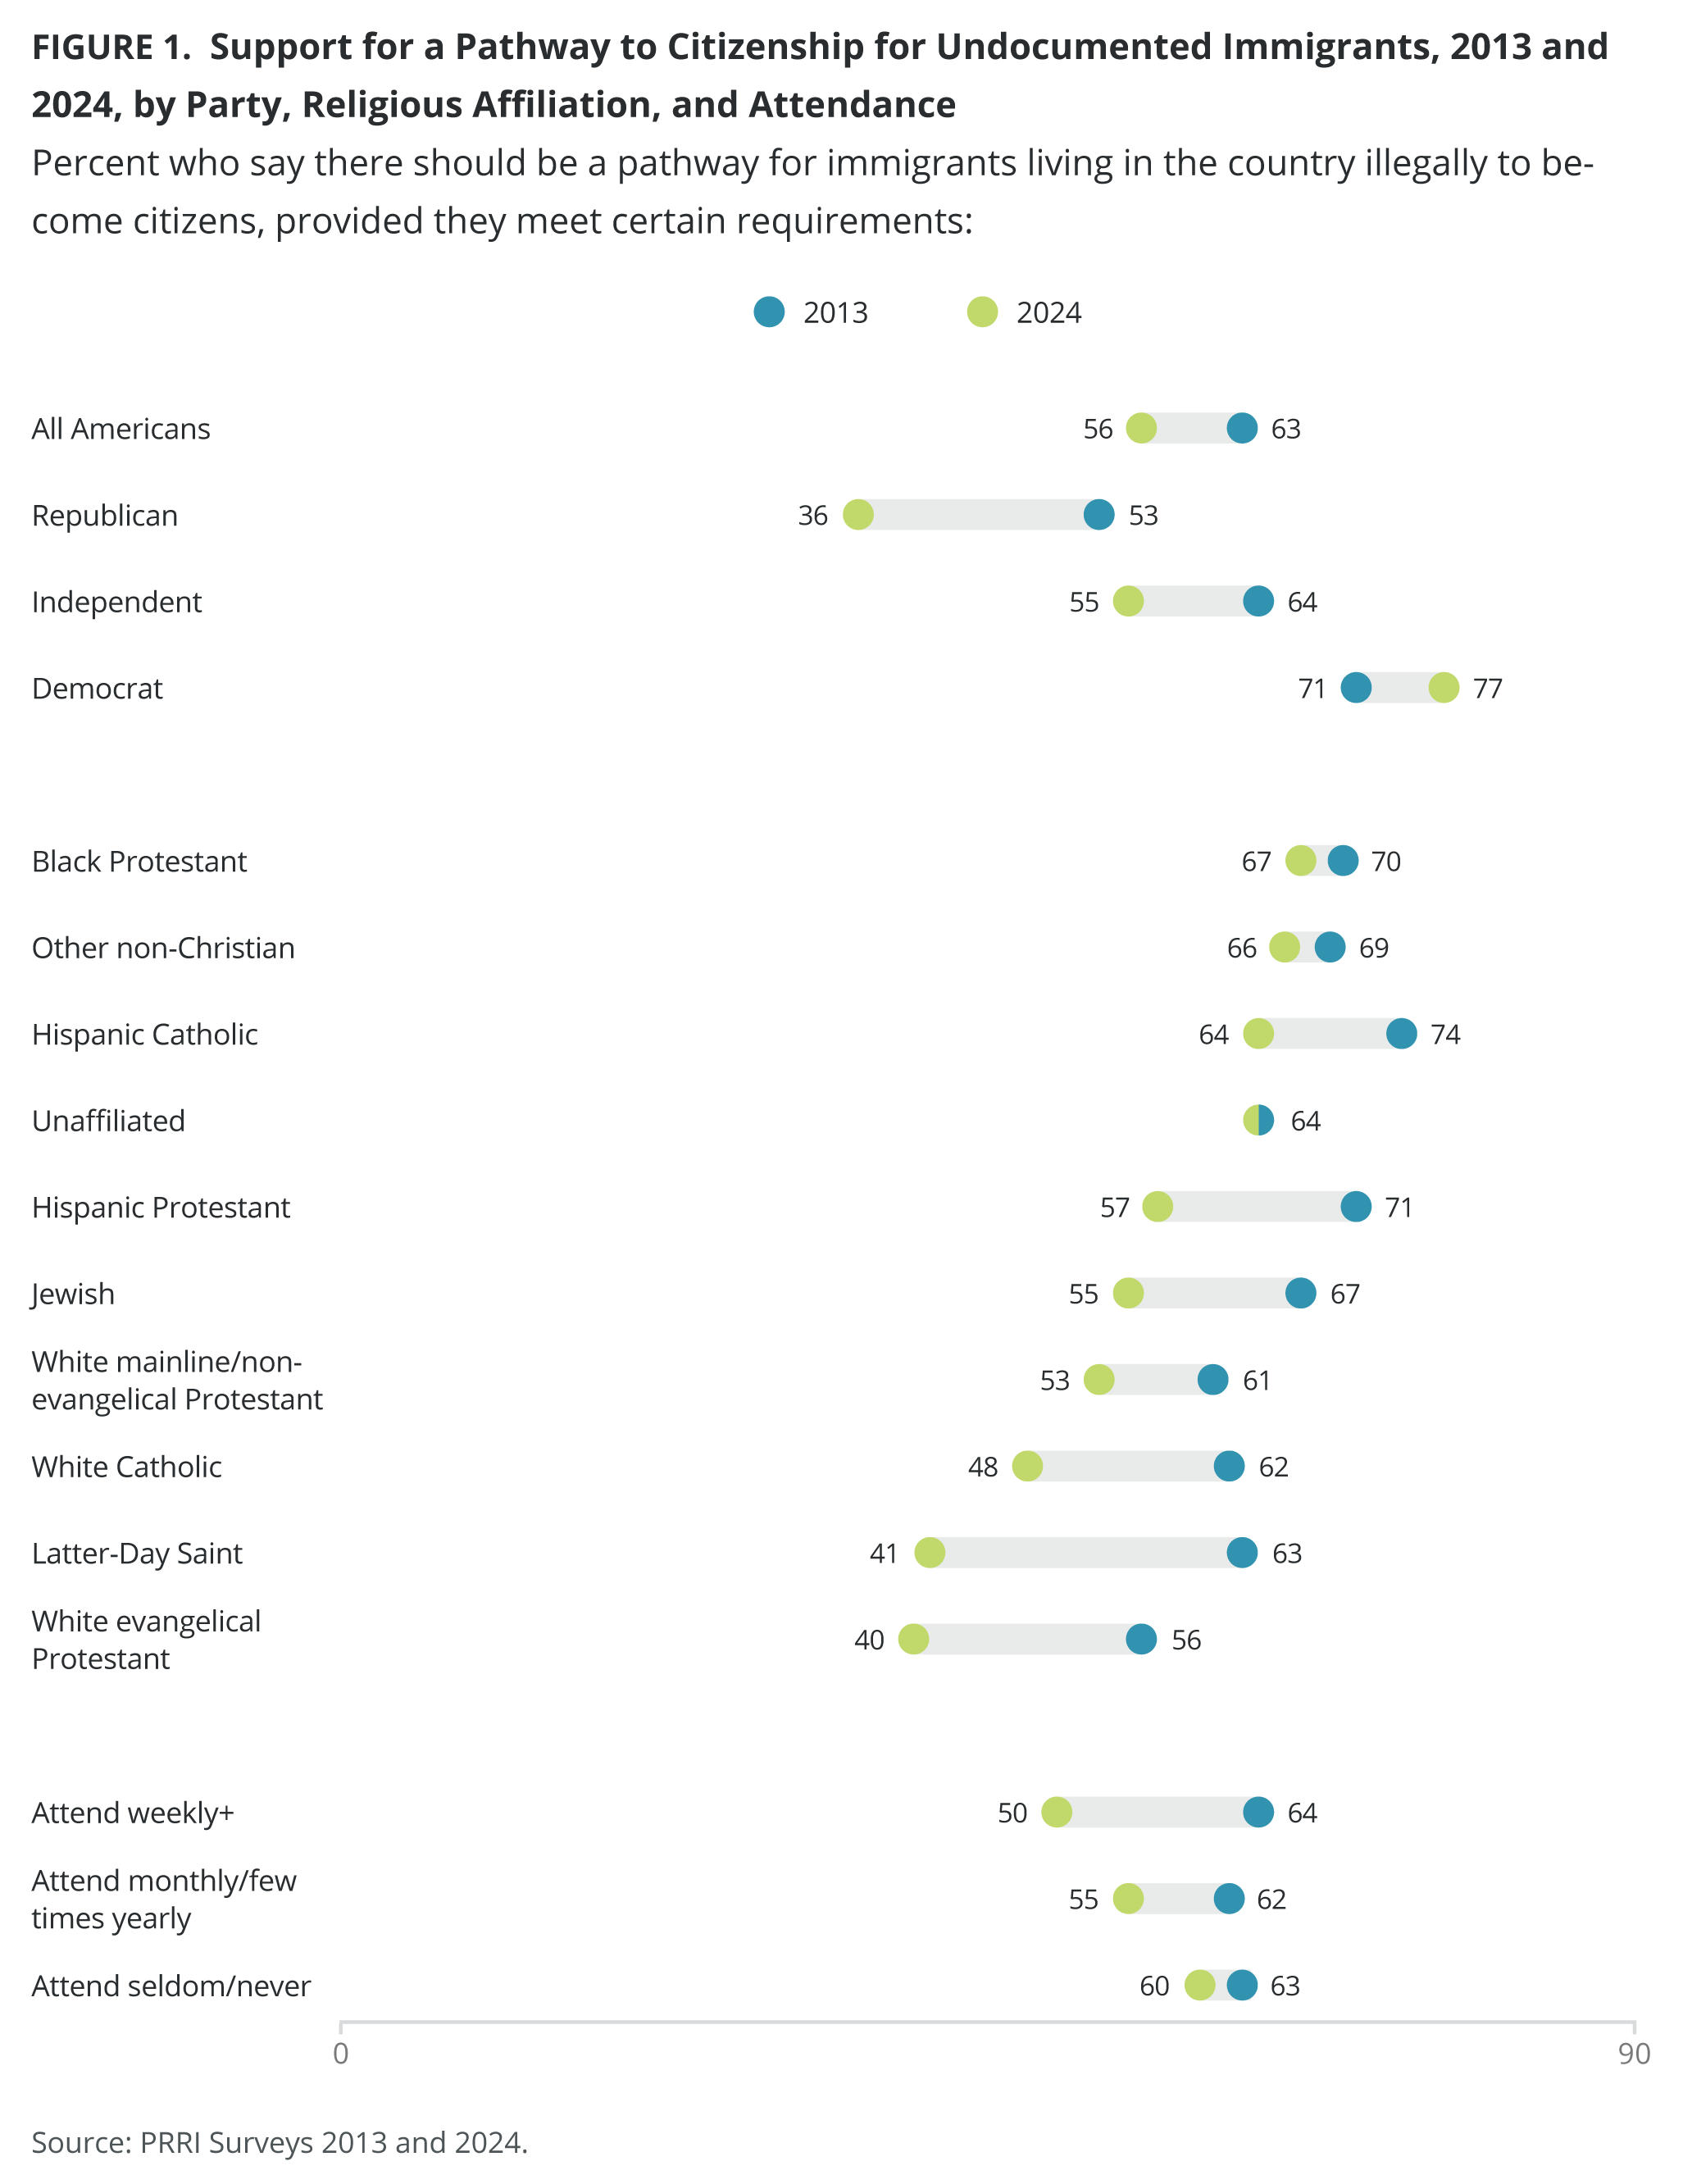
PRRI’s 2024 American Values Survey shows that nearly six in ten Americans (56%) say that immigrants living in the United States illegally should be given a way to become citizens, provided they meet certain requirements. Roughly one in ten say they would prefer undocumented immigrants to be eligible for permanent residency status but not citizenship (11%), and three in ten say all immigrants living in the country illegally should be identified and deported (31%). Though the majority of Americans continue to support a pathway to citizenship for undocumented immigrants, support has declined from 63% in 2013, when the question was first asked.
Democrats (77%) have grown more supportive of a pathway to citizenship for undocumented immigrants over the past decade, with support increasing from 71% in 2013. In contrast, Republicans (36%) have become notably less supportive than they were in 2013 (53%). Today, 7% of Republicans say they would prefer undocumented immigrants to be eligible for permanent residency status but not citizenship, and the majority say all immigrants living in the U.S. illegally should be deported (57%), a substantial increase from 32% in 2013.
The majority of religious groups support providing a pathway to citizenship for undocumented immigrants, with the highest support among Black Protestants (67%), other non-Christians (66%), religiously unaffiliated Americans (64%), and Hispanic Catholics (64%). A majority of Hispanic Protestants (57%), Jewish Americans (55%), and white mainline/non-evangelical Protestants (53%) also express support, while white Catholics are more divided, with 48% in favor. Latter-day Saints (41%) and white evangelical Protestants (40%) stand out as the only religious groups in which a majority opposes a pathway to citizenship, and their support has declined significantly since 2013, from 63% and 56%, respectively.[1] Other religious groups that have also experienced substantial declines in support since 2013 include white Catholics (from 62%) and white/non-evangelical Protestants (from 61%).
A majority of Americans who attend religious services seldom or never (60%) and those who attend monthly or a few times a year (55%) support a pathway to citizenship, compared with half of those who attend services weekly or more (50%). Support among regular attendees has declined significantly since 2013, dropping from 64% among weekly attendees and from 62% among those attending monthly or a few times a year.
DACA: Allowing Children Brought to the U.S. Illegally to Become Citizens
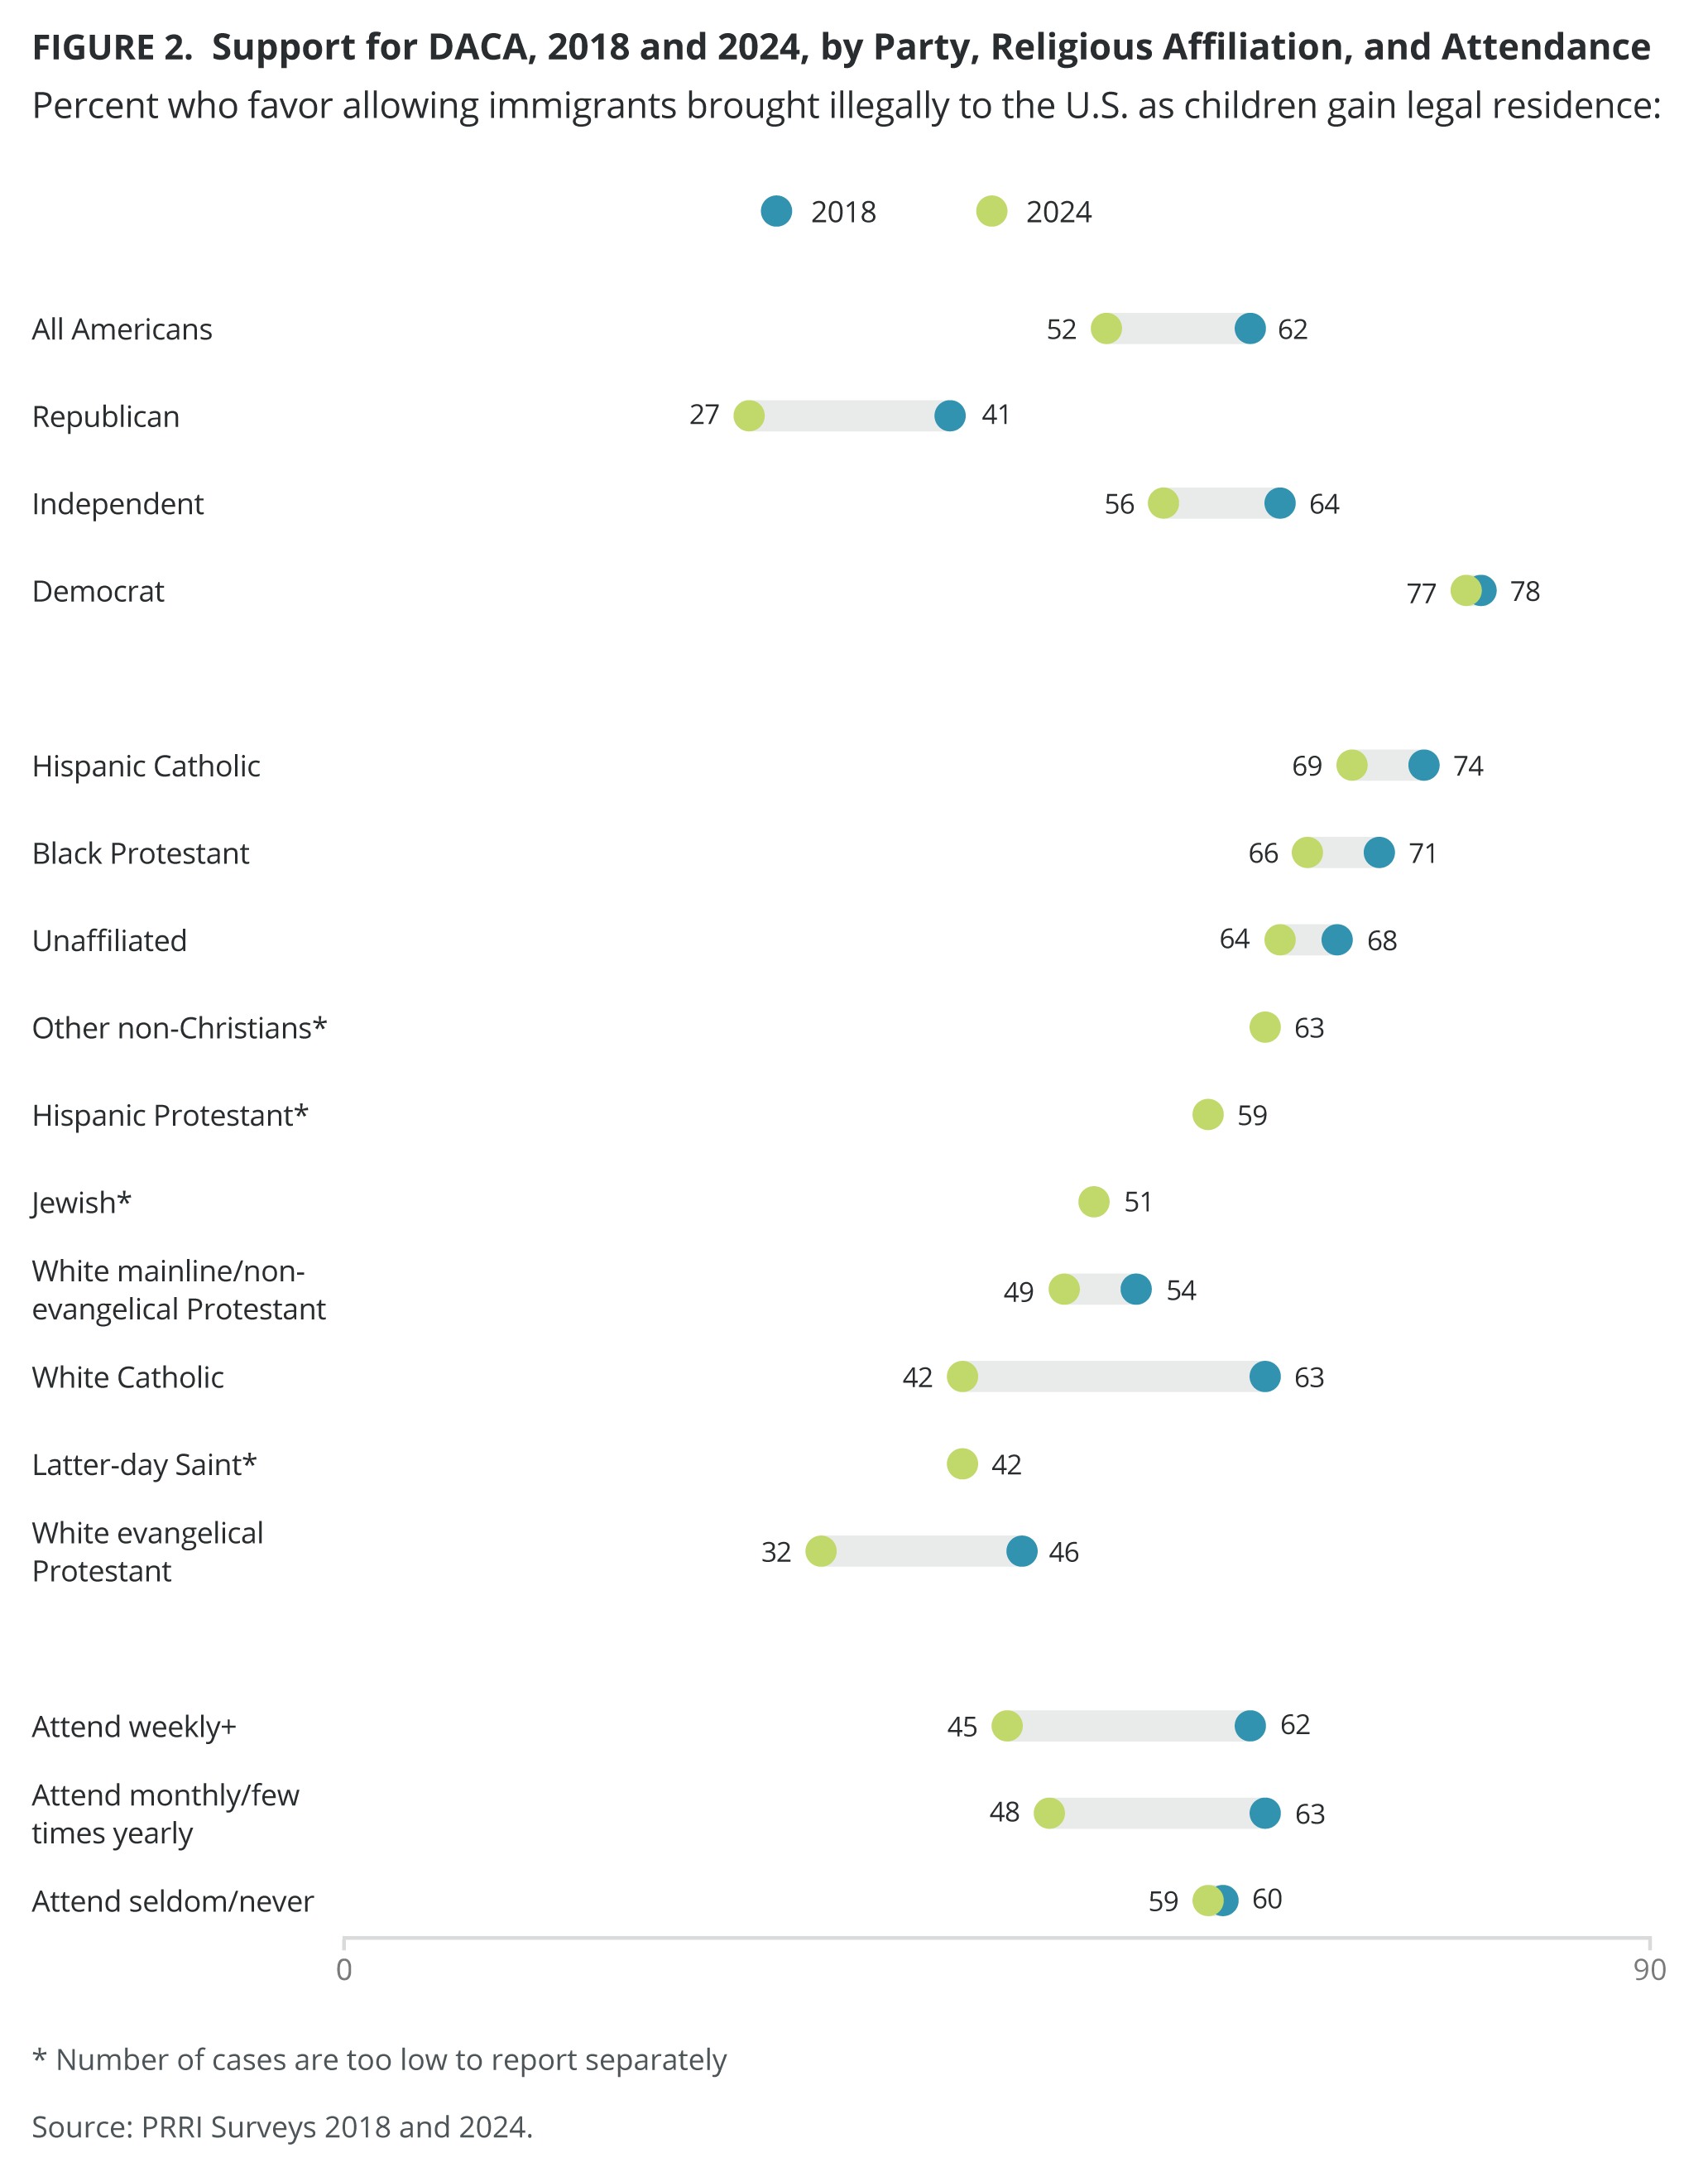
A slim majority of Americans (52%) favor allowing immigrants brought illegally to the U.S. as children to gain legal resident status, while 44% oppose this policy. Support for this policy has declined by 10 percentage points since the first time PRRI asked the question in 2018 (62%).
Partisan divisions remain stark, with over three-quarters of Democrats (77%) supporting legal resident status for children brought to the U.S. illegally, compared with 56% of independents and 27% of Republicans. Support among Republicans has seen a significant decline, dropping from 41% in 2018. While a majority of independents continue to support this policy, their support has also declined from 64% in 2018 to 56% in 2024.
Support for granting legal resident status to children brought to the U.S. illegally is divided along religious and racial lines. A plurality of white Christian groups support the policy, including 49% of white mainline/non-evangelical Protestants, 42% of white Catholics and Latter-day Saints, and only 32% of white evangelical Protestants. In contrast, all major non-white Christian groups show majority support, with 69% of Hispanic Catholics, 66% of Black Protestants, and 59% of Hispanic Protestants in favor. Additionally, support is strong among non-Christian groups, with 64% of religiously unaffiliated Americans, 63% of those belonging to other non-Christian religions, and 51% of Jewish Americans supporting the policy. Support for this policy went down significantly since 2018 among white Catholics (from 63%) and white evangelical Protestants (from 46%).
The majority of Americans who seldom or never attend religious services (59%) support this policy, compared with under half of those who attend monthly or a few times a year (48%) or weekly or more (45%). Support among regular attendees has declined significantly since 2018, dropping from 62% among weekly attendees and from 63% among those attending monthly or a few times a year.
Building a Wall on America’s Southern Border and Views on Other Immigration Policies
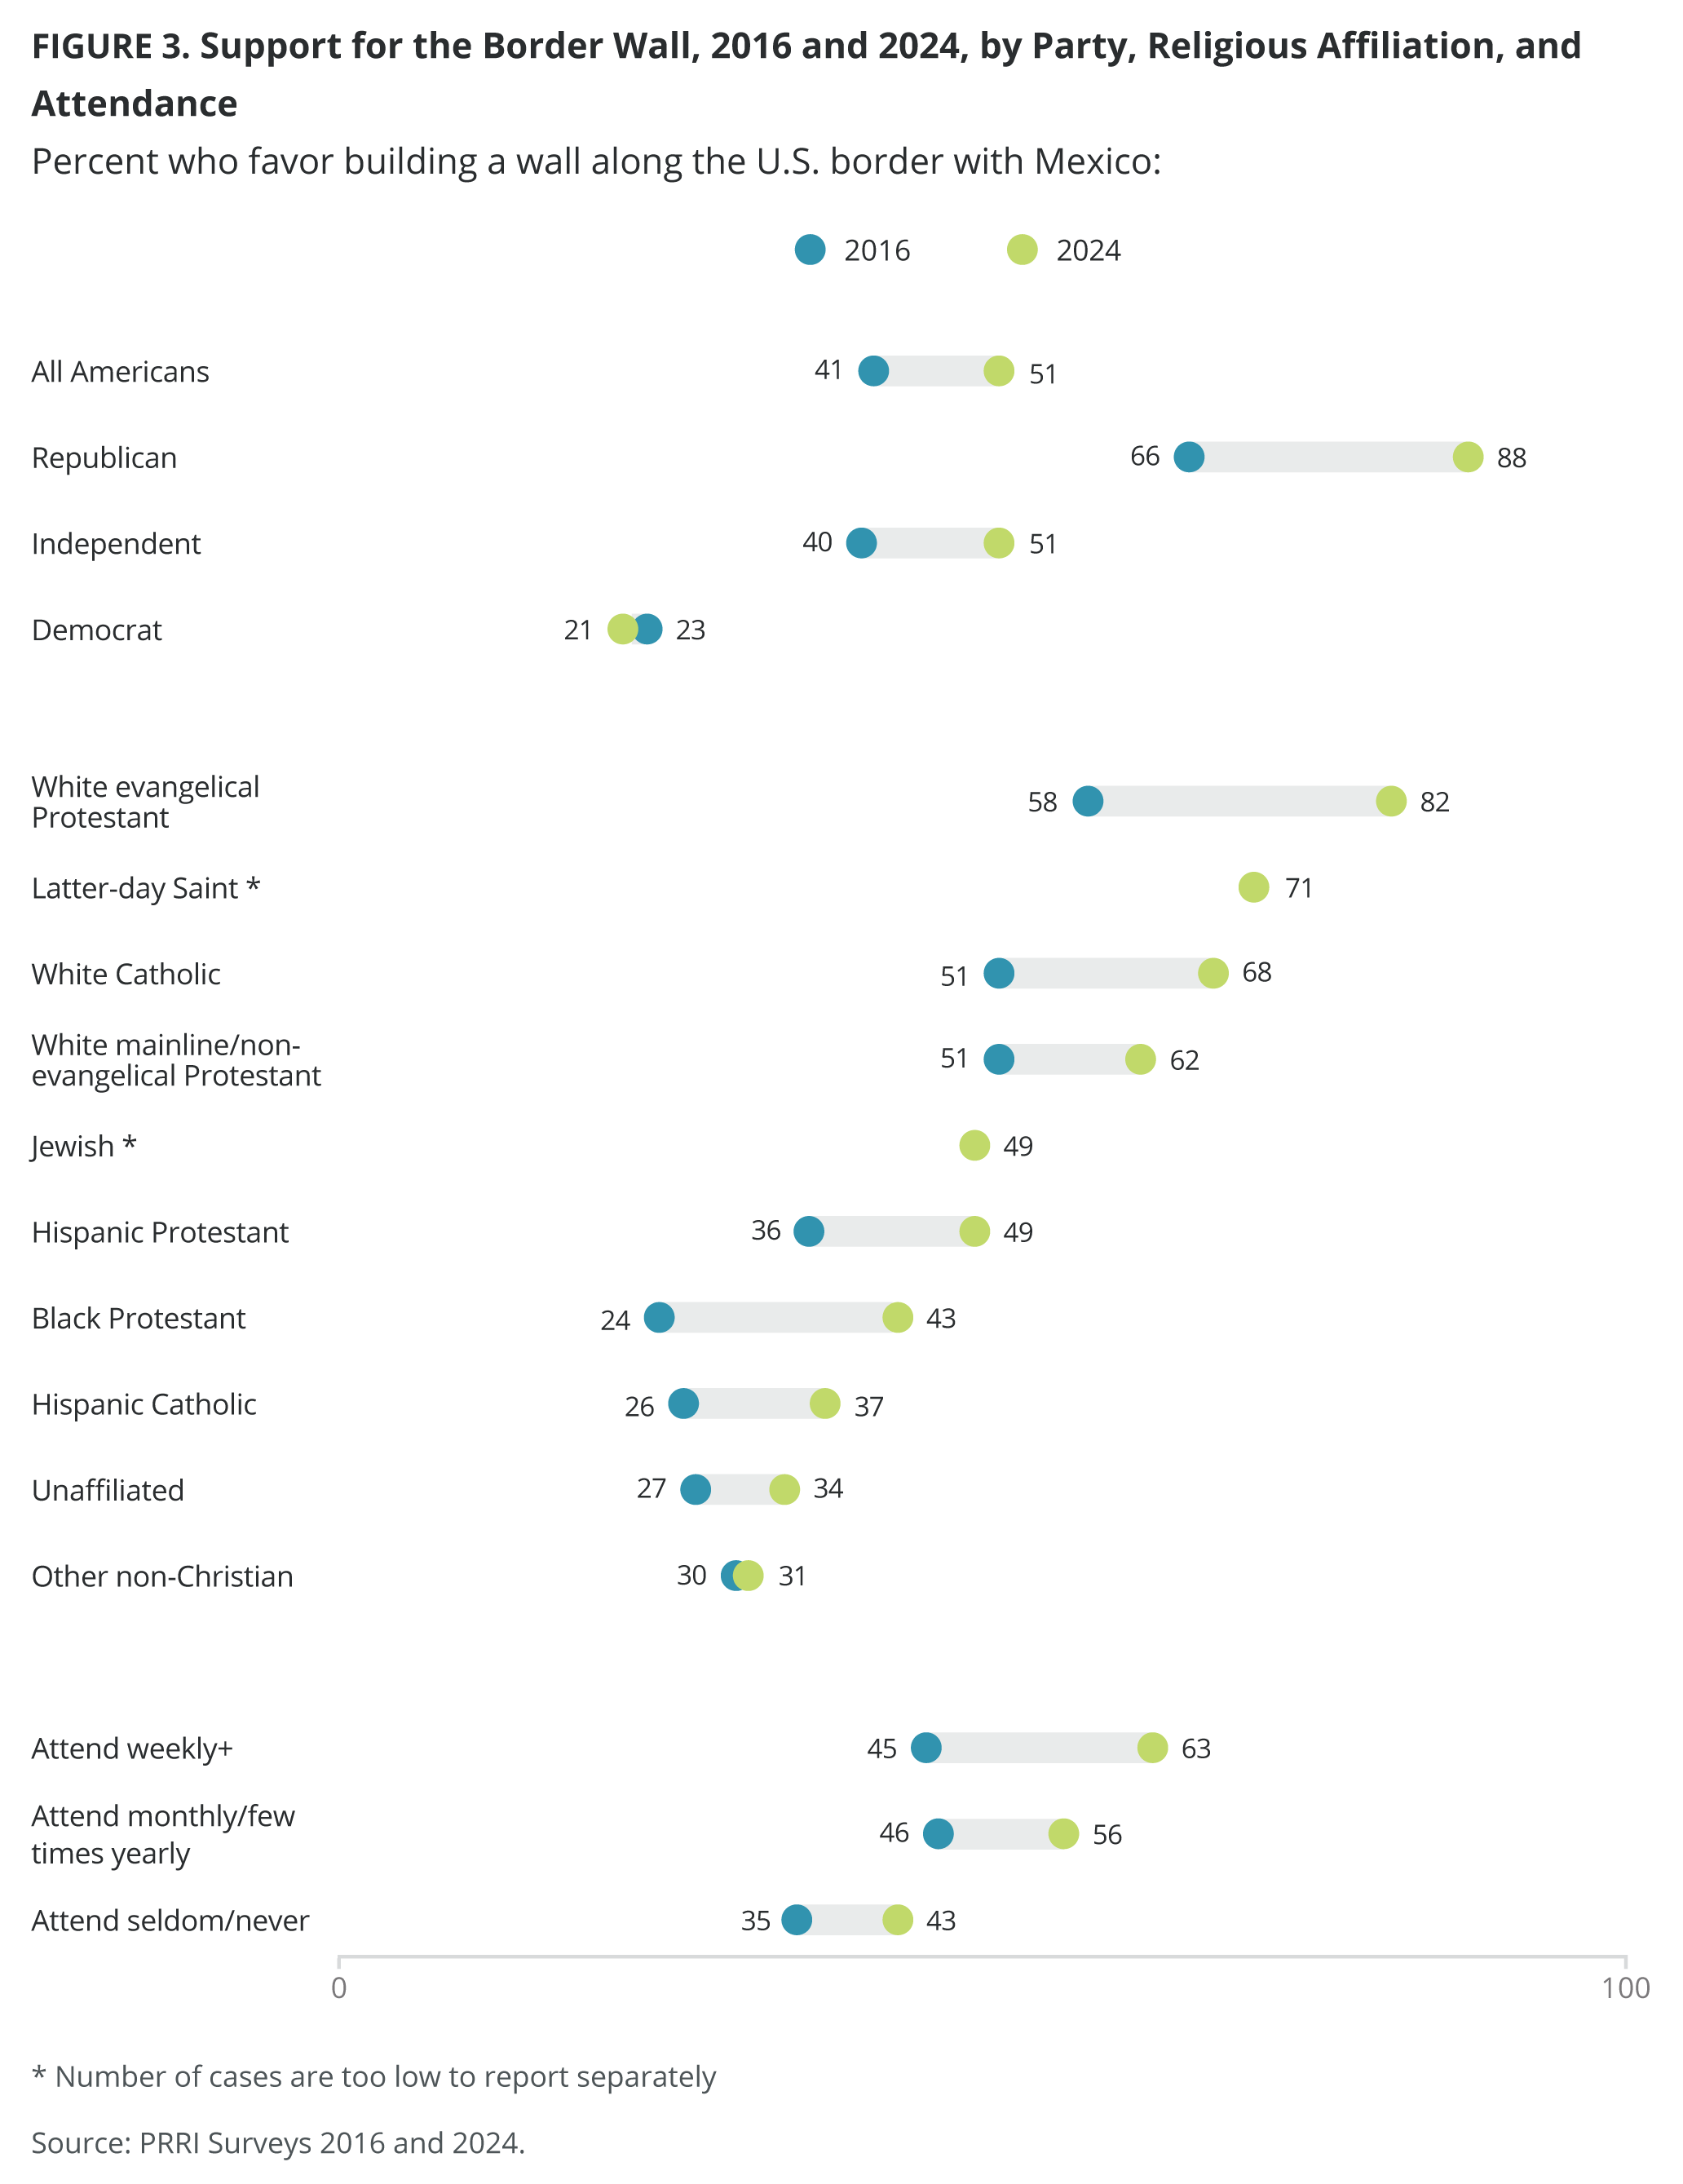
Americans are divided over whether they favor (51%) or oppose (46%) building a wall along the U.S. border with Mexico. Support for this policy has grown by 10 percentage points from 41% since 2016 when the question was first asked. Americans living in states that border Mexico are less likely to agree with this policy than Americans living elsewhere (43% vs. 53%).[2]
Support for building the wall has remained consistently high among Republicans since 2016, increasing significantly from 66% to 88% in 2024. Among independents, support has also seen a notable increase, growing from 40% in 2016 to 51% in 2024. In contrast, support among Democrats has remained relatively unchanged, with only about two in ten supporting this policy (21% in 2024; 23% in 2016).
Media viewership plays a significant role in shaping public opinion on immigration policy. Nearly all Americans who primarily trust far-right news sources (96%) and a substantial majority of those who most trust Fox News (86%) support building a wall. In contrast, support is considerably lower among those who do not watch TV news (47%) and those who primarily rely on mainstream TV news (40%).
White evangelical Protestants show the highest support for building a wall on the Southern border (82%), followed by Latter-day Saints (71%) and white Catholics (68%). White mainline/non-evangelical Protestants also show relatively high support at 62%. In contrast, Jewish and Hispanic Protestant groups demonstrate moderate support, both at 49%. Black Protestants (43%), Hispanic Catholics (37%), unaffiliated Americans (34%), and other non-Christians (31%) show low support. Support for building a wall on the Southern border has significantly increased since 2016 across all religious groups except for the religiously unaffiliated.
While only a plurality of Americans who attended religious services weekly or more (45%) supported this policy in 2016, that number has risen to 63%, with a similar increase among those who attend monthly or a few times a year, from 46% in 2016 to 56%. In contrast, fewer Americans who seldom or never attend religious services support this policy (43%), although their support has also grown from 35% over the same period.
Drivers of Americans’ Views on Immigration Policy
To understand the drivers of Americans’ views on restrictive immigration policies, a comprehensive scale was developed by combining responses to all three policies. The scale assigns a score of 3 to individuals who support deportations, building a border wall, and oppose the legalization of undocumented immigrants brought to the U.S. as children. A score of 2 indicates support for any two of these policies, while a score of 1 reflects support for one policy, and a score of 0 represents opposition to all restrictive measures.[3] Analysis of this scale reveals that one in four Americans (24%) fully support all three policies, while approximately four in ten back one (22%) or two (18%) of the policies. Nearly four in ten Americans (36%) do not support any restrictive immigration measures.
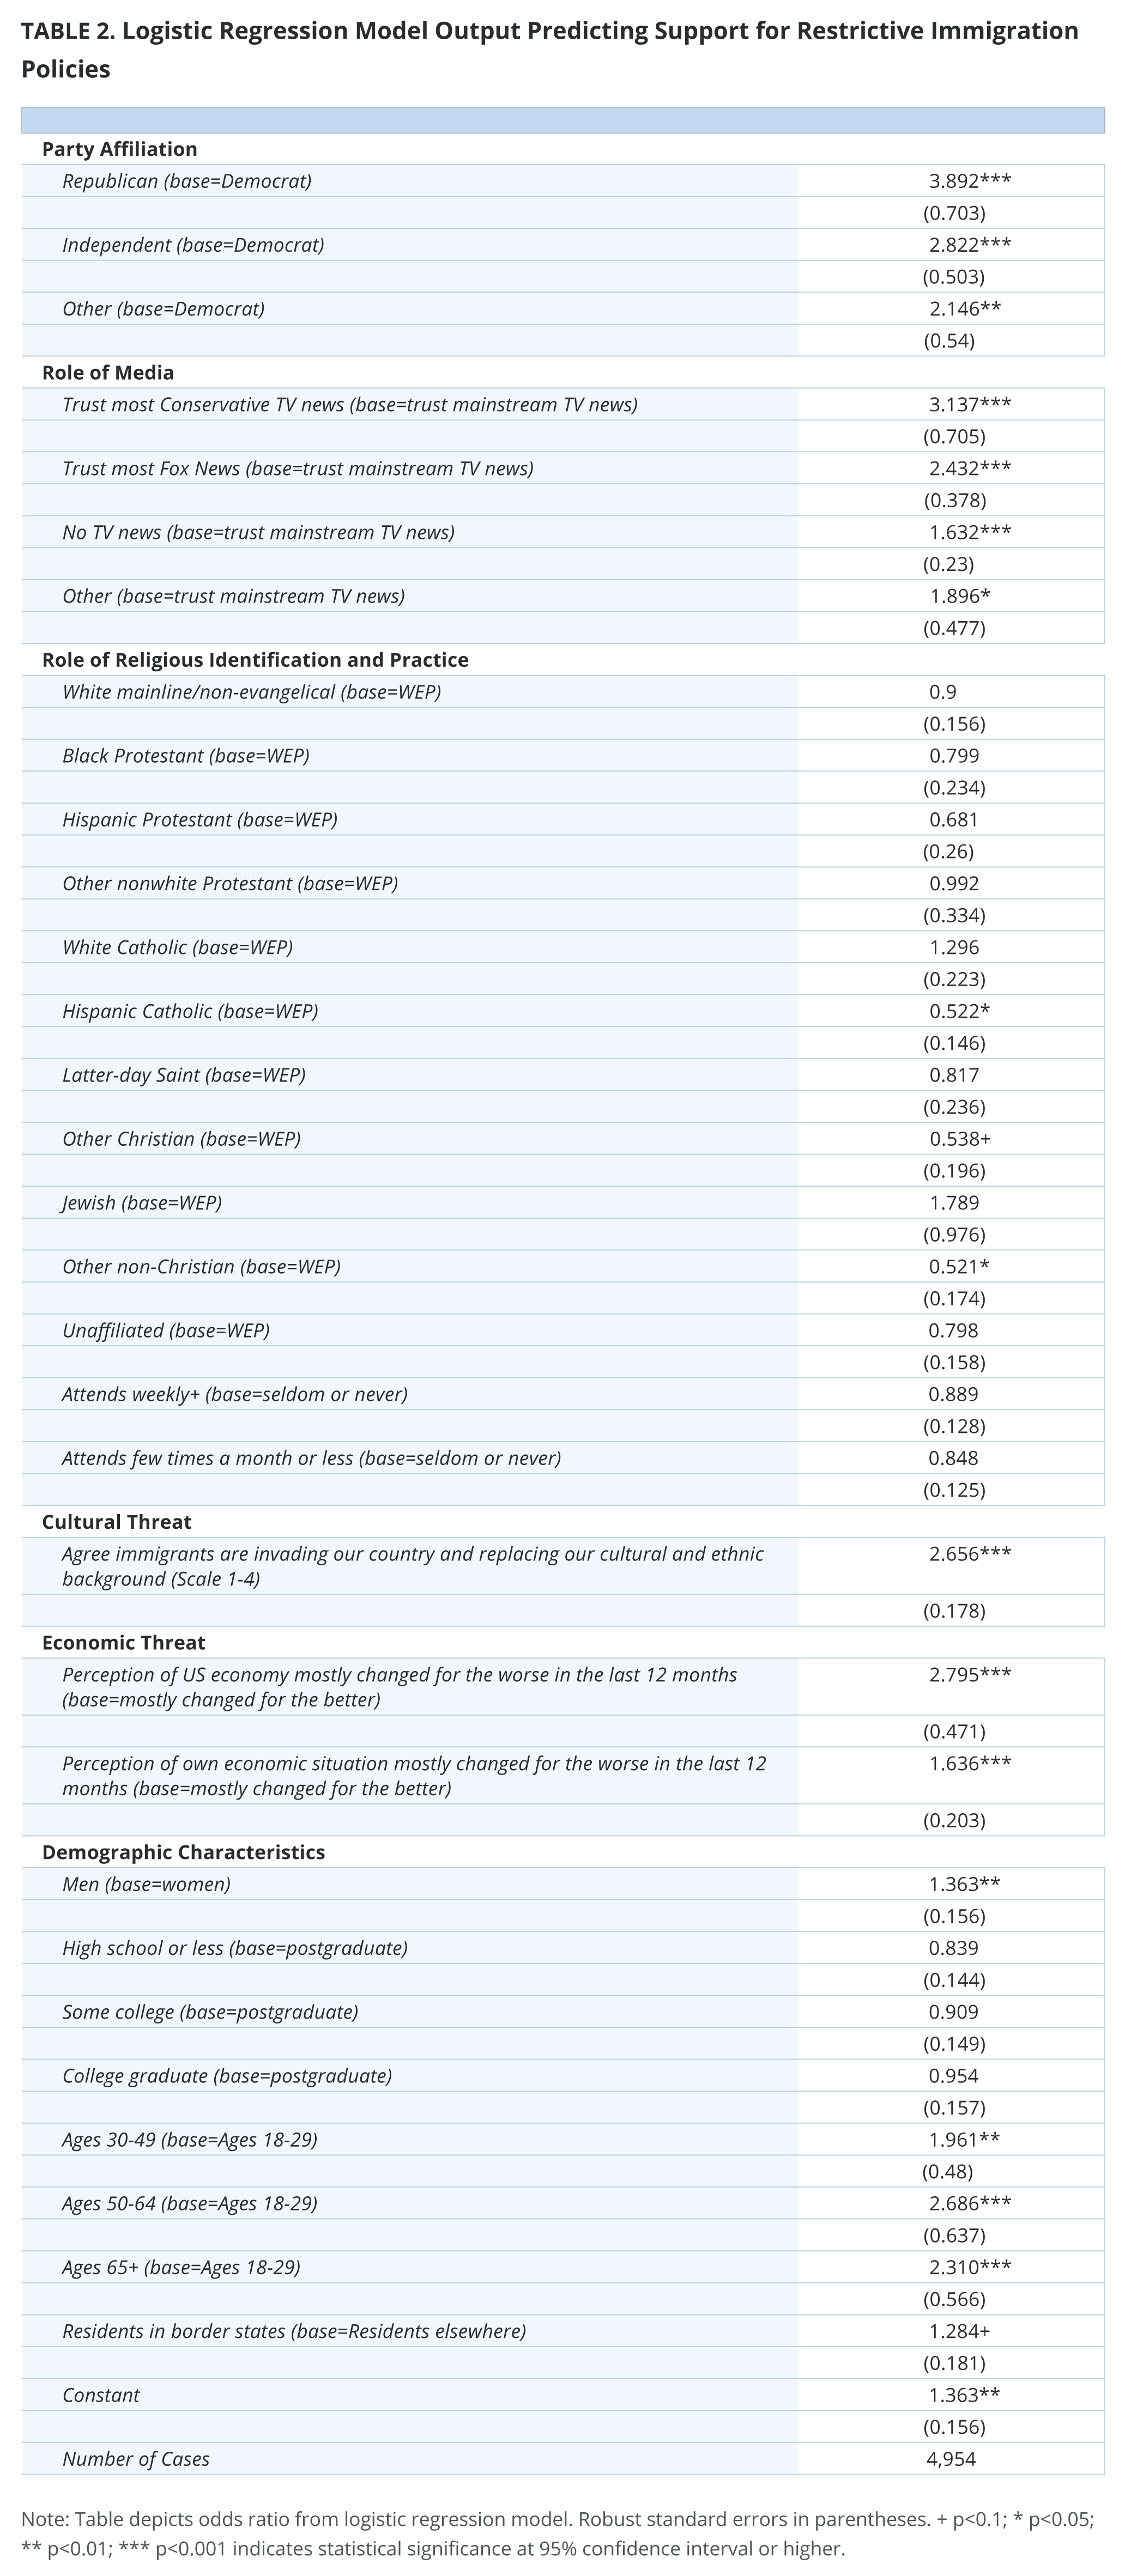
We use multivariate regression analysis to further understand which Americans are the most likely to support restrictive immigration policies (see Appendix A for full regression model output) after controlling for a range of political and socioeconomic characteristics, such as partisanship, media trust, religious affiliation, religious attendance, perceptions of national and personal economy, gender, education, age, residents living in border states, and attitudes toward immigrants, which have been found to be previously associated with attitudes toward immigration policy. For ease of interpretation, we recode the scale as 1, for those who support all three restrictive measures, and as 0 for everyone else. As the analysis below demonstrates, the factors predicting support for all three restrictive immigration policies differ significantly across six characteristics.[4]
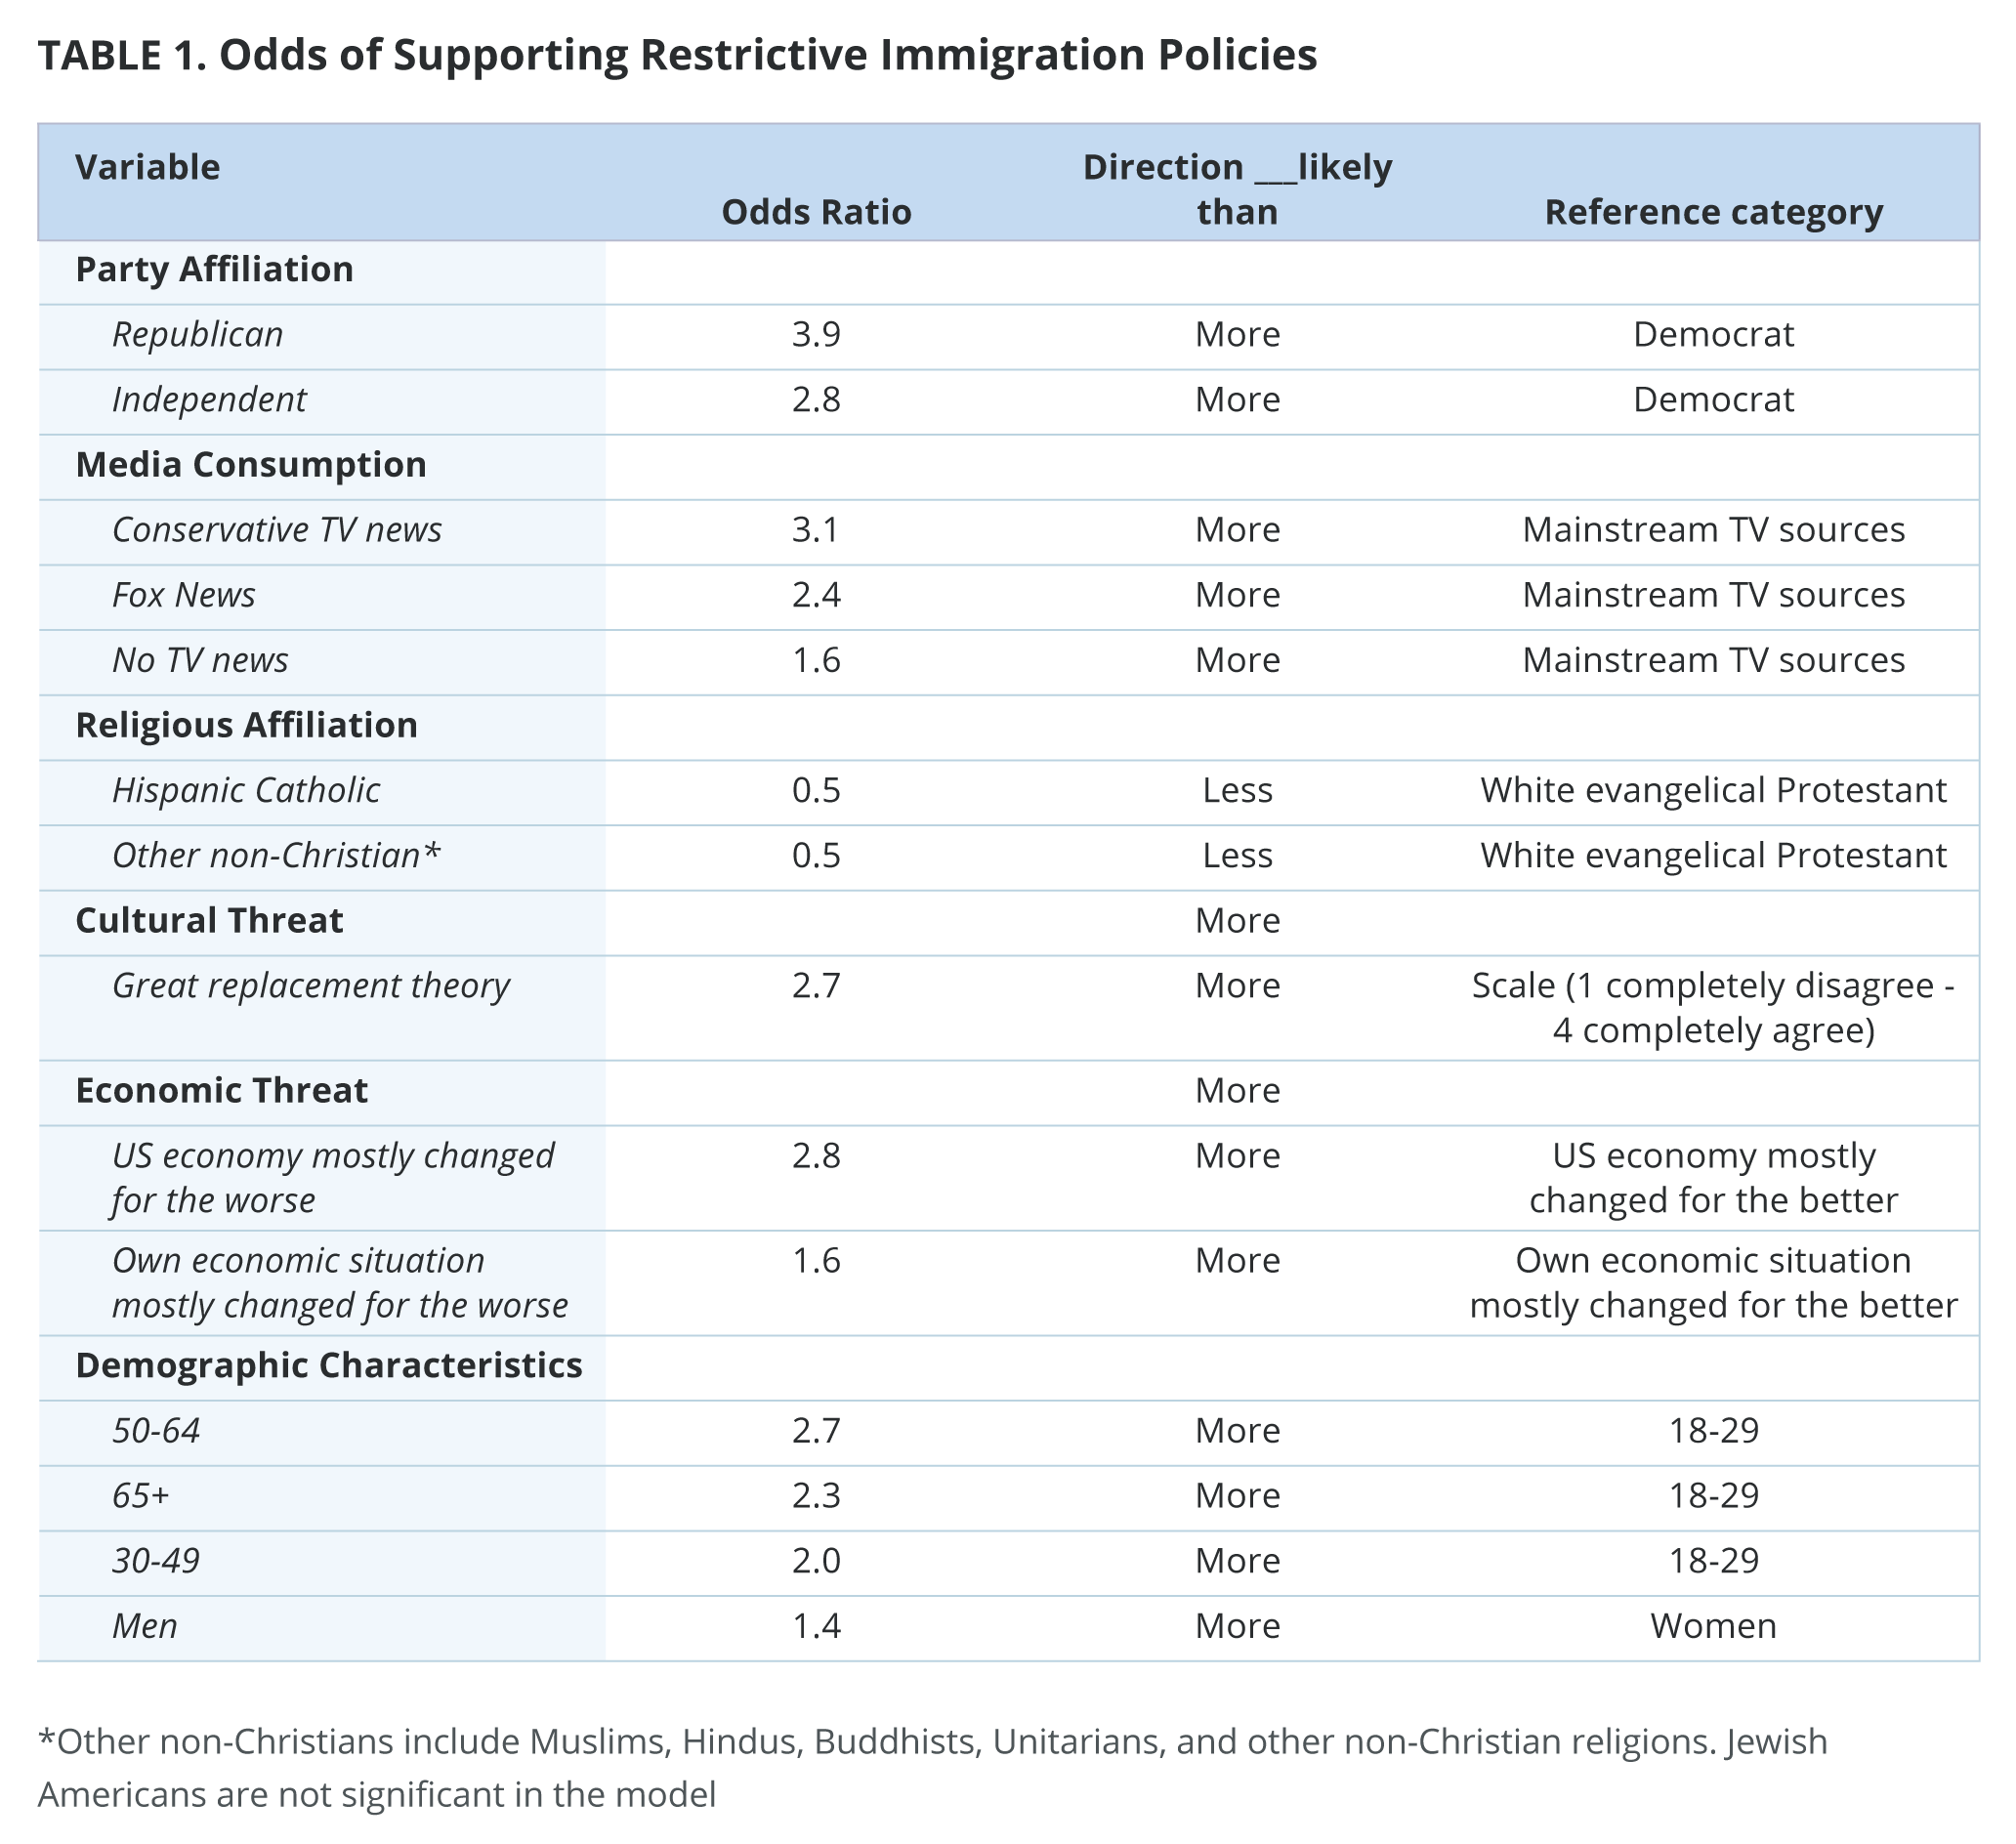
The analysis results indicate that, after controlling for all the variables in the model, Republicans and independents have significantly higher odds of supporting restrictive immigration policies compared with Democrats. The findings also underscore the critical influence of media consumption on these views. Americans who most trust conservative TV news sources are more than three times as likely as those who primarily trust mainstream TV news to support restrictive immigration policies. Similarly, individuals who most trust Fox News or do not watch TV news are twice as likely to hold restrictive views compared with those who rely on mainstream sources.
The analysis further highlights the role of cultural and economic concerns in shaping public opinion, with those who agree with the Great Replacement Theory and perceive the national and personal economic situation as worsening being more inclined to support restrictive policies. Compared with white evangelical Protestants, Hispanic Catholics and other non-Christians are half as likely as white evangelical Protestants to support restrictive immigration measures; no other religious groups are statistically distinct from white evangelical Protestants when controlling for other factors. Religious attendance does not drive support for stricter immigration policies. Additionally, demographic factors such as being male and over 30 are strong predictors of support for more restrictive policies. These findings underscore the complexity of immigration policy attitudes and the significant challenges the new administration faces in effectively addressing them.
Appendix
[1] Though the number of cases for Latter-day Saints in 2013 and 2024 are under 100 at 97 in each year, the changes are statistically significant at p. value of 0.05. Changes for Hispanic Protestants and Hispanic Catholics are statistically significant at p. value of 0.06.
[2] States that border Mexico are Arizona, California, New Mexico, and Texas.
[3] Responses across all three questions are highly correlated, with a Cronbach’s alpha of 0.78, indicating a high degree of reliability for the scale.
[4] For robustness checks, additional analyses were conducted, including all respondents who refused to provide responses across variables, and the results remained virtually unchanged. Furthermore, supplementary analysis using the original variable produced similar findings, with two notable exceptions: Hispanic Protestants and unaffiliated Americans also emerge as significantly less likely than white evangelical Protestants to support restrictive immigration policies.


