

In the 2020 presidential election, President Joe Biden won Pennsylvania by around one percentage point: 50.0% of the state’s voters supported Biden and 48.8% supported former President Donald Trump. Using data from PRRI’s 2023 American Values Atlas, this Spotlight Analysis presents a demographic and religious profile of Pennsylvanians and the issues that are important to their voting choices ahead of the 2024 presidential election.
- The median age of adults in Pennsylvania is 52, slightly older than the median age of all Americans (48).
- A slightly higher percentage of Pennsylvanians have a high school education or less (42%) than Americans nationally(38%). Around two in ten Pennsylvanians have some college education (22%), five percentage points less than all Americans (27%). Twenty-one percent of Pennsylvanians have a four-year college degree and 15% have a postgraduate degree, rates that are comparable to the national averages(20% and 15%).
- More than three in four Pennsylvanians are white (77%), significantly higher than the percentage of all Americans who are white (62%). Significantly fewer Pennsylvanians are Hispanic (5%) when compared with all Americans (17%). The percentage of Pennsylvanians who are Black (13%), Asian Americans and Pacific Islanders (3%), and multiracial (2%) are similar to the percentage of these groups nationwide (12% Black, 6% AAPI, and 1% multiracial).
- Compared with Americans nationally, larger percentages of Pennsylvanians identify as Republicans (27% nationally vs. 35% in Pennsylvania) and Democrats (31% vs. 34%, respectively) and fewer identify as independent (30% vs. 22%, respectively).
- Similar percentages of Pennsylvanians identify as conservative (37%) and moderate (36%) while fewer identify as liberal (25%).
- According to PRRI’s Christian Nationalism scale, around one in ten Pennsylvanians qualify as Christian nationalism Adherents (10%) and two in ten qualify as Christian nationalism Sympathizers (19%). Nearly four in ten Pennsylvanians qualify as Christian nationalism Skeptics (37%) and three in ten qualify as Christian nationalism Rejecters (30%). These proportions closely match the national average.
Pennsylvania’s Religious Landscape
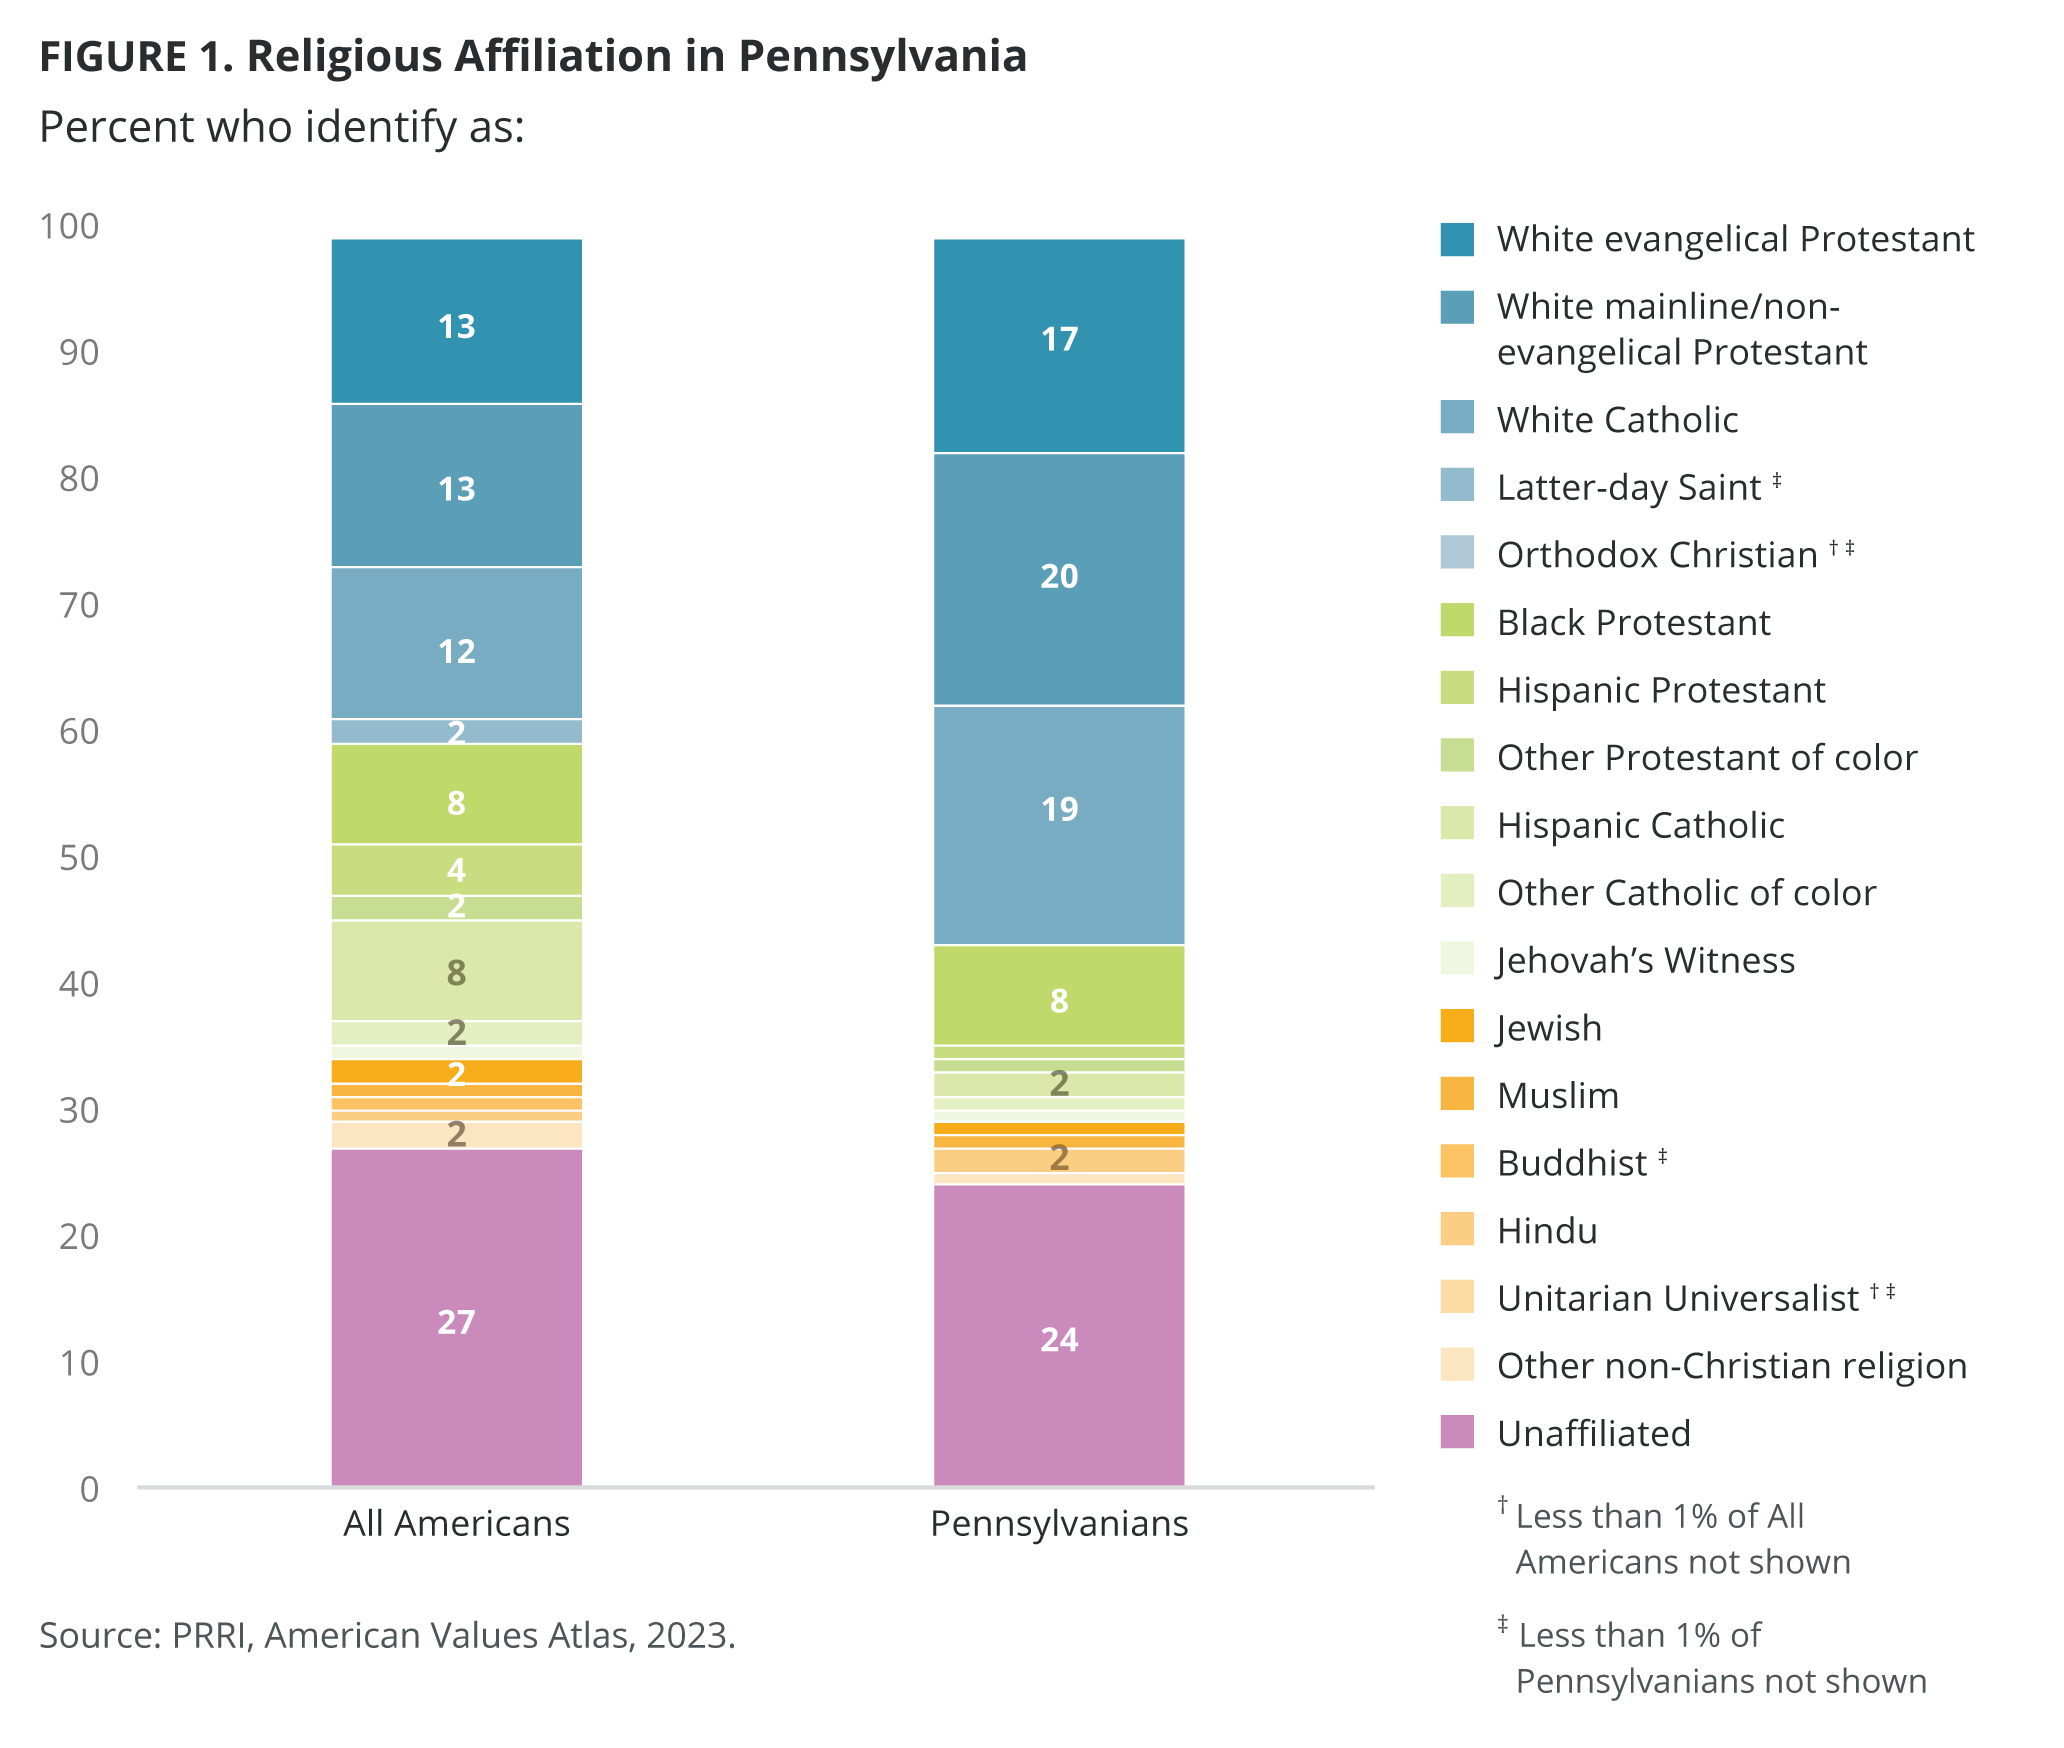
Overall, Pennsylvania has higher percentages of white Christians than the nation broadly. Specifically, around two in ten Pennsylvanians identify as white mainline/non-evangelical Protestant (20%), white Catholic (19%), and white evangelical Protestant (17%) compared with 13% who identify as white mainline/non-evangelical Protestant, 13% as white evangelicalProtestant, and 12% as white Catholic, nationally. A smaller share of Pennsylvanians identify as religiously unaffiliated (24%) than among all Americans (27%).
Pennsylvanians’ Litmus Test Issues by Party Affiliation
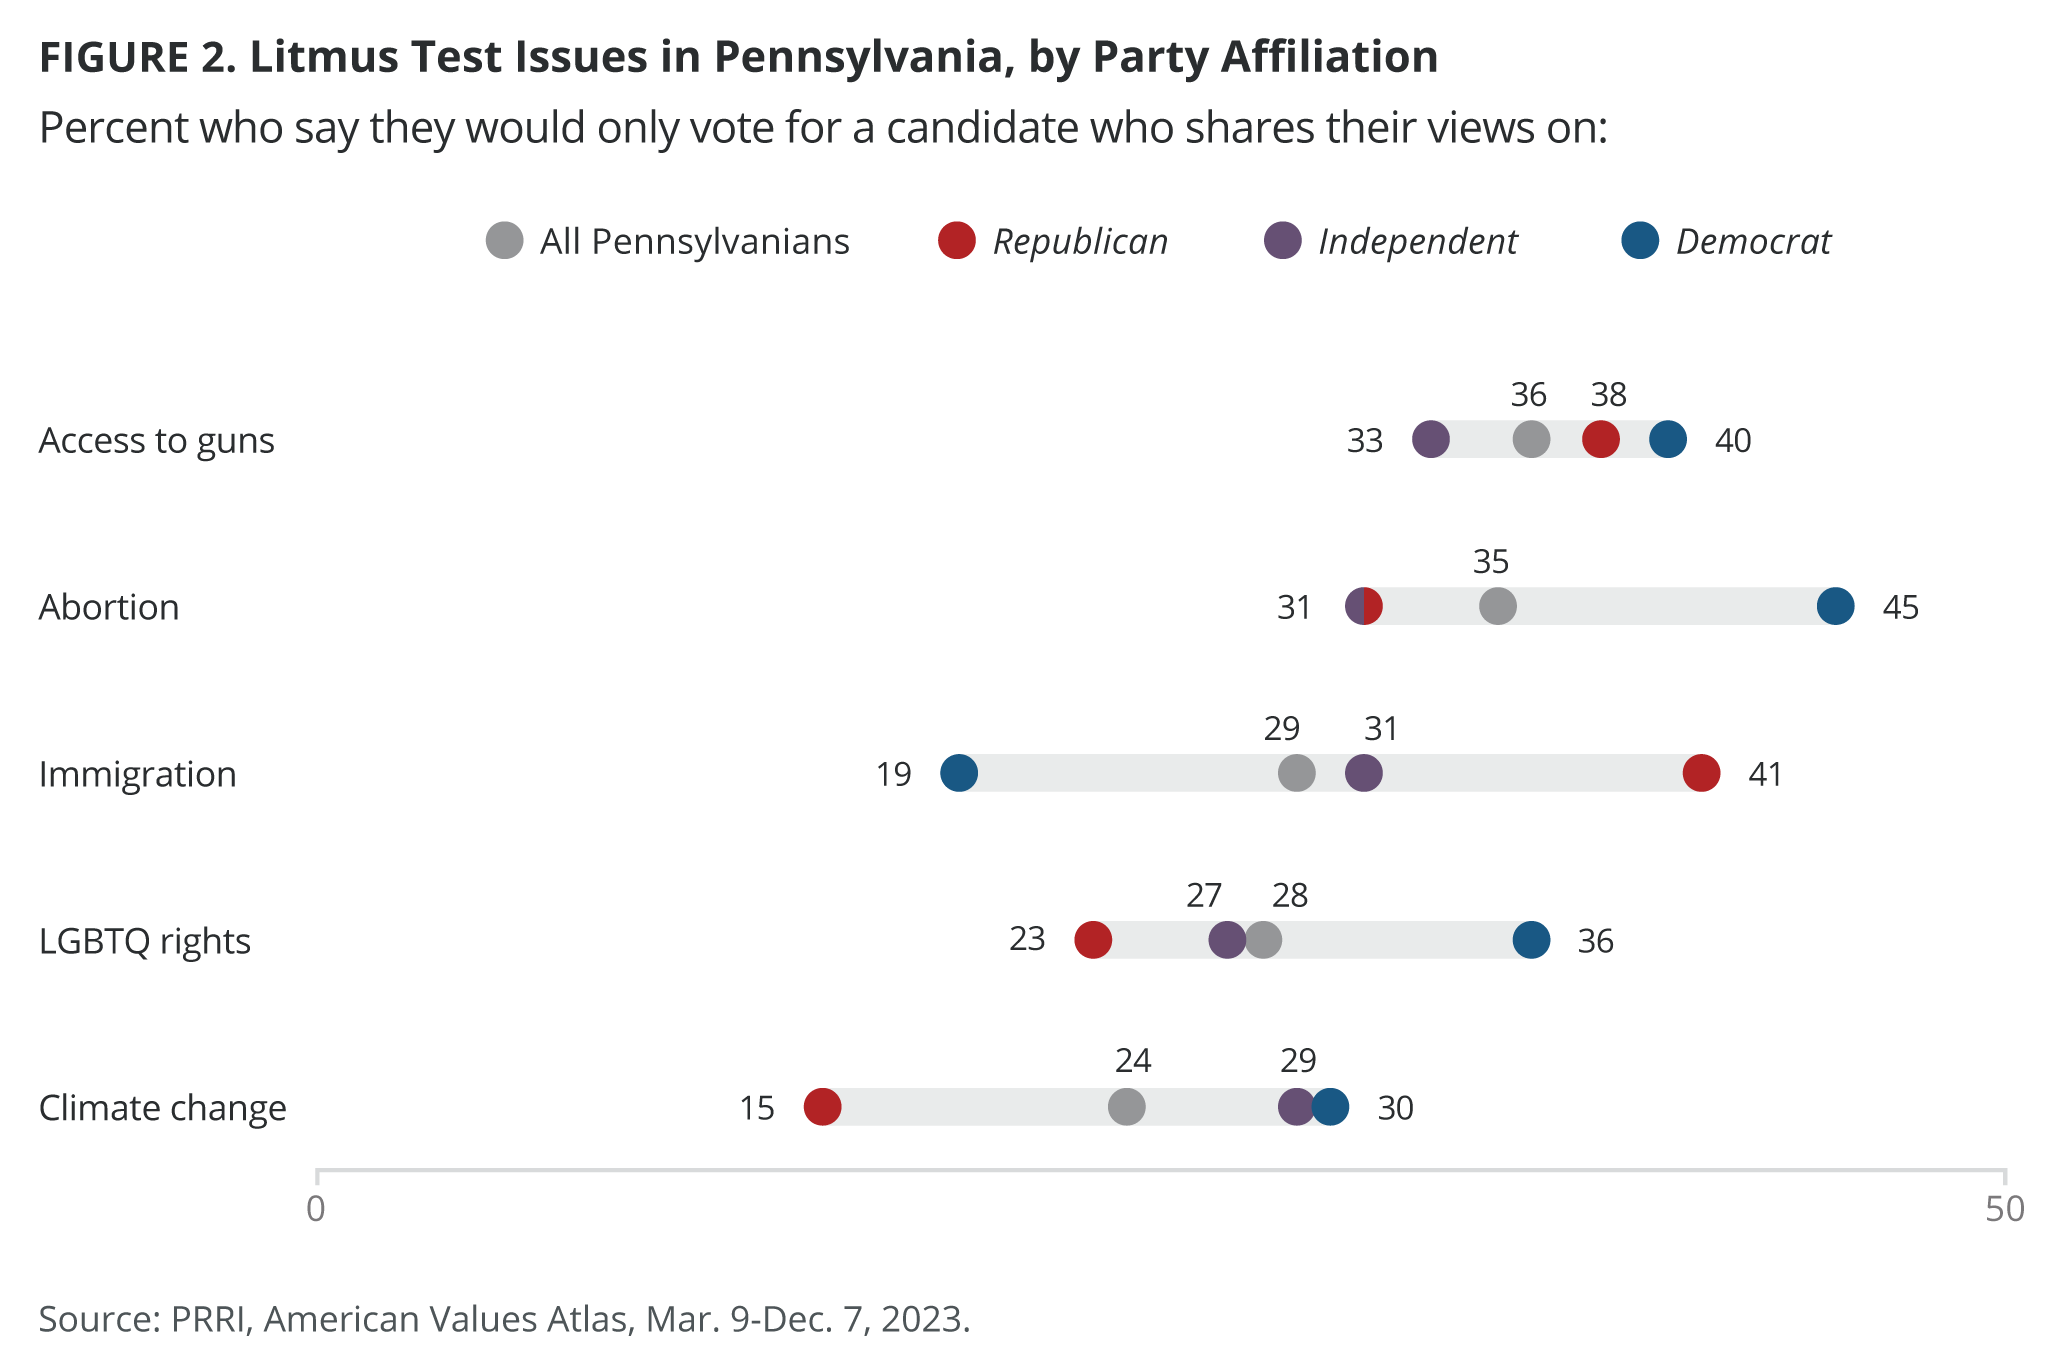
Among Pennsylvanians, over one-third report they would only vote for a candidate who shares their views on access to guns(36%) and abortion (35%). There are no significant differences in the salience of access to guns along partisan divides with 40% of Pennsylvania Democrats, 38% of Republicans, and 33% of independents reporting they would only vote for a candidate who shares their view on the issue. However, there is a significant partisan divide on the salience of abortion as a motivator to vote; Pennsylvania Democrats (45%) are more than 10 percentage points more likely to report that they will only vote for a candidate who shares their view on abortion legality than Pennsylvania Republicans or independents (both 31%).
Around three in ten Pennsylvanians say they would only vote for a candidate who shares their views on immigration (29%) and LGTBQ rights (28%). Pennsylvania Republicans (41%) are about twice as likely to only vote for a candidate who shares their view on immigration than Democrats (19%), while independents fall in between (31%). In contrast, Pennsylvania Democrats (36%) are more likely to only vote for a candidate who shares their view on LGBTQ rights than Republicans (23%) and independents (27%).
Less than one in four Pennsylvanians say they would only vote for a candidate who shares their views on climate change (24%). Pennsylvania Democrats (30%) and independents (29%) are twice as likely to report they would only vote for a candidate who shares their views on climate change than Pennsylvania Republicans (15%).
Attitudes Toward LGBTQ Rights in Pennsylvania
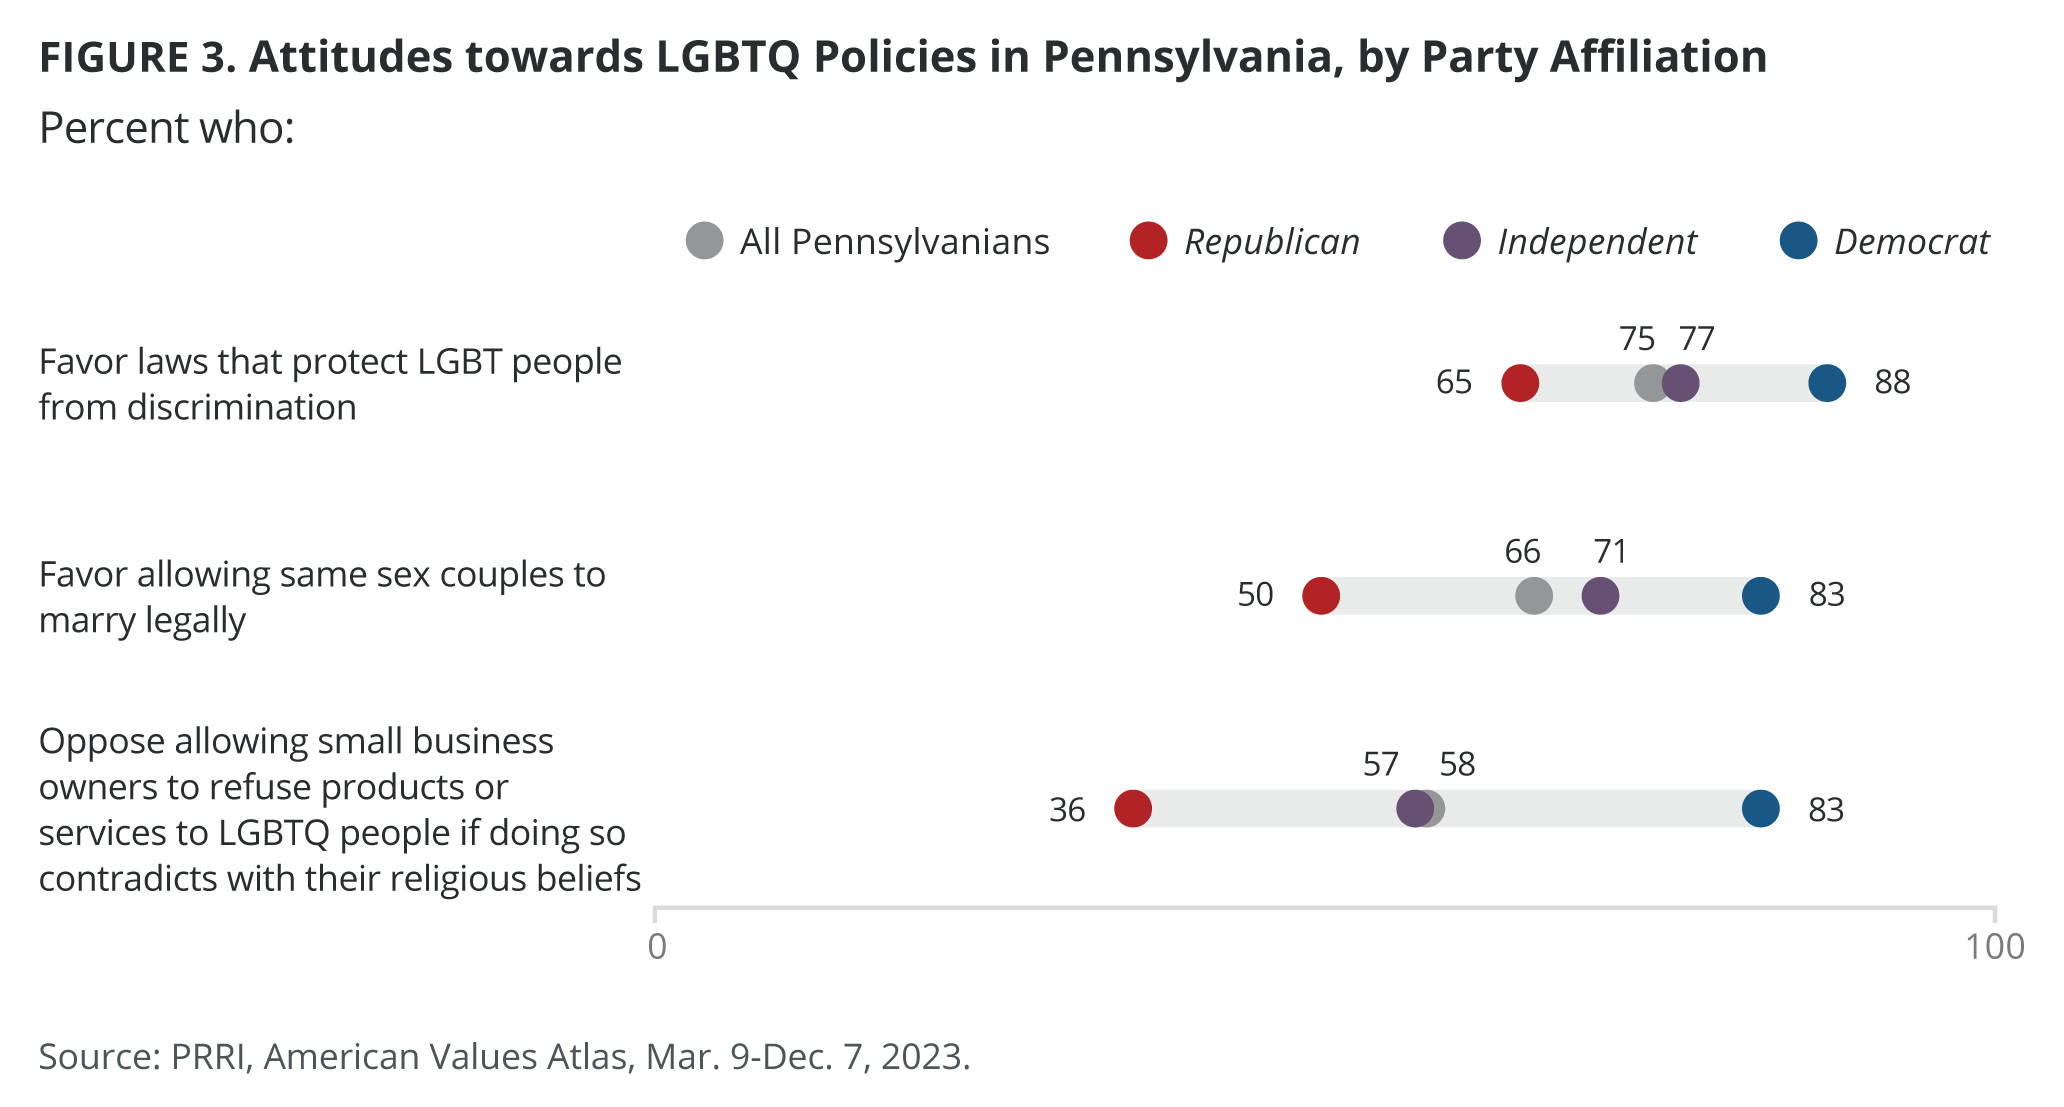
Nearly three in four Pennsylvanians (75%) favor laws that protect LGBTQ individuals from discrimination. While the vast majority of all partisan groups in Pennsylvania support LGBTQ nondiscrimination laws, Democrats (88%) are more likely to support these laws compared with independents (77%) and Republicans (65%).
Nearly six in ten Pennsylvanians (58%) oppose laws that allow a small business owner to refuse products or services to LGBTQ people if doing so contradicts their religious beliefs. More than eight in ten Pennsylvania Democrats (83%), around six in ten independents (57%), and nearly four in ten Republicans (36%) oppose such laws.
Two–thirds of all Pennsylvanians (66%) favor allowing same-sex couples to marry legally. Vast majorities of Pennsylvania Democrats (83%) and independents (71%) support same-sex marriage, compared with half of Republicans (50%).
Attitudes Toward Abortion in Pennsylvania
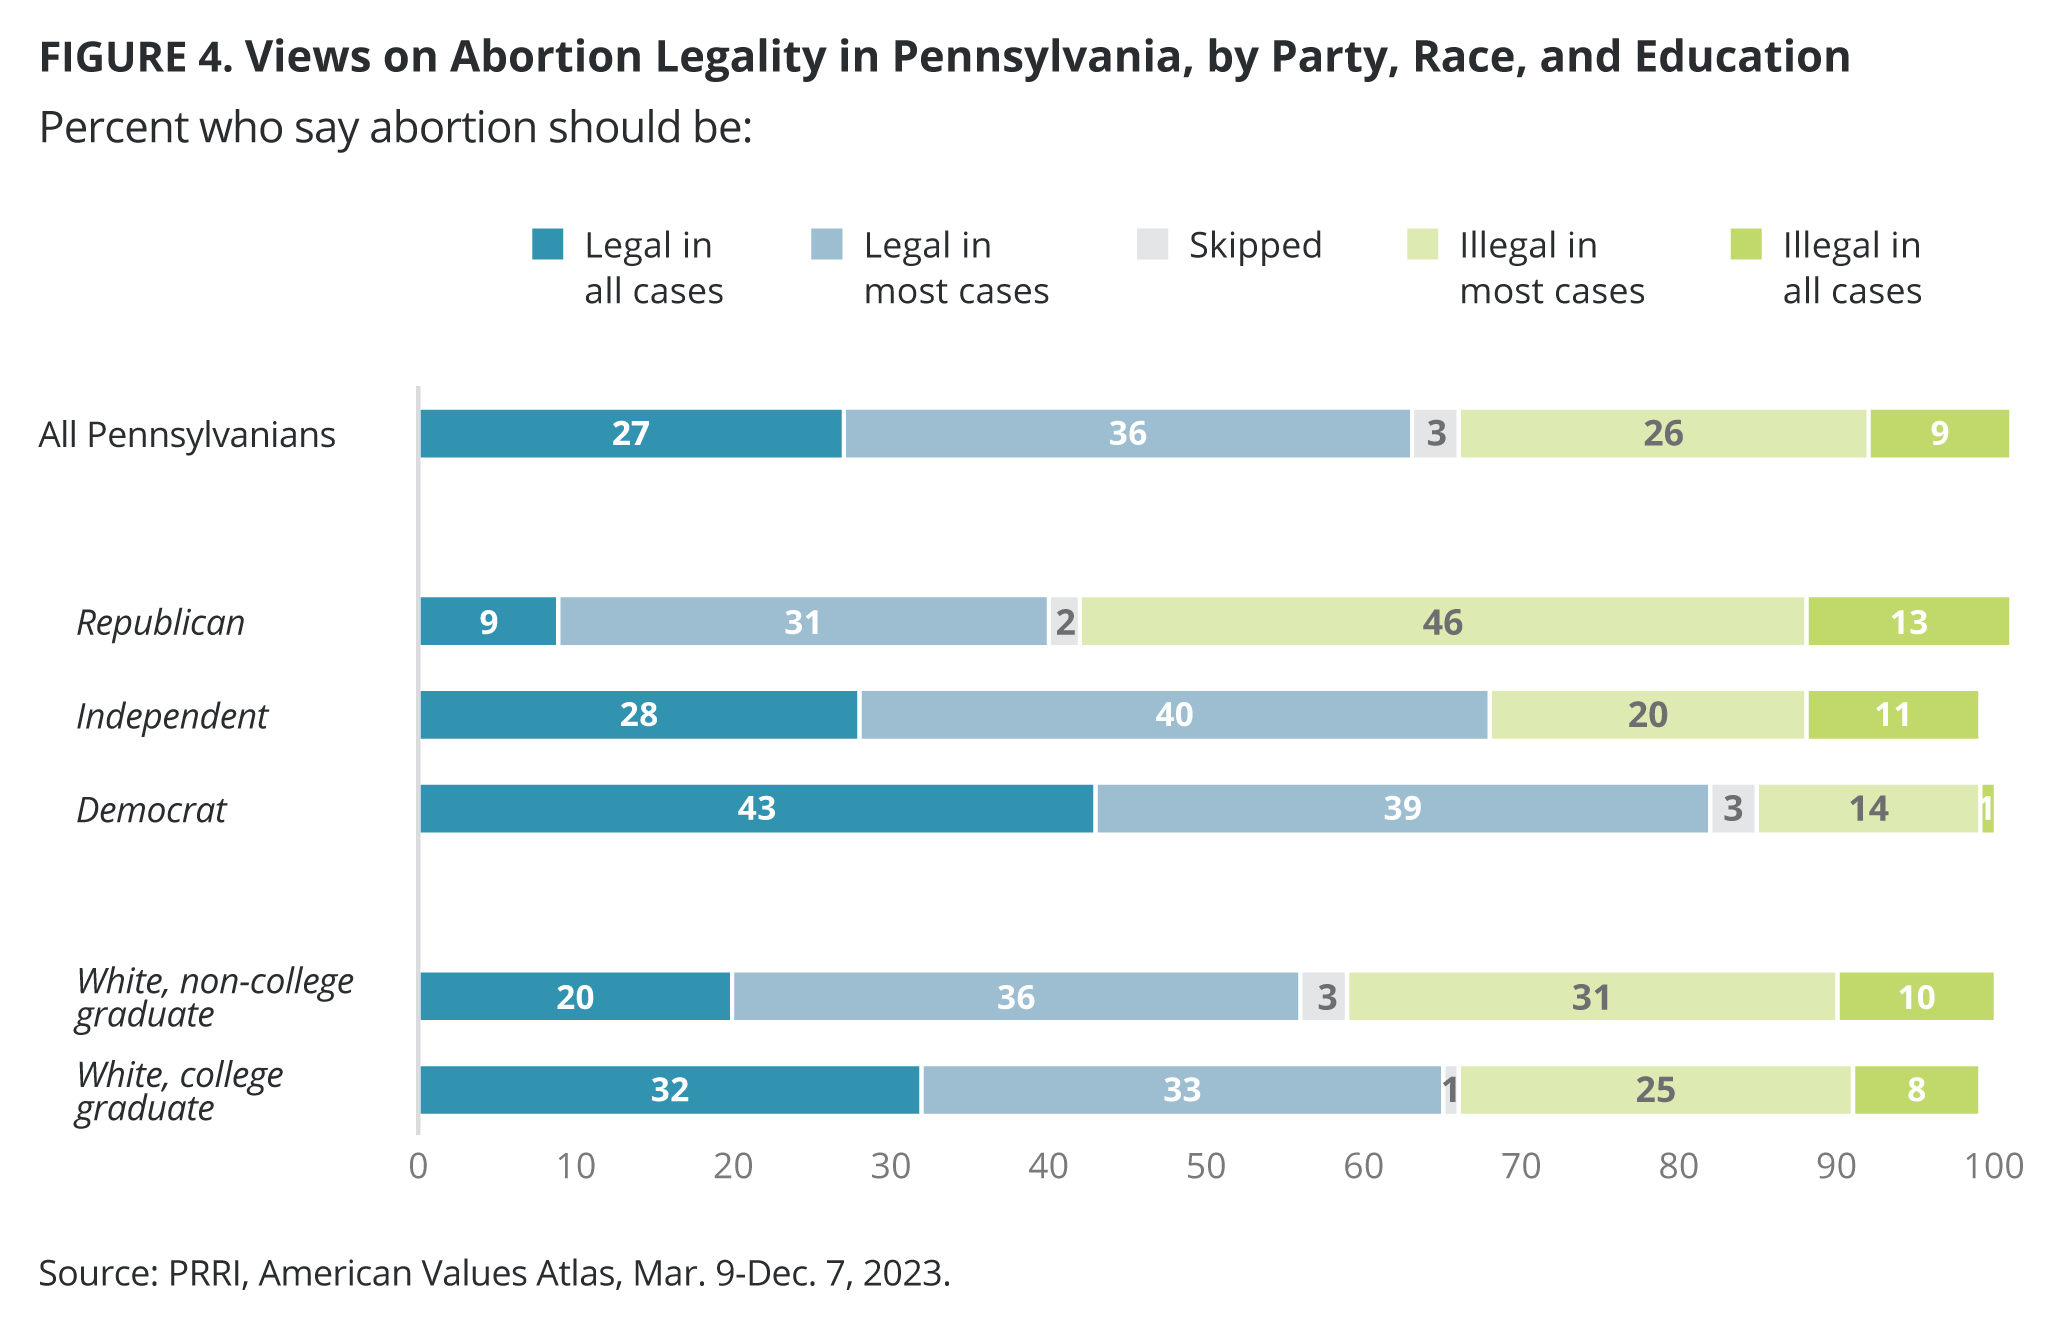
Overall, the majority of Pennsylvanians support legal access to abortion (63%) with about one in four supporting abortion legality in all cases (27%) and more than one–third supporting legality in most cases (36%). Nearly three in ten Pennsylvanians say abortion should be illegal in most cases (26%) and only one in ten say it should be illegal in all cases (9%).
The vast majority of Pennsylvania Democrats (82%) and independents (68%) favor legal abortion, compared with four in ten Pennsylvania Republicans (40%), whose majority favor abortion being illegal (59%).
Seven in ten Pennsylvanians with at least a four-year college degree (71%) support abortion legality, compared with six in ten non-college-educated Pennsylvanians (58%). White Pennsylvanians with a four-year degree (65%) are more likely than white Pennsylvanians without a college degree to support the legality of abortion (56%).
Explore the 2024 battleground states in additional PRRI Spotlight Analyses:


