In the 2020 presidential election, former President Donald Trump won North Carolina by an extremely slim margin: 50.1% of the state’s votes went to Trump, while 48.7% went to President Joe Biden. Using data from PRRI’s 2023 American Values Atlas, this Spotlight Analysis presents a demographic and religious profile of North Carolinians and the issues that are vital to their voting choices ahead of this fall’s presidential election.
- The median age of adults in North Carolina is 48, the same as the median age of all Americans.
- One-third of North Carolinians (33%) have a high school education or less, while nearly three in ten (29%) have some college education, 22% have a college degree, and 16% have a postgraduate degree. These are similar percentages to all Americans: 38% of Americans have a high school education or less, 27% have some college education, 20% have a college degree, and 15% have a postgraduate degree.
- Nearly two-thirds of North Carolinians are white (65%), while 21% are Black, 7% are Hispanic, 3% are Asian Americans or Pacific Islanders (AAPI), and 1% are multiracial. North Carolinians are more likely to be white or Black, compared with all Americans (62% white and 12% Black), and they are less likely to be Hispanic or AAPI than Americans overall (17% and 6%, respectively).
- Around one-third of North Carolinians identify as Democrats (32%) and another third identify as independents (33%), while one in four identify as Republicans (26%). This is similar to the national partisan divide, where 31% are Democrats, 30% are independents, and 27% are Republicans.
- North Carolinians are fairly split ideologically, with 29% identifying as liberal, 34% identifying as moderate, and 35% identifying as conservative.
- Using PRRI’s Christian nationalism scale, a majority of North Carolinians do not qualify as Christian Nationalists. This includes 31% of North Carolinians who are Christian nationalism Rejecters and 30% who are Skeptics. Around two in ten qualify as Christian nationalism Sympathizers (21%), and 15% as Christian nationalism Adherents. North Carolinians are slightly more likely than all Americans to qualify as Christian Nationalism Adherents (15% vs. 10%, respectively).
North Carolina’s Religious Landscape
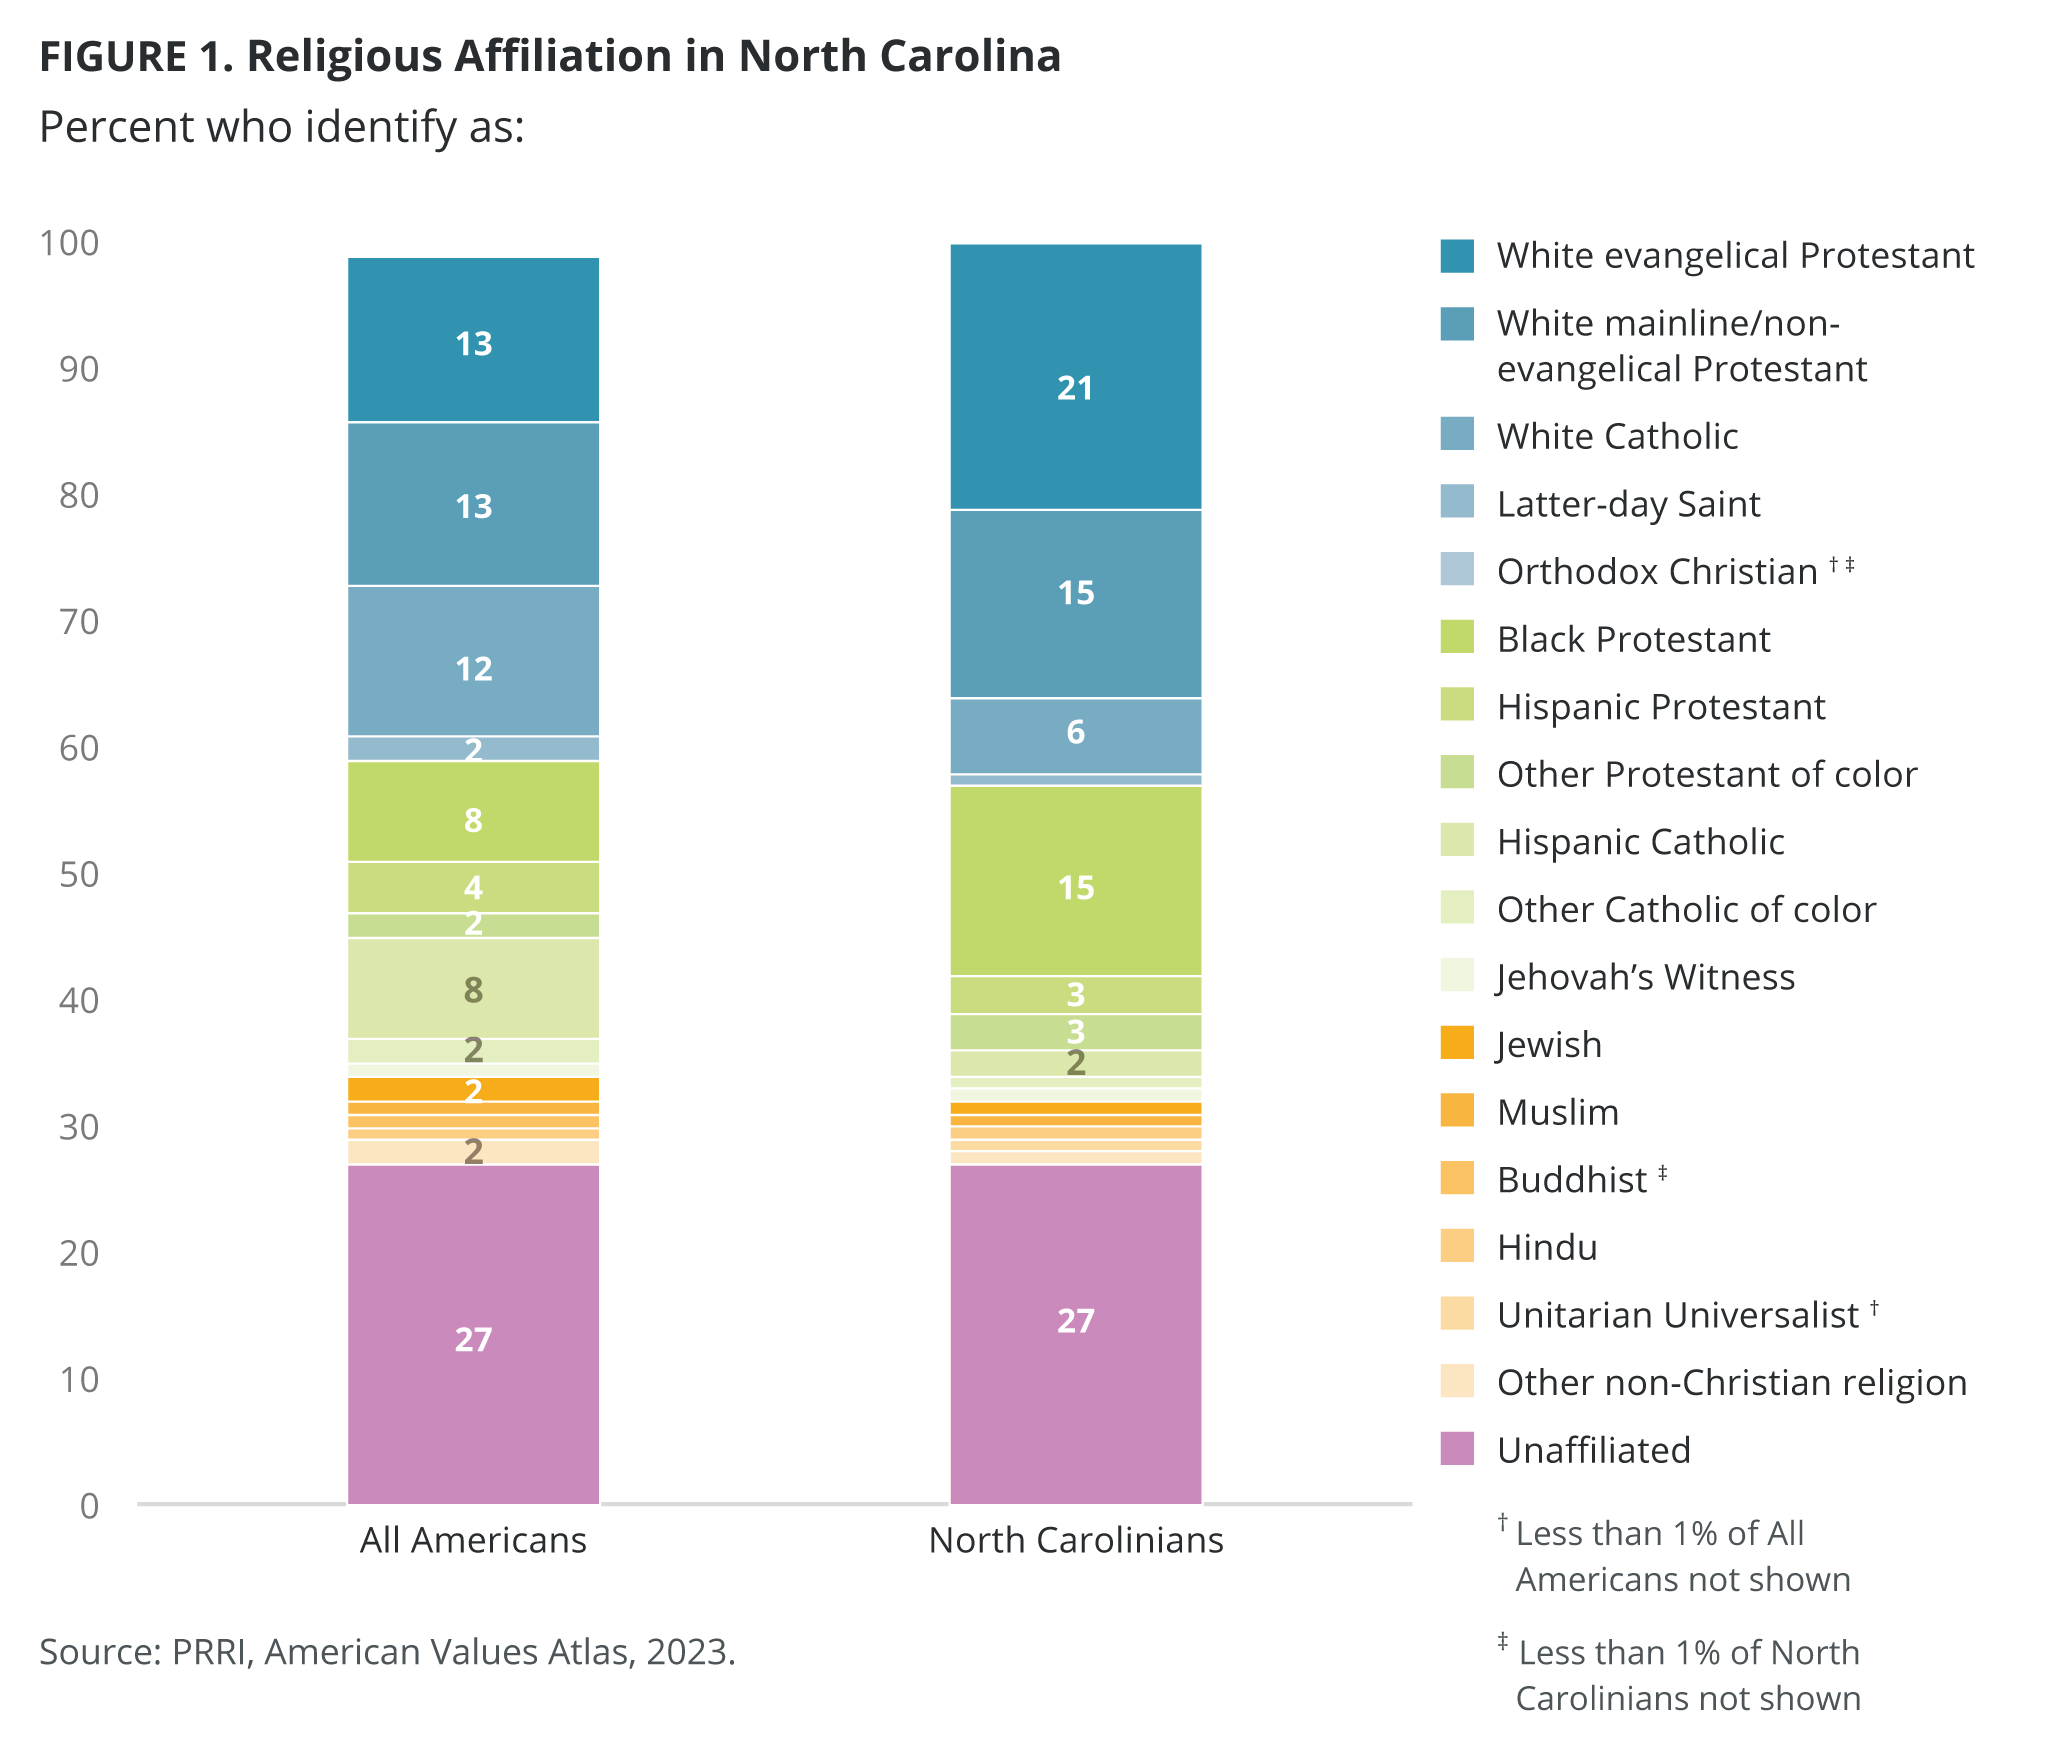
The largest religious groups in North Carolina are the religiously unaffiliated and white evangelical Protestants. More than one in four North Carolinians are unaffiliated (27%), the same percentage as Americans overall (27%). North Carolinians are, however, significantly more likely to be white evangelical Protestants compared with all Americans (21% in North Carolina vs. 13% nationally). They are also more likely to be Black Protestants (15% vs. 8%, respectively), and less likely to be white Catholics (6% vs. 12%, respectively) or Hispanic Catholics (2% vs. 8%, respectively).

North Carolinians’ Litmus Test Issues by Party Affiliation
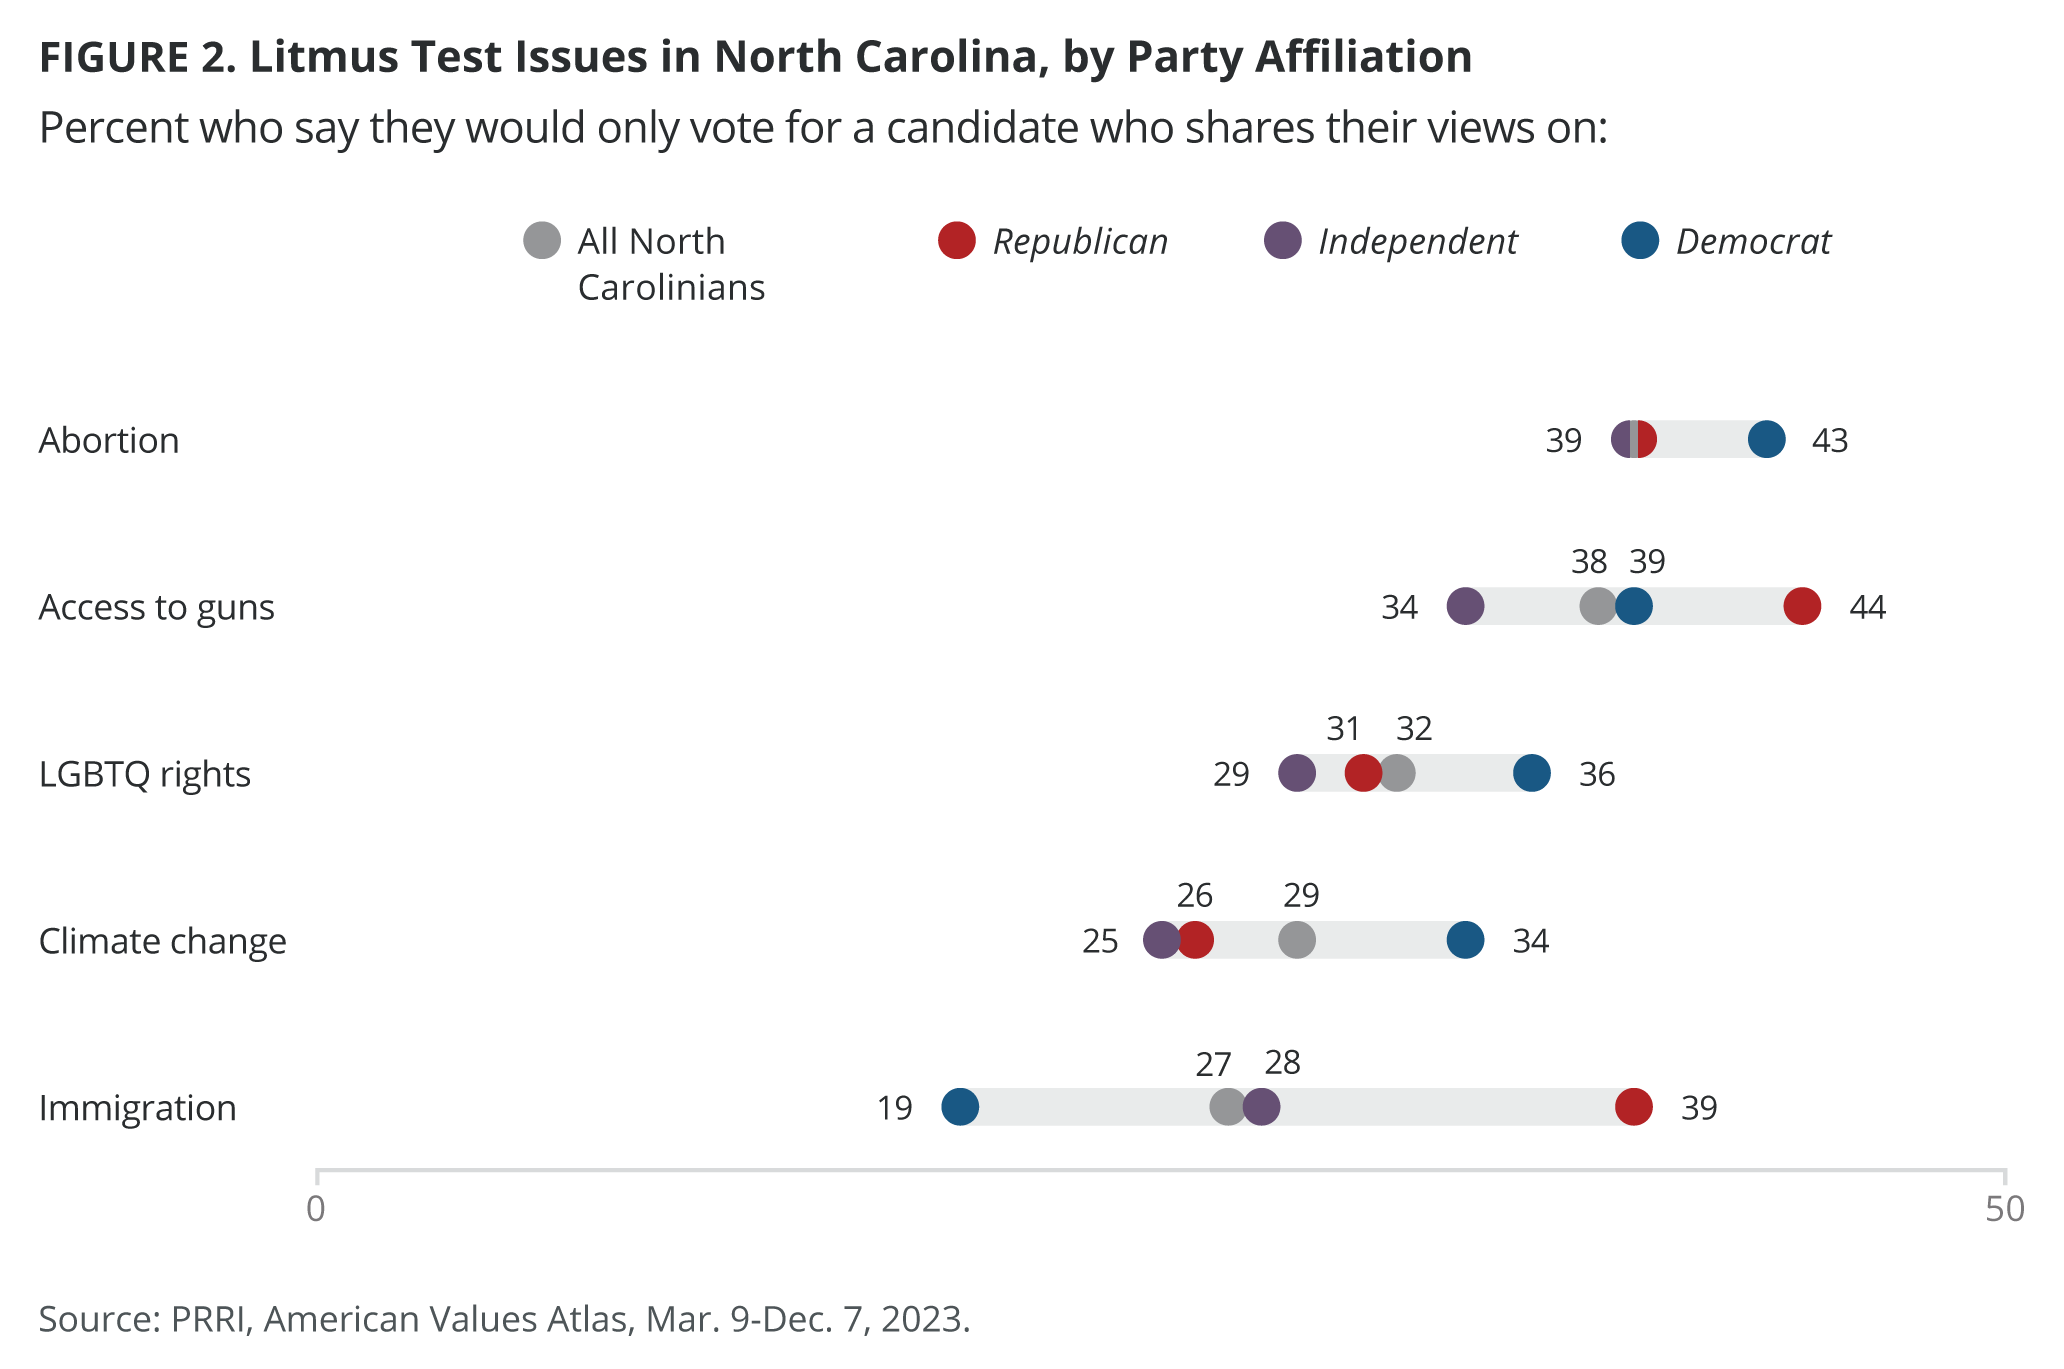
Nearly four in ten North Carolinians (39%) say they would only vote for a candidate who shares their views on abortion. About four in ten North Carolinians share this view across partisan affiliations, including 43% of Democrats, 39% of Republicans, and 39% of independents.
Nearly four in ten North Carolinians (38%) would only vote for a candidate who shares their views on access to guns. Forty-four percent of North Carolina Republicans, 39% of Democrats, and 34% of independents hold this view.
One-third of North Carolinians (32%) would only vote for a candidate who shares their views on LGBTQ rights; Democrats (36%) are slightly more likely than Republicans (31%) and independents (29%) to base their vote on a candidate’s stance on LGBTQ rights.
As for climate change, nearly three in ten North Carolinians (29%) would only vote for a candidate who shares their views on this issue. The state’s Democrats are more likely to say climate change is a litmus test issue (34%) than Republicans (26%) and independents (25%).
Finally, on immigration, 27% of North Carolinians would only vote for someone who shares their views on this issue. Republicans (39%) are more likely than independents (28%) and Democrats (19%) to hold this view.

Attitudes Toward LGBTQ Rights in North Carolina
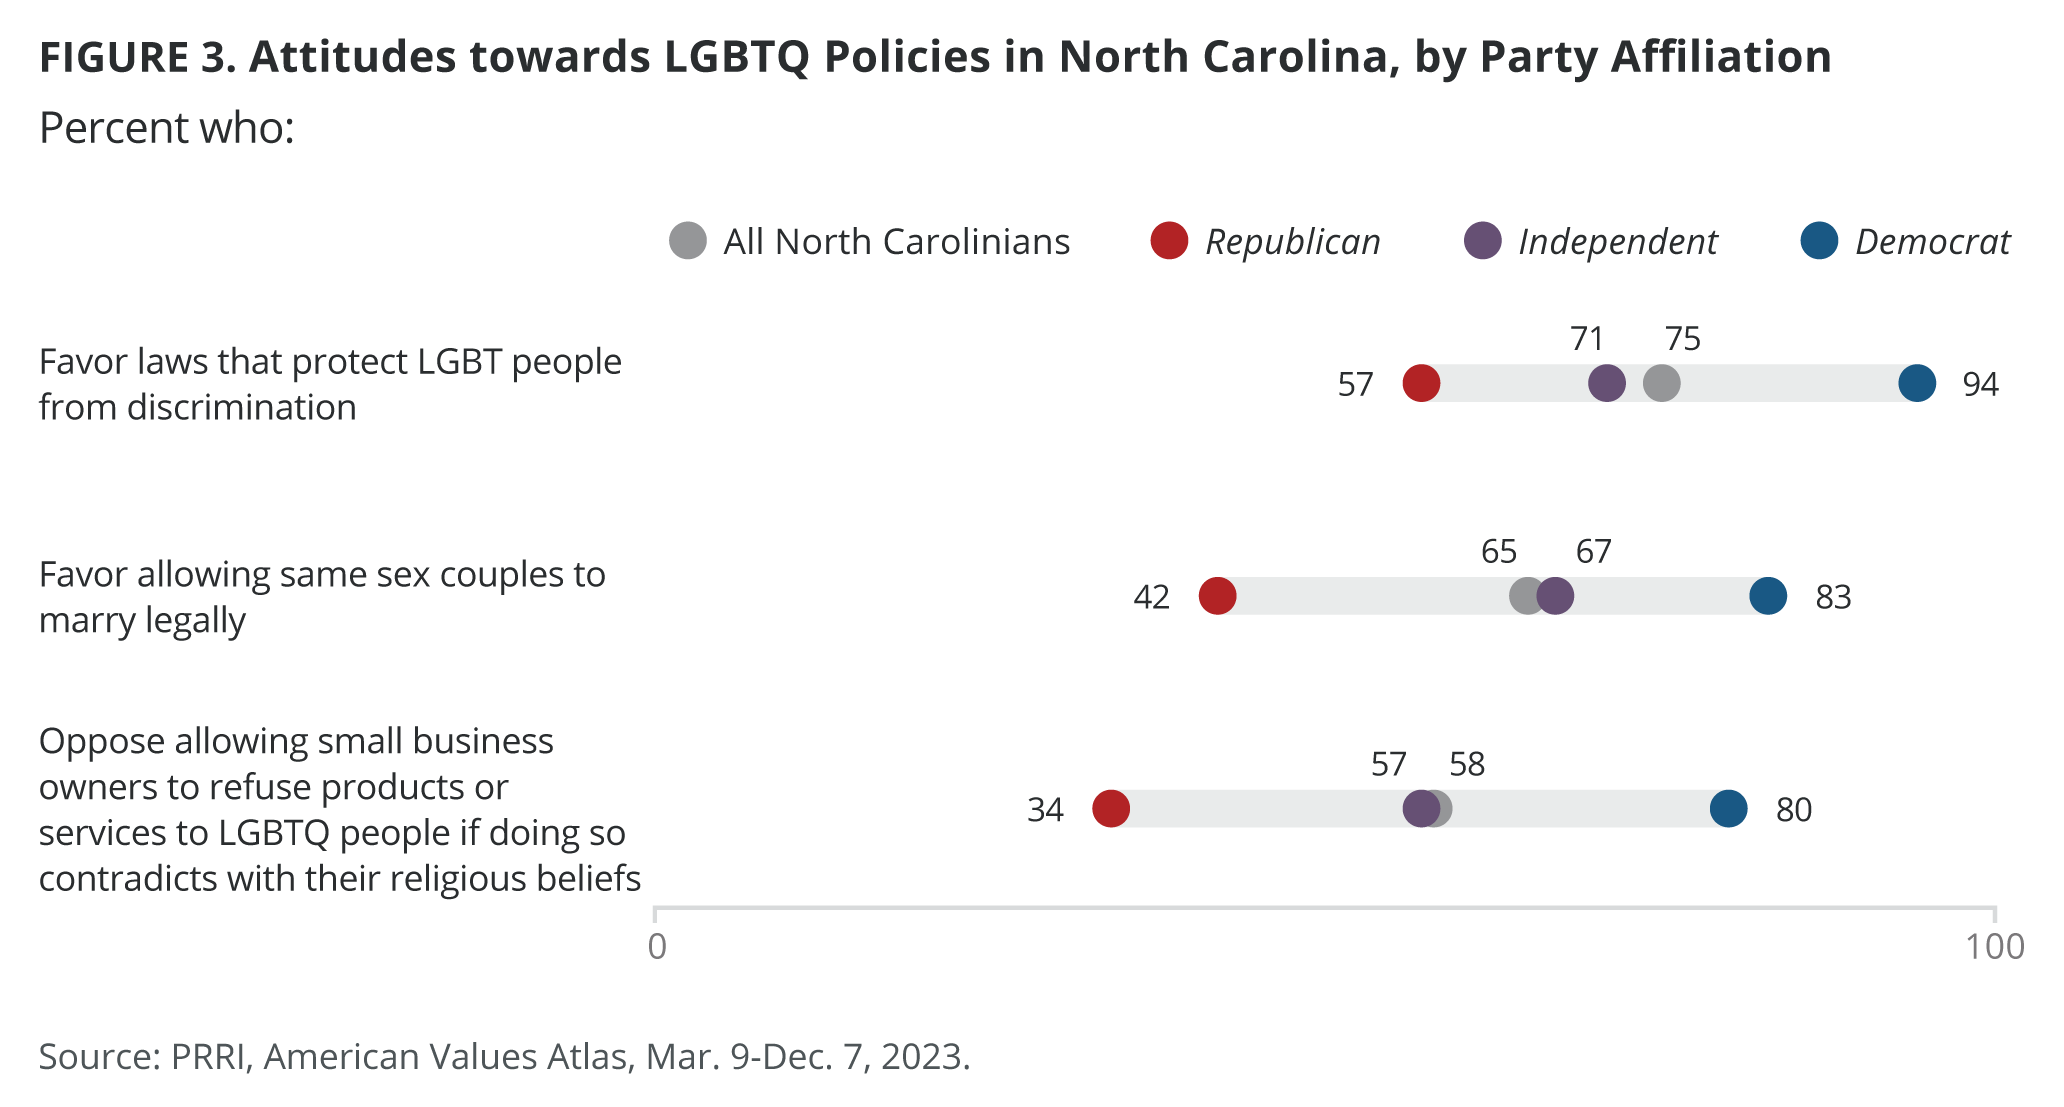
Three in four North Carolinians (75%) favor laws that prevent LGBTQ individuals from discrimination. Nearly all North Carolina Democrats favor such laws (94%), making them significantly more likely to do so than the state’s independents (71%) and Republicans (57%).
A slim majority of North Carolinians oppose laws that allow small business owners to refuse products or services to LGBTQ people if doing so contradicts their religious beliefs (58%). Democrats (80%) are significantly more likely than independents (57%) and Republicans (34%)to oppose such laws.
Nearly two-thirds of North Carolinians (65%) favor allowing same-sex couples to marry legally. Unsurprisingly, Democrats (83%) are significantly more likely to support same-sex marriage than independents (67%) and Republicans (42%).

Attitudes toward Abortion in North Carolina
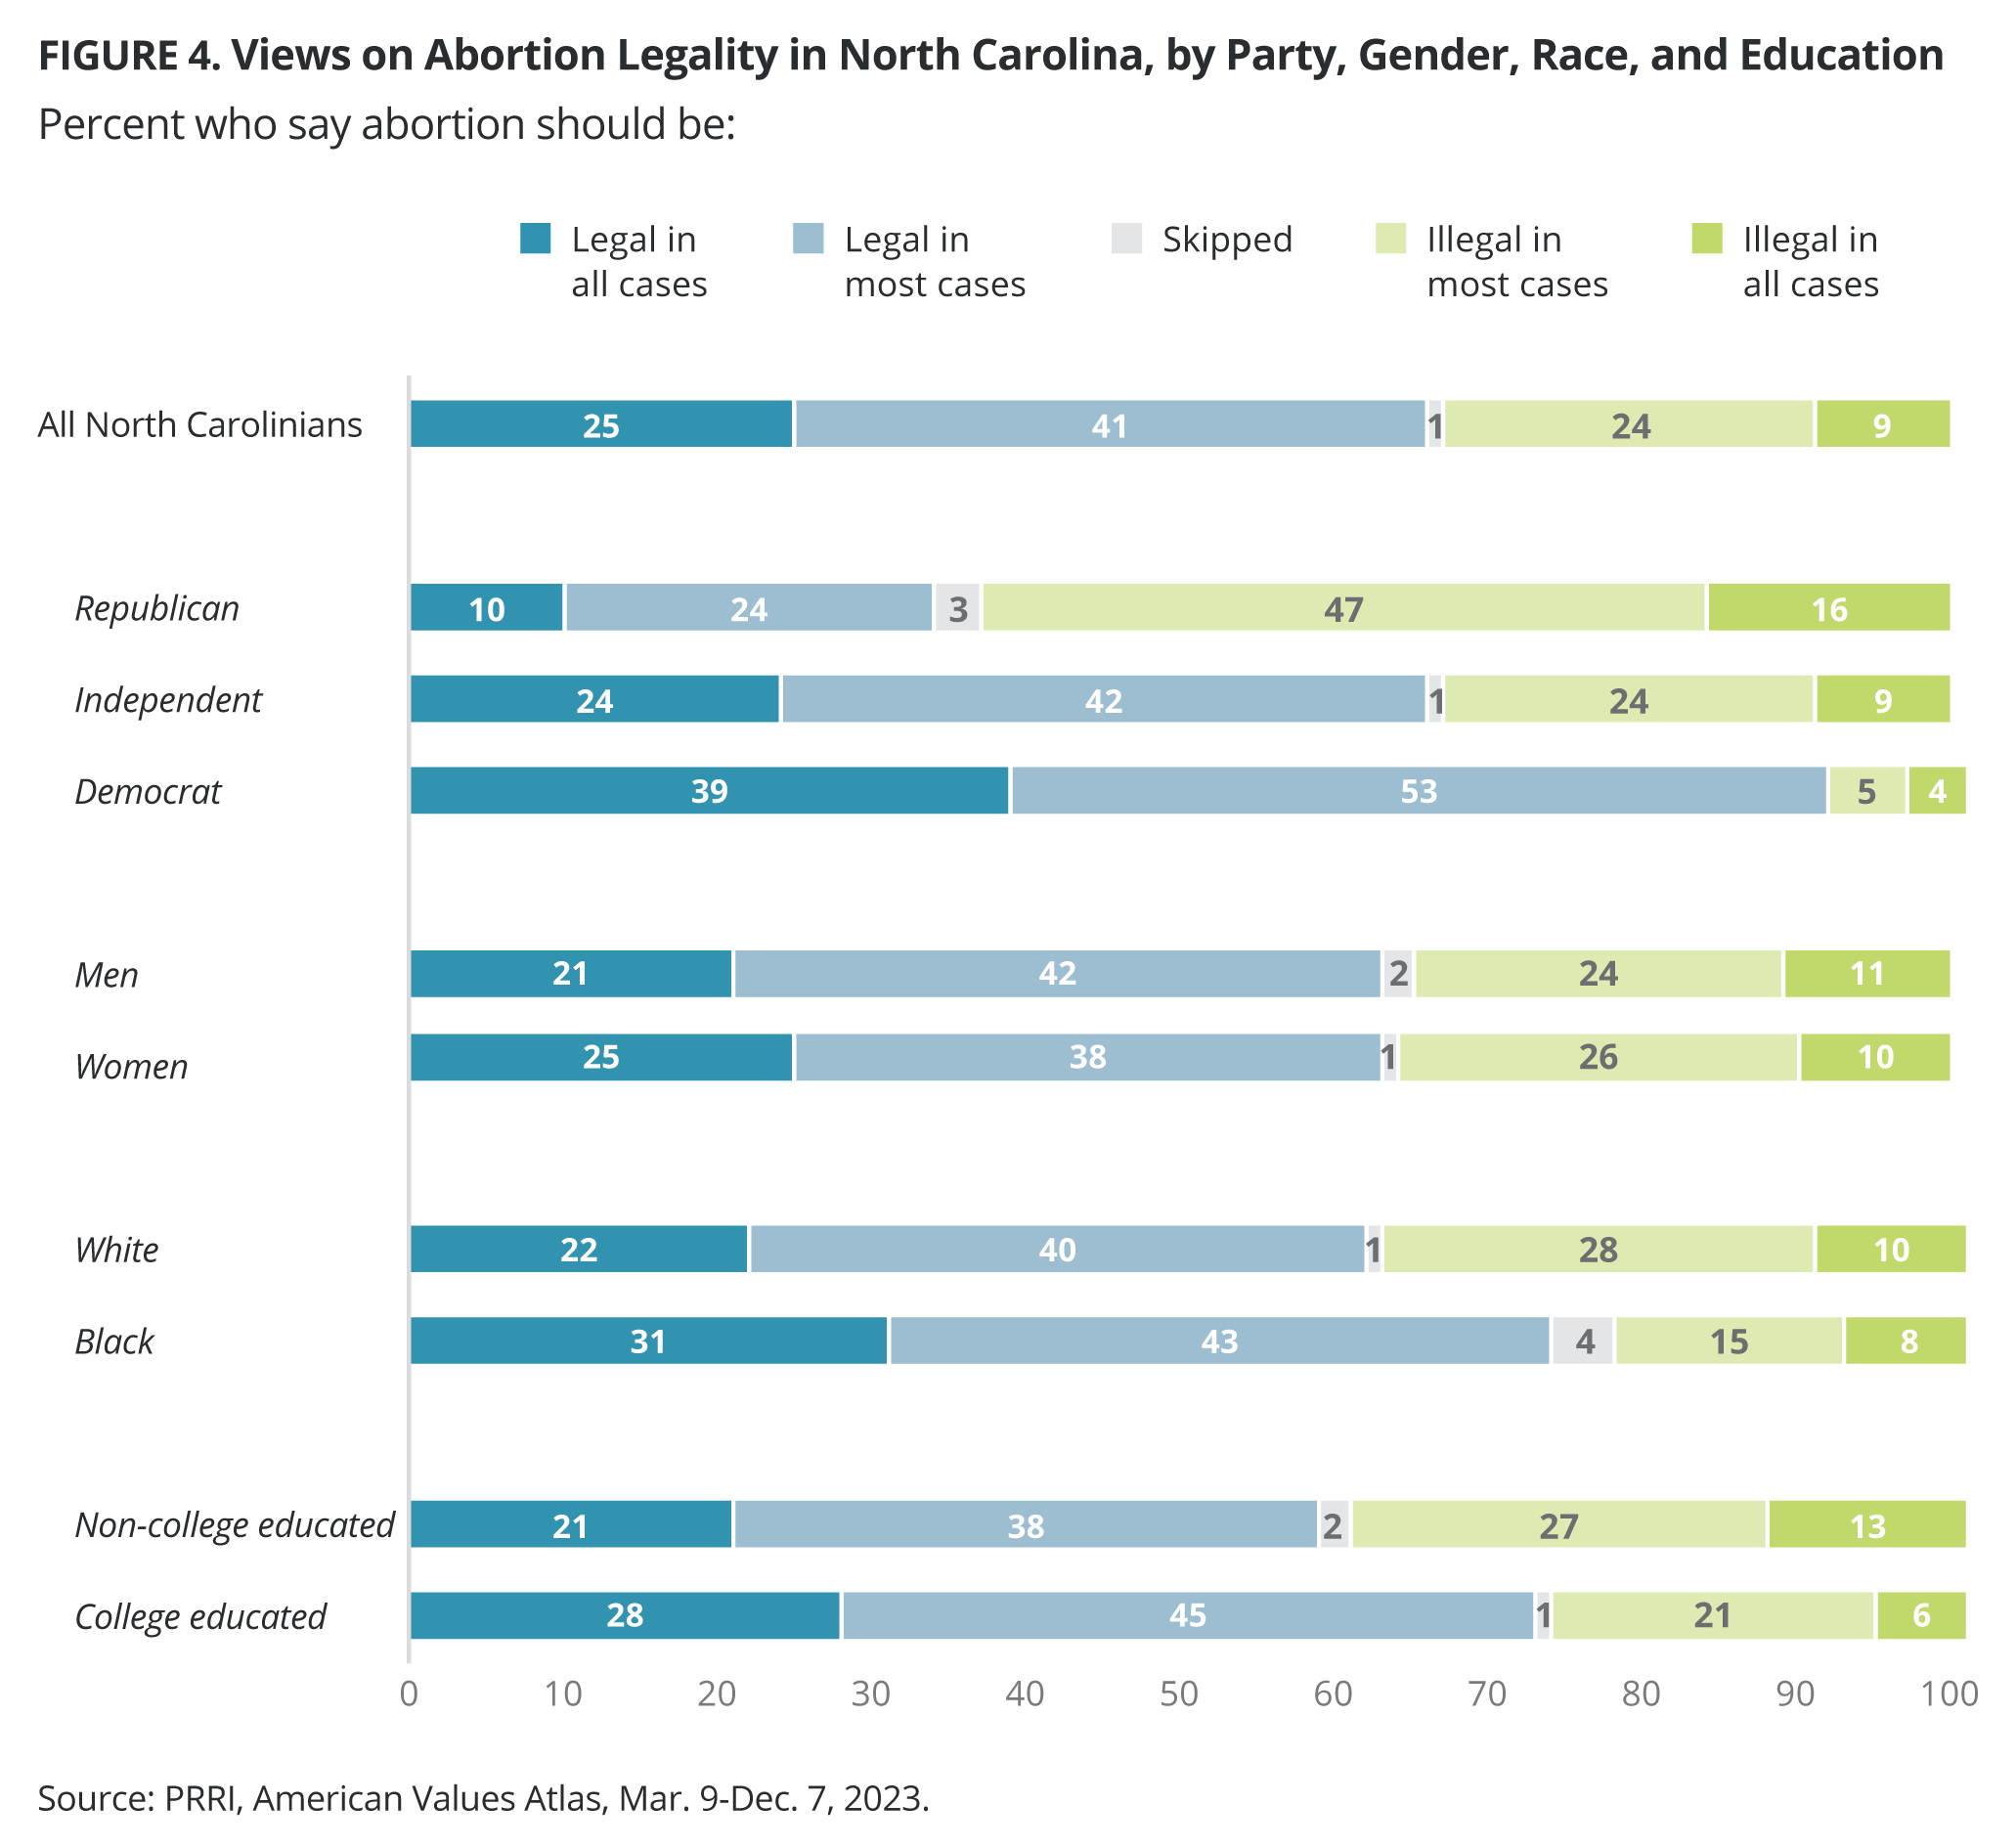
North Carolina has one of the nation’s most restrictive abortion policies, however, North Carolinians’ overall opinions on abortion do not reflect the state’s laws. Two-thirds of North Carolinians support legal abortion (66%), including 25% who believe it should be legal in all cases and 41% who believe it should be legal in most cases. In contrast, 24% of North Carolinians believe abortion should be illegal in most cases and only 9% believe it should be illegal in all cases.
The vast majority of North Carolina Democrats (92%) support legal abortion, as do the majority of independents (66%). Around one-third of North Carolina Republicans (34%) support abortion legality, while 63% say abortion should be illegal.
Men and women in North Carolina support abortion legality at identical rates (both 63%). Black North Carolinians (74%) are considerably more likely than white North Carolinians (62%) to support abortion legality. North Carolinians with a college degree (73%) are also notably more likely than those without a college degree (59%) to support abortion legality.

Explore the 2024 battleground states in additional PRRI Spotlight Analyses:


