

In the 2020 election, President Joe Biden won the state of Georgia by an extremely slim margin: 49.5% of the state’s votes went to Biden, while 49.3% went to former President Donald Trump. Using data from PRRI’s 2023 American Values Atlas, this Spotlight Analysis presents a demographic and religious profile of Georgians and the issues that are vital to their voting choices ahead of this fall’s presidential election.
- The median age of adults in Georgia is 49, similar to the median age of Americans nationally (48).
- A plurality of Georgians (37%) have a high school education or less. Around one in four Georgians (27%) have some college education, 19% have a college degree, and 17% have a postgraduate degree.
- Nearly six in ten (58%) Georgians are white, 28% are Black, 7% are Hispanic, 5% are Asian American or Pacific Islander (AAPI), and 1% are multiracial. Georgia has a higher rate of Black residents than the national average (28% vs. 12%, respectively), but a lower percentage of Hispanic residents than the national average (7% vs. 17%, respectively).
- Three in ten Georgians are Democrats (30%), while 27% are independents and 31% are Republicans. Georgians are more likely to identify as Republican than Americans nationally (31% vs. 27%, respectively).
- The majority of Georgians identify as ideologically conservative (38%) or moderate (34%), compared with 24% who identify as liberal. Georgians are more likely than the national average to identify as conservative (38% vs. 34%, respectively) and less likely to identify as liberal (24% vs. 28%, respectively).
- Based on PRRI’s Christian nationalism scale, the majority of Georgians do not qualify as Christian nationalism supporters; this includes 36% of Georgians who qualify as Christian nationalism Skeptics and 26% who qualify as Christian nationalism Rejecters. Less than one in four Georgians (22%) qualify as Christian nationalism Sympathizers and only 11% qualify as Christian nationalism Adherents.
Georgia’s Religious Landscape
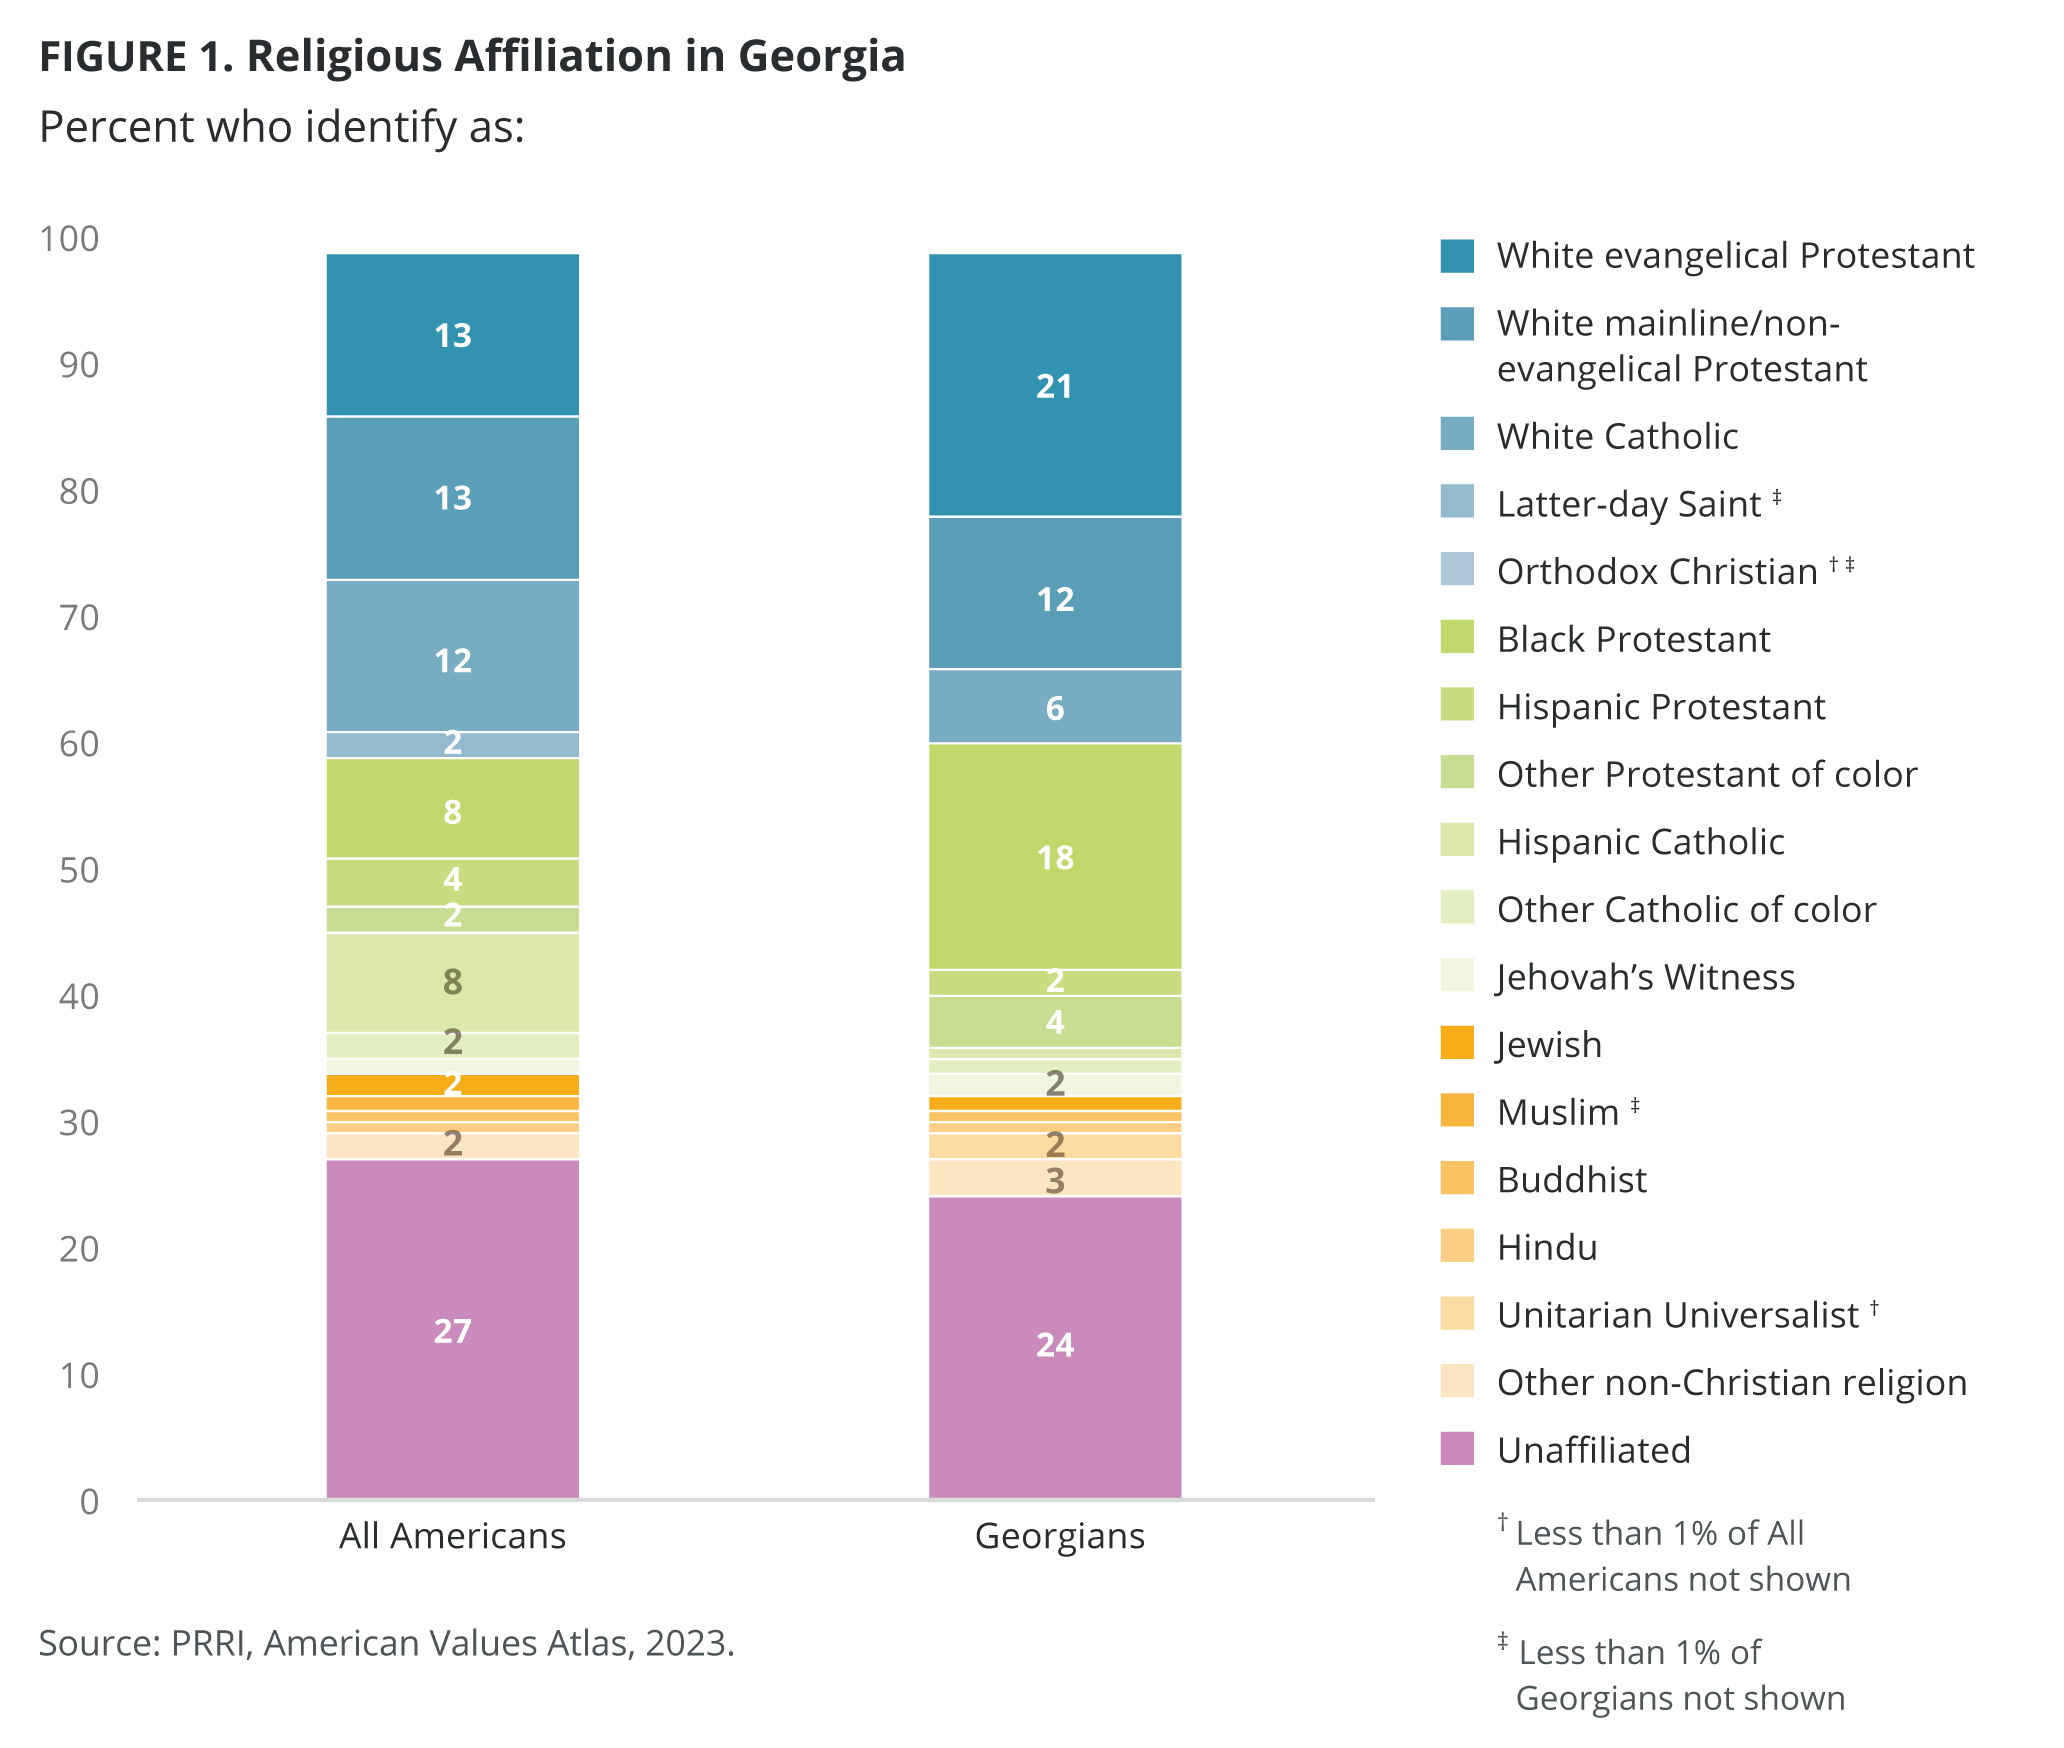
Nearly one in four Georgians (24%) are religiously unaffiliated, representing the largest religious category in the state —comparable to the level of unaffiliated Americans nationally. Nearly two in ten Georgians (18%) are Black Protestants, compared with 8% of Americans at large. One in five Georgians (21%) are white evangelical Protestants, a higher rate than the national average (13%). There are lower percentages of white Catholics and Hispanic Catholics in Georgia compared with the nation at large (6% vs. 12% and 1% vs. 8%, respectively).
Georgians’ Litmus Test Issues by Party Affiliation
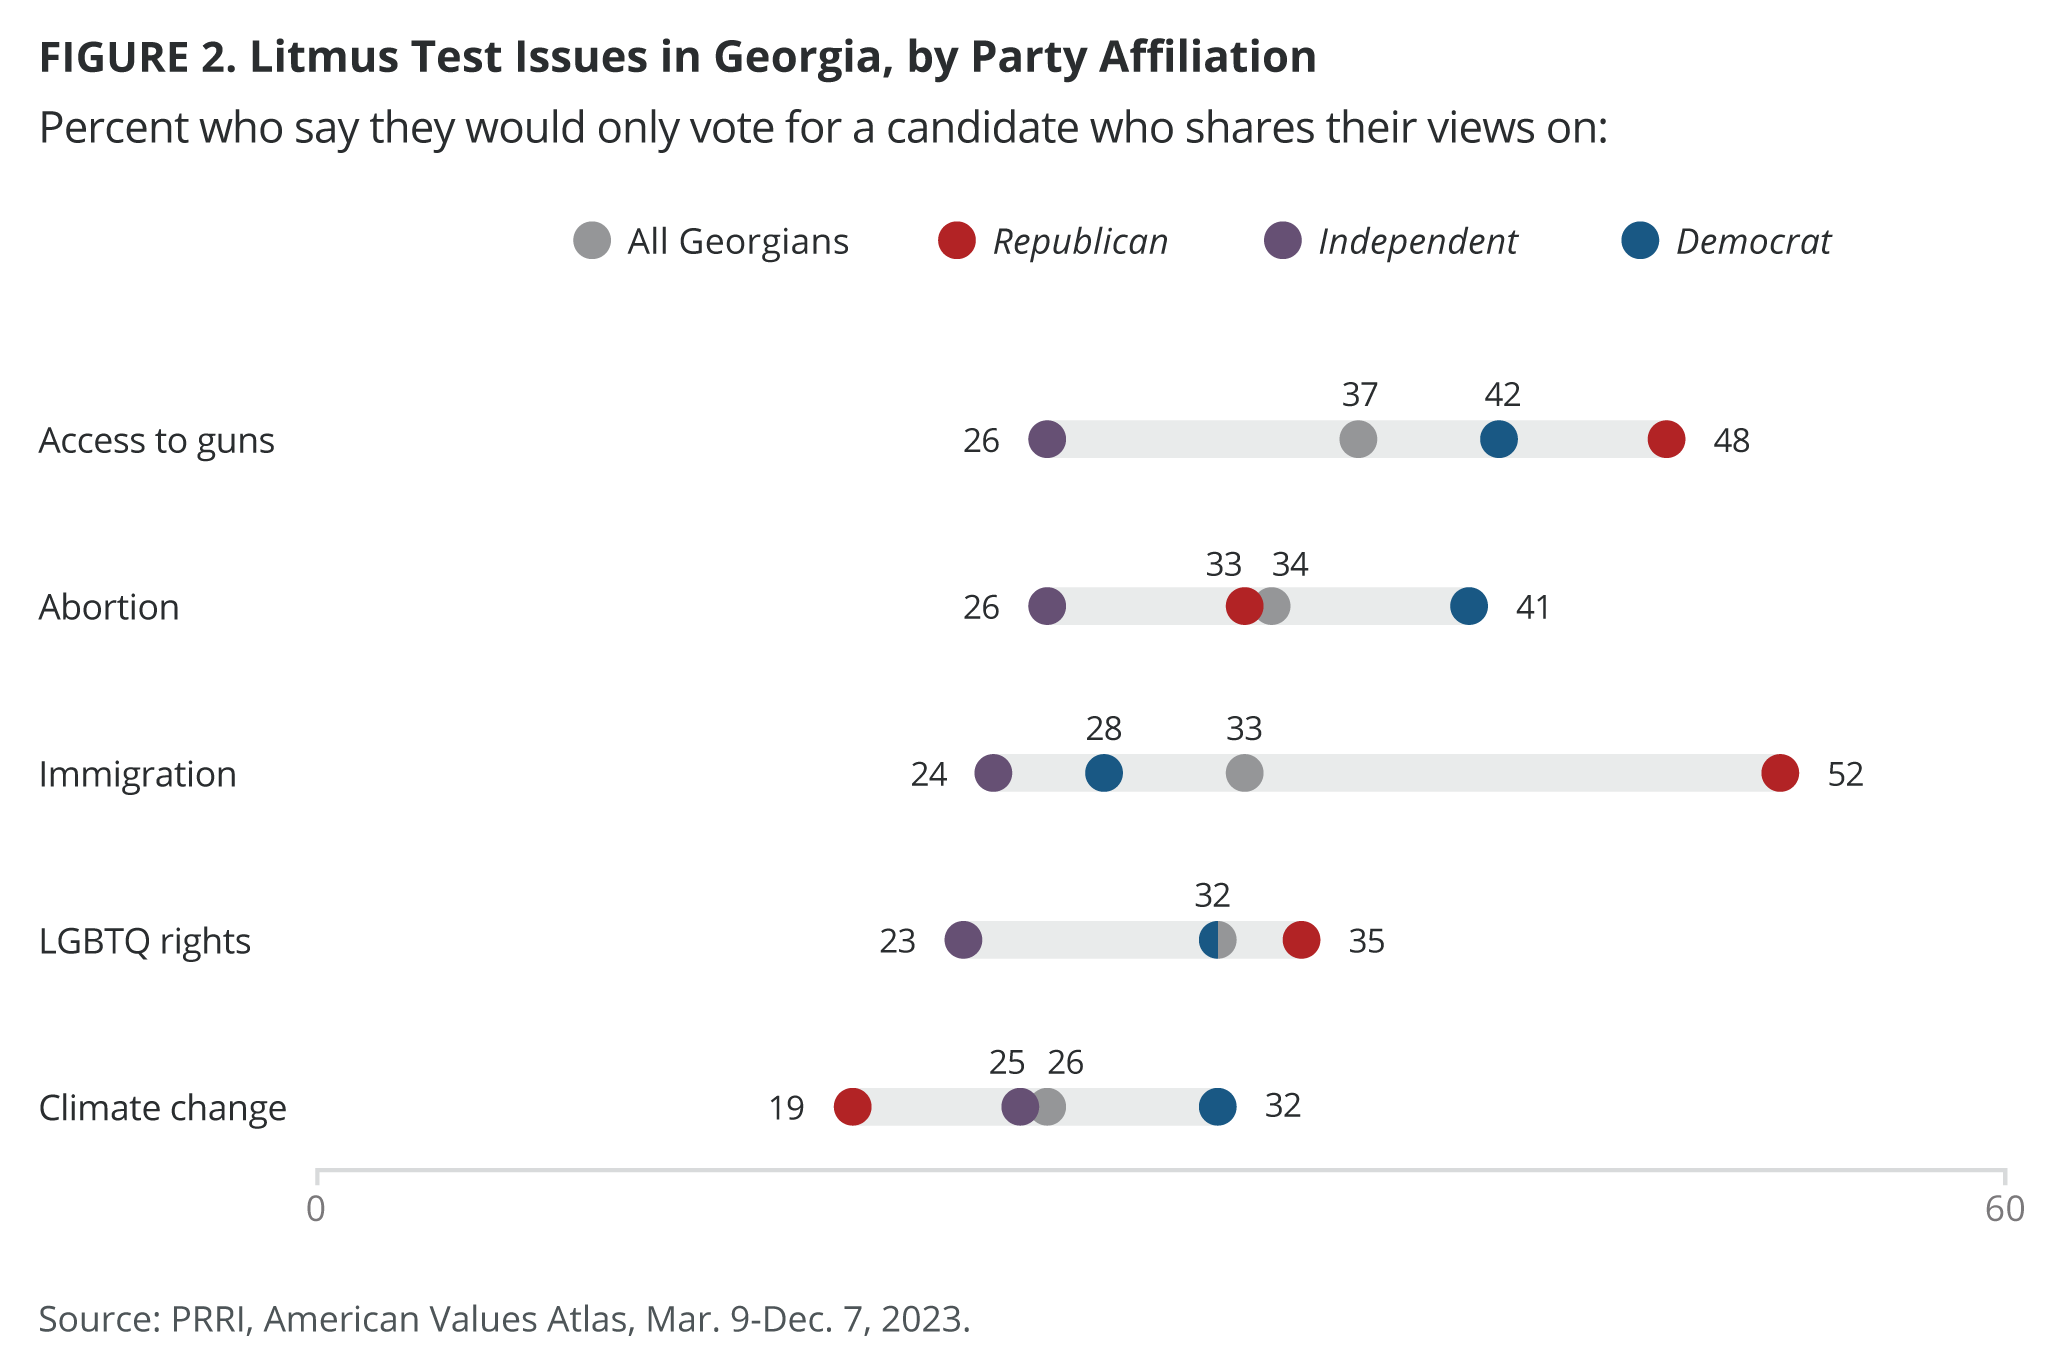
Nearly four in ten Georgians (37%) say they would only vote for a candidate who shares their views on access to guns. Nearly half of Republicans (48%), 42% of Democrats, and 26% of independents hold this view.
More than one-third of Georgians (34%) say they would only vote for a candidate who shares their view on abortion. Georgia Democrats (41%) are more likely than independents (26%) to only vote for a candidate who shares their views on abortion, but do not differ significantly from Republicans (33%).
Around one in four Georgians (26%) would only vote for a candidate who shares their views on climate change; this includes one-third of Georgia Democrats (32%), one-quarter of independents (25%), and two in ten Republicans (19%).
When it comes to immigration, about one-third of Georgians (33%) say they would only vote for a candidate who shares their view on this topic. Republicans (52%) are nearly twice as likely as Democrats (28%) and independents (24%) to only vote for a candidate who shares their views on immigration.
Around one-third of Georgians (32%), including Republicans (35%), Democrats (32%), and independents (23%), would only vote for a candidate who shares their views on LGBTQ rights.
Attitudes Toward LGBTQ Rights in Georgia
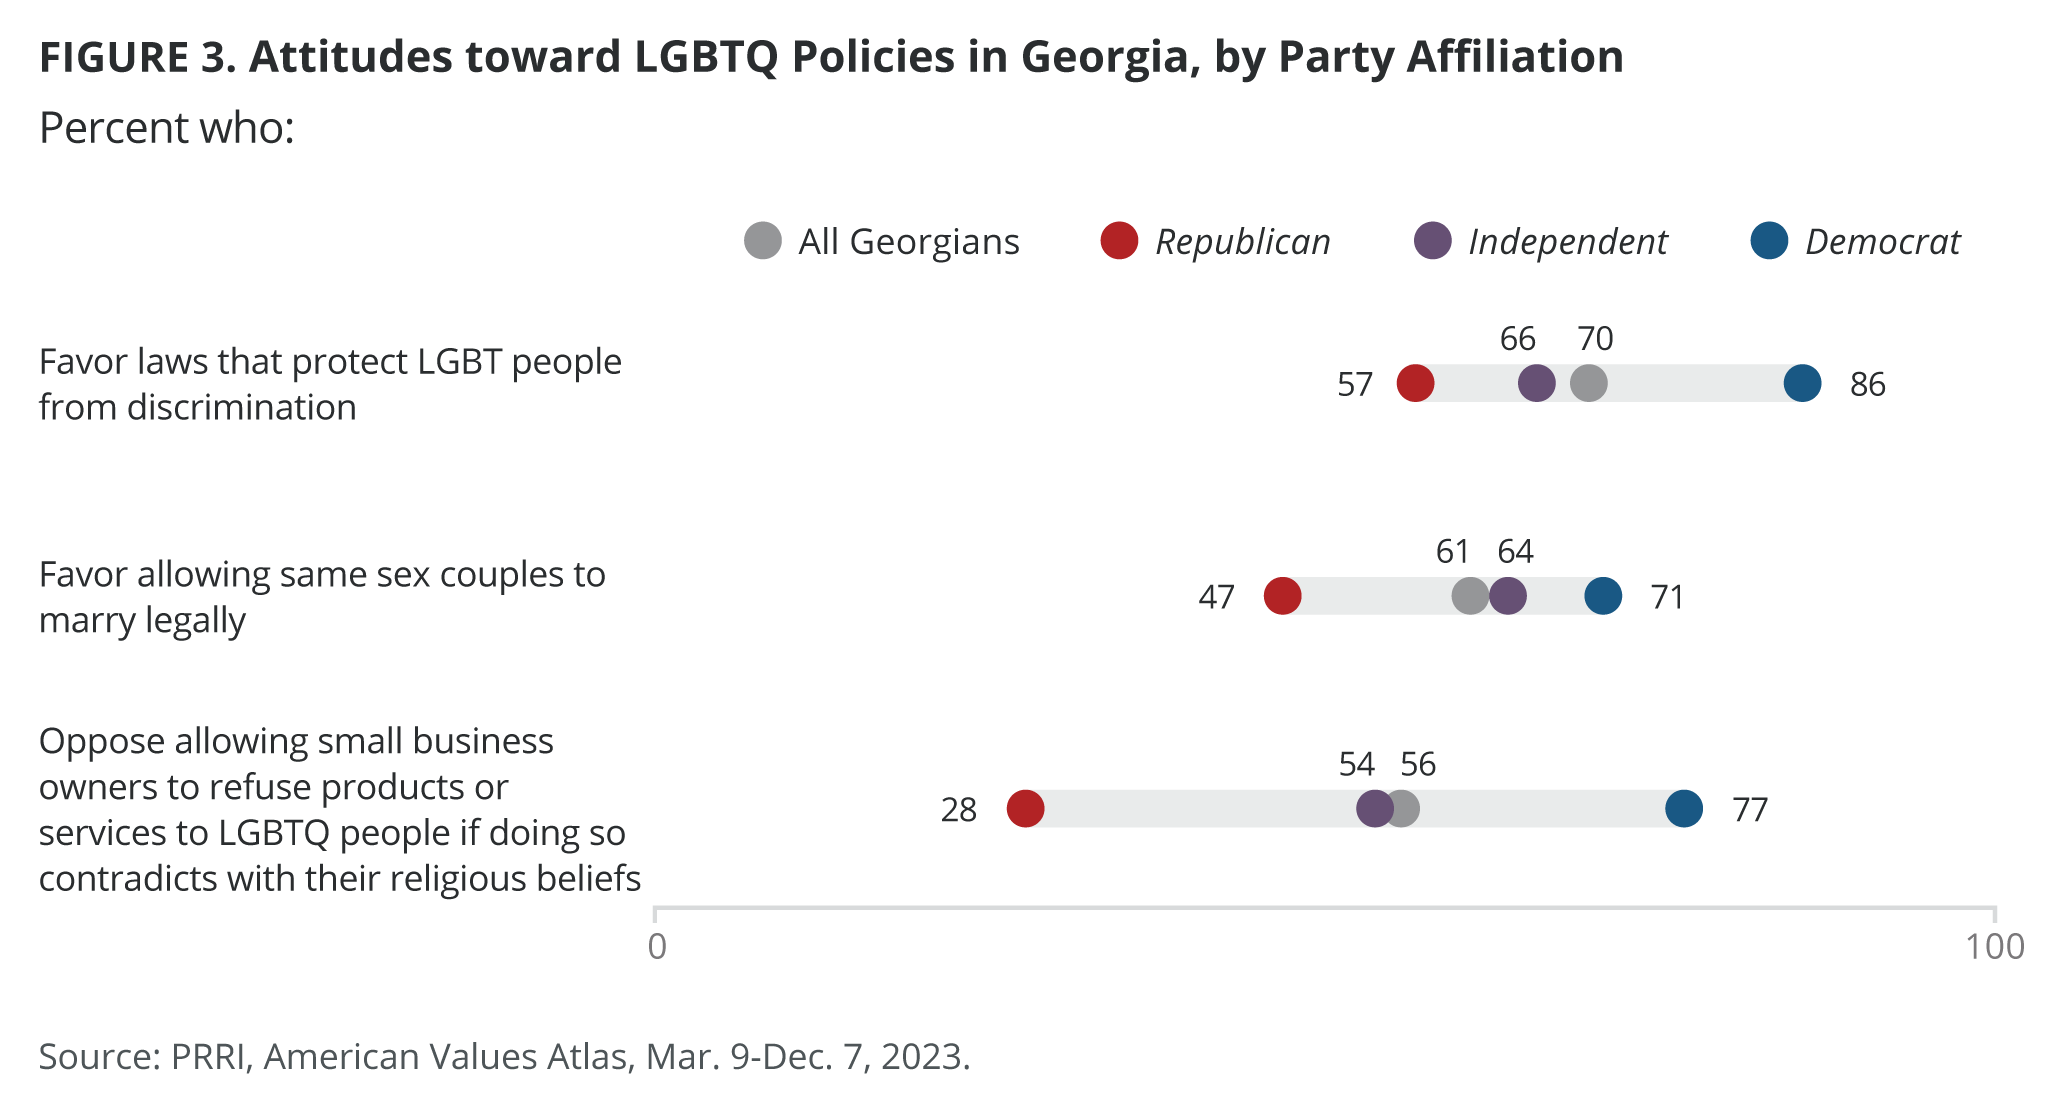
Seven in ten Georgians (70%) favor laws that prevent LGBTQ individuals from discrimination. The vast majority of Georgia Democrats (86%) favor LGBTQ nondiscrimination laws, and they are significantly more likely than Georgia independents (66%) and Georgia Republicans (57%) to do so.
A slim majority of Georgians (56%) oppose allowing small business owners to refuse products or services to LGBTQ individuals if doing so contradicts their religious beliefs as do 77% of Georgia Democrats, 54% of Georgia independents, and 28% of Georgia Republicans.
Six in ten Georgians (61%) favor allowing same-sex couples to marry legally. Majorities of Georgia Democrats (71%) and independents (64%) favor same-sex marriage, compared with 47% of Georgia Republicans.
Attitudes Toward Abortion in Georgia
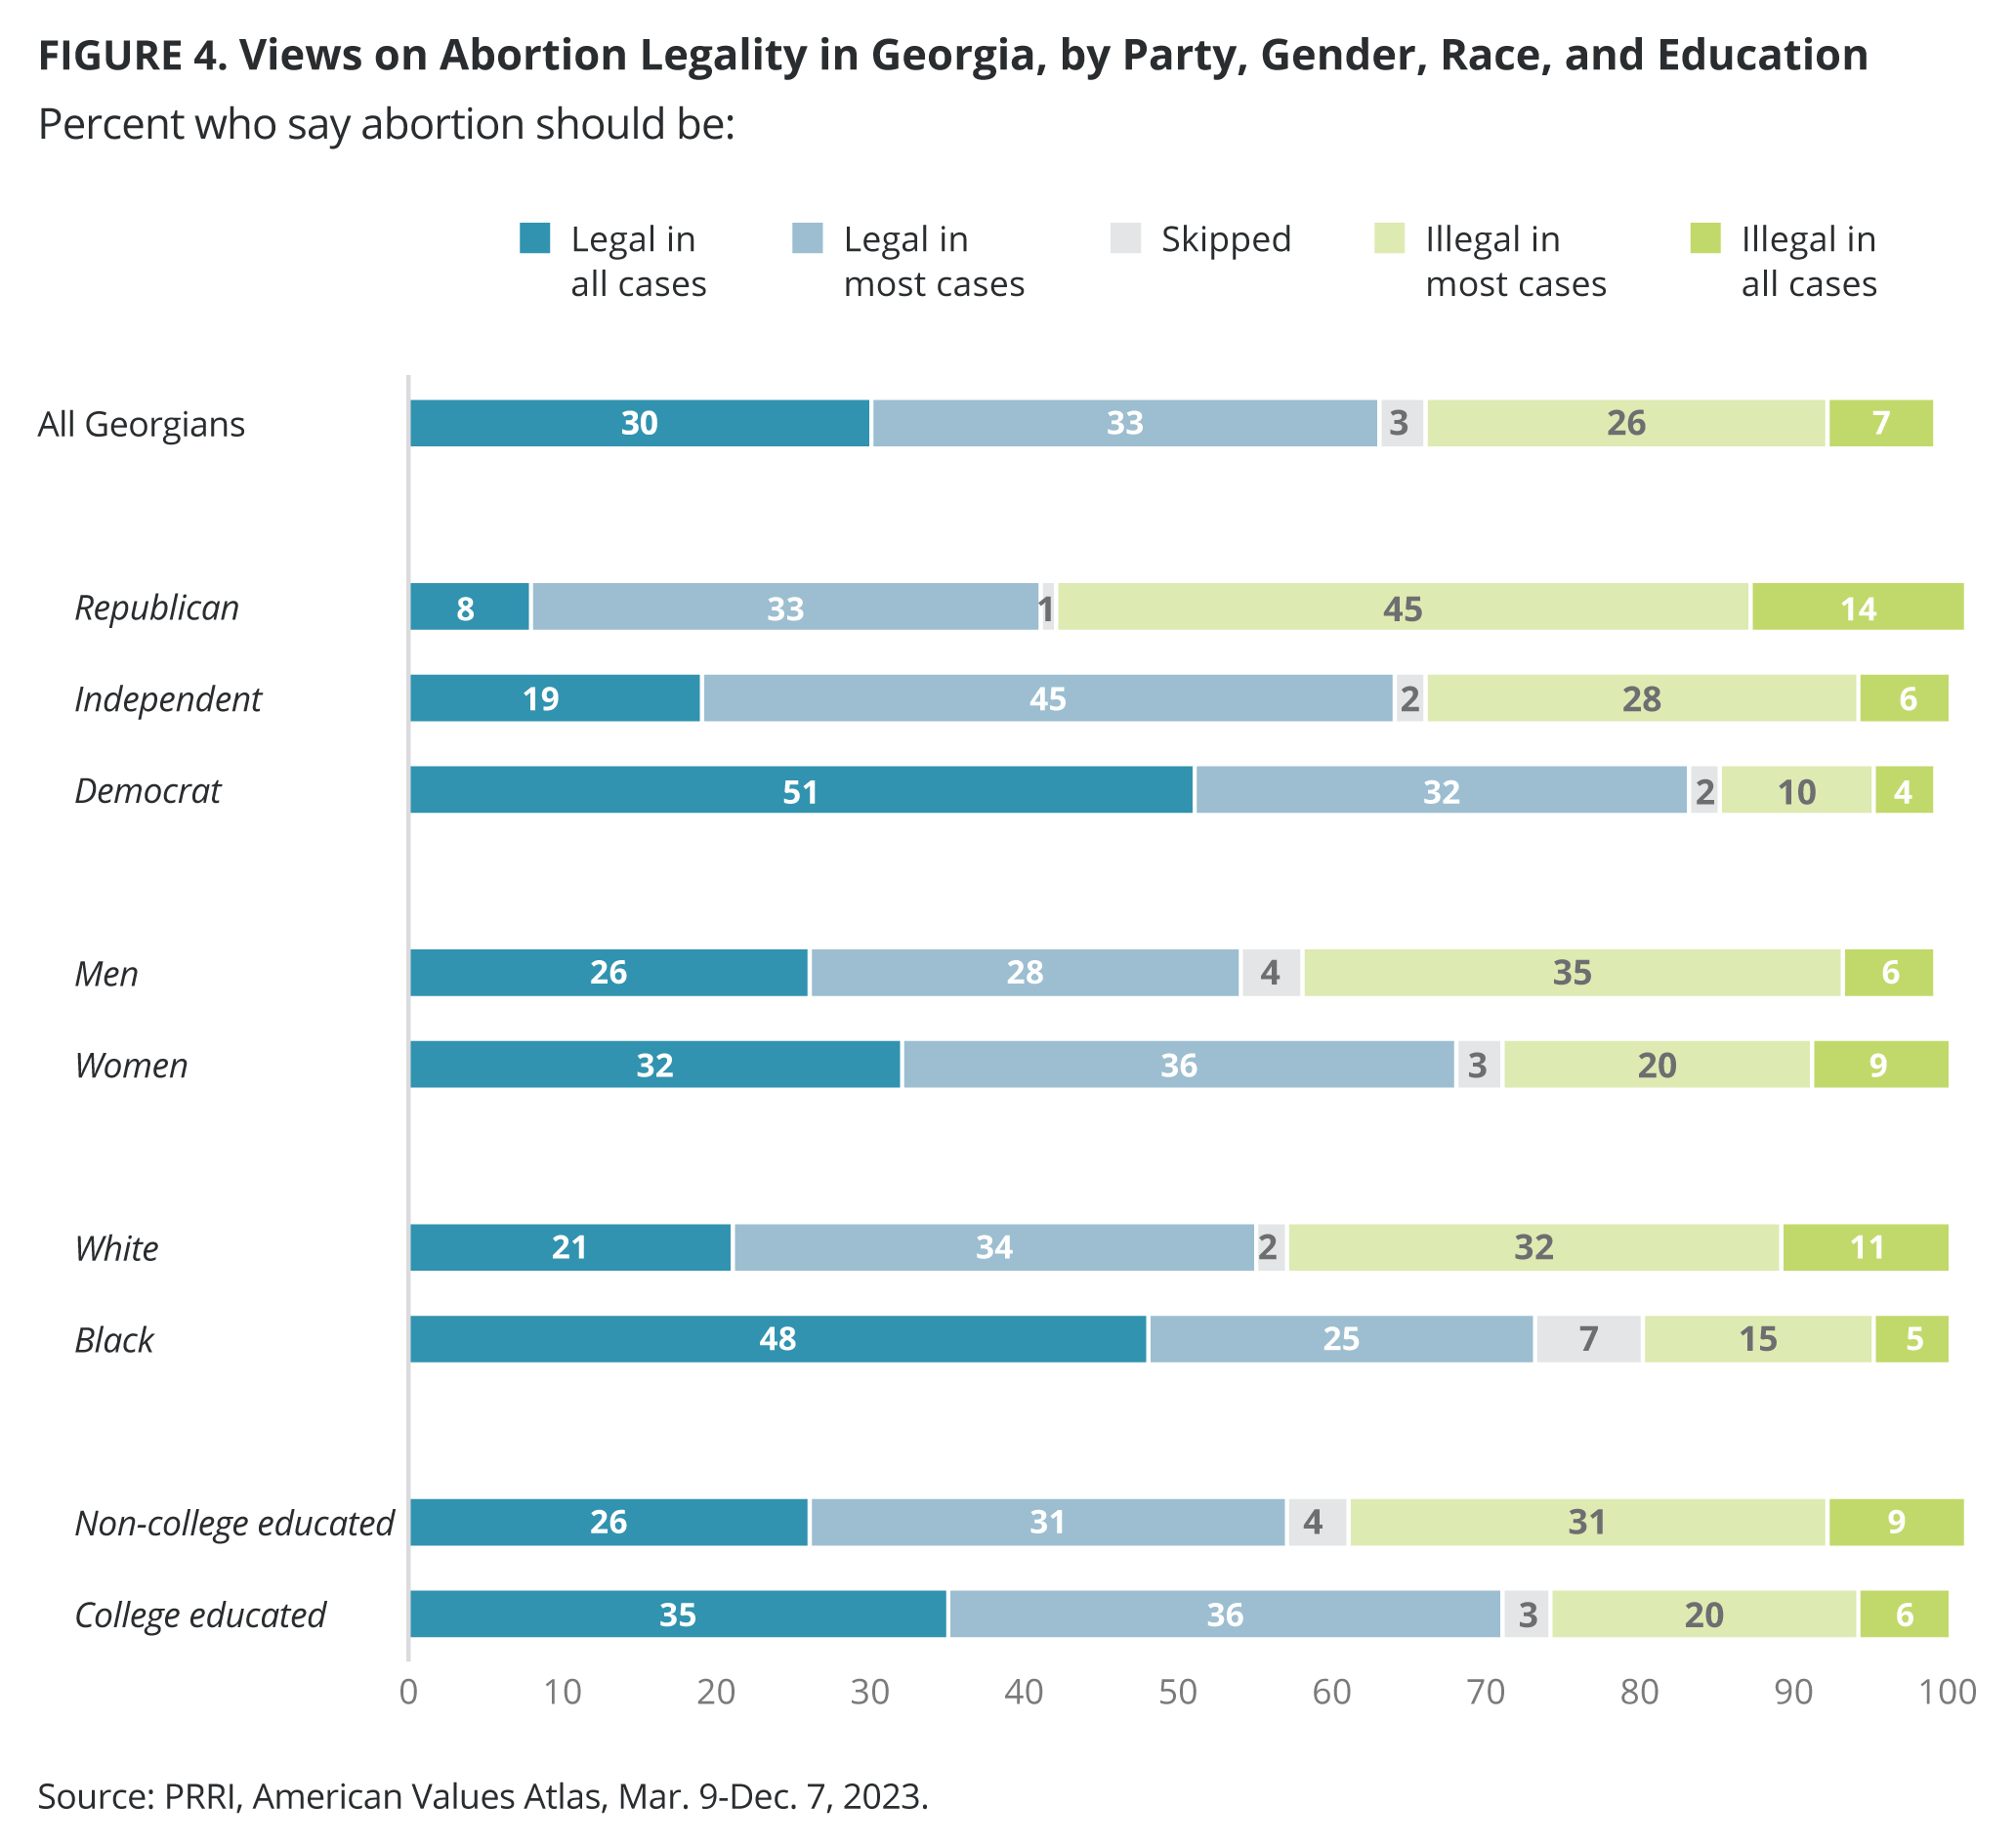
Georgia currently has one of the nation’s most restrictive abortion policies. However, Georgians’ overall attitudes towards abortion legality stand in opposition to the state law. Nearly two-thirds of Georgians support legal abortion legality, including three in ten who say it should be legal in all cases (30%) and one-third who say it should be legal in most cases (33%). In comparison, one-quarter of Georgians say abortion should be illegal in most cases (26%) and only 7% say it should be illegal in all cases.
A vast majority of Georgia Democrats (83%) and Georgia independents (64%) favor legal access to abortion, compared with 41% of Georgia Republicans.
Nearly seven in ten Georgia women (68%) say that abortion should be legal in all or most cases, compared with 54% of Georgia men. Around three-quarters of Black Georgians (73%) say abortion should be legal in most or all cases, with nearly half (48%) agreeing it should be legal in all cases. In comparison, 55% of white Georgians support abortion legality in most or all cases. Seven in ten Georgians with a college degree or higher (71%) support legal abortion, compared with nearly six in ten non-college educated Georgians (57%). Georgia
Learn more about each battleground state:


