LGBT Nondiscrimination Laws
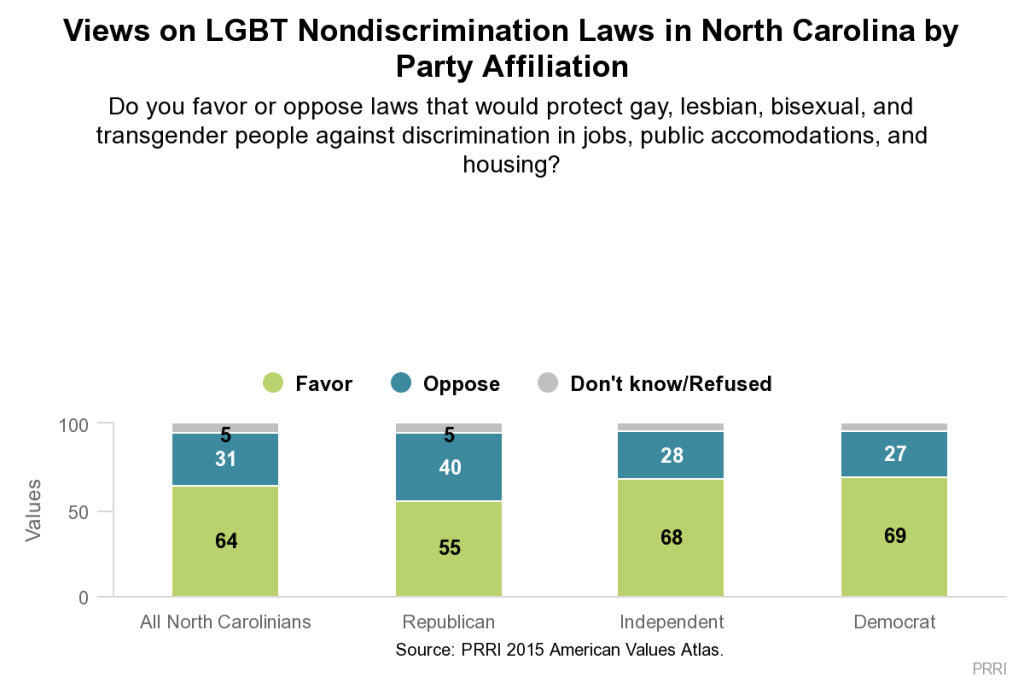
More than six in ten (64%) North Carolina residents favor laws that would protect gay, lesbian, bisexual, and transgender people from discrimination in jobs, public accommodations, and housing, while roughly one in three (31%) are opposed. While support for LGBT nondiscrimination laws is lower in North Carolina than it is nationally (71% favor), majorities of all major demographic, political, and religious groups in the state favor them.
In keeping with national trends, there are stark generational divisions among North Carolinians. Fully three-quarters (75%) of North Carolina residents under the age of 30 support nondiscrimination laws for LGBT people. Support among seniors (age 65 and over) in the state is noticeably weaker; a majority (55%) of North Carolina seniors favor nondiscrimination laws, while nearly four in ten (37%) oppose them.
The views of white and black North Carolina residents are largely similar. At least six in ten white (65%) and black (60%) North Carolina residents favor laws that protect LGBT people from discrimination.
Support for LGBT nondiscrimination laws in North Carolina crosses the political divide, although the strength of support varies considerably. Nearly seven in ten North Carolina Democrats (69%) and independents (68%) favor these laws, compared to a smaller share (55%) of Republicans in the state. Forty percent of North Carolina Republicans express opposition to LGBT nondiscrimination laws.
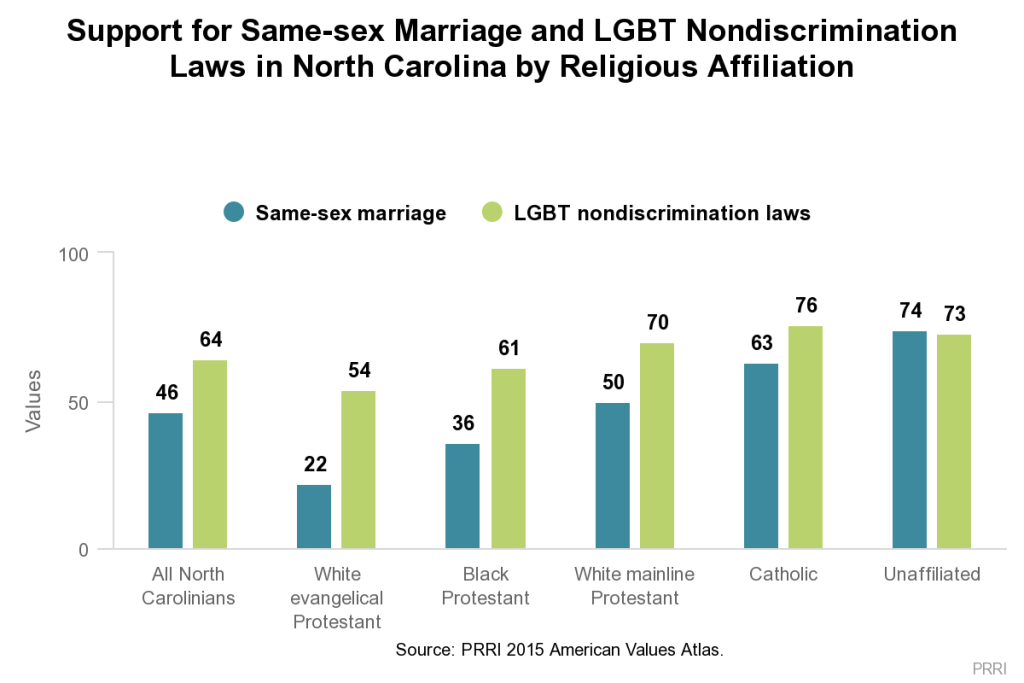
 Majorities of all major religious groups in North Carolina support LGBT nondiscrimination laws. At least seven in ten Catholics (76%), religiously unaffiliated North Carolinians (73%), and white mainline Protestants (70%) favor LGBT nondiscrimination laws. Approximately six in ten (61%) black Protestants say the same. Even among white evangelical Protestants, a majority (54%) express support for nondiscrimination laws that include LGBT people, while roughly four in ten (41%) oppose them.
North Carolinians who live in the state’s largest metropolitan areas are much more likely to support nondiscrimination laws than residents of the more rural regions of the state. More than seven in ten (71%) residents of the Charlotte1 and the Raleigh-Durham metropolitan areas favor LGBT nondiscrimination laws, while only six in ten (60%) residents of other parts of the state say the same.
Religious Exemptions
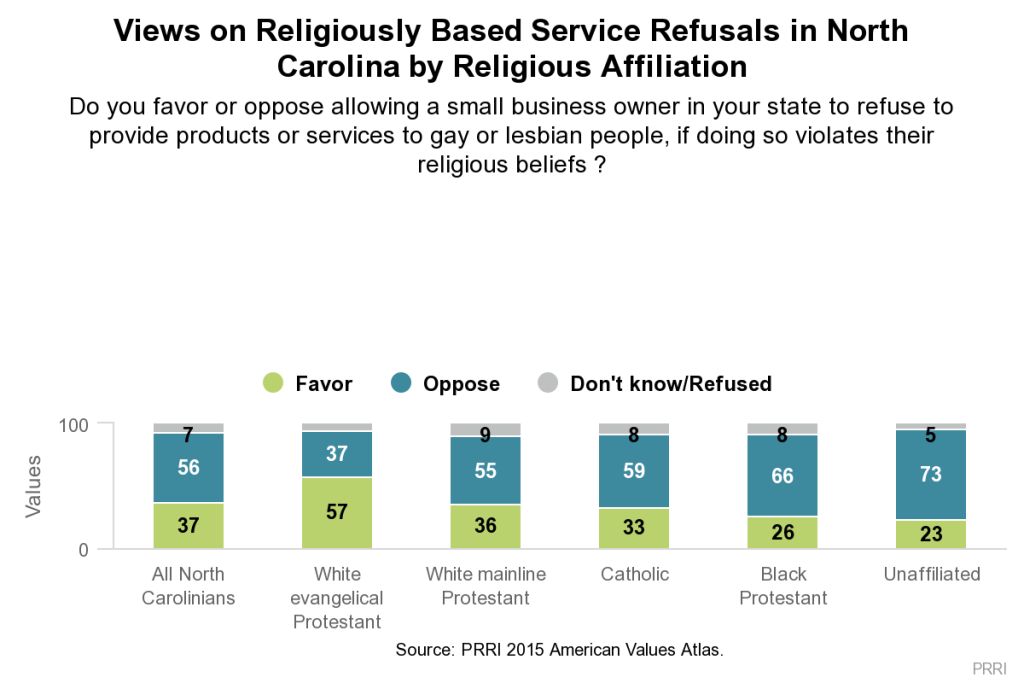
A majority (56%) of North Carolinians oppose allowing a small business owner to refuse to provide products or services to gay or lesbian people if doing so violates their religious beliefs, while nearly four in ten (37%) favor such a policy. Support for allowing religiously based service refusals of LGBT people among North Carolina residents is similar to levels among Americans overall (59% oppose, 35% favor).
There are significant generational differences in attitudes on whether small business owners should be allowed to deny service to gay or lesbian people on religious grounds. Nearly two-thirds (65%) of young North Carolina residents (age 18 to 29) oppose allowing small business owners to refuse products or services to gay or lesbian individuals if doing so violates their religious beliefs. North Carolina seniors (age 65 and older) are much more divided: a slim majority (51%) oppose allowing religiously based service refusals, while 39% favor allowing these refusals. One in ten (10%) seniors in the state offer no opinion on this issue.
Unlike views of nondiscrimination laws, there are substantial differences between white and black residents of the state. Nearly seven in ten (69%) black North Carolina residents oppose allowing small businesses to refuse service of gay and lesbian customers, a view shared by only half (50%) of white North Carolinians. More than four in ten (42%) white North Carolina residents, compared to fewer than one-quarter (24%) of black North Carolinians, say small business owners ought to be allowed to refuse goods or services to LGBT people if doing so would violate their religious beliefs.
North Carolina Democrats and Republicans express sharply contrasting views on the issue of religiously based service refusals of gay and lesbian people. Approximately two-thirds (68%) of Democrats oppose allowing small business owners to refuse service to gay or lesbian individuals on religious grounds, a view shared by fewer than four in ten (39%) Republicans. A majority (55%) of Republicans in North Carolina favor allowing these religiously based service refusals. The views of independents mirror the views of North Carolinians overall.
Religious groups in the state are also deeply divided over the issue. Nearly three-quarters (73%) of religiously unaffiliated residents in the state, roughly two-thirds (66%) of black Protestants, and nearly six in ten (59%) Catholics oppose allowing religiously based service refusals of gay or lesbian individuals. A majority (55%) of white mainline Protestants also voice opposition. North Carolinian white evangelical Protestants stand in sharp contrast: most (57%) favor allowing religiously based service refusals, while fewer than four in ten (37%) are opposed.
 Regional differences in the state are also pronounced, with North Carolinians living in the Charlotte metro area and the Research Triangle more likely to oppose religiously based service refusals than their peers living in other parts of the state. Six in ten (60%) residents of North Carolina’s largest metro areas oppose religiously-based service refusals, compared to 53% of North Carolinians living in more rural areas.
Same-sex Marriage
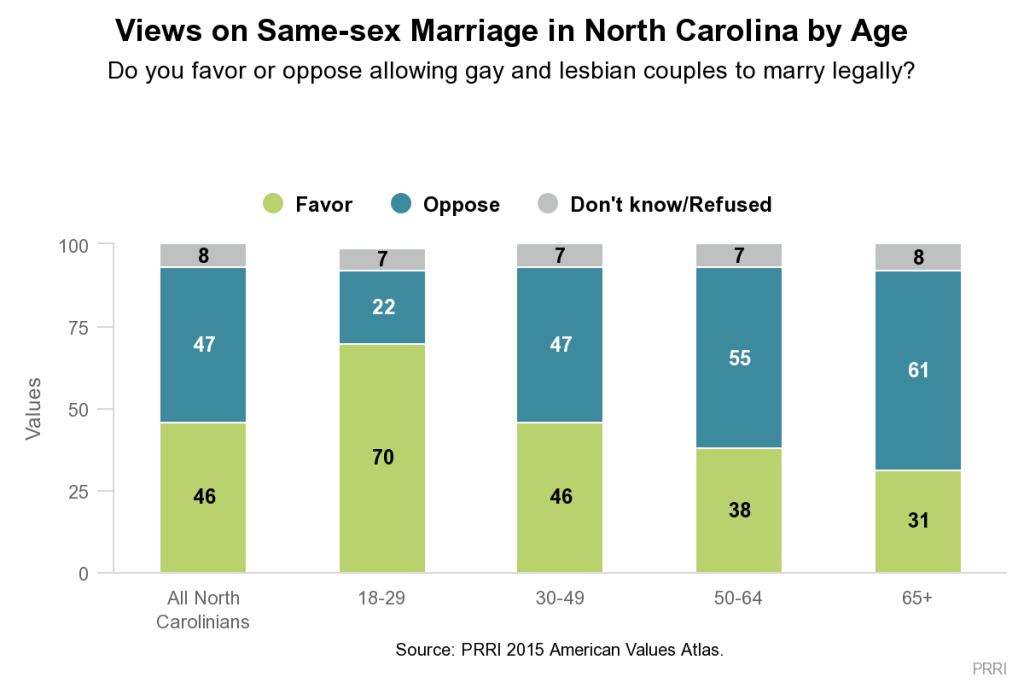
North Carolinians are closely divided on the issue of same-sex marriage: 46% of residents favor allowing gay and lesbian couples to marry legally, while 47% are opposed. North Carolina residents are less likely to support same-sex marriage than the country overall: 53% of Americans are in favor and 37% are opposed.
As is true nationally, North Carolina residents are divided in attitudes about same-sex marriage by generation. Young adults (age 18 to 29) in North Carolina (70%) are more than twice as likely as seniors (age 65 and older) in the state (31%) to favor same-sex marriage. More than six in ten (61%) seniors in North Carolina express opposition to same-sex marriage.
 Attitudes about same-sex marriage vary somewhat more modestly by race. Among white residents of North Carolina, roughly as many support (43%) as oppose (49%) same-sex marriage. In contrast, fewer than four in ten (39%) black North Carolinians support same-sex marriage, while a majority (54%) oppose it.
There are even greater divisions among religious groups in North Carolina. About three-quarters (74%) of religiously unaffiliated North Carolinians express support for same-sex marriage, as do more than six in ten (63%) Catholics and half (50%) of white mainline Protestants in the state. In contrast, a majority (55%) of black Protestants and more than seven in ten (72%) white evangelical Protestants oppose same-sex marriage.
Consistent with national trends, Democrats in North Carolina are significantly more likely than their Republican counterparts to support same-sex marriage. A majority (52%) of North Carolina Democrats support same-sex marriage, compared to just one-quarter (25%) of Republicans in the state. Seventy percent of Republicans oppose same-sex marriage, including about half (48%) who strongly oppose it. Notably, North Carolina Democrats are substantially less supportive of same-sex marriage than Democrats nationally (52% vs. 66%, respectively).
North Carolinians’ attitudes about same-sex marriage also vary geographically, with metropolitan North Carolinians expressing stronger support for same-sex marriage than rural residents of the state. A slim majority (51%) of residents of the Charlotte and Raleigh-Durham metropolitan areas favor same-sex marriage, compared to about four in ten (42%) residents living elsewhere in the state. Half (50%) of North Carolinians who live outside Charlotte and Raleigh-Durham express opposition to same-sex marriage.
The Complex Relationship Between Support for LGBT Nondiscrimination Laws and Same-sex Marriage
As the above analysis makes clear, attitudes about same-sex marriage do not necessarily predict opposition to LGBT nondiscrimination laws. Across a variety of demographic, political, and religious groups in North Carolina—including white evangelical Protestants and Republicans—there is majority support for LGBT nondiscrimination laws despite much lower support for same-sex marriage.
 Unsurprisingly, about nine in ten (88%) residents of North Carolina who support same-sex marriage also support LGBT nondiscrimination laws. However, opponents of same-sex marriage are not overwhelmingly against nondiscrimination laws; more than four in ten (44%) North Carolinians who oppose same-sex marriage favor nondiscrimination laws that would protect LGBT people, while slightly more than half (52%) are opposed.
1 The Charlotte metropolitan area only includes the counties located in North Carolina for this analysis.
For a complete look at where Americans’ stand on these issues, read “Beyond Same-sex Marriage: Attitudes on LGBT Nondiscrimination Laws and Religious Exemptions from the 2015 American Values Atlas.”
To explore where residents in your state stand, explore the interactive American Values Atlas.


