Preliminary data from the 2024 presidential election shows that Americans’ voter turnout among Americans was down slightly compared with the 2020 presidential election—yet higher than turnout for the 2016 presidential race. According to PRRI’s 2024 Post-Election Survey, 59% of registered voters reported voting in the presidential election, while 41% of registered voters sat out this election cycle. Yet, not all groups of Americans were represented among 2024 voters in proportion to their representation in the U.S. population. This Spotlight Analysis compares the demographic profiles of non-voters and voters in the 2024 presidential election.
Profile of Voters vs. Non-Voters
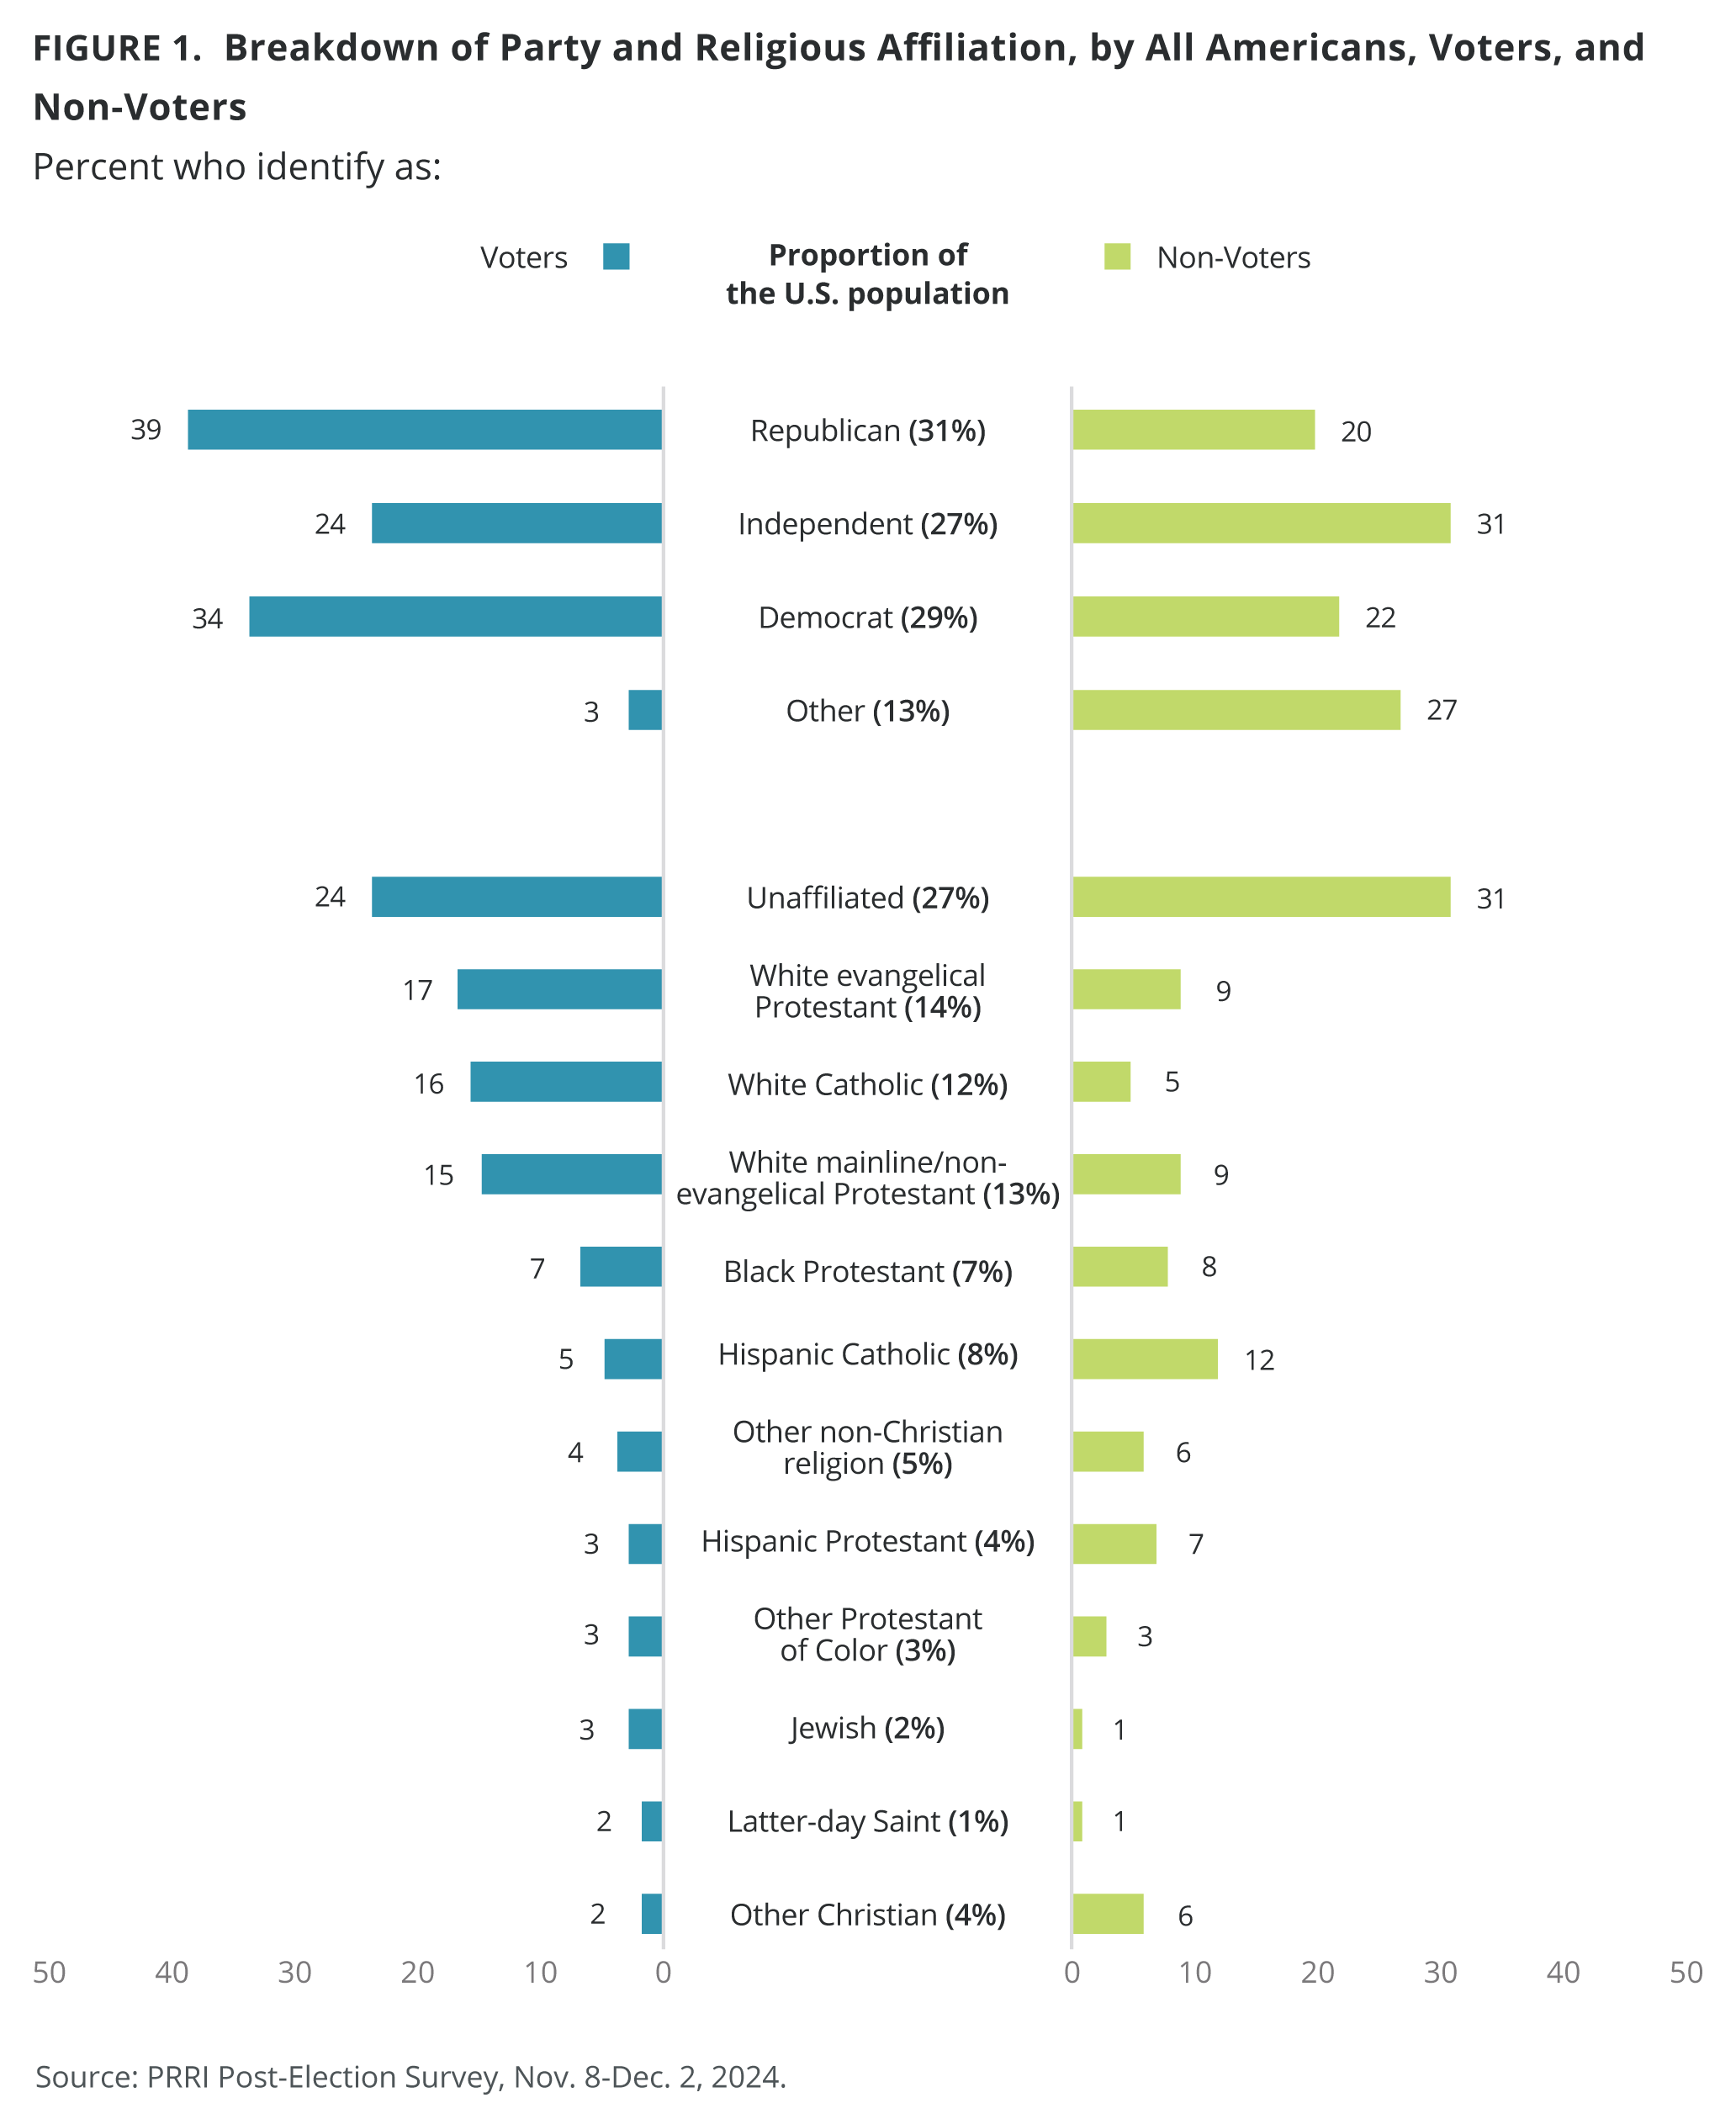
Voters in the 2024 presidential election are notably more likely than non-voters to identify as Republican (39% of voters vs. 20% of non-voters) or Democrat (34% vs. 22%) than as independent (24% vs. 31%). Non-voters are nine times as likely as voters to refuse to identify as Republican, Democratic, or independent (27% vs. 3%). While partisans were overrepresented as voters in the 2024 election, Republicans turned out at slightly higher numbers than Democrats relative to their representation in the U.S. population (8 points vs. 5 points).
White Christian groups are also disproportionately represented among 2024 voters (17% of voters identify as white evangelical Protestant, 15% as white mainline/non-evangelical Protestant, and 16% as white Catholic) compared with non-voters (9%, 9%, and 5%, respectively). In contrast, religiously unaffiliated Americans account for a larger share of non-voters than voters in 2024 (31% vs. 24%). While Black Protestants turned out to vote at rates comparable to their presence in the U.S. population, Hispanic Catholics (5% vs. 12%) and Hispanic Protestants (3% vs. 7%) were less likely to be voters than non-voters.
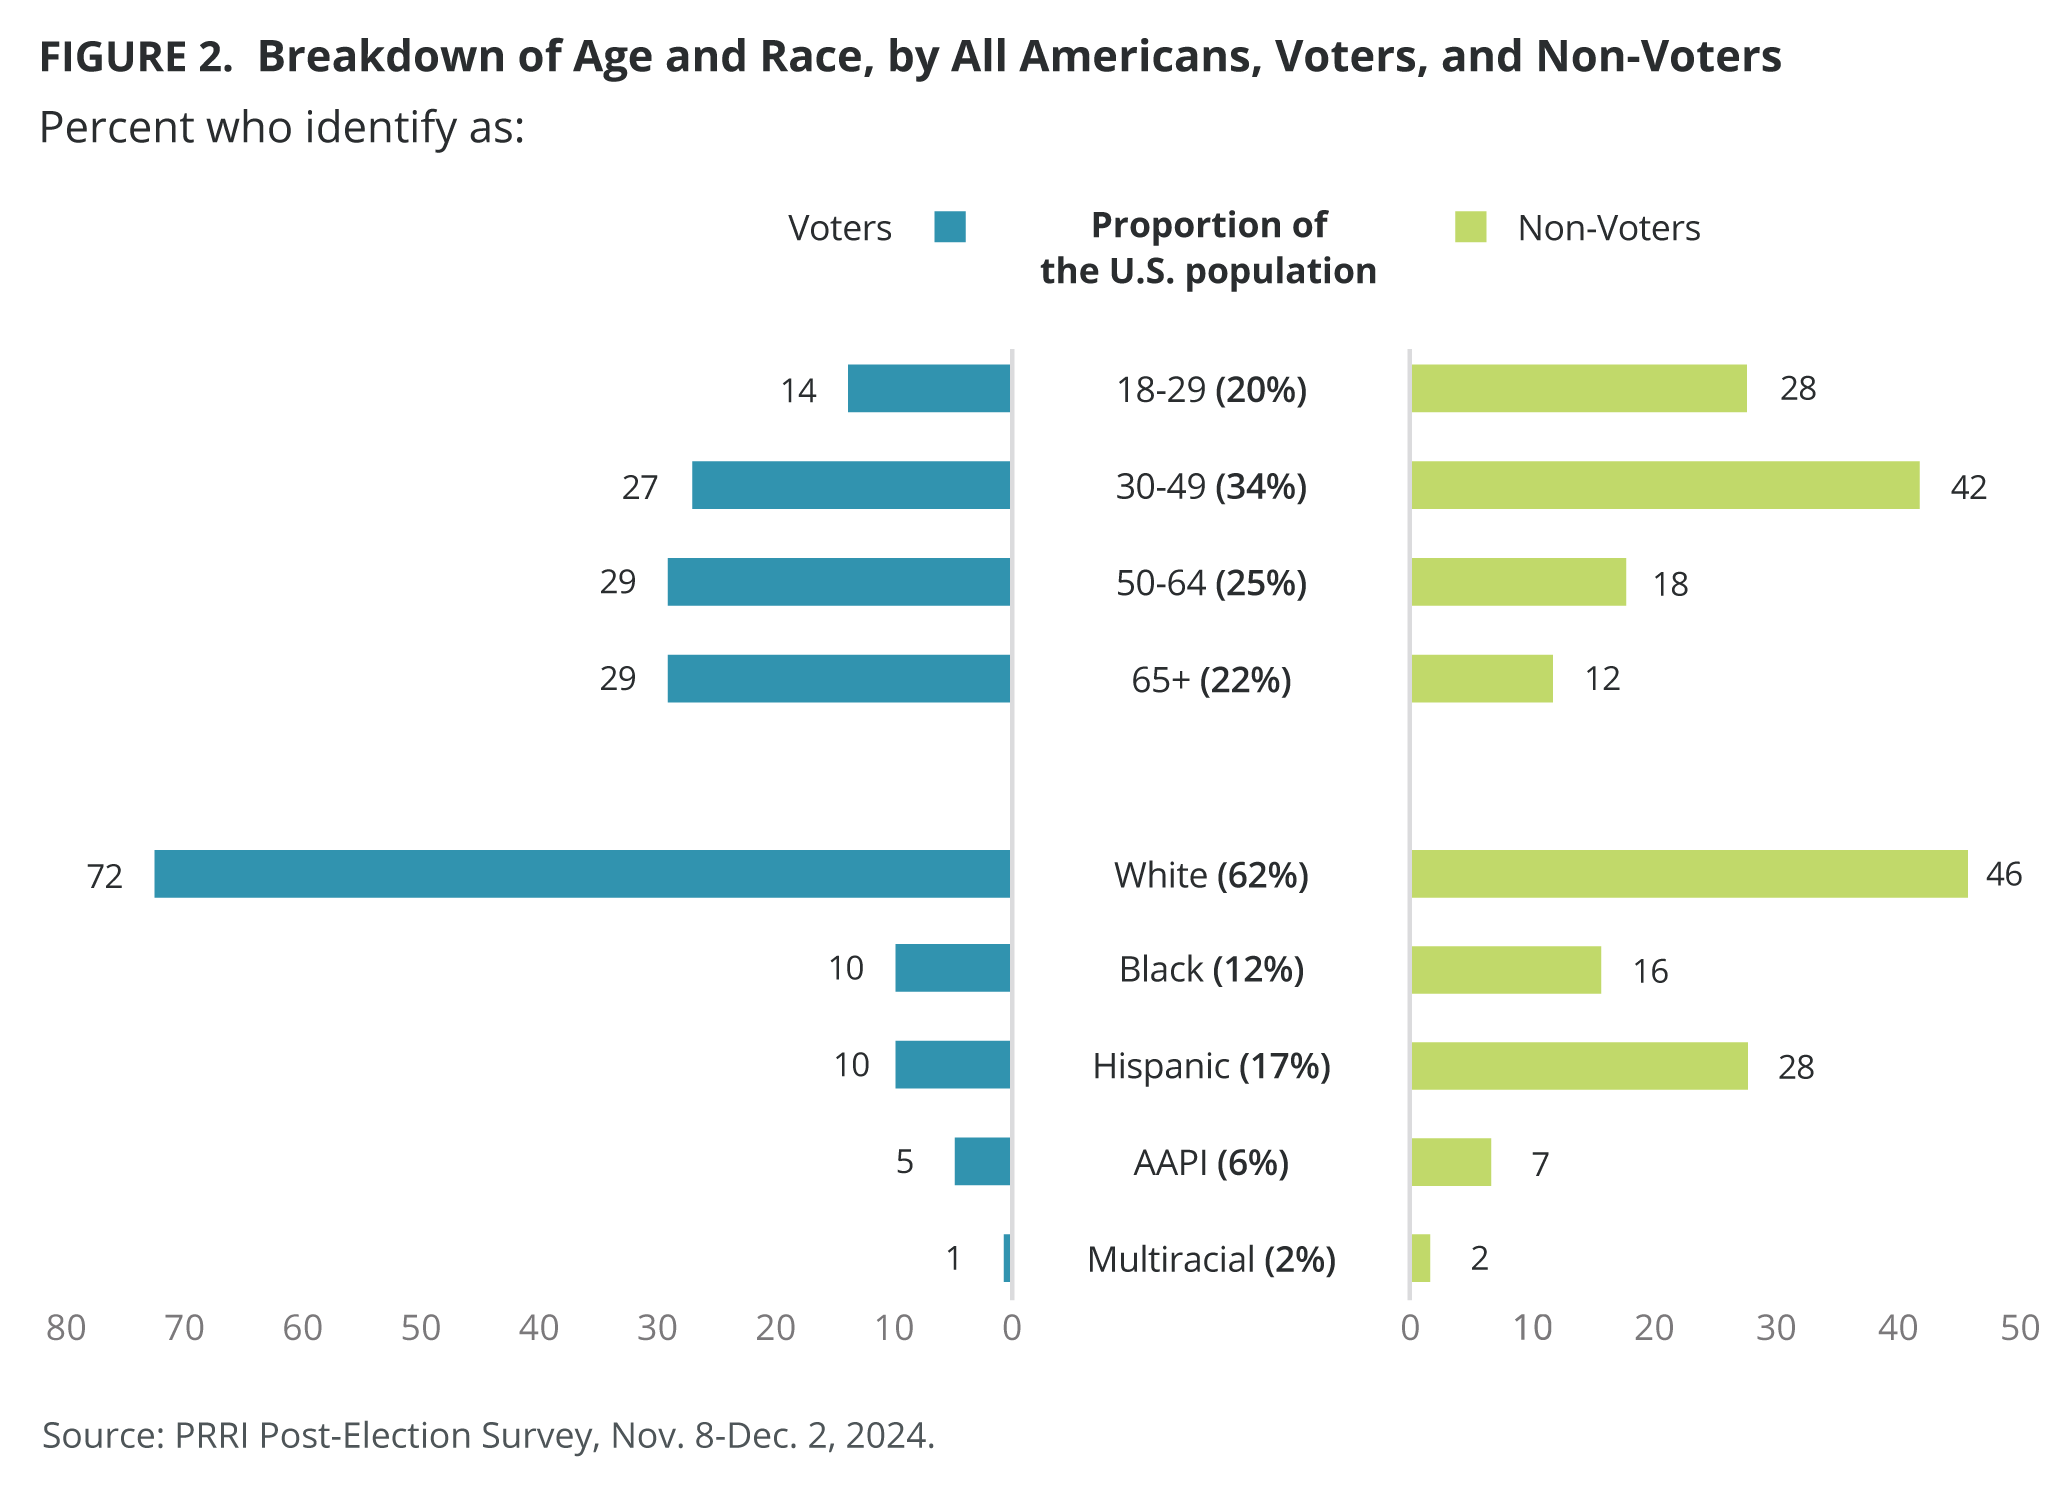
Age is also an important distinguishing factor between voters and non-voters. Non-voters in the 2024 election include significantly more younger Americans than 2024 voters. Americans ages 18-29 make up 28% of non-voters vs. 14% of voters and Americans 30-49 are 42% of non-voters vs. 27% of non-voters. Non-voters are less likely than voters to be older Americans: ages 50-64 (18% of non-voters vs. 29% of voters) and ages 65 or older (12% vs. 29%).
There is a pronounced racial divide between voters and non-voters; white Americans are the only racial group that is overrepresented among 2024 voters, while Black, Hispanic, AAPI, and multiracial Americans all accounted for lower percentages of 2024 voters than their representation in the U.S. population. More than seven in ten 2024 voters identify as white (72%), followed by 10% of voters who identify as Black, 10% as Hispanic, 5% as AAPI, and 1% as multiracial. On the other hand, less than half of 2024 non-voters identify as white (46%), while 28% are Hispanic, 16% are Black, 7% are AAPI, and 2% are multiracial.
Finally, between voters and non-voters, educational attainment differs significantly too. Non-voters are more than twice as likely as voters to say that their highest level of education is a high school degree or less (56% vs. 25%), while voters are more likely than non-voters to have a college (25% vs. 10%) or a postgraduate (21% vs. 10%) degree. The gap is smaller between voters and non-voters who have some college education (29% vs. 23%).
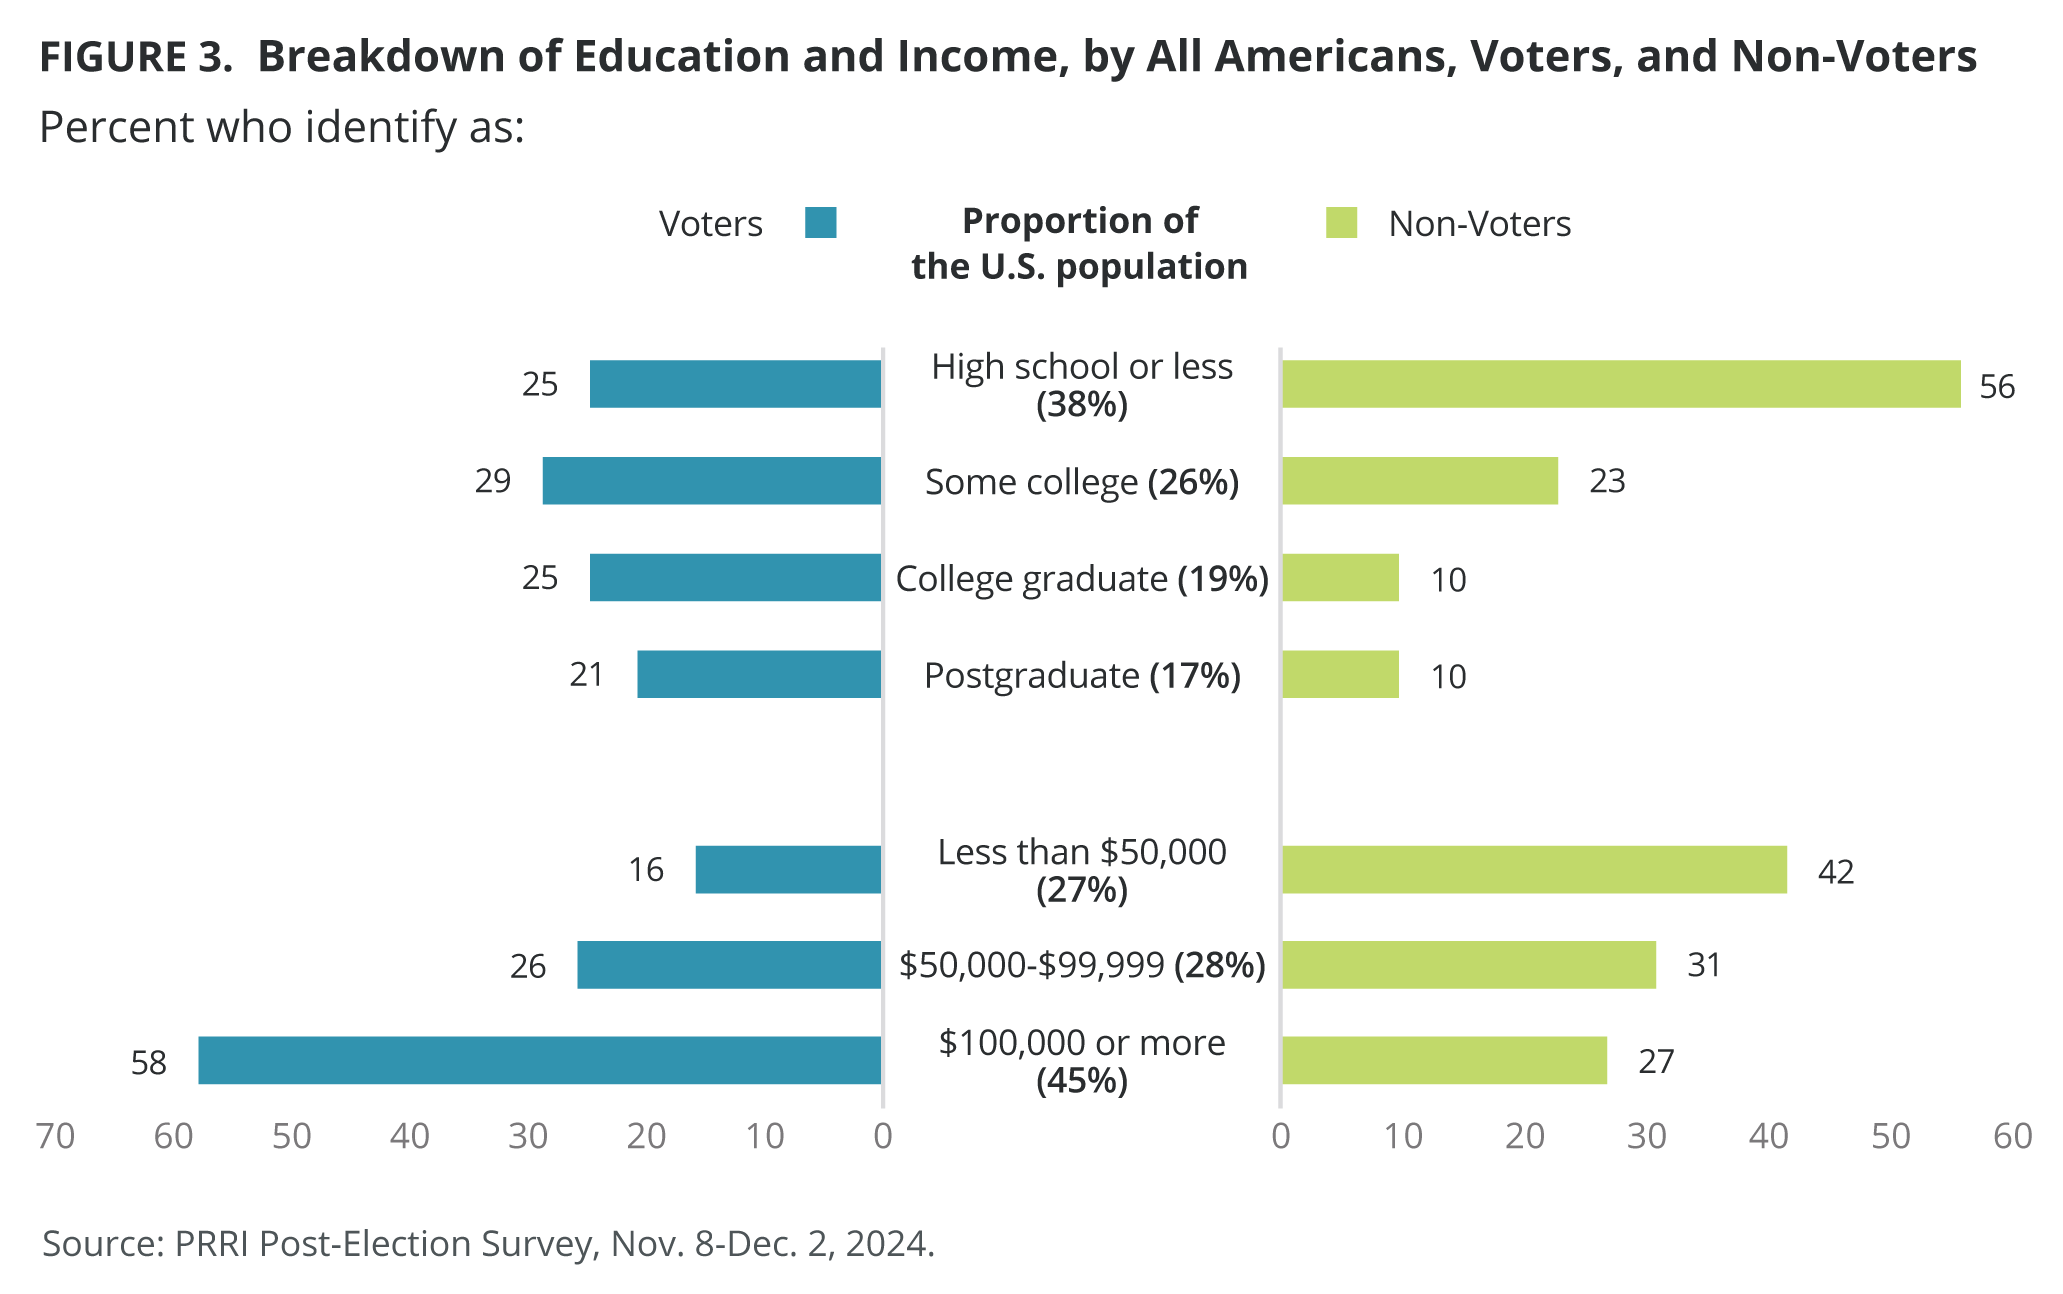
In addition to age, education, and race, voter turnout has been linked to other factors such as income and marital status. Nearly six in ten 2024 voters (58%) report having an income of $100,000 or higher, compared with 27% of non-voters and 45% of all Americans. In contrast, non-voters (42%) are more likely than voters (16%) and all Americans (27%) to make less than $50,000. Non-voters (31%) are slightly more likely than voters (26%) to make between $50,000 and $99,999.
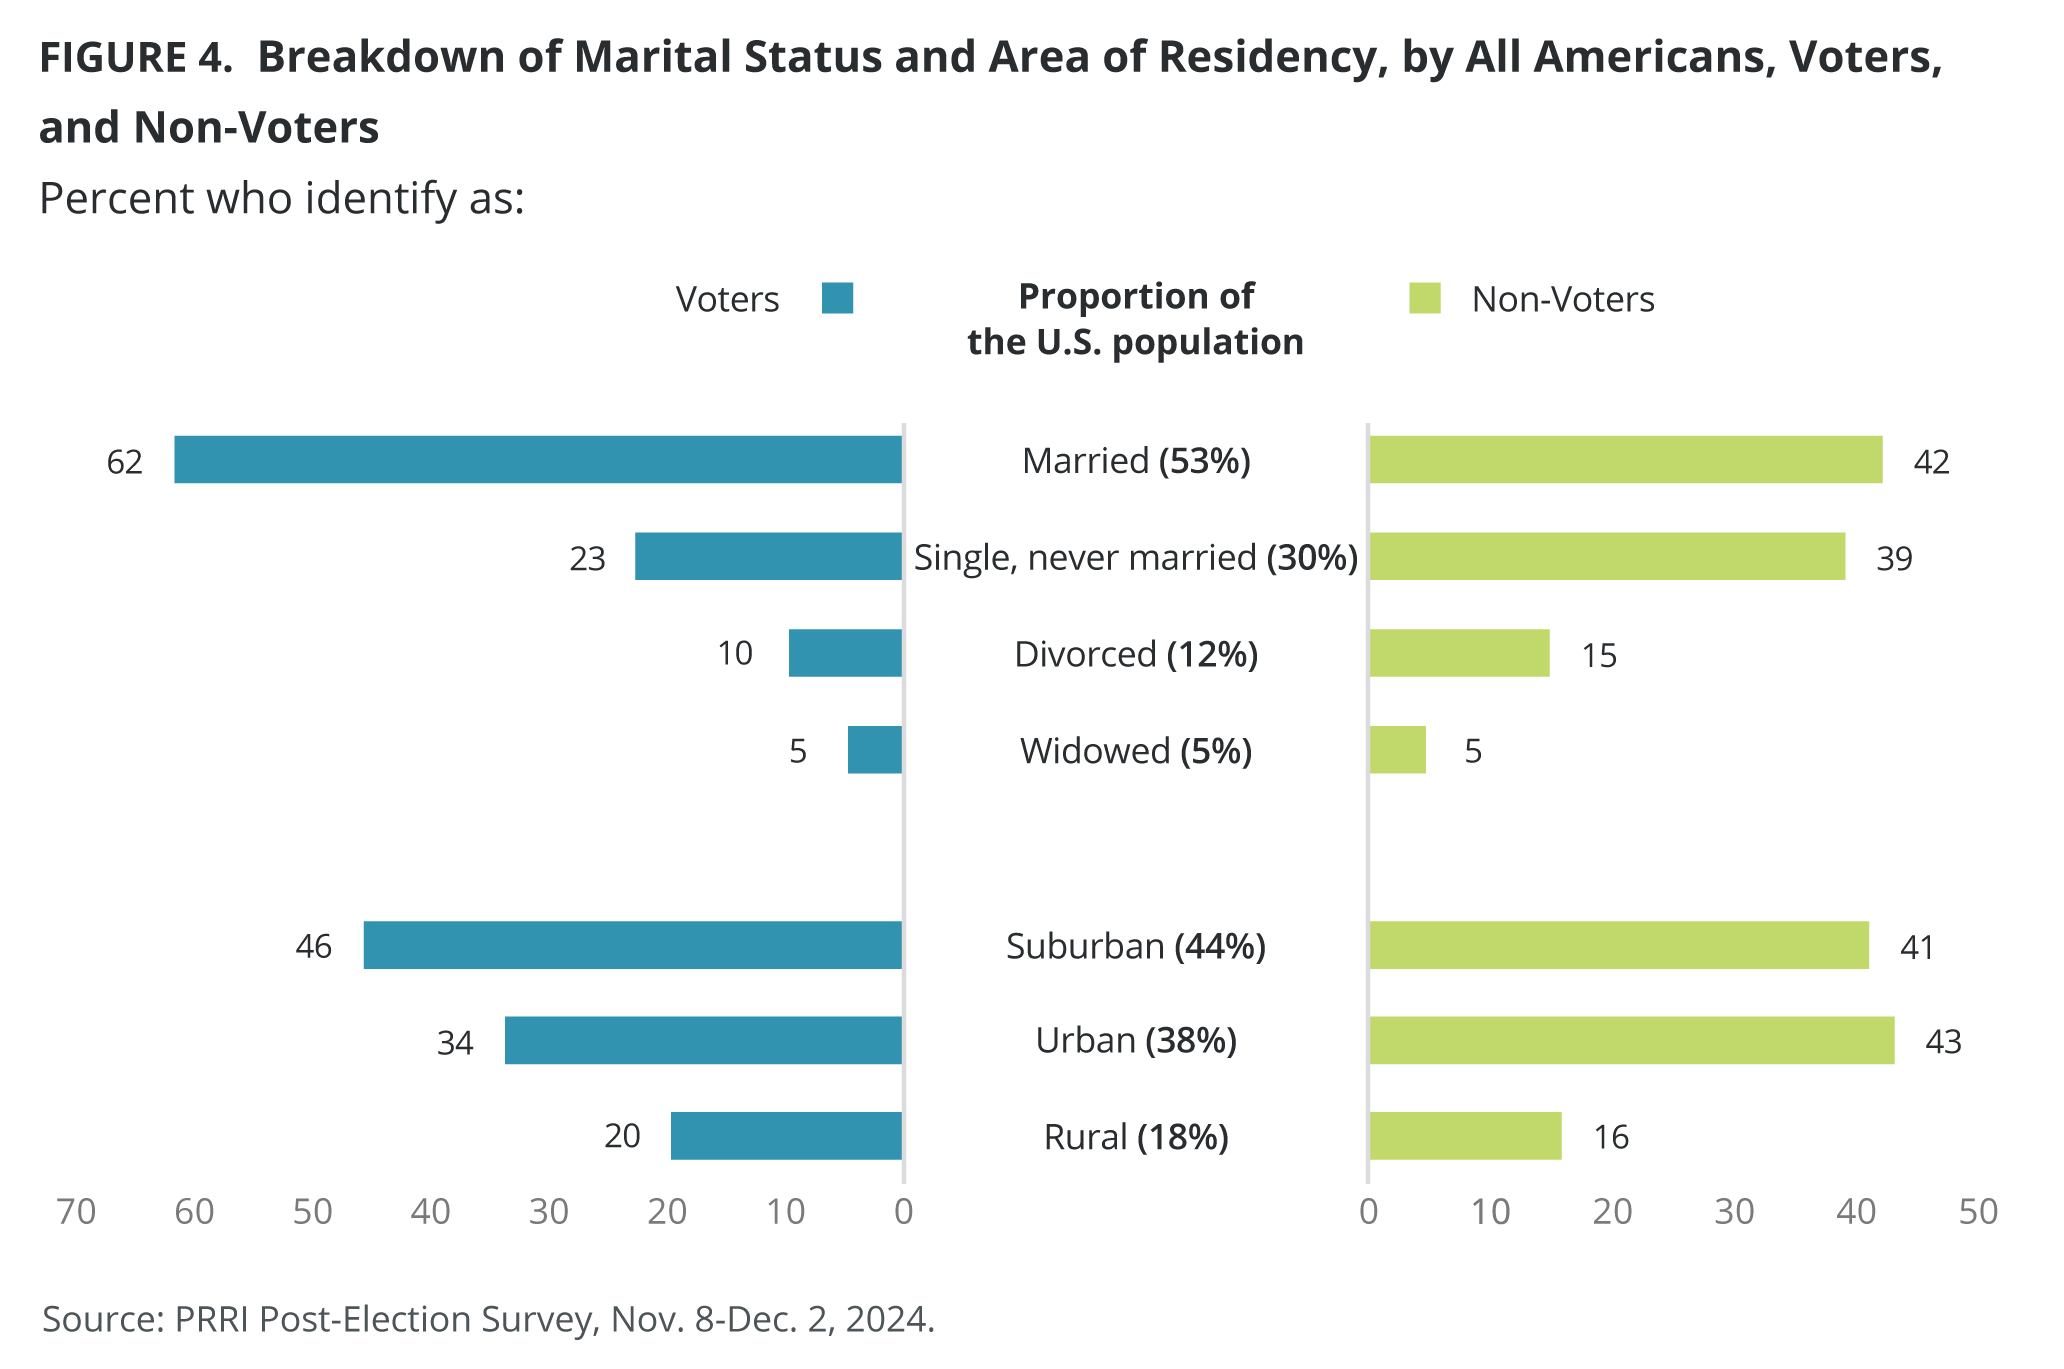
Looking at marital status, married Americans are overrepresented among voters (62% of 2024 voters vs. 53% of the population and 42% of non-voters), while non-voters (39%) are more likely than voters (23%) to report being single.
Voters are also more likely than non-voters to live in suburban (46% vs. 41%) and rural areas (20% vs. 16%). However, non-voters are notably more likely than voters to live in urban areas (43% vs. 34%).