Nondiscrimination Laws to Protect LGBTQ People
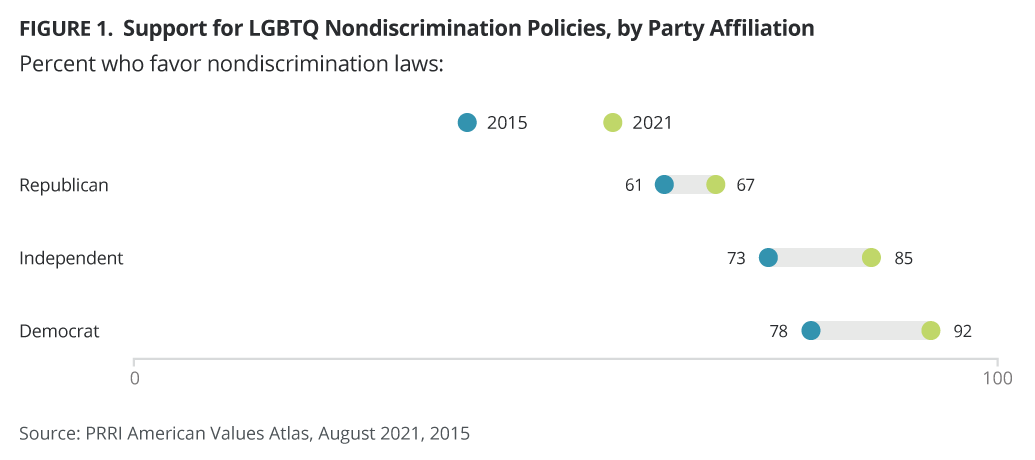
A large majority of Americans (82%) favor laws that protect LGBTQ people from discrimination in jobs, public accommodations, and housing. The proportion of Americans who support nondiscrimination legislation has risen more than 10 percentage points since 2015. Knowing any person who is LGBTQ has a meaningful impact on support for nondiscrimination laws. Among those who do not know an LGBTQ-identifying person, 72% support the laws, compared to 87% of those who do.
Notably, support for laws that protect LGBTQ people from discrimination is strongly bipartisan. Majorities of Republicans (67%), independents (85%), and Democrats (92%) favor nondiscrimination protections for LGBTQ Americans.

Majorities of all major religious groups support LGBTQ nondiscrimination policies. Among major religious groups, religiously unaffiliated Americans are the most likely to support LGBTQ nondiscrimination policies, with 91% in favor. Large majorities of most other religious groups support such policies as well, including Latter-day Saints (88%), other Protestants of color (87%), Black Protestants (86%), other non-Christian religions (85%), other Christians (84%), white Catholics (82%), white mainline Protestants (82%), Hispanic Catholics (81%), Jewish Americans (79%), and Hispanic Protestants (74%). White evangelical Protestants (66%) continue to be the least likely major religious group to support nondiscrimination policies, although support has risen six percentage points since 2015 (60%).
Eight in ten white Americans (81%) support nondiscrimination laws. A similar percentage of Black (83%) and Hispanic Americans (84%) favor nondiscrimination laws. Almost nine in ten Americans of another race (87%) and multiracial Americans (87%) favor the laws.
Women (84%) are somewhat more likely than men (81%) to favor nondiscrimination protections.
Differences exist between Americans with and without college degrees. Nearly nine in ten college graduates (88%) support nondiscrimination laws, whereas eight in ten Americans without college degrees support the laws. Furthermore, college graduates are much more likely to strongly favor nondiscrimination laws (56%) than those who did not graduate from college (38%).
Religiously Based Refusals to Serve LGBTQ People
A majority of Americans (63%) oppose allowing small business owners to refuse service to LGBTQ people if doing so violates their religious beliefs, and only 36% support allowing religiously based service refusals. Americans who know someone who is LGBTQ (34%) are somewhat less likely than those who do not know anyone who is LGBTQ (42%) to favor religiously based service refusals.
Republicans (61%) are more than three times as likely as Democrats (18%) to favor allowing businesses to refuse service to LGBTQ people. More than one-third of independents (36%) agree.
Notably, white evangelical Protestants remain the only major religious group in which a majority favors religiously based service refusals, and their support for these exemptions is increasing. A majority of white evangelical Protestants (62%) say that they support allowing small business owners to refuse to serve LGBTQ people, up from 54% in 2019 and 51% in 2015. Less than half of all other religious groups favor religiously based service refusals. This includes around four in ten or more Latter-day Saints (46%), Jewish Americans (42%), and white mainline Protestants (40%), and less than four in ten other Protestants of color (38%), Hispanic Protestants (37%), white Catholics (37%), and Black Protestants (35%). Fewer than three in ten Hispanic Catholics (29%), other Christians (26%), and other non-Christian religious Americans (26%) agree. Religiously unaffiliated Americans are the least likely to favor allowing service refusals (22%).
White Americans (39%) are more likely to favor allowing service refusals than all other racial or ethnic groups. About three in ten Black Americans (31%) and Hispanic Americans (31%) favor letting business owners refuse service to LGBTQ customers.
Men (40%) are more likely than women (32%) to support religiously based refusals to serve LGBTQ people.
Slightly more Americans with college degrees oppose service refusals (66%) compared to those without college degrees (61%).


