The growth of Latino communities in the United States, both in number and in electoral importance, has led to much public discussion about “the Latino vote.” Political parties have tried to court Latinos, with varying levels of success, and media outlets often speculate about how Latino involvement will affect the outcome of various elections.[1] One of the main takeaways from this flurry of analysis over the past several years is that the Latino community is just as diverse as any other group, which means that politicians and pundits will have to look beyond shared ethnicity if they want to understand how to reach Latino residents and voters.
Age is one demographic characteristic that is sometimes used to gain insights into the differences among potential Latino voters. A report from the Pew Research Center found that older Latinos are more likely than younger Latinos to approve of the job President Biden is doing, but younger Latinos were more likely to say they would vote for Democratic candidates in the 2022 midterm elections. Similarly, recent news stories have noted that younger Latinos are beginning to wield electoral power. And their political activism sometimes takes creative forms, such as when three teenagers in Texas used their quinceañera celebrations to encourage relatives and friends to vote.
PRRI’s 2022 American Values Survey shows some differences in attitude on certain policy and social issues between Latino Americans who are 50 and over and those who are younger. However, the differences between older and younger Latinos on these issues are not as great as between older and younger survey respondents in general. This is mostly because older Latinos generally express more progressive or left-leaning views than older Americans overall and younger Latinos are less progressive on some issues than young Americans overall. This data seems to contradict the stereotype that older Latinos are usually more conservative than other demographic groups on social issues such as same-sex marriage or transgender rights.
For example, 58% of all respondents 50 and over either strongly or somewhat favor laws that require transgender people to use bathrooms that correspond to their sex at birth. And 58% of Latino respondents 50 and over also favor such laws. Meanwhile, 73% of all respondents 50 and over favor laws to protect LGTBQ individuals against job discrimination, but a slightly higher percentage of Latino respondents 50 and over (76%) favor these laws. And while 61% of all respondents 50 and over favor allowing gay and lesbian couples to legally marry, among Latino respondents 50 and over the number is 65%. In all of these cases, the differences are not statistically significant, but over-50 Latino respondents’ attitudes are slightly more favorable toward LGBTQ rights than those of the over-50 population in general.
On the other hand, among people younger than 50, 46% of all respondents favor laws requiring transgender people to use bathrooms that correspond to their sex at birth, compared to 49% of Latino respondents under 50. Nearly eight in ten of all respondents under 50 (77%) favored laws to protect LGBTQ individuals against job discrimination, compared to 71% of Latino respondents under 50. And 71% of all respondents under 50 favored allowing gay and lesbian couples to legally marry, versus 68% of Latino respondents under 50. Younger generations tended toward greater support for LGBTQ rights on the whole, but the gap between older and younger respondents was smaller among Latinos than in the general population owing to slightly higher support among older Latinos and slightly lower support among younger Latinos compared to their counterparts in the general population.
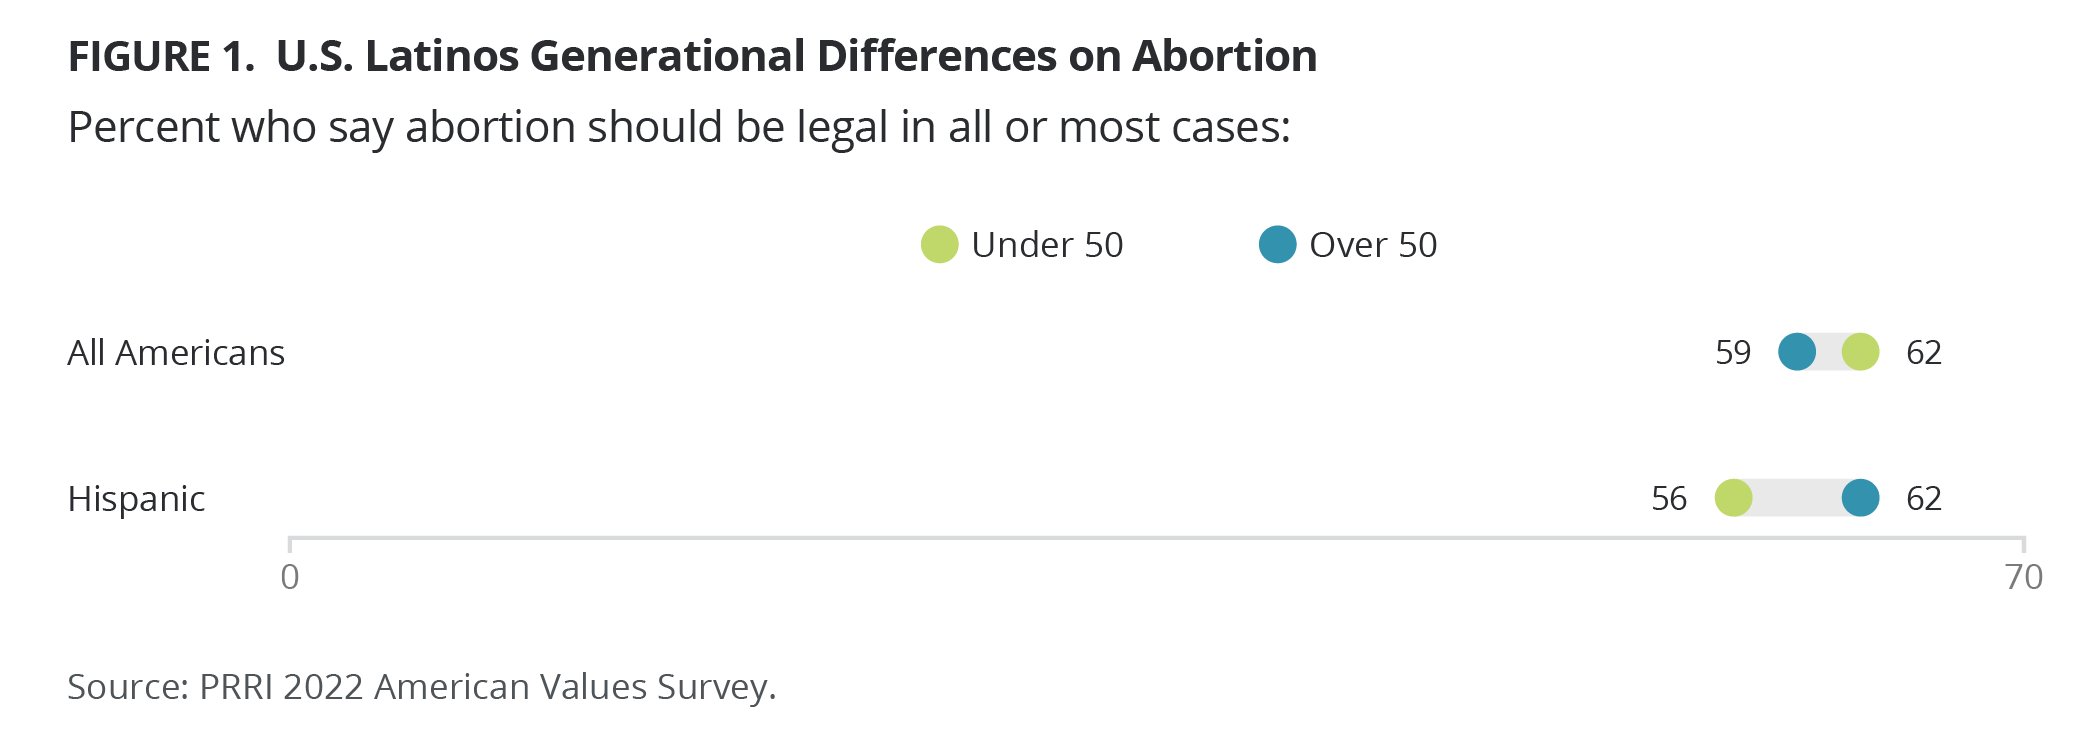
We can see a similar trend on the issue of abortion, and, interestingly, older Latinos are more likely than younger Latinos to say that abortion should be legal in all or most cases. According to the American Values Survey, 59% of all respondents 50 and over think abortion should be legal in all or most cases, while 62% of all respondents under 50 think this. Among Latino respondents, however, 62% of respondents 50 and over think abortion should be legal in all or most cases, and 56% of respondents under 50 think the same.

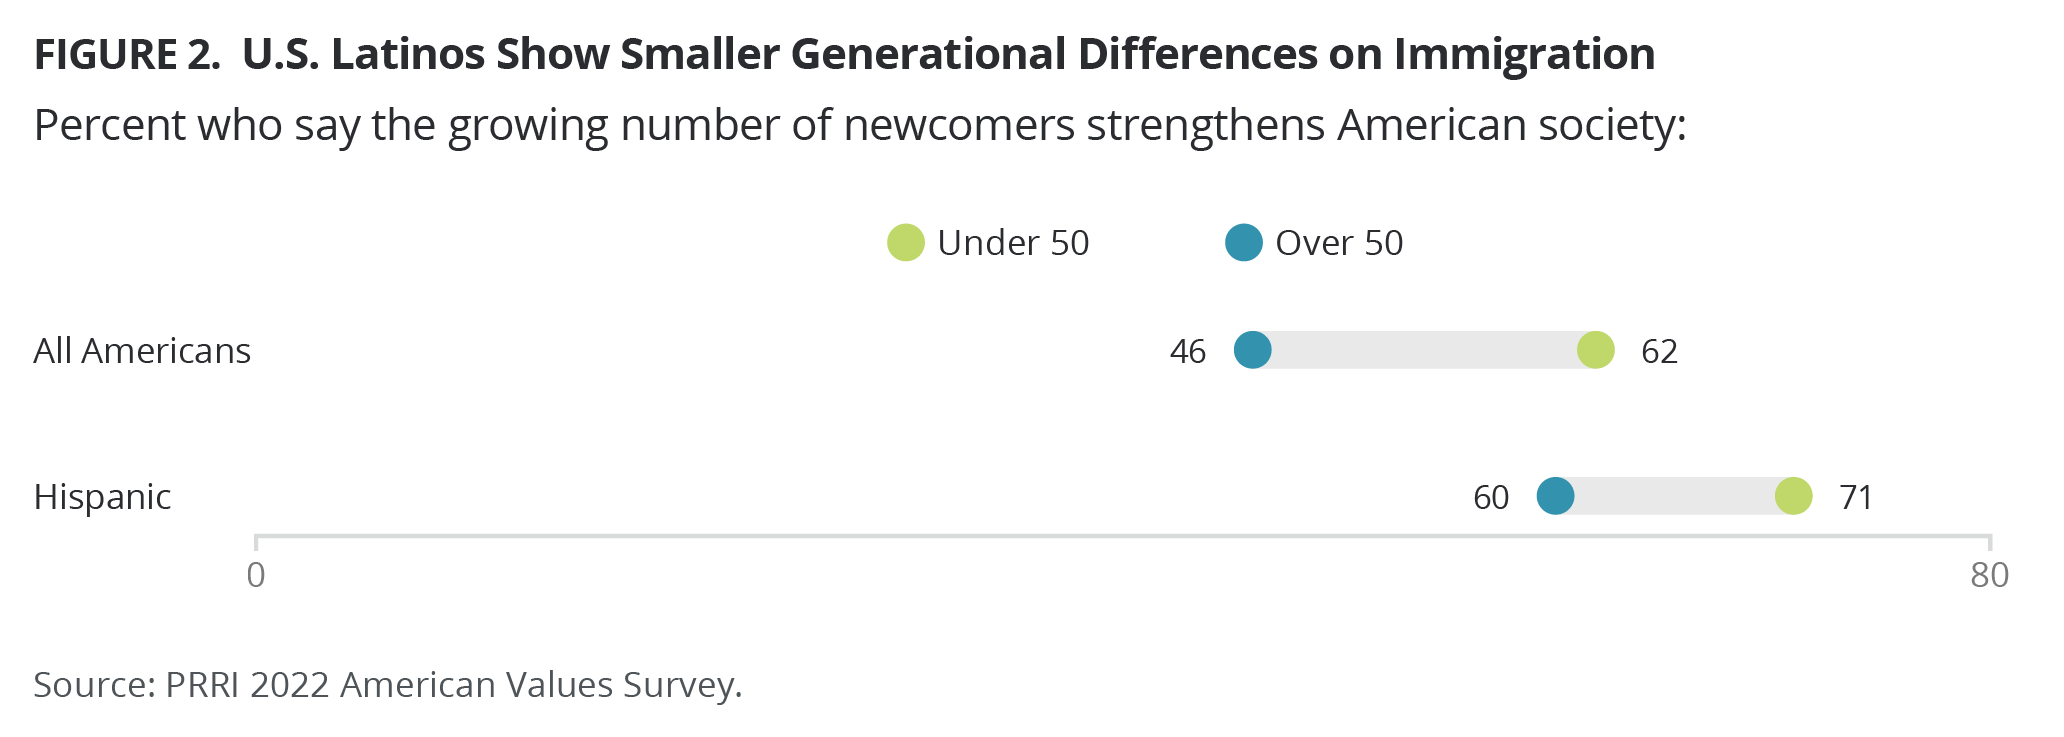
On the topic of immigration, both younger Latinos and younger people in the general population tend to hold more pro-immigrant views than their older counterparts. However, in many cases the difference between older and younger Latinos on this issue is smaller than the difference between older and younger respondents in general. This is because older Latinos hold more pro-immigrant attitudes than older respondents in general. To take just one example, 62% of all respondents under 50 agreed that the growing number of newcomers from other countries strengthens American society, while 32% said it threatens traditional American customs and values. For all respondents 50 and over, 46% said the growing number of newcomers strengthens American society and 50% said it threatens American customs and values. So the difference between the age groups was 16% for the belief that immigrants strengthen society and 18% for the view that immigrants are a threat. Among Latino respondents, 71% under 50 said newcomers strengthen American society and 27% said they threaten American values, while 60% 50 and over said immigrants strengthen American society and 38% that they pose a threat. The difference between generations for Latino respondents was 11% for both answers, smaller than the generational difference among respondents in general.

As PRRI scholars have noted, and as more media outlets are beginning to recognize, Latino Americans are not monolithic in their political and social attitudes or in their voting practices. Based on the latest American Values Survey, one way in which the group is distinct is that older and younger Latino Americans are actually not all that far apart on several political and social issues. That said, a better understanding of generational differences among both Latino Americans and the population as a whole can help bring nuance to the analysis of social opinion and potential voting patterns.
[1] The terms “Hispanic” and “Latino” are not identical, but both are used in polling. I will use the term “Latino” throughout, recognizing that many polling organizations use the term “Hispanic,” which is also the category used on the U.S. Census.


