California’s role is especially pronounced this year, as mail-in ballots will be counted starting on February 3, 2020, the same day as the Iowa caucuses. Notably, California has about ten times as many delegates as Iowa (495 compared to 49), and accounts for about 11% of Democratic party delegates deciding the presidential nominee. AAPIs, who represent about 1 out of every 6 registered voters in California, could prove critical in shaping the overall winner and keeping certain candidates viable.[1]
New data from a survey of AAPIs in the state point to a tight contest for support among Joe Biden, Bernie Sanders, and Kamala Harris, with Elizabeth Warren lagging somewhat behind and Andrew Yang struggling with lack of name recognition.
AAPI Data teamed up with PRRI to conduct a recent survey of nearly 2,700 AAPIs in California from July 5 to September 5, 2019. The survey was conducted by telephone and online with 9 different AAPI national origin groups in five different Asian languages and English. The survey’s findings, which focuses on the lived experiences and opinions of AAPI working adults in California, will be released in mid-November. Here, we report results among the 2,468 eligible voters who took the survey.
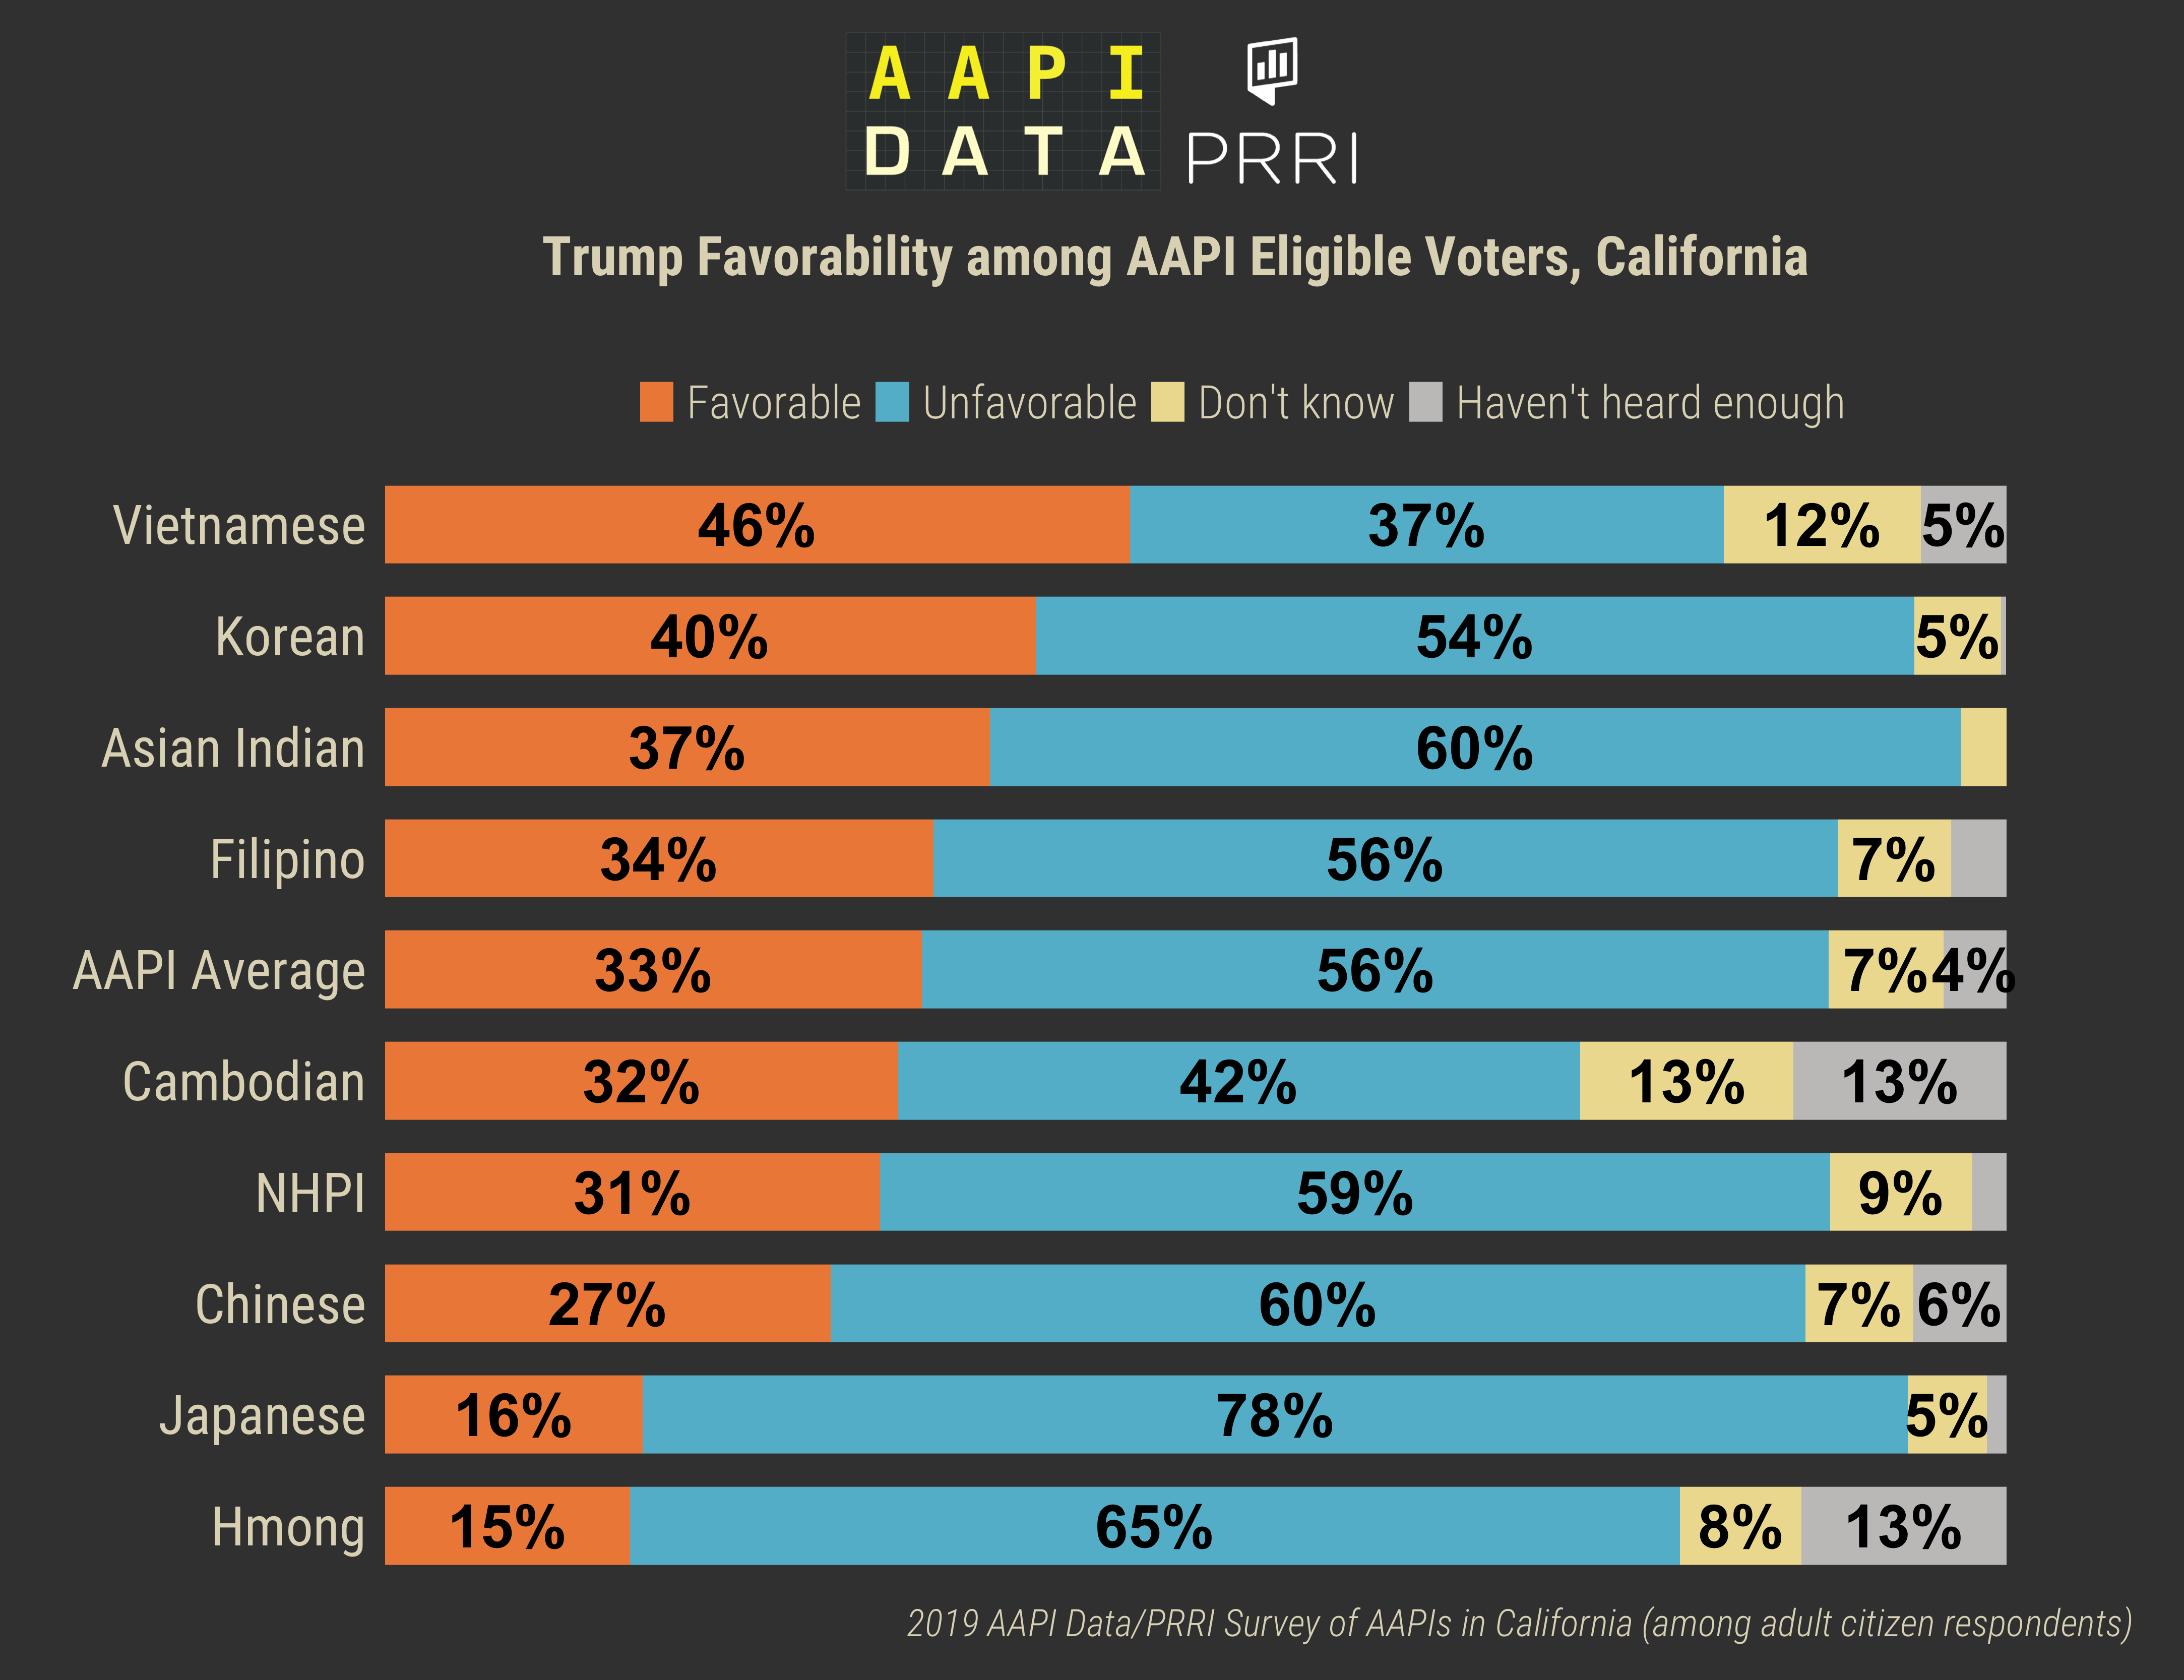
It is clear that many AAPI voters will be looking for an alternative to President Trump. About 56% of AAPI adult citizens had unfavorable opinions toward the President, compared to 33% who held a favorable view. Only one California AAPI group, Vietnamese Americans, who have long been the most Republican-leaning among AAPIs, were more likely to approve (46%) than disapprove (37%) of the President. Notably, 60 percent or more of Indian, Chinese, Hmong , and Japanese Americans disapproved of the President.

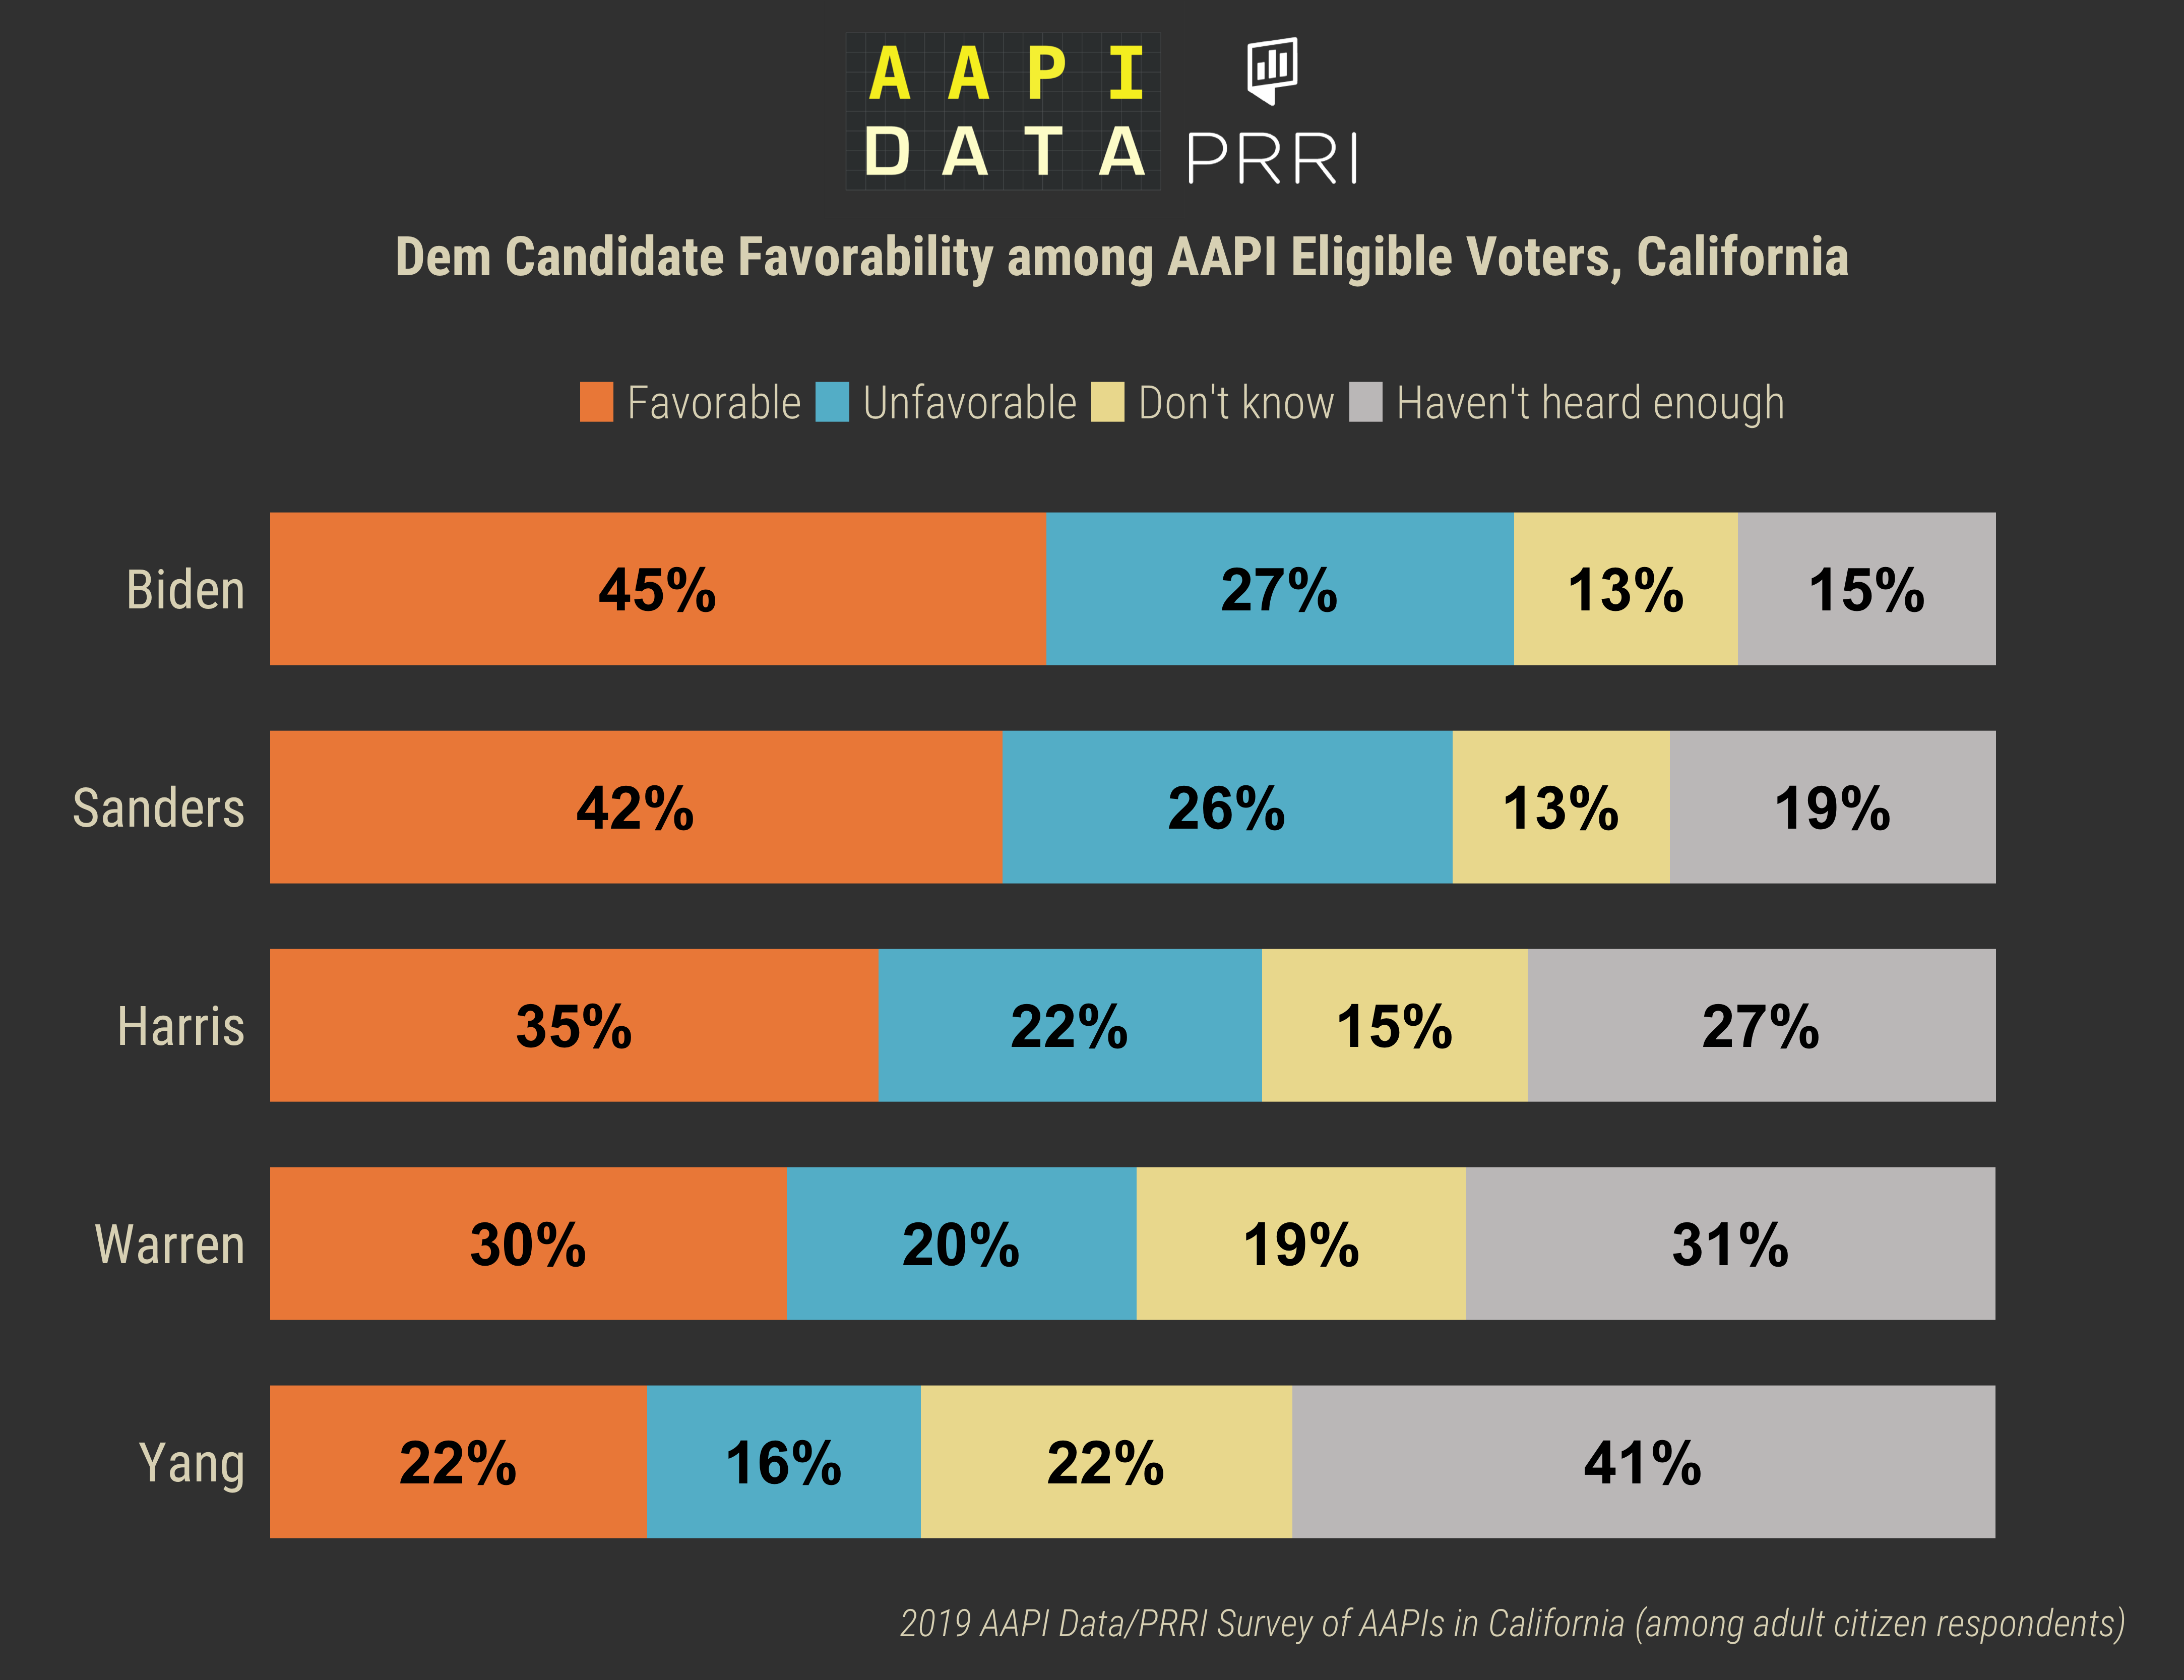
We also asked respondents to rate their favorability of Joe Biden, Elizabeth Warren, Bernie Sanders, Kamala Harris and Andrew Yang.[2] The data reveal a stark contrast with Trump’s favorability ratings. Biden has the highest net favorability rating among AAPIs (45% to 27%), followed by Sanders (42% to 26%), Harris (35% to 22%), Warren (30% to 20%), and Yang (22% to 16%). Apart from Biden and Sanders, most AAPIs were not familiar enough with the Democratic presidential candidates to be able to form a solid opinion of them.

With rare exceptions, all AAPI groups expressed net favorability toward the Democratic candidates in our survey, meaning that more had favorable views than unfavorable views (see table below). At the same time, there were some important differences. Asian Indians gave the highest net favorability for Harris (a fellow Indian American) and Biden, with lower favorability ratings for Sanders, Warren, and Yang. Harris did not enjoy similarly high favorability ratings among other Asian American or Pacific Islander groups.
Table 1: NET Favorability for 2020 Candidates, AAPI eligible voters in California
| Candidate | AAPI Average | Asian Indian | Cambodian | Chinese | Filipino | Hmong | Japanese | Korean | Vietnamese | NHPI |
| Biden | 18 | 51 | 31 | 18 | 15 | 9 | 16 | 17 | 1 | 12 |
| Sanders | 16 | 32 | 27 | 12 | 20 | 32 | 20 | 22 | -4 | 29 |
| Harris | 13 | 54 | 17 | 11 | 8 | -4 | 22 | 2 | 1 | 13 |
| Warren | 10 | 23 | 12 | 8 | 7 | 12 | 20 | 11 | 0 | 14 |
| Yang | 6 | 8 | 11 | 11 | 3 | 32 | 9 | 5 | -4 | 6 |
| Trump | -23 | -23 | -10 | -33 | -22 | -50 | -62 | -14 | 9 | -28 |
By contrast, Yang does not draw a disproportionately high level of support among Chinese Americans. His net favorability was similar across various AAPI groups, with the exception of Hmong Americans where he polled significantly higher, and among Vietnamese Americans where he polled lower. Notably, Chinese Americans were more likely to rank Biden favorably when compared to Yang.
Filipino Americans seemed to favor Sanders, as did Pacific Islanders and Hmong Americans. In their assessments of potential Democratic candidates, Cambodian Americans were most favorable toward Biden, followed closely by Sanders.
Table 2: NET Favorability among AAPI Eligible Voters in California
| Candidate | AAPI Average | Native Born | Foreign Born | Men | Women | ||
| Biden | 18 | 18 | 18 | 19 | 17 | ||
| Sanders | 16 | 30 | 10 | 10 | 22 | ||
| Harris | 13 | 24 | 8 | 13 | 13 | ||
| Warren | 10 | 18 | 6 | 8 | 11 | ||
| Yang | 6 | 13 | 3 | 4 | 8 | ||
| Trump | -23 | -53 | -10 | -18 | -27 | ||
We also examined differences in candidate favorability by nativity. Sanders received the highest favorability rating among those AAPIs born in the United States while Biden was most favored among those born outside the U.S. Finally, we also found important differences by gender: Biden had the highest net favorability among male eligible voters, while Sanders held the edge among female voters.
Overall, it is clear from these results that all of the Democratic candidates enjoy a high level of enthusiasm among AAPIs in California, especially when compared to the low levels of favorability AAPIs express toward President Trump.
At the same time, at least a third of AAPIs claimed they had no opinion or had not heard enough about each Democratic candidate to respond to the favorability question. Over 60% of AAPI eligible voters had no opinion towards or had not heard enough about Yang, and about 50% reported the same about Warren. Even for Biden, 28% of AAPI eligible voters had no opinion. This suggests that more outreach by these campaigns could make a significant difference in winning AAPI voters and, by extension, crucial delegates in early 2020.
[1](Note that AAPIs voters in California would represent more than 1.5% of all Democratic Party delegates nationwide).
[2]Given the limited space on the survey, we asked favorability of the top 4 presidential candidates in California polling as of July 2019. We added Andrew Yang in the event that English-language surveys of California voters were underestimating his level of support among Asian Americans.


