Welcoming Immigration Policies Remain Popular, But Immigration Is Not a Critical Issue for Most Americans
Immigration Policy Under the Biden Administration
When President Joe Biden took office, his administration set forth an immigration agenda committing to reverse many of the restrictive policies implemented during the Trump era. So far, the new administration has brought both changes and a continuation of previous immigration policies. Because broader legislative reform efforts have stalled in Congress, the Biden administration’s efforts have been limited to executive actions.
The Biden administration has proposed legislation that would allow more immigrants into the United States legally as well as offer an eight-year path to citizenship for an estimated 11 million undocumented immigrants who live in the country, although the legislation has remained stalled in committees since its introduction in the House and the Senate.[1] The legislation would include citizenship for those currently protected under Deferred Action for Childhood Arrivals (DACA), a policy that applies to immigrants who were brought into the United States as children, from deportation, and Temporary Protected Status (TPS), a program that offers temporary legal status to immigrants who cannot return to their countries of origin due to ongoing armed conflict, environmental disasters, or other extraordinary or temporary conditions (e.g., immigrants from El Salvador, Haiti, Honduras, Myanmar, Nepal, Nicaragua, Somalia, Sudan, Syria, Venezuela, and Yemen).[2]
In addition, while under the Trump administration the annual ceiling for U.S. refugee admissions decreased from 85,000 to 18,000, the Biden administration—after some controversy—raised the 2022 refugee cap to 125,000. Still, the United States admitted fewer than 12,000 people in the fiscal year 2021, the lowest admission rate of refugees since the program was created in 1980.[3] Biden has acknowledged the delay to achieve higher admissions and pledged his commitment to “reassert American leadership and American values when it comes to refugee admissions.”[4]
Despite efforts to make changes to previous immigration policies, the Biden administration continues Donald Trump’s pandemic-related implementation of Title 42—a clause of the 1944 Public Health Service Act allowing the government to refuse admission of individuals during certain public health emergencies—which quickly expels migrants at the border without an opportunity to apply for asylum.[5] In addition, a federal court ordered the reimplementation of the Migration Protection Protocols (MPP) in December 2021—a program that returns migrants to Mexico while their U.S. removal proceedings are pending—even though Biden terminated this program the same day he took office.[6]
Support for Policies Related to Undocumented Immigrants Living in the U.S.
Pathway to Citizenship
One of the most vexing policy questions is how to deal with the estimated 11 million undocumented immigrants who are currently living in the U.S. Despite the lack of movement on providing a pathway to citizenship in federal legislation, public support has remained largely supportive of such a policy over the last decade.
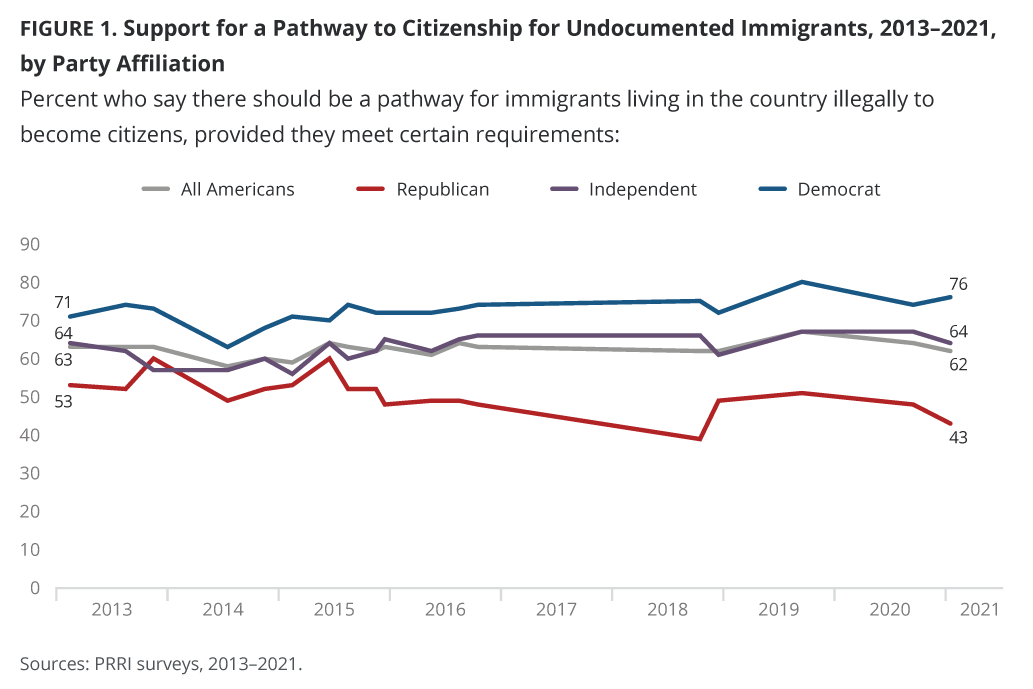
As of late 2021, about six in ten Americans (62%) say that immigrants living in the U.S. illegally should be allowed a way to become citizens provided they meet certain requirements. This support has remained stable since PRRI first asked the question, in 2013 (63%), with only small declines in 2014 and 2015 and a brief uptick in 2019 (67%). An additional 14% of Americans say they would prefer undocumented immigrants to be eligible for permanent residency status but not citizenship. By contrast, only about one in five Americans (22%) say immigrants living in the U.S. illegally should be identified and deported.
By Party Affiliation
Democrats have generally become more supportive of allowing undocumented immigrants to become citizens over time, increasing from 71% in 2013 to 76% in 2021, with similar low points in 2014 and 2015 and an apex of 80% in 2019. By contrast, Republicans have become less supportive of this policy, dropping from 53% in 2013 to 43% in 2021. As of late 2021, 13% of Republicans say they would prefer undocumented immigrants to be eligible for permanent residency status but not citizenship. However, 44% of Republicans say immigrants living in the U.S. illegally should be deported, a 12-percentage-point increase since the question was first asked (32%). Majorities of Republicans who most trust Fox News (55%) and far-right media outlets (64%) as their main sources of information say that all immigrants living in the U.S. illegally should be deported. Independents have tracked within a few percentage points of all Americans across the timeline.
By Religious Affiliation
With the exception of white evangelical Protestants, majorities of all religious groups support a pathway to citizenship for undocumented immigrants, including three in four Black Protestants (75%), 70% of Hispanic Catholics, 69% of religiously unaffiliated Americans, 65% of other Christians, 59% of white mainline (non-evangelical) Protestants, 55% of members of non-Christian religions, and 54% of white Catholics.
White evangelical Protestants have become less likely to support allowing undocumented immigrants to become citizens today (47%) than they were in 2013 (56%) and, by contrast, have become substantially more likely to say all immigrants living in the U.S. illegally should be deported (42%), compared to 30% in 2013. White Catholics became less supportive of a path to citizenship in 2021 (54%) than they were in 2013 (62%) as well. Surprisingly, members of non-Christian religions also became less supportive of this policy in 2021 (55%) compared to 2013 (68%), and have grown more supportive of the idea that all immigrants living in the U.S. illegally should be deported (11% in 2013; 21% in 2021). Religiously unaffiliated Americans have grown slightly more supportive of a path to citizenship today (69%) than they were in 2013 (64%).
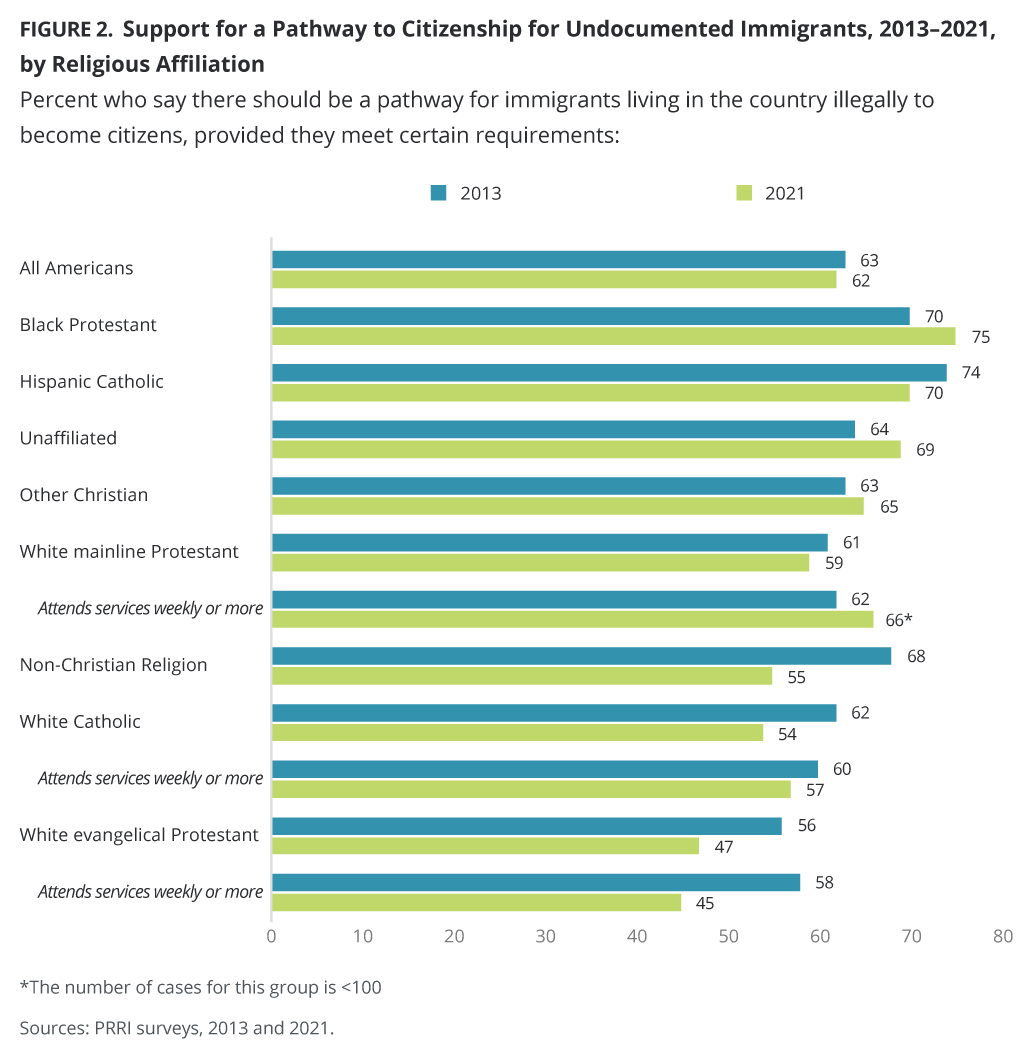
Among white Christian groups, white evangelical Protestants who attend religious services at least once a week have become less likely to support a pathway to citizenship for undocumented immigrants in 2021 (45%) compared to 2013 (58%), while white mainline Protestants (62% in 2013; 66% in 2021) and white Catholics (60% in 2013; 57% in 2021) who attend religious services regularly have not shifted much in their support.
By Race/Ethnicity, Education, Age, and Gender
White Americans (59%) are less likely than Hispanic Americans (69%) and Black Americans (72%) to support a path to citizenship for immigrants. Each of these racial and ethnic groups have remained stable in their support for this policy since 2013. Six in ten white Americans (61%) supported the pathway to citizenship in 2013, although they were slightly more supportive in 2019 (64%) and 2020 (65%). Seven in ten Hispanic Americans (71%) supported the policy in 2013, and more than two-thirds of Black Americans (68%) agreed in 2013.
However, there are notable differences by education among white Americans. White Americans with four-year college degrees or more (68%) have held steady in their support for a path to citizenship since 2013 (68%), but whites without college degrees have become slightly less supportive of this policy (58% in 2013; 54% in 2021).
Overall, Americans with some college (62% in 2013; 61% in 2021), four-year college degrees (66% in 2013; 67% in 2021), and postgraduate degrees (68% in 2013 and 2021) have remained stable in their support for allowing undocumented immigrants to become citizens since 2013. By contrast, Americans with a high school education or less have become slightly less supportive today (57%) than they were in 2013 (62%). Interestingly, postgraduates were notably more supportive in 2020 (73%).
Majorities of Americans across all age groups support allowing undocumented immigrants to become citizens, and this support has also been quite steady since 2013, with the exception of a slight decrease in support among Americans ages 50–64 (down to 56% in 2021 from 62% in 2013). Americans ages 50–64 have become more likely to say all immigrants living in the U.S. illegally should be deported (23% in 2013; 29% in 2021). Americans ages 18–29 are the most likely to support a pathway to citizenship (68%; nearly unchanged from 67% in 2013), compared to Americans ages 30–49 (62%; nearly unchanged from 61% in 2013) and Americans ages 65 and over (61%; a slight but not statistically significant decline from 65% in 2013).
In 2021, there were no differences in support for a pathway to citizenship for undocumented immigrants between women and men (63% vs. 61%). However, over the past decade, women have been slightly more likely than men to support this policy (65% vs. 61% in 2013; 66% vs. 57% in 2018; 70% vs. 63% in 2019; 66% vs. 62% in 2020).
Support for a pathway to citizenship by region has remained stable since 2013 and does not vary much by region or border state status. About six in ten Americans who live in the Northeast (61% in 2013; 59% in 2021), the Midwest (63% in 2013; 59% in 2021), the South (62% in both 2013 and 2021), and the West (66% in 2013; 65% in 2021) support a pathway to citizenship for undocumented immigrants. Americans who live in border states, including Arizona, California, New Mexico, and Texas, similarly have not shifted their opinion on this policy compared to 2013 (62% in 2013; 63% in 2021).
What Explains Support for a Pathway to Citizenship?
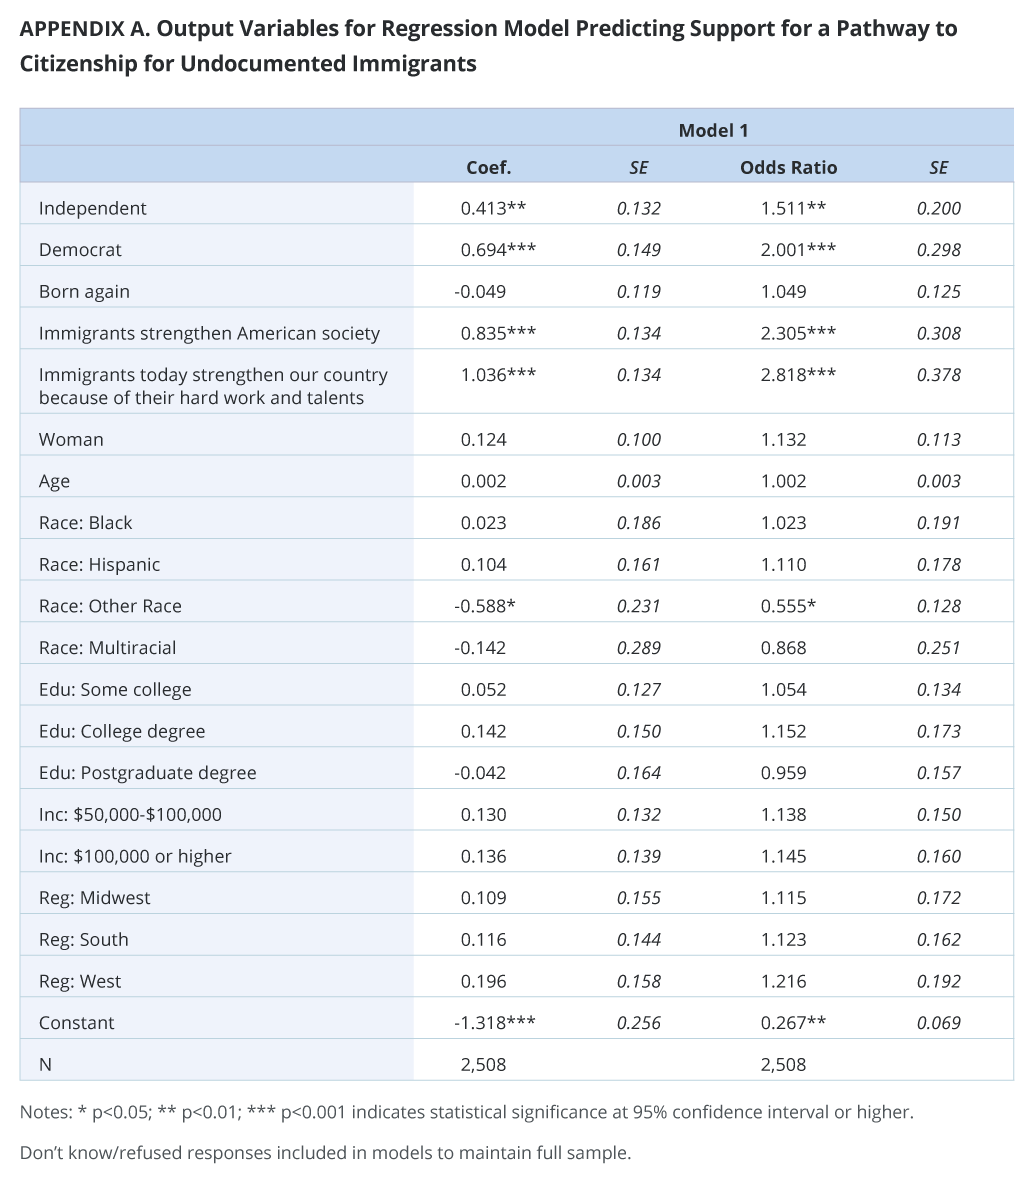
PRRI constructed a logistic regression model to explain what characteristics are associated with support for a pathway to citizenship. The dependent variable is a recoded variable where support to allow undocumented immigrants a way to become citizens provided they meet certain requirements is coded as 1 and all other options are coded as 0.
The independent variables can be thought of in three categories: (1) political and religious belief variables, (2) attitudes toward immigrants, and (3) socioeconomic and demographic variables.
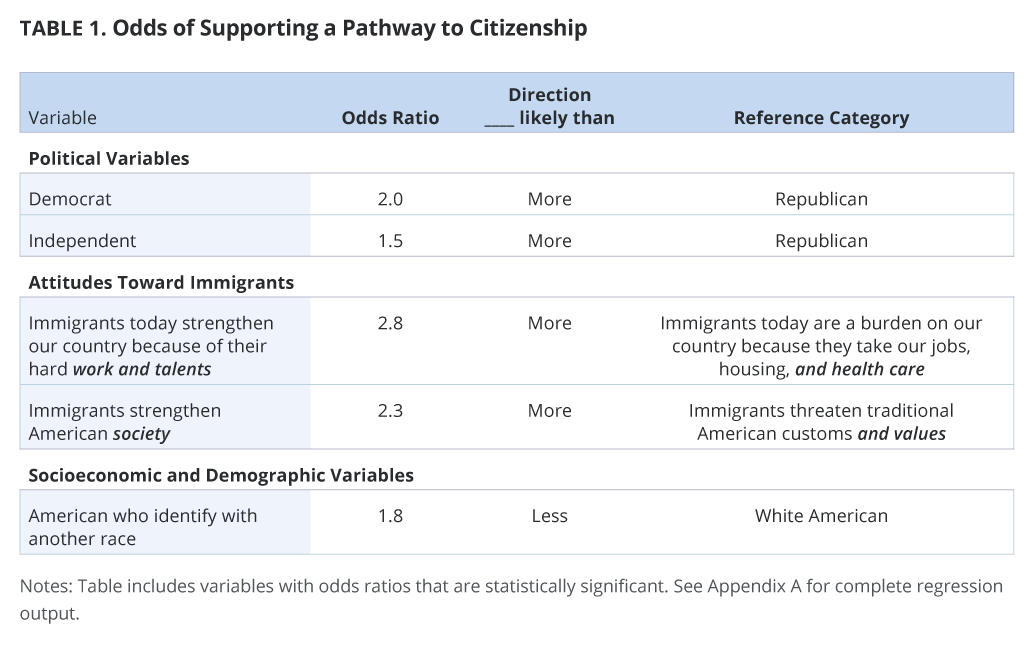
Democrats and independents are about twice as likely as Republicans to support a policy that will allow a way for undocumented immigrants to become citizens provided they meet certain requirements. The only demographic variable that reached statistical significance is race: Americans who identify with another race are about half as likely as white Americans to support a pathway to citizenship.
The most influential variables are those dealing with how Americans view immigrants. Americans who think that immigrants strengthen this country because of their hard work and talents are nearly three times more likely to support this policy than those who think that immigrants today are a burden to this country. Similarly, Americans who think that immigrants strengthen American society are twice as likely as Americans who think that immigrants threaten traditional American customs and values to support this policy.
Legal Status for Dreamers
Nearly two-thirds of Americans (64%) favor allowing immigrants brought illegally to the U.S. as children, better known as Dreamers, to gain legal resident status, while one-third (34%) are opposed. Support for this policy has remained constant since late 2018.
Only 44% of Republicans favor allowing immigrants brought illegally to the U.S. as children to gain legal resident status, compared to 56% who oppose it. Unsurprisingly, large majorities of Republicans who most trust far-right media outlets (75%) and Fox News (68%) among television news sources oppose this policy. Only 25% and 31%, respectively, of both groups support it. In 2019, Democrats experienced a brief decline in support to 74%, but bounced back to 80% in 2020 and 79% in 2021. Independents have consistently grown more supportive of this policy, from 61% in 2018 to 67% in 2019 and 72% in 2020, and stayed at 70% in 2021. Attitudes among partisans have remained relatively stable since 2018.
Majorities of nearly all demographic groups favor allowing immigrants brought illegally to the U.S. as children to gain legal resident status, including gender, race, education, age, region, and geographic location. Only white evangelical Protestants (47%) and Republicans (44%) do not reach majority support for this policy, similar to their support levels for a pathway to citizenship.
Immigration as a Critical Issue
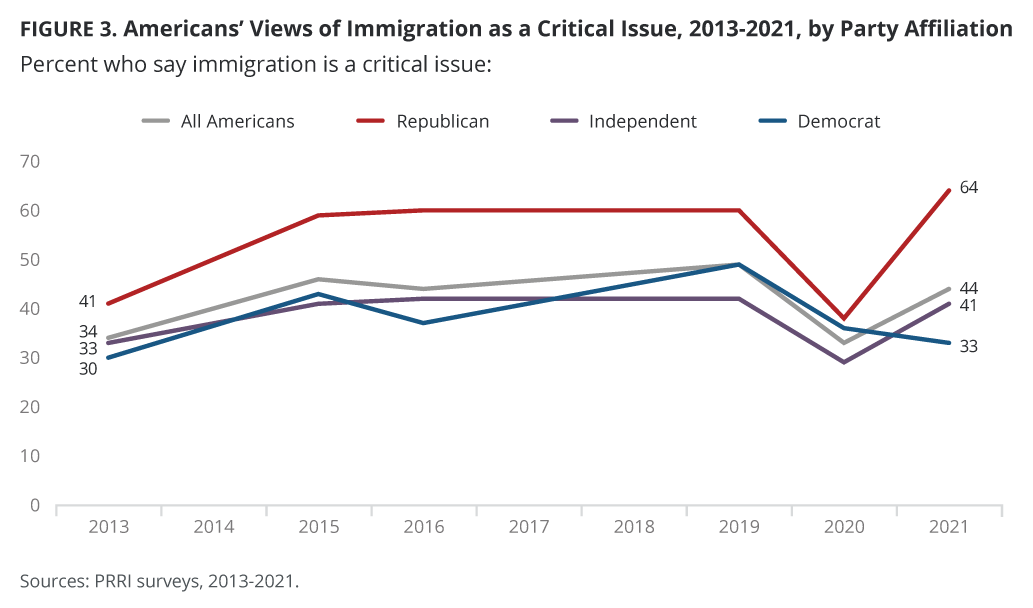
Despite the popularity of more welcoming immigration policies, the issue is not considered critical by most Americans, and is in fact considered most critical by those who are opposed to a pathway to citizenship and legal status for Dreamers. More than four in ten Americans (44%) rate immigration as a critical issue, another 44% say it is one of many important issues, and about one in ten say it is not important at all (9%). The proportion who say immigration is a critical issue has been as low as 34% in 2013, when PRRI first asked this question, and 33% in 2020 (33%), while in 2019 it jumped to nearly half (49%).
Republicans (64%) have become much more likely to say immigration is a critical issue since 2013 (41%), despite a brief return to lower levels in 2020 (38%). Independents have followed a similar pattern, up to 41% in 2021 from 33% in 2013 and 29% in 2020. In 2021, large majorities of Republicans who most trust far-right media sources (86%) and Fox News (71%) to provide accurate information about politics and current events say that immigration is a critical issue. (These groups were not available prior to 2021.) Democrats, however, have wobbled from 30% saying immigration is a critical issue in 2013 up to 49% in 2019, then back to 33% in 2021.
With the exception of the brief downturn in 2020, white Christian groups and religiously unaffiliated Americans have become more likely to say that immigration is a critical issue since 2013.[7] White evangelical Protestants increased from 38% saying immigration is a critical issue in 2013 to 54% in 2021, white Catholics increased from 36% in 2013 to 57% in 2021, and white mainline Protestants increased from 32% in 2013 to 53% in 2021. Religiously unaffiliated Americans, the only other religious group large enough to be measured in all of these surveys, have remained mostly stable, at 30% in 2013 and 32% in 2021, except for small upticks in 2015 (38%) and 2019 (37%).
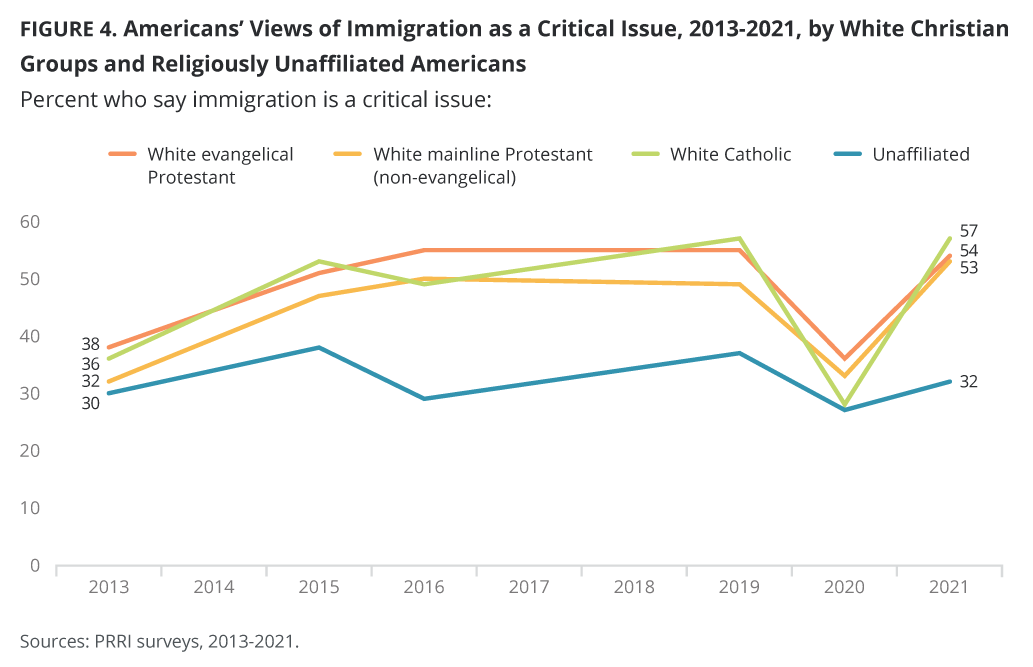
Nearly half of white (47%) and Hispanic Americans (49%) say that immigration is a critical issue, compared to about one-third of Black Americans (35%). However, white Americans with four-year college degrees are notably less likely than white Americans without four-year college degrees to rate immigration as a critical issue (37% vs. 52%). This gap is notably wider today than it was in 2013 (30% vs. 36%), with white Americans without four-year college degrees becoming substantially more likely to say immigration is a critical issue over time.
Rating immigration as a critical issue generally increases with age, from Americans ages 18–29 (41%, up from 30% in 2013), Americans 30–49 (38%, up from 33% in 2013), Americans 50–64 (46%, up from 37% in 2013), to Americans 65 and over (55%, up from 40% in 2013).
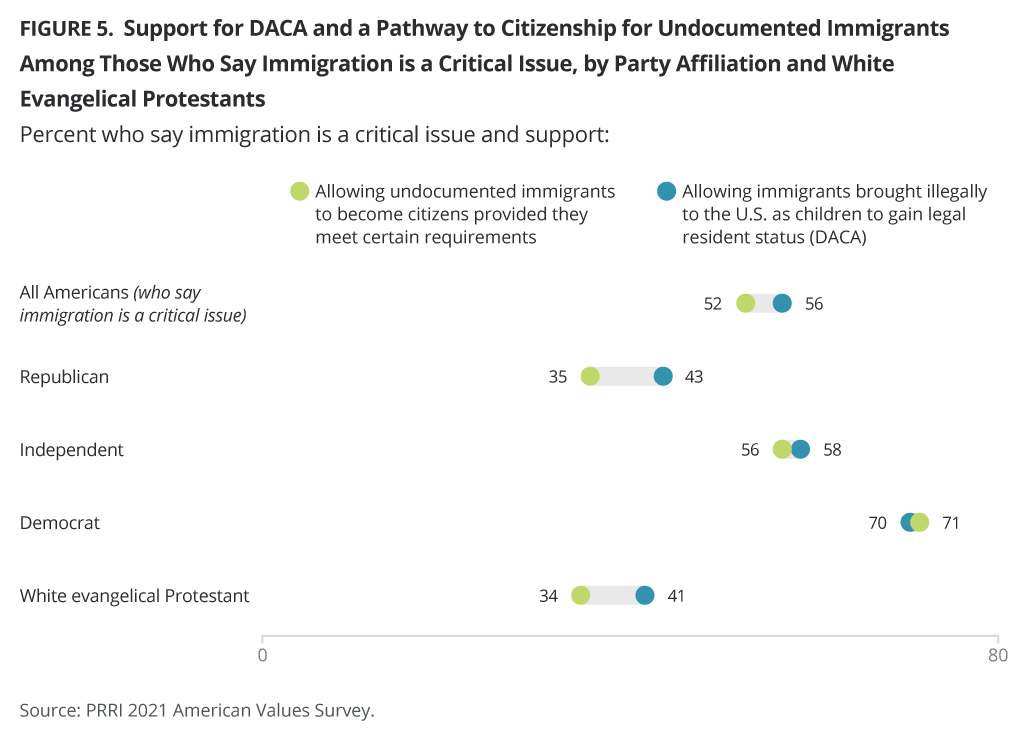
Interestingly, the groups who reached a majority indicating that immigration is a critical issue, such as Republicans (64%), including those who most trust far-right news (86%) and Fox News (71%) and white evangelical Protestants (54%), also show the lowest support for allowing immigrants brought illegally to the U.S. as children to gain legal resident status (DACA) and allowing undocumented immigrants to become citizens provided they meet certain requirements.
Support for DACA and a pathway to citizenship among those who say immigration is a critical issue follows the same patterns, with seven in ten Democrats (70% and 71%, respectively) and majorities of independents (58% and 56%, respectively) supporting both policies. A substantially smaller percentage of Republicans (43% and 35%, respectively) and white evangelical Protestants (41% and 34%) support both policies.
What Do Immigrants Contribute to American Society?
Immigrants: Strength or Cultural Threat?
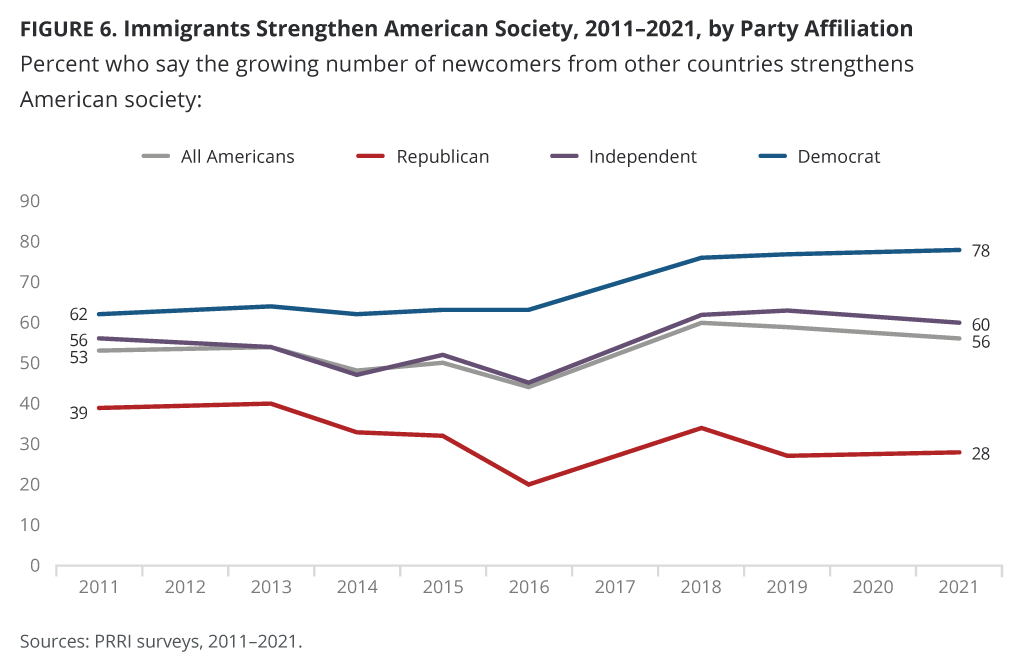
A majority of Americans (56%) say that in general, newcomers strengthen American society, compared to four in ten (40%) who say that newcomers threaten traditional American customs and values. These opinions have shifted over time. In 2011, 53% said newcomers strengthen American society. That proportion increased to 60% in 2018 and is down slightly today, to 56%. By contrast, in 2011, 42% said newcomers threaten traditional American customs and values; this went down to 37% in 2018 and remains about the same today (40%).
Republicans are less likely to have positive views of immigrants today (28%) than they were in 2018 (34%) and in 2011 (39%), and have grown more likely to believe that immigrants threaten American values (55% in 2011, 65% in 2018, and 71% today). In fact, the vast majority of Republicans who most trust far-right media outlets (90%) and Fox News (80%) say newcomers threaten traditional American customs and values. By contrast, more than three in four Democrats (78%) say immigrants strengthen American society, unchanged from 2018 (76%) but up from 2011 (62%). Six in ten independents (60%) say immigrants strengthen American society.
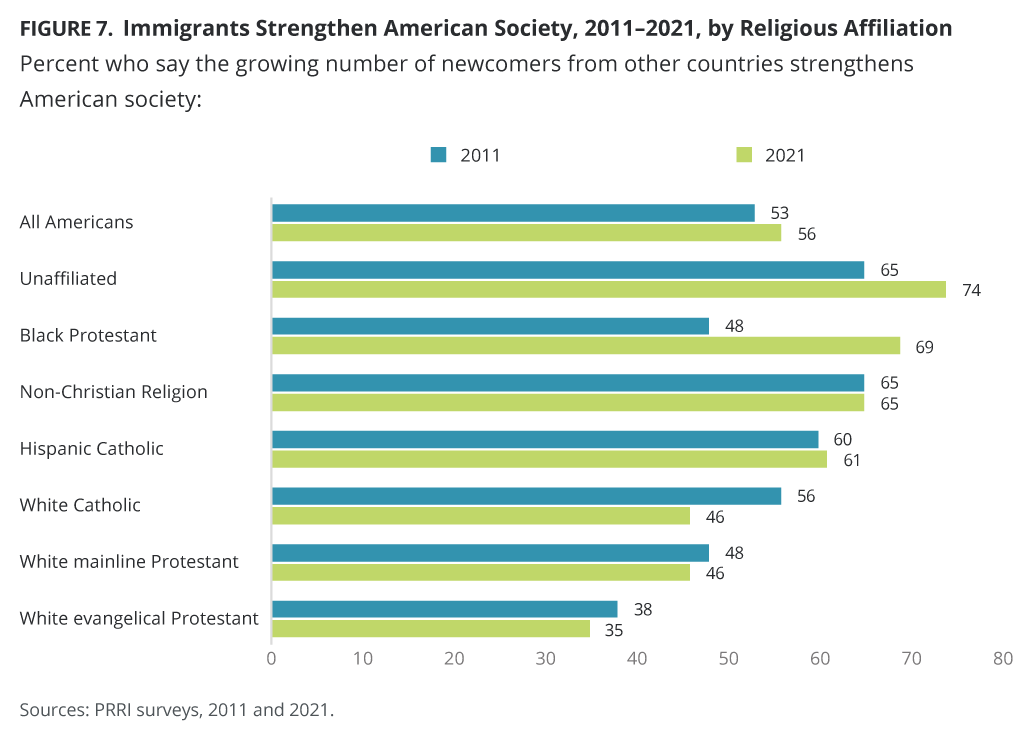
With the exception of white Christians, majorities of all religious groups say that newcomers strengthen American society, including about three in four religiously unaffiliated Americans (74%), 69% of Black Protestants, 65% of members of non-Christian religions, 61% of Hispanic Catholics, and 58% of other Christians. White evangelical Protestants are the least likely to agree that immigrants strengthen American society and haven’t shifted significantly from this opinion since 2011 (38% and 35% in 2021), with a brief peak in 2018 (43%). While about half of white mainline Protestants and white Catholics (both 46%) say that immigrants strengthen American society, white Catholics are notably less likely to think so today than they were in 2011 (56%), while white mainline Protestants remain stable (48% in 2011). Black Protestants (48% in 2011; 69% in 2021) and religiously unaffiliated Americans (65% in 2011; 74% in 2021) have grown to view immigrants positively over the past decade.
White Americans (52%) are less likely than Black Americans (70%) and Hispanic Americans (62%) to say that newcomers strengthen American society and have remained steady since 2011 (51%). While Hispanic Americans are less likely to believe that newcomers strengthen American society today (62%) compared to 2018 (72%) and 2019 (76%), they remain similar to 2011 levels (64%). By contrast, Black Americans have grown significantly more positive in their opinions about immigrants since 2011, when about 51% said that newcomers strengthen American society.
While young Americans (64% in 2011; 67% in 2021) and Americans ages 50–64 (51% in 2011; 49% in 2021) have remained steady in their opinions of immigrants strengthening American society since 2011, Americans ages 30–49 (54% in 2011; 61% 2021) and Americans 65 and over (41% in 2011; 48% in 2021) have grown more positive in their opinions over the last decade.
Immigrants: Strength or Economic Burden?
Six in ten Americans (61%) say that immigrants today strengthen our country because of their hard work and talents, compared to one-third (35%) who say that immigrants are a burden on our country because they take jobs, housing, and health care. These opinions haven’t shifted since 2018 (64% vs. 33%) but have notably shifted since late 2010 (44% vs. 48%).
Partisans are deeply divided over the impact of immigration. One-third of Republicans (32%), two-thirds of independents (65%), and more than eight in ten Democrats (82%) say that immigrants strengthen the country because of their hard work and talents. Two-thirds of Republicans (65%) say instead that immigrants are a burden because they take jobs, housing, and health care. More than three in four Republicans who most trust far-right media outlets (79%) and Fox News (76%) agree that immigrants are a burden to the country. In late 2010, 26% of Republicans, 45% of independents, and 55% of Democrats said that immigrants strengthen the country because of their hard work and talents.
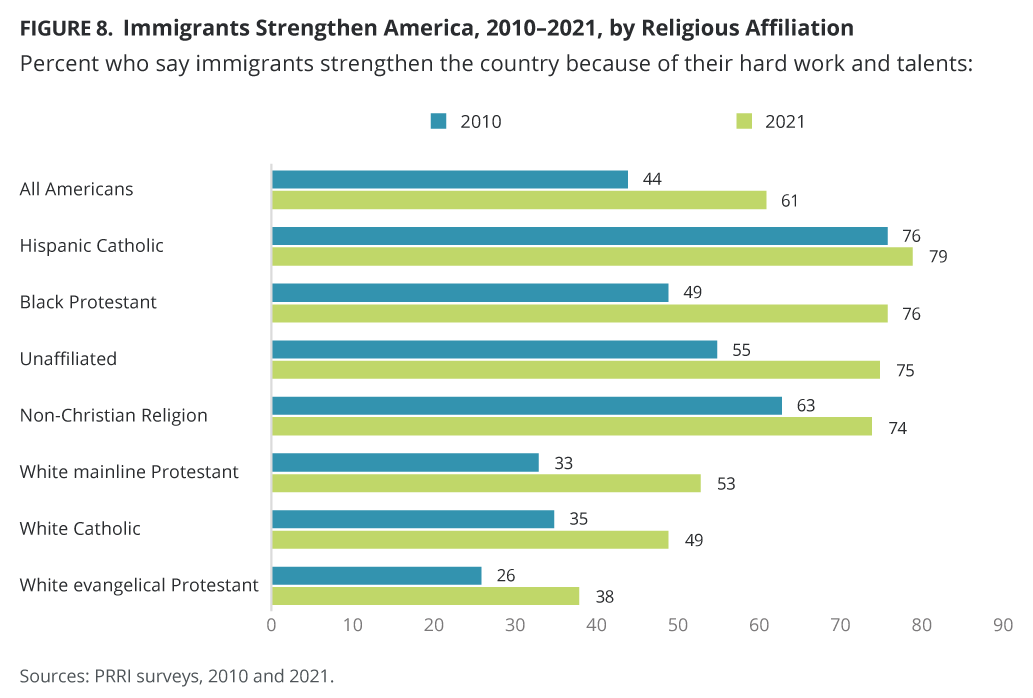
Even though white Christian groups are the least likely to say that immigrants strengthen the country because of their hard work and talents, they are more likely to do so today than they were in late 2010. The same is true among all other religious groups, with the exception of Hispanic Catholics, who have remained stable in this view (76% in 2010; 79% in 2021). While about one-third of white mainline Protestants (33%) and white Catholics (35%) said in late 2010 that immigrants strengthen the country because of their hard work and talents, this percentage has risen today to 53% and 49%, respectively. Even among white evangelical Protestants who are the least likely to agree, they have grown from 26% in 2010 to 38% today. Black Protestants show the biggest shift since late 2010 (from 49% to 76% today), followed by religiously unaffiliated Americans (from 55% to 75% today) and members of non-Christian religions (from 63% to 74% today).
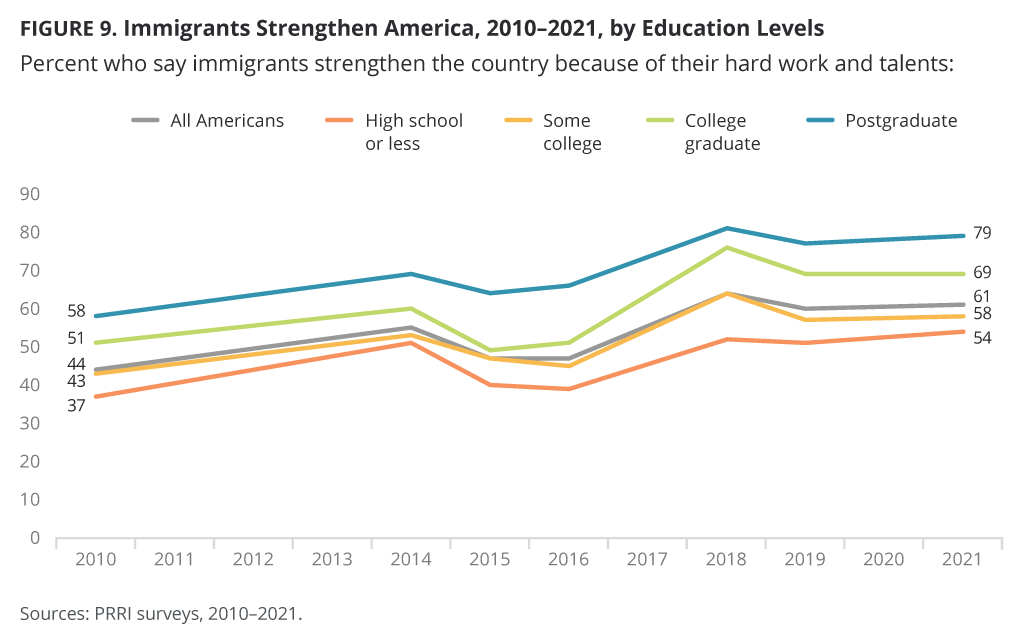
Across all education levels, Americans have consistently grown more likely to say that immigrants strengthen the country because of their hard work and talents compared to 2010, with the highest peak in 2018. Americans with a high school education grew from 37% in 2010 to 52% in 2018 and 54% today, while Americans with some college grew from 43% in 2010 to 64% in 2018 but slightly declined to 58% in 2021. College-educated Americans grew from 51% to 76% in 2018 and bounced back to 69% in 2021, while postgraduates went from 58% to 81% in 2018 and are at about 79% today.
The same trends take place with age. Americans ages 18-29 grew more likely to say that immigrants strengthen the country because of their hard work and talents, from 56% in 2010 to 72% in 2018, and stayed there. Americans ages 30–49 grew from 48% in 2010 to 69% in 2018, and stayed at 66% in 2021. Americans ages 50–64 grew from 36% to 57% in 2018, and stayed at 54% in 2021. Americans 65 years and over went from 32% to 56% in 2018, and stayed at 53% in 2021.
Survey Methodology
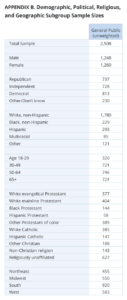 The survey was designed and conducted by PRRI. The survey was made possible through the generous support of the Carnegie Corporation of New York, with additional support from the Wilbur and Hilda Glenn Family Foundation and the Unitarian Universalist Veatch Program at Shelter Rock. Interviews were conducted among a representative sample of 2,508 adults (age 18 and up) living in all 50 states in the United States who are part of Ipsos’s Knowledge Panel. Interviews were conducted online between September 16 and 29, 2021.
Respondents are recruited to the KnowledgePanel using an addressed-based sampling methodology from the Delivery Sequence File of the USPS – a database with full coverage of all delivery addresses in the U.S. As such, it covers all households regardless of their phone status, providing a representative online sample. Unlike opt-in panels, households are not permitted to “self-select” into the panel; and are generally limited to how many surveys they can take within a given time period.
The initial sample drawn from the KnowledgePanel was adjusted using pre-stratification weights so that it approximates the adult U.S. population defined by the latest March supplement of the Current Population Survey. Next, a probability proportional to size (PPS) sampling scheme was used to select a representative sample.
To reduce the effects of any non-response bias, a post-stratification adjustment was applied based on demographic distributions from the most recent American Community Survey (ACS). The post-stratification weight rebalanced the sample based on the following benchmarks: age, race and ethnicity, gender, Census division, metro area, education, and income. The sample weighting was accomplished using an iterative proportional fitting (IFP) process that simultaneously balances the distributions of all variables. Weights were trimmed to prevent individual interviews from having too much influence on the final results. In addition to an overall national weight, separate weights were computed for each state to ensure that the demographic characteristics of the sample closely approximate the demographic characteristics of the target populations. The state-level post-stratification weights rebalanced the sample based on the following benchmarks: age, race and ethnicity, gender, education, and income.
The margin of error for the national survey is +/- 2.1 percentage points at the 95% level of confidence, including the design effect for the survey of 1.15. In addition to sampling error, surveys may also be subject to error or bias due to question wording, context, and order effects. Additional details about the KnowledgePanel can be found on the Ipsos website: https://www.ipsos.com/en-us/solution/knowledgepanel
Endnotes
[1] https://www.nytimes.com/live/2021/02/18/us/joe-biden-news, https://www.whitehouse.gov/briefing-room/statements-releases/2021/01/20/fact-sheet-president-biden-sends-immigration-bill-to-congress-as-part-of-his-commitment-to-modernize-our-immigration-system/, https://www.congress.gov/bill/117th-congress/house-bill/1177/text, https://www.congress.gov/bill/117th-congress/senate-bill/348/text
[2] https://www.uscis.gov/humanitarian/temporary-protected-status, https://www.whitehouse.gov/briefing-room/statements-releases/2021/01/20/fact-sheet-president-biden-sends-immigration-bill-to-congress-as-part-of-his-commitment-to-modernize-our-immigration-system/
[3] https://www.migrationpolicy.org/programs/data-hub/charts/us-annual-refugee-resettlement-ceilings-and-number-refugees-admitted-united
[4] https://www.whitehouse.gov/briefing-room/statements-releases/2021/05/03/statement-by-president-joe-biden-on-refugee-admissions/
[5] https://www.americanimmigrationcouncil.org/research/guide-title-42-expulsions-border
[6] https://www.dhs.gov/migrant-protection-protocols, https://www.migrationpolicy.org/article/court-order-relaunch-remain-in-mexico
[7] The number of cases for all other religious groups is < 100.


