Wedding Cakes, Same-Sex Marriage, and the Future of LGBT Rights in America
The Supreme Court and the Future of LGBT Policies
Public Now Divided Over Religiously Based Service Refusals
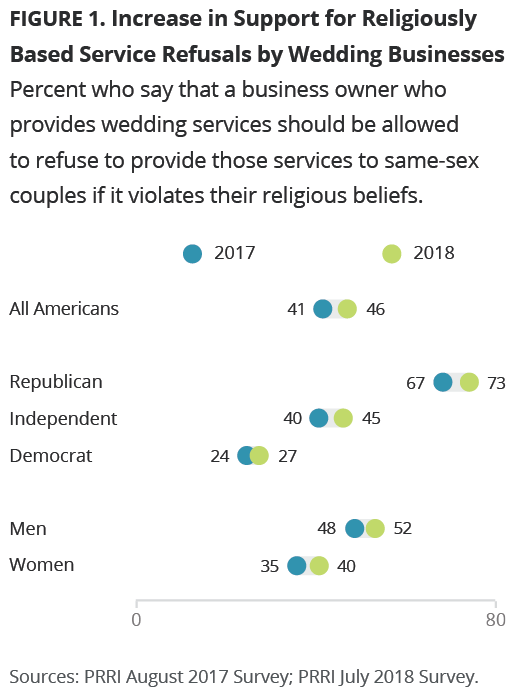
Shortly after the Masterpiece Cakeshop v. Colorado Civil Rights Commission ruling was issued by the Supreme Court in June, Americans report being conflicted over whether small businesses providing wedding services should be able to refuse gay and lesbian customers. Close to half (46%) of Americans believe that the owners of wedding-based businesses, such as caterers, florists, and bakers, should be allowed to refuse to serve same-sex couples if doing so violates their religious beliefs, while about as many (48%) say these types of businesses should be required to serve same-sex couples. One year earlier, a majority (53%) of the public said wedding-based businesses should be required to serve gay and lesbian couples, while only about four in ten (41%) said they should not.1
Not all Americans are equally likely to have shifted their views. Close to half (45%) of black Americans now say wedding-based businesses should be allowed to refuse service to gay and lesbian couples, a significant change from 2017 when 36% expressed this view. Hispanic Americans are also more likely to support religious refusals for wedding businesses today than they were one year ago (34% vs. 26%). Currently, about half of white Americans (49%) say the owners of wedding-based businesses should be allowed to refuse service to gay and lesbian couples; the views of white Americans have remained largely consistent since 2017.
A shift of opinion is also more pronounced among Republicans than Democrats. Today, nearly three-quarters (73%) of Republicans say wedding vendors should be permitted to refuse services to gay and lesbian couples if doing so would violate their religious beliefs, while 67% embraced this view in 2017. Democrats are about as likely to express support for this policy currently as they were last year (27% vs. 24%).
Among major religious groups, white evangelical Protestants express the strongest support for allowing wedding businesses to refuse services. Seven in ten (70%) white evangelical Protestants say wedding businesses, such as caterers, florists, and bakers, should be allowed to refuse to provide goods or services to gay and lesbian couples. White mainline Protestants (48% vs. 45%) and black Protestants (49% vs. 44%) are about as likely to support this policy as they are to oppose it. Nearly six in ten Catholics (58%) and religiously unaffiliated Americans (58%) say these types of businesses should not be allowed to refuse services to gay and lesbian couples.
Men are generally more likely than women to say owners of wedding-based businesses should be allowed to refuse to serve gay and lesbian couples. A majority (52%) of men, compared to 40% of women, believe the owners of wedding-based businesses, such as caterers, florists, and bakers, should be allowed to refuse service to gay and lesbian couples. A similar division was evident in 2017 when close to half (48%) of men, and about one-third (35%) of women, supported this allowance.
Religious Refusals for Small Businesses
Americans are similarly divided over whether small businesses in general ought to be allowed to refuse services. Today, fewer than half (49%) of Americans say small business owners generally should not be allowed refuse services to gay and lesbian people if doing so would go against their religious beliefs. Forty-two percent of the public say this should be allowed. One year earlier, a majority (56%) of the public expressed opposition to the idea of religiously-based service refusals of gay and lesbian people.2
Despite the being divided over whether wedding-based businesses should be allowed to refuse services to gay and lesbian couples most black Americans do not believe small businesses generally should be allowed to do this. More than six in ten (63%) of black Americans say small businesses should not be allowed to refuse services to gay and lesbian people, a view that has remained consistent from a year earlier. White Americans are roughly divided with about as many expressing support as opposition (44% vs. 47%), roughly similar to their views in 2017.
Republicans are more likely than Democrats to express increased support for this position. Nearly two-thirds (64%) of Republicans say small business owners should be allowed to refuse services to gay and lesbian people, while 42% of independents and only about one-quarter (24%) of Democrats agree. In 2017, fewer than six in ten (57%) Republicans, and fewer than half of independents (42%) and Democrats (23%), expressed this opinion.
Among religious groups, Catholics are also notable in their rising support for allowing small business owners to refuse services to gay and lesbian people. Today, nearly four in ten (38%) Catholics say small businesses should be allowed to refuse services, compared to only 29% who expressed this view in 2017. Views are more stable among white evangelical Protestants, white mainline Protestants, and religiously unaffiliated Americans. Support among white evangelical Protestants (61% vs. 60%), white mainline Protestants (40% vs. 44%), and religiously unaffiliated Americans (34% vs. 31%) is roughly the same today as it was in 2017.
Record Support for Same-sex Marriage
Nearly two-thirds (64%) of the public express support for same-sex marriage. Only 28% of Americans oppose allowing gay and lesbian couples to marry. Even over the last few years, support has risen sharply. In June 2015, when Obergefell v. Hodges was decided, 55% of Americans said they were in favor of same-sex marriage.3
Republicans are now divided over same-sex marriage, while Democrats and independents express strong support for the policy. Eighty percent of Democrats and two-thirds (67%) of independents favor allowing gay and lesbian couples to marry legally. Fewer than half (47%) of Republicans oppose same-sex marriage while nearly as many (44%) now say same-sex marriage should be legal.
There are enduring generational divisions as well, although a majority of every age group now expresses support for same-sex marriage. More than eight in ten (81%) young adults (age 18-29) and a slim majority (51%) of seniors (age 65 or older) say gay and lesbian couples should be allowed to marry legally.
Stable Support for Nondiscrimination Protections for LGBT People
More than seven in ten (71%) Americans say they favor laws that would protect lesbian, gay, bisexual, and transgender (LGBT) people against discrimination in employment, housing, and public accommodations. Only 22% of the public say they oppose these laws. Views have not shifted significantly over the last few years. In 2015, a nearly identical number of Americans (69%) said they supported these types of laws, while 25% were opposed.4
Should Obergefell v. Hodges be Overturned or Upheld?
There is a widespread belief among the public that Obergefell v. Hodges, which established the constitutional right for same-sex couples to marry, was the right decision and should be upheld. More than six in ten (62%) Americans support the decision and want it to be upheld, while only 28% say it was the wrong decision and should be overturned. Ten percent of the public offer no opinion.
Partisans differ substantially over the issue. More than three-quarters (78%) of Democrats and two-thirds (67%) of independents say Obergefell v. Hodges was decided correctly and should be upheld, while only 38% of Republicans agree. About half (49%) of Republicans say the Supreme Court wrongly decided this case and it should be overturned. Twelve percent of Republicans express no opinion on the matter.
There is strong support for upholding the constitutionality of same-sex marriage among most religious groups. More than eight in ten (81%) religiously unaffiliated Americans, three-quarters (75%) of white mainline Protestants, and about two-thirds (66%) of Catholics believe the Obergefell decision was correct. Even among white evangelical Protestants, who strongly object to same-sex marriage, there is not a strong appetite to overturn the ruling. About one-third (34%) of white evangelical Protestants say the Obergefell decision was right and should be upheld, while about half (52%) say it should be overturned. Fourteen percent express no opinion on the issue.
Views vary dramatically by age. More than eight in ten (81%) young adults say the Supreme Court decision establishing a constitutional right to same-sex marriage was right and ought to be upheld. Only about half (52%) of seniors agree, while 36% say the decision should be overturned. Twelve percent of seniors express no opinion on the issue.
Trump’s Supreme Court Nominee
Just before Donald Trump formally announced the nomination of Brett Kavanaugh to the Supreme Court, about half (51%) of the public believed that Trump would nominate someone who was likely to overturn Obergefell. Twenty-two percent of the public said the nominee was likely to uphold the decision, while about one-quarter (26%) reported no opinion.
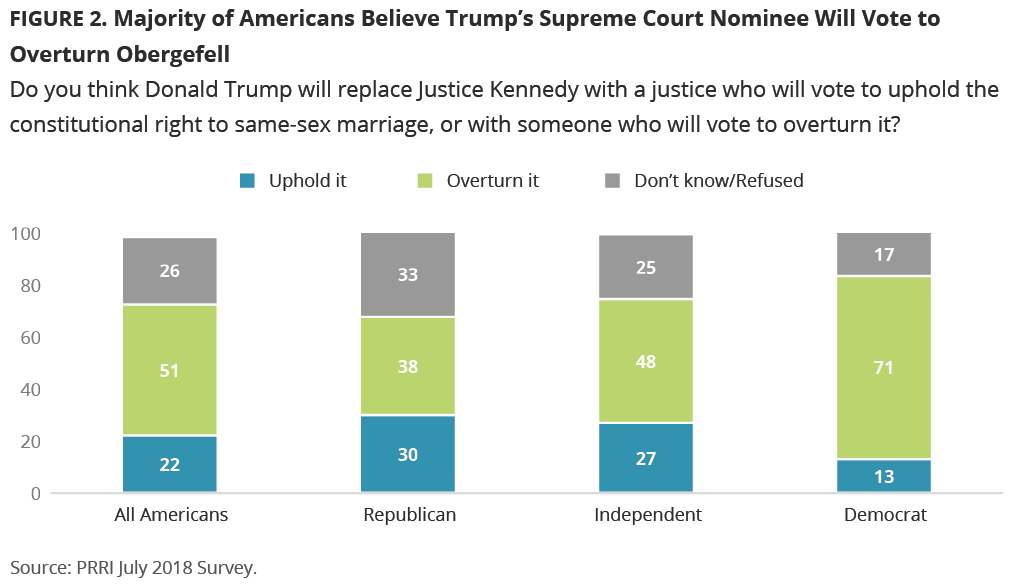
Democrats are quite confident that Trump’s nominee would overturn the decision if given the opportunity. More than seven in ten (71%) Democrats say they believe Trump’s nominee would overturn Obergefell. Republicans are more divided. Thirty percent believe the nominee will uphold the decision, while 38% say the nominee will vote to overturn it. One-third (33%) of Republicans are unsure or offer no opinion. The views of independents are nearly identical to the public overall.
Views of Donald Trump and His Policies
Are Trump’s Policies Helping or Hurting Gay, Lesbian, and Transgender People?
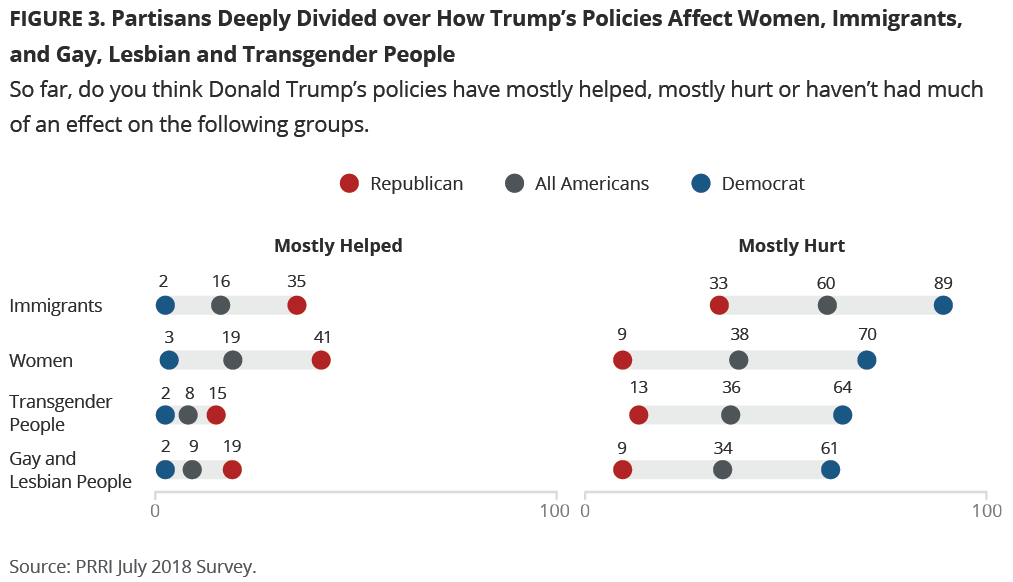
Americans are about four times more likely to say Donald Trump’s policies are mostly hurting (34%) rather than helping (9%) gay and lesbian people, although 42% say they have not had much effect either way. Fifteen percent of Americans report that they do not know the effect Trump’s policies have had on gay and lesbian people.
Republicans are more likely to say Trump’s policies are helping (19%) rather than hurting (9%) gay and lesbian people. However, a majority (57%) of Republicans say Trump’s policies are not affecting gay and lesbian people one way or another. In contrast, more than six in ten (61%) Democrats believe Trump’s policies are harming gay and lesbian people. Only two percent say they are helping, while 28% say they have had no real effect. The views of independents closely align with the public overall.
Women are far more likely than men to say Trump’s policies have been to the detriment of gay and lesbian people (39% vs. 28%). A similar number of men (11%) and women (7%) believe Trump’s policies are helping gay and lesbian people, while about half (47%) of men and about four in ten (37%) women say they have not impacted gay and lesbian people either positively or negatively.
Half (50%) of Americans who self-identify as gay, lesbian, bisexual, or transgender believe Trump’s policies are harming gay and lesbian people, while only three percent say they are helpful. More than four in ten (41%) LGBT Americans say Trump’s policies have not affected gay and lesbian people at all.5
The public’s views of the impact of Trump’s policies on transgender people are nearly identical to their views of the impact on gay and lesbian people. Roughly one-third (36%) say the current administration’s policies have adversely affected transgender people, while only eight percent say they have impacted them positively. Forty-one percent do not believe Trump’s policies have had an impact on transgender people at all, and 15% offer no opinion.
However, Americans who self-identify as LGBT are much more likely to say Trump’s policies have been harmful to transgender people. More than two-thirds (68%) of LGBT people say the administration’s policies have adversely affected transgender people.
Are Trump’s Policies Helping or Hurting Women?
Americans are also divided over the impact that Trump’s policies are having on women. Americans are twice as likely to say Trump’s policies have hurt (38%) rather than helped (19%) women, but more than one-third (34%) do not perceive any impact at all. Ten percent do not express an opinion on this question.
Republicans are more likely to believe Trump’s policies are helping women (41%) than harming them (9%), but 42% say they are not having any effect. Seven in ten (70%) Democrats say Trump’s policies are harmful to women. Only three percent say they are beneficial, and 22% say they have no effect on women. Notably, there are no significant differences between the views of men and women among Democrats or Republicans.
There is a considerable gap between the views of men and women in general. Close to half (45%) of women say Trump’s policies have been harmful to women, while only 30% of men say the same. About one-quarter (23%) of men say Trump’s policies have helped women, while only 14% of women express this view. Similar numbers of men (36%) and women (32%) say they do not believe there has been any effect on women.
Are Trump’s Policies Helping or Hurting Immigrants?
There is a much greater consensus among the public overall in perceptions of how Trump’s policies are affecting immigrants. Six in ten (60%) Americans say Trump’s policies have a negative impact on immigrants. Sixteen percent say his policies have been beneficial to immigrants, while 14% say they have not had any impact.
There are sizable differences in the views of Americans by race and ethnicity. Eight in ten (80%) black Americans and seven in ten (70%) Hispanic Americans say current administration policies have harmed immigrants. Fewer (54%) white Americans agree. Among whites, views diverge sharply by education level. Two-thirds (67%) of Americans with a four-year college degree say Trump’s policies are harmful to immigrants, while fewer than half (48%) of white Americans without a four-year college education agree.
There is also widespread partisan disagreement about the effect Trump’s policies have on immigrants. Eighty-nine percent of Democrats say administration policies are harming immigrants, while only two percent say they are helping. Republicans are about as likely to say they are harmful (33%) as helpful (35%). Twenty percent of Republicans say they do not have much effect.
Views of Donald Trump
A majority (53%) of the public continues to express an unfavorable opinion of Trump. Roughly four in ten (41%) Americans view the president positively. Public views of Trump have been quite stable since his inauguration. In January 2017, a majority (52%) of the public said they had an unfavorable view of Trump, while 43% said they viewed him positively.6
There is a wide partisan gap in views of Trump, but Democrats report stronger feelings about the president than Republicans do. Eighty-nine percent of Democrats have an unfavorable view of Trump, but an extraordinarily high 70% have a very unfavorable view of him. A similar number of Republicans (86%) view Trump favorably, but far fewer (42%) have a very favorable opinion of him.
White evangelical Protestants remain among Trump’s most fervent supporters; 73 % hold a favorable view of him.
Changing Perceptions of Discrimination
Gay, Lesbian, and Transgender People
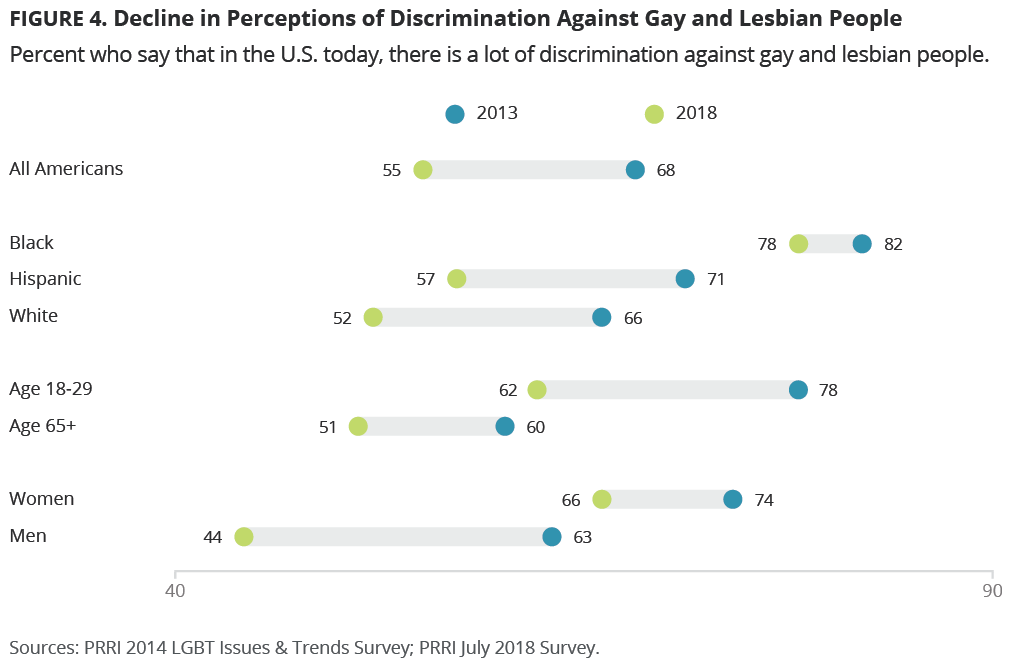
Americans are far less likely to perceive discrimination against gay, lesbian, and transgender people today than just five years ago. Today, a majority (55%) of Americans believe gay and lesbian people experience a lot of discrimination in the U.S., a 13-point drop from 2013, when nearly seven in ten (68%) Americans said the same.7 Perceptions of discrimination against transgender people are also significantly lower today. Roughly six in ten (59%) Americans say transgender people face a lot of discrimination in the U.S. today, compared to more than seven in ten (71%) who expressed this opinion in 2013.8
Men and women are both less likely to perceive discrimination against gay and lesbian people today than they were in 2013, but the gender gap has grown much wider. Only about four in ten (44%) men say that gay and lesbian people face a significant amount of discrimination in the U.S. today, compared to nearly two-thirds (66%) of women. In 2013, more than six in ten (63%) men and roughly three-quarters (74%) of women said gay and lesbian people faced extensive discrimination in the U.S.
The partisan gap has also grown wider. Democrats are about as likely to say gay and lesbian people face a lot of discrimination in the U.S. today as they were in 2013 (81% vs. 79%). In contrast, Republicans are far less likely to say gay and lesbian people experience a lot of discrimination today (29%) than they did in 2013 (54%). Views of independents roughly align with the population as a whole today and in 2013.
Black Americans are unique in the extent to which their perceptions of the amount of discrimination faced by gay and lesbian people have not changed over the last few years. Roughly eight in ten black Americans today (78%) and in 2013 (82%) believe gay and lesbian people face a lot of discrimination. In contrast, Hispanic Americans (57% vs. 71%) and white Americans (52% vs. 66%) are much less likely to say gay and lesbian people experience a lot of discrimination today than they were in 2013.
While young Americans are still more likely to perceive discrimination against gay and lesbian people than seniors, they have experienced a steeper decline in such perceptions over the past five years. Today, only about six in ten (62%) young Americans say that there is a lot of discrimination against gay and lesbian people in the U.S., while nearly eight in ten (78%) said the same in 2013. Slightly more than half (51%) of seniors say that gay and lesbian people face a lot of discrimination, a smaller but significant drop from 2013 when 60% expressed this view.
Among major religious groups in the U.S., white evangelical Protestants have experienced a precipitous decline in perceptions of discrimination against gay and lesbian people. Only 39% of white evangelical Protestants say gay and lesbian people are experiencing a lot of discrimination today, while 58% expressed this view in 2013. White mainline Protestants have also seen a significant downward shift in perceptions of discrimination against gay and lesbian people in the last five years. Today, a slim majority (52%) of white mainline Protestants say there is significant discrimination against gay and lesbian people, compared to two-thirds (67%) who said the same in 2013. A similar shift has happened among the unaffiliated. More than six in ten (64%) religiously unaffiliated Americans say there is a lot of discrimination against gay and lesbian people, while more than three-quarters (77%) said the same five years earlier. There was a narrower drop among Catholics. A majority (55%) of Catholics perceive significant discrimination against gay and lesbian people in the U.S. today, while 63% said the same in 2013. Black Protestants are about as likely to say gay and lesbian people are experiencing a lot of discrimination currently as they did in 2013 (79% vs. 82%).
Although Americans are more likely to say transgender people are experiencing substantial discrimination than they are to say the same about gay and lesbian people, the shifts in perspectives are largely similar to those evident in views of gay and lesbian people. For instance, men experienced a more dramatic decline in views than women. Fewer than half (49%) of men say transgender people are currently experiencing a lot of discrimination in the U.S., while nearly two-thirds (65%) expressed this belief in 2013. Two-thirds (67%) of women today, compared to 77% of women in 2013, say transgender people face a lot of discrimination. Republican opinions have also changed substantially, while Democratic attitudes have remained remarkably stable. Only 37% of Republicans believe transgender people currently face a lot of discrimination, while 60% expressed this view in 2013. No group has shifted more dramatically than Republicans.
Americans who identify as LGBT are more likely to perceive discrimination against gay, lesbian, and transgender people than Americans overall. More than eight in ten (82%) LGBT Americans say there is a lot of discrimination against gay and lesbian people in the U.S. today, and 90% say there is a lot of discrimination against transgender people in the U.S. today.
Women
Americans are split over whether women experience significant discrimination in the U.S. today. Forty-five percent of Americans say women face a lot of discrimination, while a majority (52%) say there is not a lot of discrimination against women. Perceptions of discrimination against women have not shifted significantly since 2013, when 44% of Americans said that women faced a lot of discrimination.9
Women are more likely than men to say that women face a lot of discrimination today. A majority (56%) of women believe there is considerable discrimination against women in the U.S. today, while only about one-third (34%) of men say the same. More than six in ten (63%) men say women do not experience a lot of discrimination.
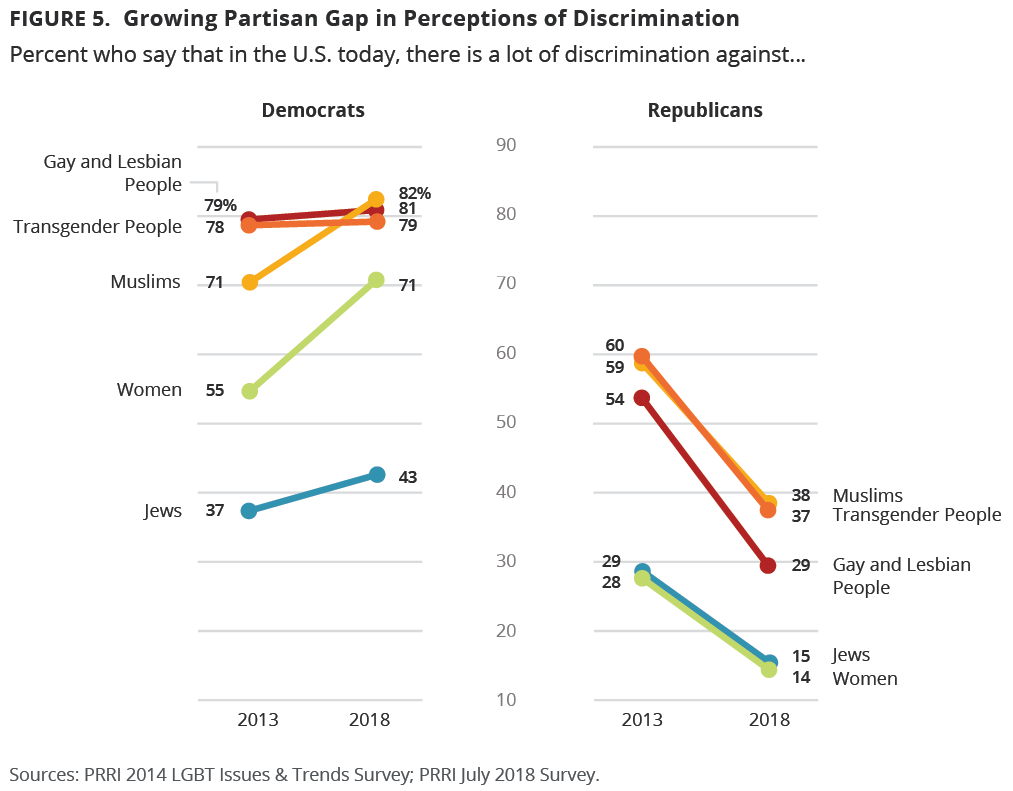
There is a widening partisan gap in perceptions of gender discrimination. Democrats are more likely to perceive discrimination against women, while Republicans are less likely to perceive discrimination. Today, more than seven in ten (71%) Democrats say women experience a lot of discrimination, a view shared by only 14% of Republicans. In 2013, more than half (55%) of Democrats, and about three in ten (28%) Republicans, said that there was a lot of discrimination against women. The views of independents have remained stable since 2013.10
Notably, a similar number of young adults (45%) and seniors (43%) believe there is a lot of discrimination against women. However, young people are experiencing a growing gender divide. Young women are about twice as likely as young men to say women experience a lot of discrimination (59% vs. 30%). In 2013, about half (52%) of young women and close to four in ten (37%) young men said American women face a lot of discrimination.
Immigrants
Despite the introduction and implementation of harsh immigration policies, views of discrimination experienced by immigrants have been stable over the last couple of years. Nearly two-thirds (65%) of Americans say that there is a lot of discrimination against immigrants while 33% disagree. In 2016, 63% of the public said immigrants face a lot of discrimination.11
Women are more likely than men to say there is a lot of discrimination against immigrants. Nearly three-quarters of women (73%), compared to 56% of men, express this view.
Nonwhite Americans are more likely than white Americans to think there is a lot of discrimination against immigrants. More than three-quarters of black (83%) and Hispanic (76%) Americans share this view, compared to six in ten (60%) white Americans.
Democrats are far more likely to say immigrants experience a lot of discrimination than Republicans are (88% vs. 35%). This gap has widened since 2016: Democrats are now more likely to perceive this discrimination (88% vs. 78%), while Republicans are less likely (35% vs. 41%).
Perceptions of Discrimination Against Religious Minorities
Jewish People
Relatively few Americans believe Jewish people in the U.S. are experiencing a considerable amount of discrimination. Only 30% say that Jewish people face a lot of discrimination. Nearly six in ten (59%) Americans feel that there is not a lot of discrimination against Jewish people. Views have remained mostly stable since 2013.12
There is a widening partisan gap in perceptions of discrimination faced by Jewish people. Today, more than four in ten (43%) Democrats say that there is a lot of discrimination against Jews in the U.S., compared to 29% of independents and just 15% of Republicans. In 2013, the partisan divide was much narrower with 37% of Democrats, 33% of independents and 29% Republicans expressing the view that Jewish people face a lot of discrimination.
There are notable differences between religious groups. More than four in ten (44%) black Protestants say Jewish Americans face a lot of discrimination, compared to fewer than one-third of religiously unaffiliated Americans (31%), Catholics (29%), and white mainline Protestants (28%). Only 20% of white evangelical Protestants believe Jewish Americans experience a lot of discrimination.
Muslims
Americans are far more likely to say Muslims are experiencing a substantial degree of discrimination in the U.S. More than six in ten (62%) Americans say there is a lot of discrimination against Muslims, while roughly three in ten (31%) say there is not. But again, views have not changed appreciably since 2013, when 65% said there was a lot of discrimination against Muslims.13
There is also a widening political gap in perceptions of discrimination faced by Muslims. Over eight in ten (82%) Democrats say there is a lot of discrimination against Muslims, compared to 64% of independents and 38% of Republicans. This gap has increased from 2013, when 71% of Democrats, 67% of independents, and 59% of Republicans said Muslims face a lot of discrimination.
Despite the stable perceptions among Americans overall, there are considerable changes occurring among religious communities. White evangelical Protestants are less likely today than they were in 2013 to say Muslims face a lot of discrimination (46% vs. 59%). White mainline Protestants are also significantly less likely to say Muslims are experiencing a lot of discrimination than they were a few years earlier (57% vs. 68%). Black Protestants and religiously unaffiliated Americans have moved in the opposed direction. Black Protestants are much more likely to say Muslims face a lot of discrimination today than in 2013 (79% vs. 56%). More than three-quarters (76%) of religiously unaffiliated Americans also say Muslims face a lot of discrimination, up slightly from 2013 (70%).
There is a stark generational divide. Roughly seven in ten young adults (69%), compared to more than half (55%) of seniors, share this view. These attitudes have remained relatively stable since 2013.
Endnotes
1 PRRI August 2017 Survey.
2 PRRI August 2017 Survey.
3 PRRI June 2015 Survey.
4 PRRI June 2015 Survey.
5 Sample size of Americans who self-identify as LGBT is less than n=100; interpret results with caution.
6 PRRI January 2017 Survey.
7 PRRI 2014 LGBT Issues & Trends Survey.
8 PRRI 2014 LGBT Issues & Trends Survey.
9 PRRI 2014 LGBT Issues & Trends Survey.
10 At least some of this shift may be attributable to the shifting gender composition of partisans. In 2013, the Republican Party included a roughly even number of men and women (51% vs. 49%). Today, men outnumber women among self-identified Republicans (56% vs. 44%). A shift has also occurred among Democrats. In 2013, Democrats were overrepresented by women (61% vs. 39%). Today, women comprise an even larger share of self-identified Democrats (67% vs. 33%).
11 PRRI 2016 American Values Atlas.
12 PRRI 2014 LGBT Issues & Trends Survey.
13 PRRI 2014 LGBT Issues & Trends Survey.
Recommended citation:
Daniel Cox, Ph.D., Molly Fisch-Friedman, Alex Vandermaas-Peeler and Maxine Najle, Ph.D. “Wedding Cakes, Same-Sex Marriage, and the Future of LGBT Rights in America.” PRRI. 2018. https://www.prri.org/research/wedding-cakes-same-sex-lgbt-marriage


