Views on LGBTQ Rights in All 50 States: Findings from PRRI’s 2023 American Values Atlas
*To see the latest data on this topic, see PRRI’s March 2025 report: LGBTQ Rights Across All 50 States: Key Insights from PRRI’s 2024 American Values Atlas
Executive Summary
Throughout 2023, PRRI interviewed more than 22,000 adults as part of its American Values Atlas, allowing for the ability to provide a detailed profile of the demographic, religious, and political characteristics of LGBTQ Americans. As in years past, this analysis measures Americans’ attitudes on LGBTQ rights across all 50 states on three key policies: nondiscrimination protections, religiously based service refusals, and same-sex marriage. This year’s report also includes new analysis of the intersection between Christian nationalist views and LGBTQ attitudes in each state.
LGBTQ Americans skew younger, more Democratic, and less religious than other Americans.
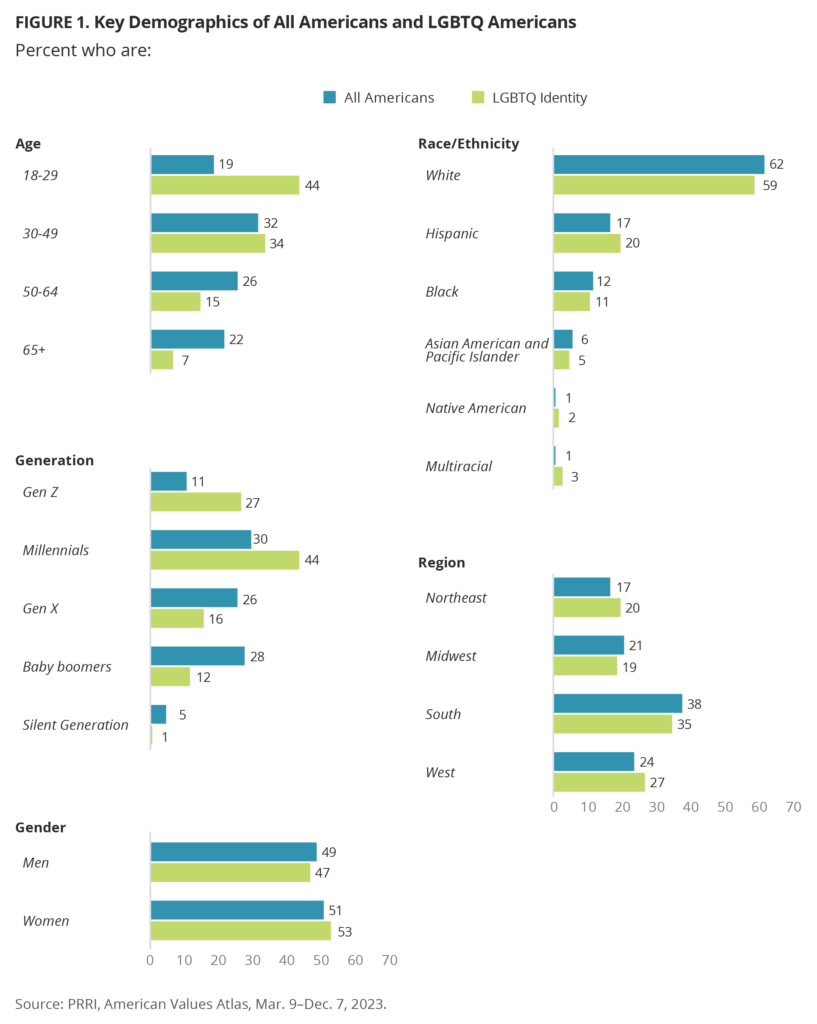
- More than one in five young Americans (18-29 years) identify as LGBTQ (22%). One in ten people ages 30-49 (10%), 6% of people between 50 and 64 years, and 3% of people 65 years or older identify as LGBTQ. Twenty-four percent of Gen Z Americans (aged 18 to 25) identify as LGBTQ.
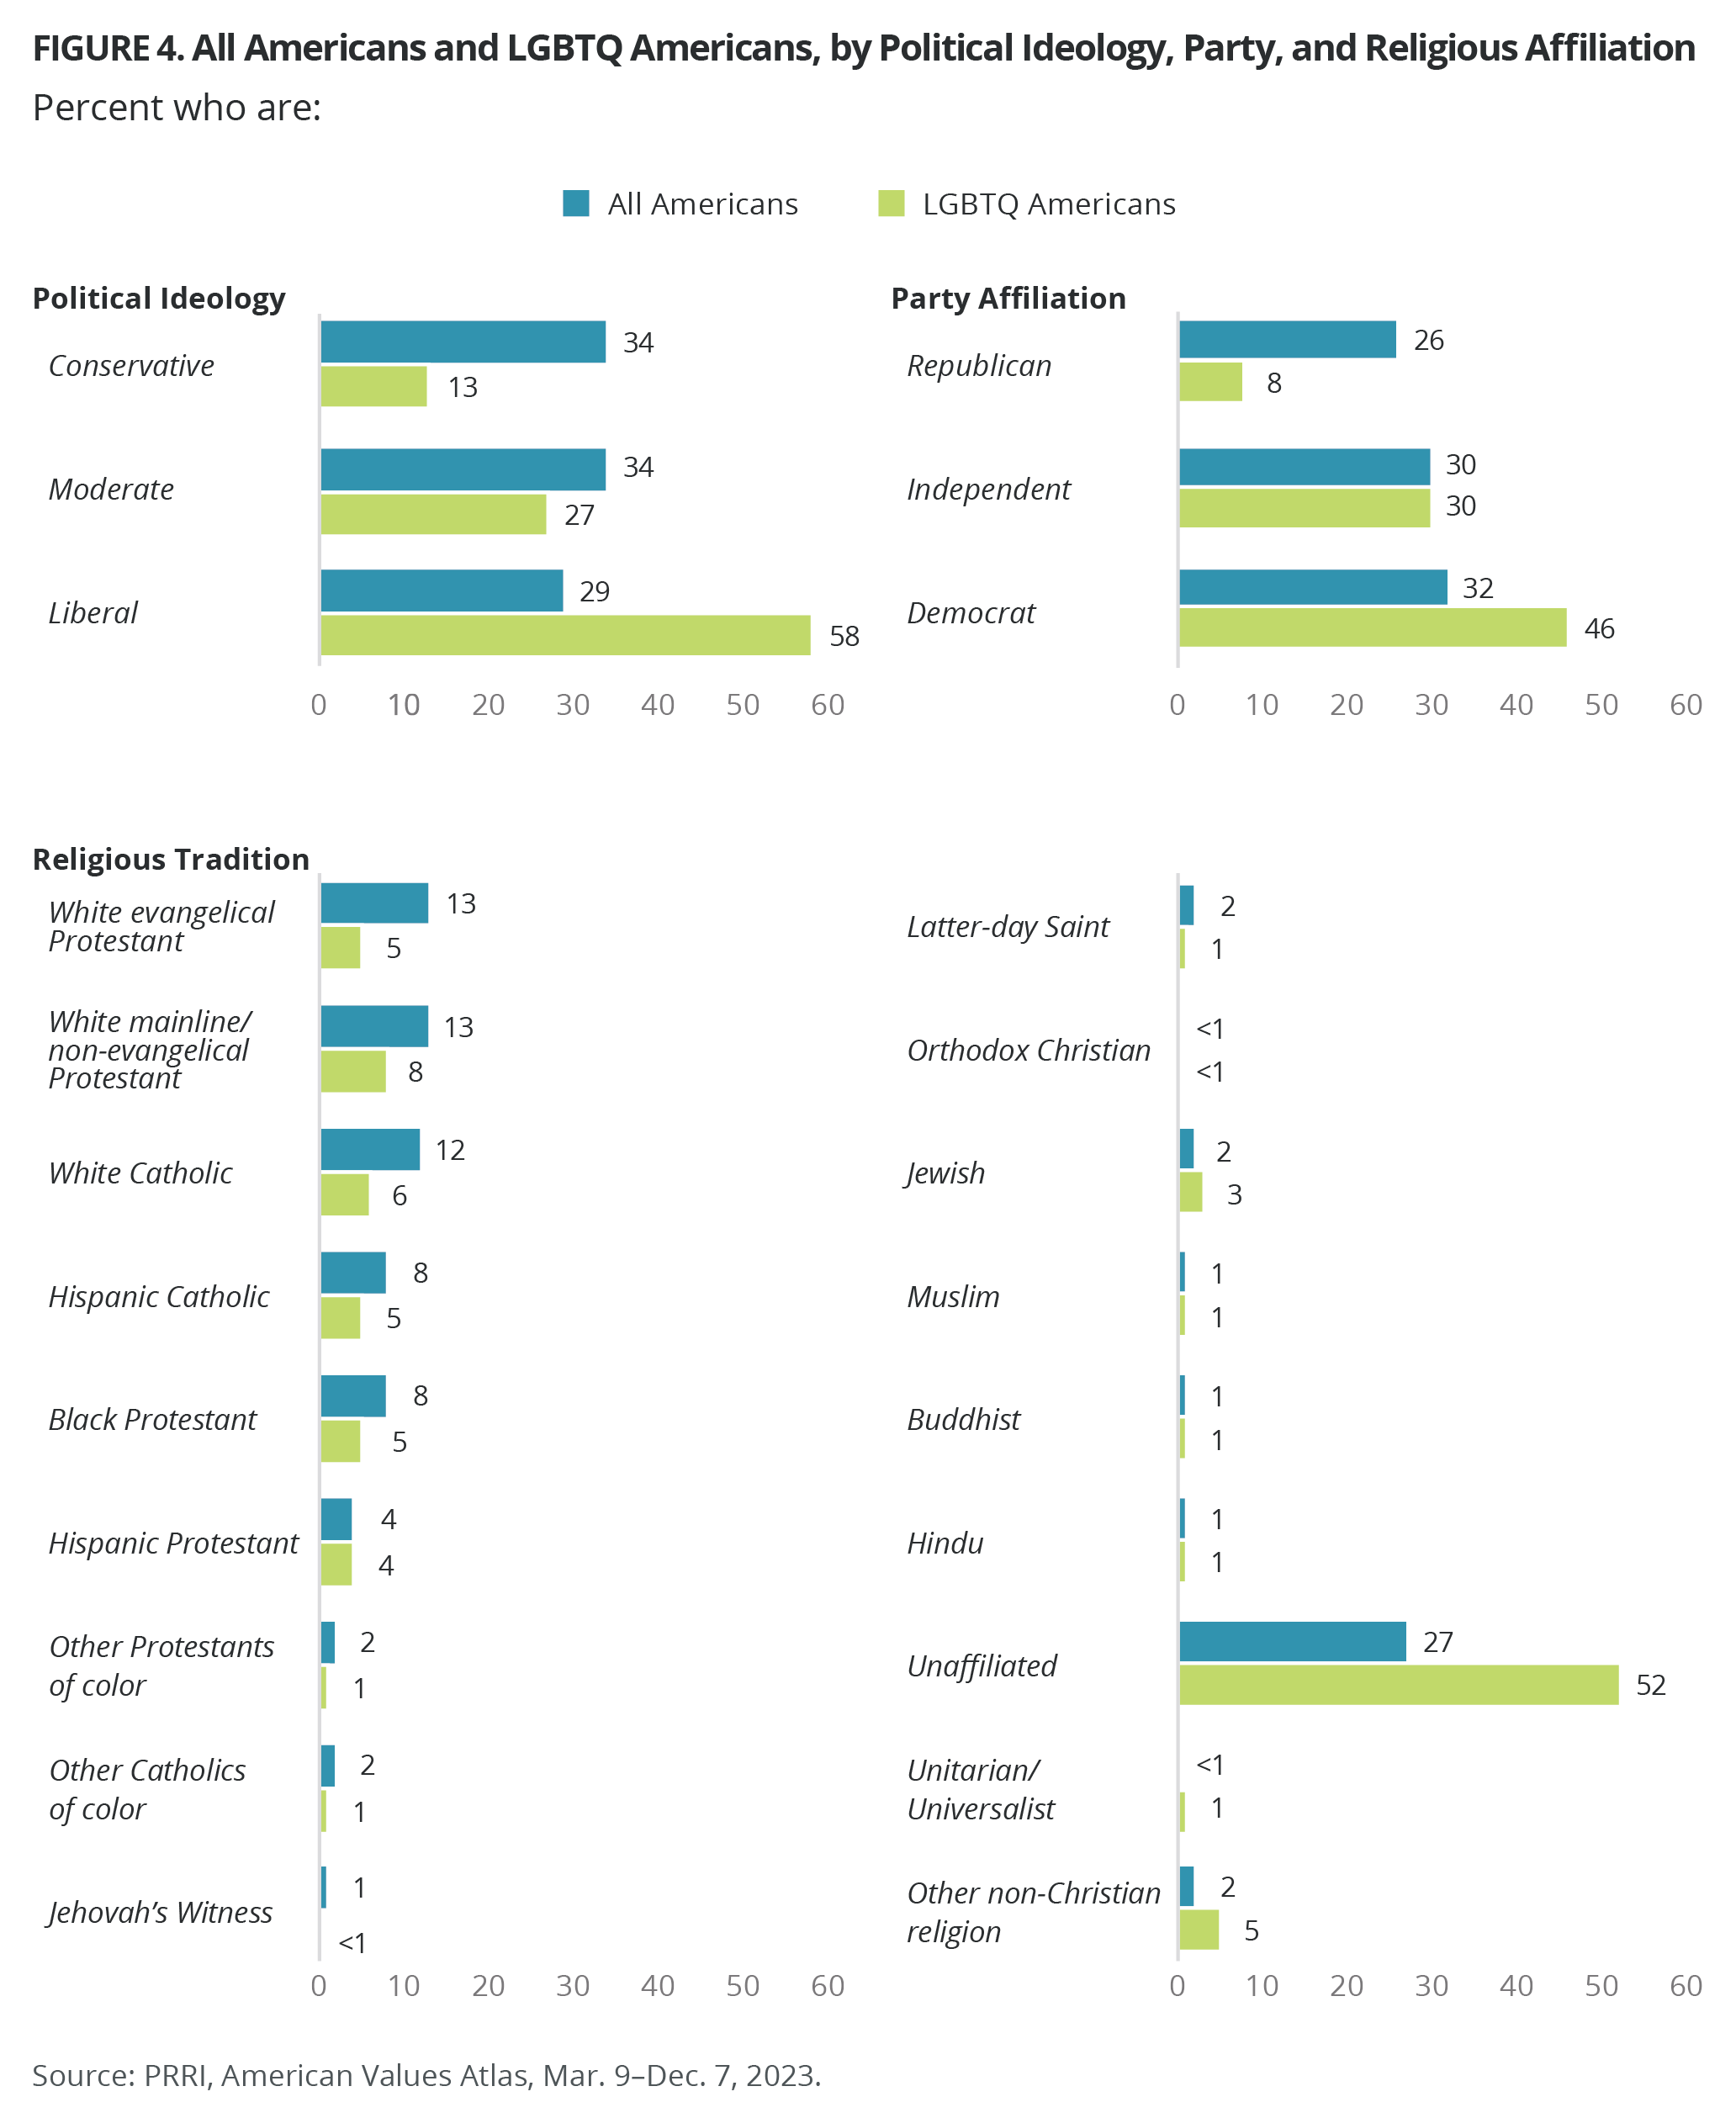
- A plurality of LGBTQ Americans are Democrats (46%); nearly six in ten LGBTQ Americans consider themselves liberal politically (58%).
- The majority of LGBTQ Americans identify as religiously unaffiliated (52%), nearly twice the rate of the general U.S. population (27%). More than a third of LGBTQ Americans identify with a Christian faith (35%) and 5% belong to non-Christian religions.
LGBTQ identification and support for LGBTQ rights differ by state.
- Geographically, the proportion of residents who identify as LGBTQ ranges from 4% in both Alabama and South Carolina, respectively, to 16% in New Mexico.
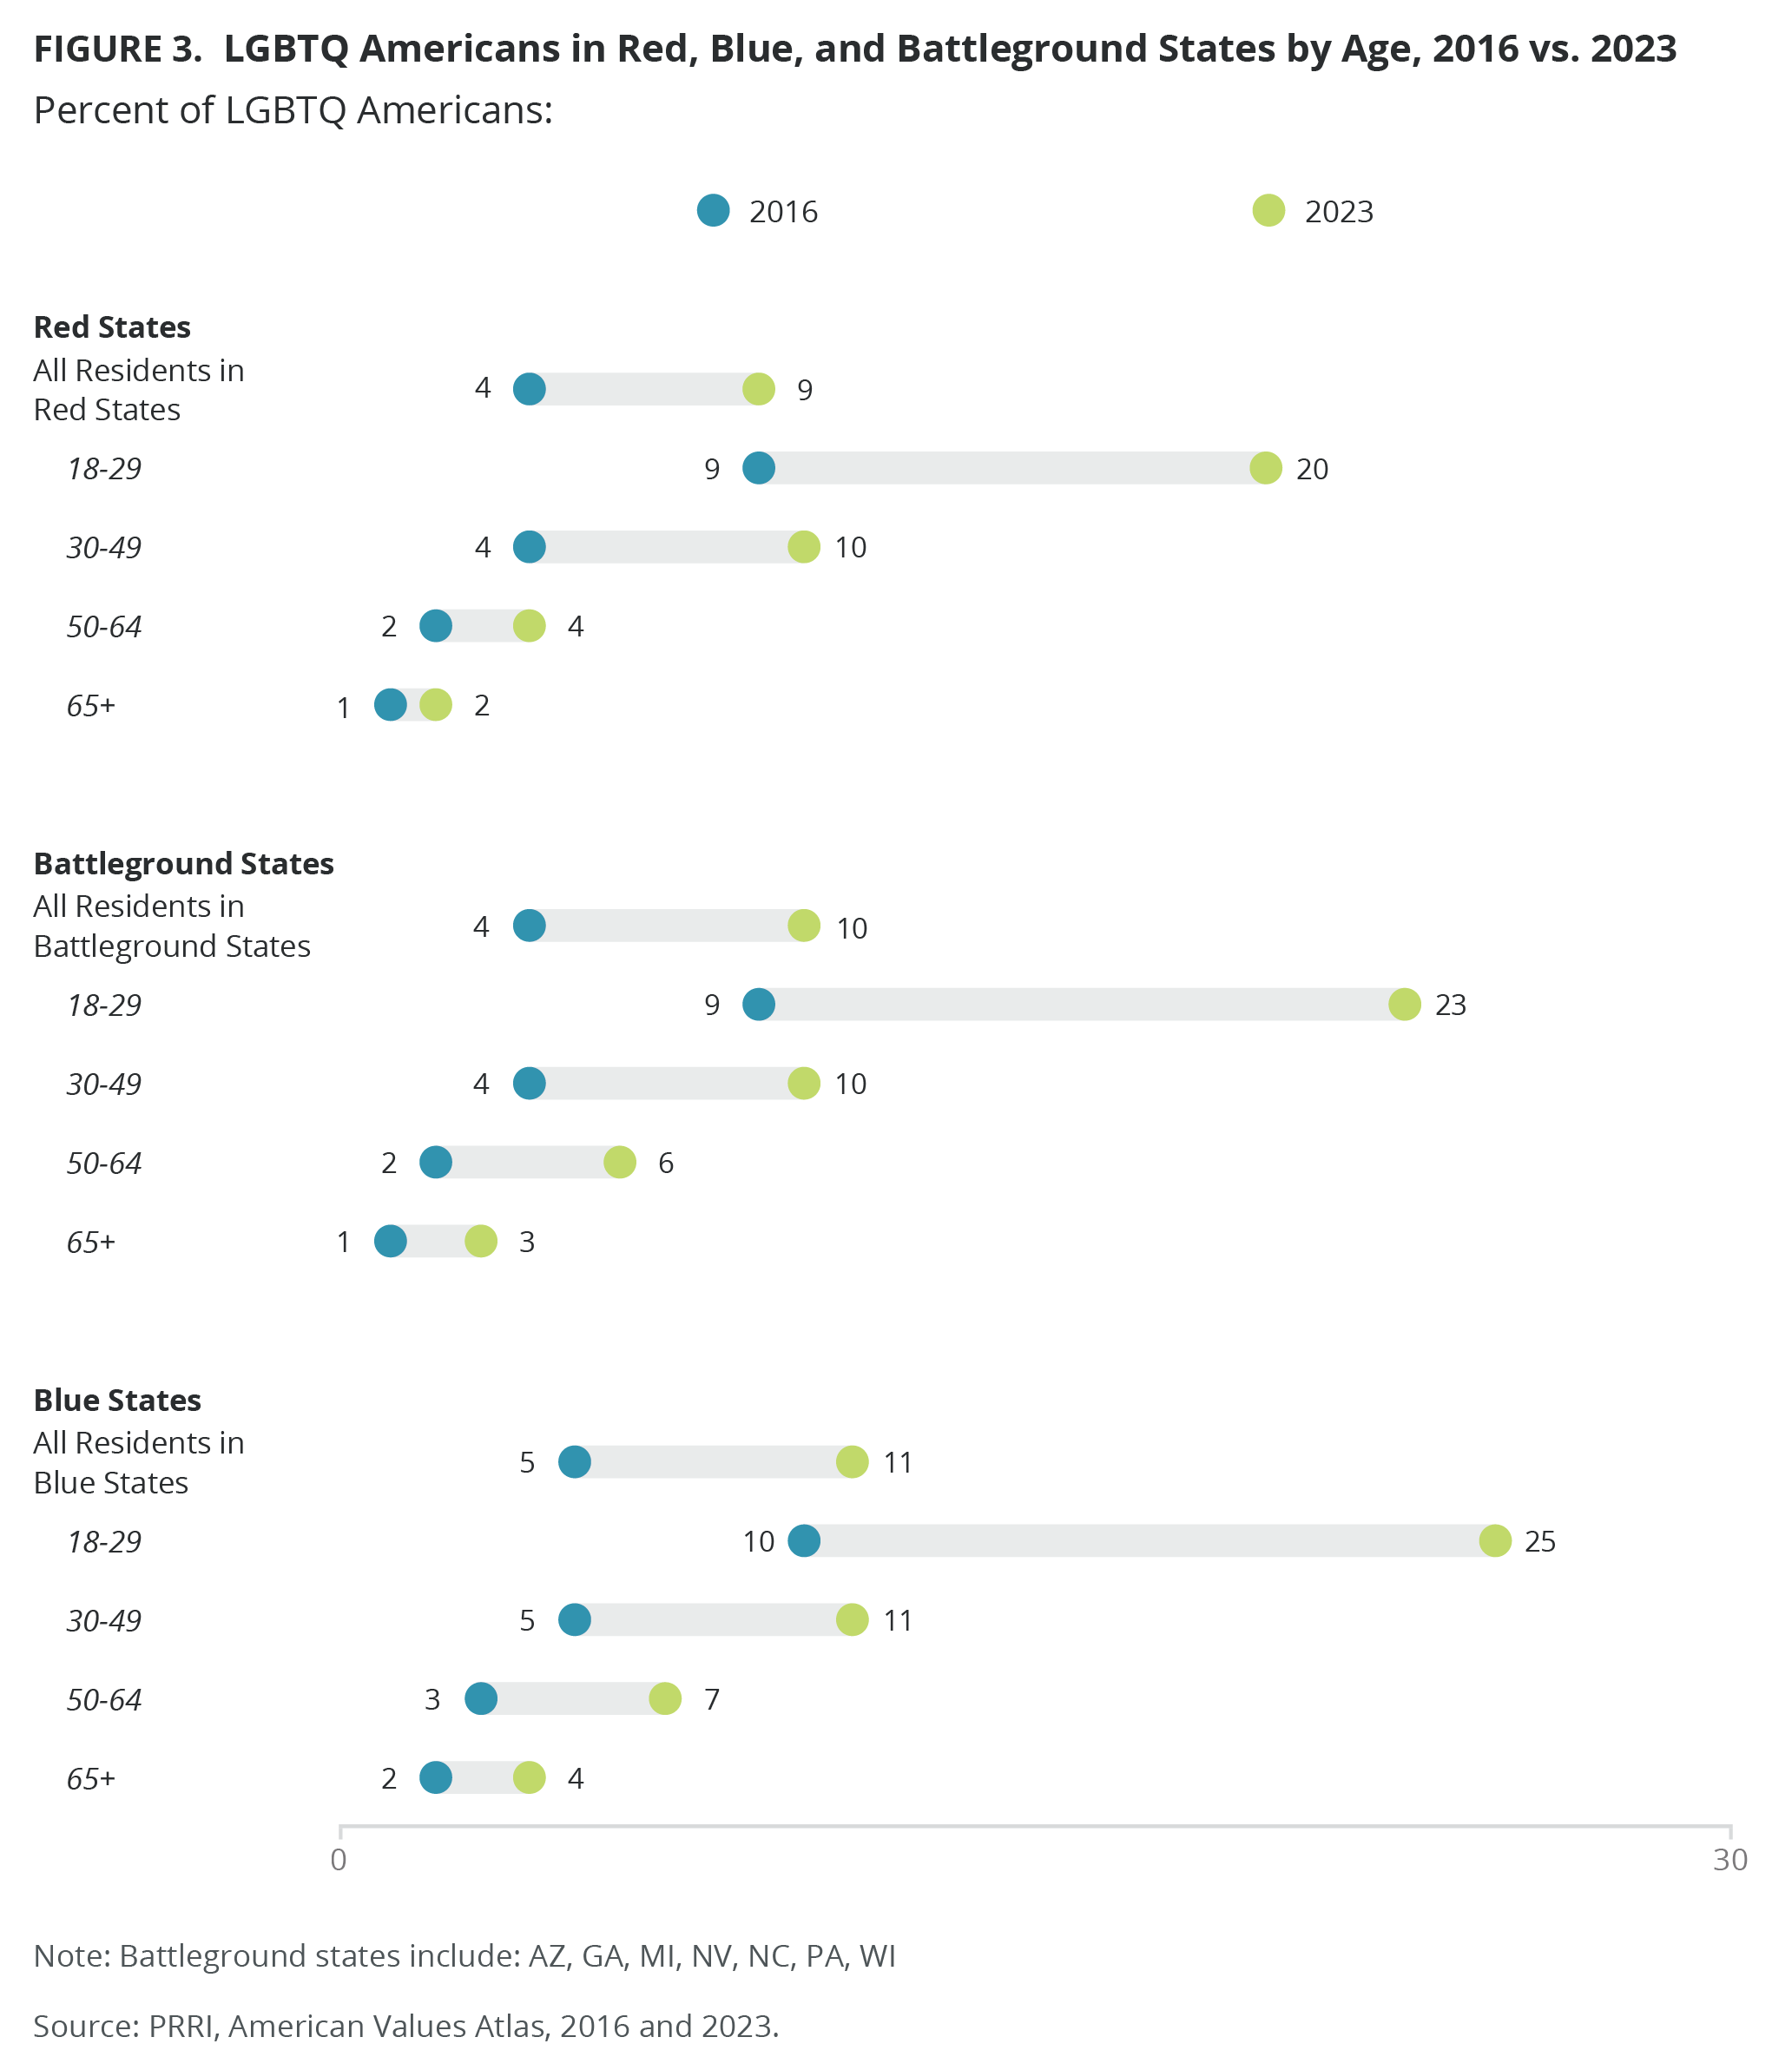
- Since 2016, LGBTQ identification among those under 30 has increased by about 15 percentage points in blue states and battleground states (from 10% to 25% and from 9% to 23%, respectively) and by more than ten percentage points in red states (from 9% to 20%).
- More than seven in ten residents of red (71%), battleground (75%), and blue (79%) states favor nondiscrimination laws; however, residents of blue states are far more likely to strongly favor LGBTQ nondiscrimination laws compared with their red state counterparts (43% v. 34%).
- Opposition to religious refusals is lowest among red state residents (54%) while two-thirds (66%) of residents in blue states oppose service refusals; 58% of residents in battleground states oppose such refusals.
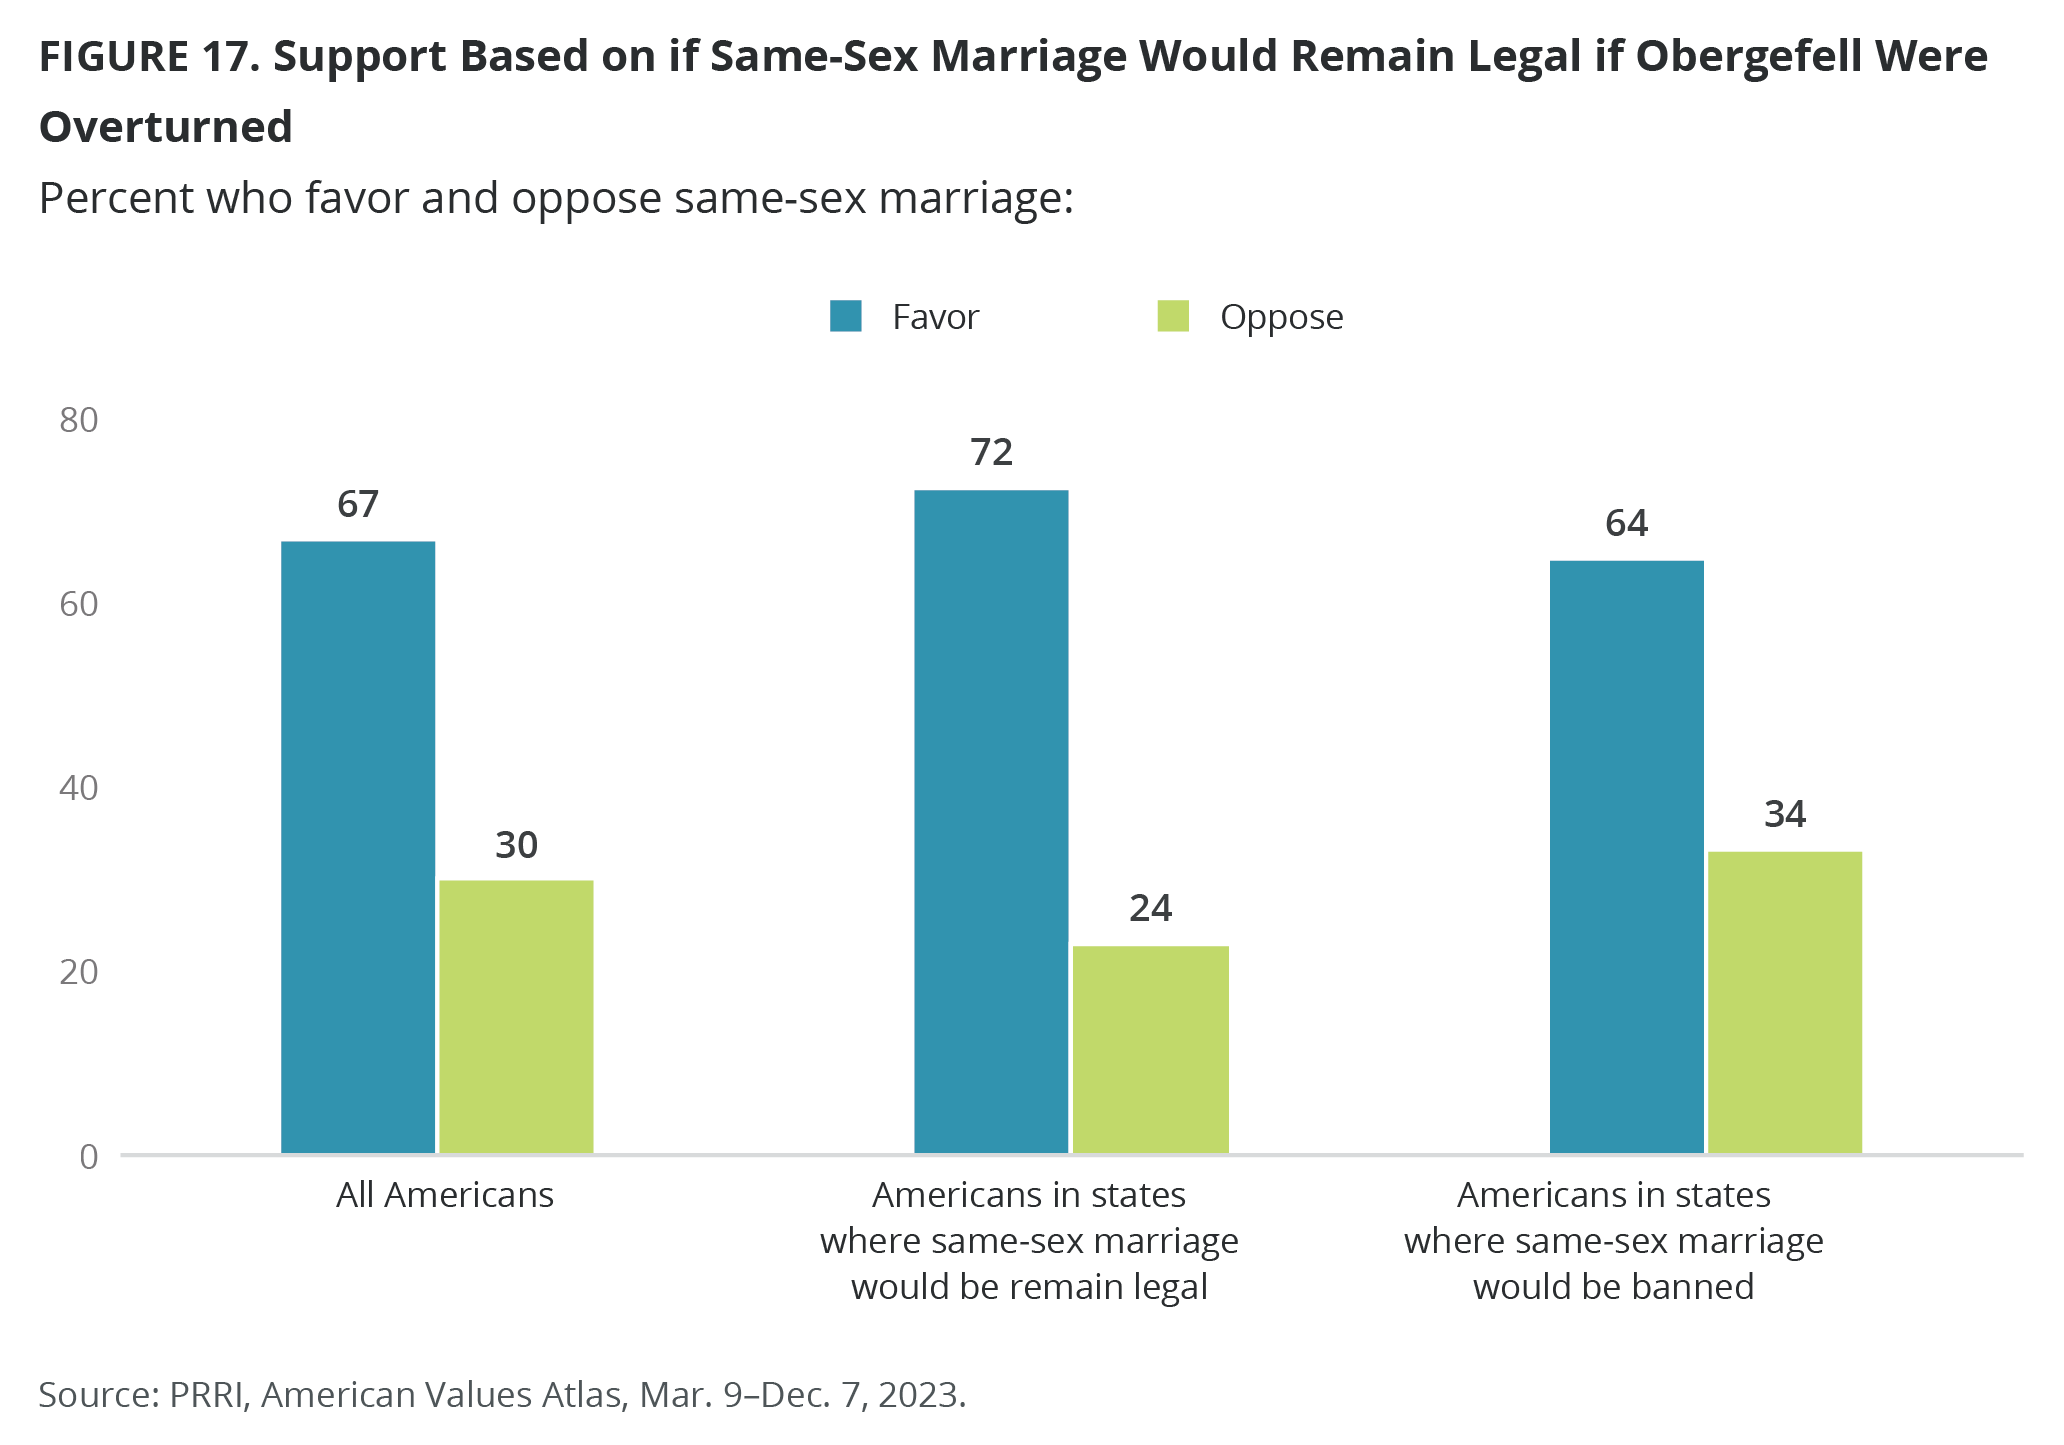
- While majorities across almost all states support same-sex marriage rights, there is wide variation across the country. In states where same-sex marriage would continue to be legal if the Supreme Court’s 2015 Obergefell decision were overturned, 72% of people favor allowing gay and lesbian couples to marry legally compared with 64% in states where same-sex marriage would no longer be legal if Obergefell were overturned.
Strong majorities of Americans — including most people of faith — support nondiscrimination protections for LGBTQ individuals, but overall support has declined.
- More than three-quarters of Americans supported policies that protect LGBTQ Americans from discrimination in housing, employment, and public accommodation (76%) in 2023, a decline from a high of 80% the previous year, in 2022.
- While support for nondiscrimination protections among Democrats stayed steady from 2022 to 2023, support dropped among Republicans by seven percentage points (from 66% to 59%).
- Many religious groups — though not all — registered small drops in support for nondiscrimination protections in the past year.
- Americans aged 18-29 show a gradual decrease in support for LGBTQ nondiscrimination laws over the last three years, declining from a peak of 83% in 2020 to 75% in 2023.
Opposition to religiously based service refusals dropped five percentage points in the past year, from 65% in 2022 to 60% in 2023.
- A majority (59%) of independents and more than eight in ten Democrats (82%) oppose allowing small business owners to refuse service to LGBTQ people based on their religious beliefs; opposition to such refusals has declined among Republicans, from 40% in 2015 to just 34% in 2023.
- A majority of members of most religious groups oppose religiously based service refusals; however, just 30% of white evangelical Protestants oppose religiously based service refusals, down from 37% in 2022.
Support for same-sex marriage has declined among Americans in the last year, dropping from 69% to 67%.
- Majorities of most religious traditions favor allowing same-sex couples to marry legally. Yet some religious groups show a decline in support from the last year, including Hispanic Catholics, whose support declined from 75% in 2022 to 68% in 2023.
- Fewer than half of Latter-day Saints, Hispanic Protestants, white evangelical Protestants, Muslims, and Jehovah’s Witnesses support same-sex marriage.
- Older Americans are less supportive of same-sex marriage than younger Americans. However, support among young Americans (18-29) has seen a gradual decline since 2018, when 79% of young Americans supported this right, to 71% today.
LGBTQ rights drive voting decisions of Democrats more than Republicans, younger Americans more than older Americans.
- A plurality of Americans (38%) say that LGBTQ rights is one of various factors they will consider, 30% say they would only vote for a candidate who shares their views on this issue, and 29% say they do not see LGBTQ rights as a major issue.
- A plurality of young Americans (38%) and members of Gen Z (38%) say they would only vote for a candidate who shares their views on LGBTQ rights.
- Democrats are the most likely to say they would only vote for a candidate who shares their views on this issue (38%), compared with Republicans (29%) and independents (25%).
Christian nationalism Rejecters are more likely to support LGBTQ rights than Skeptics, Sympathizers, or Adherents.
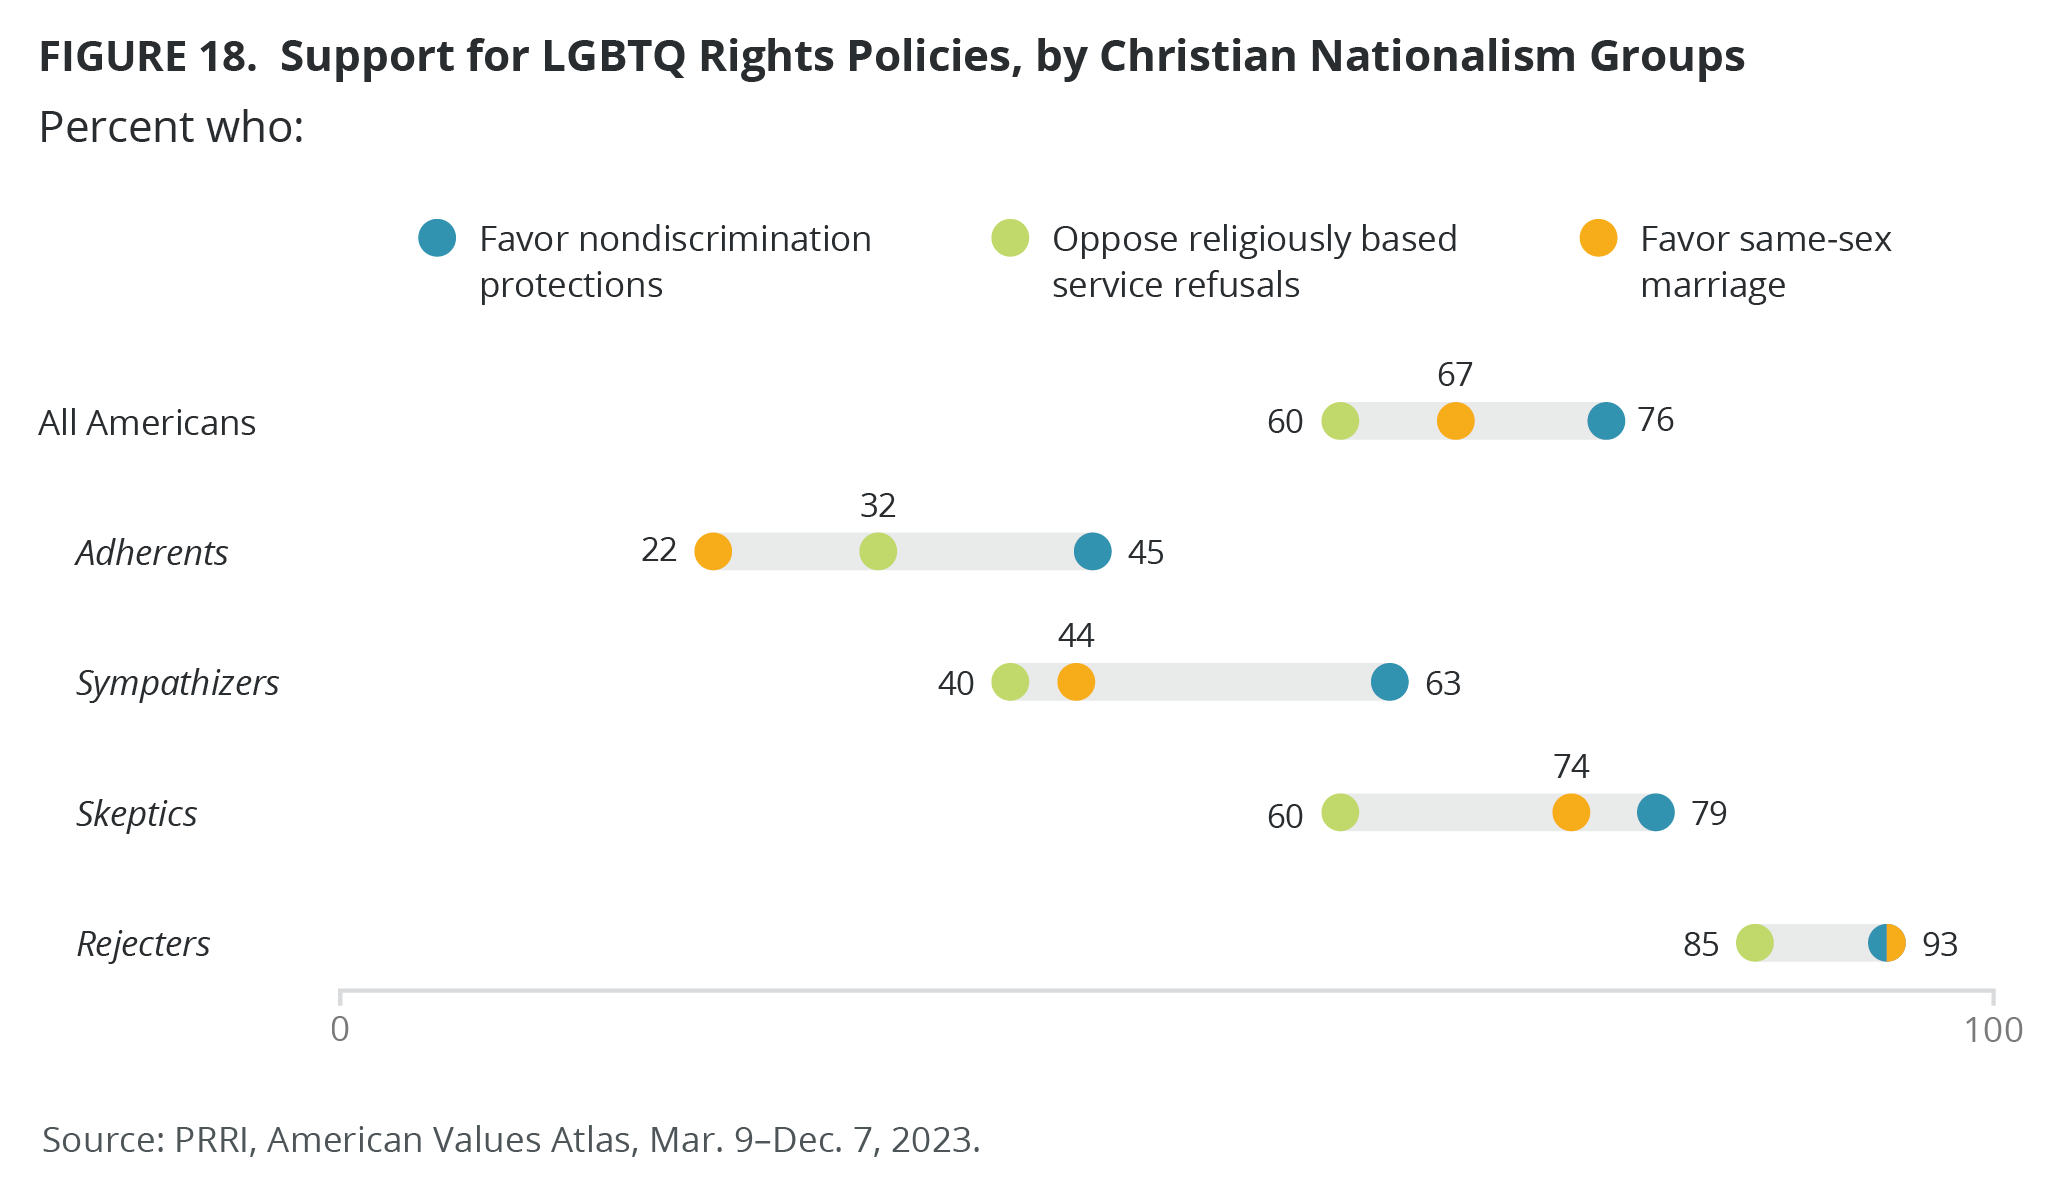
- Christian nationalism Rejecters are nearly unanimous (93%) in their support for laws that protect LGBTQ people from discrimination in housing, employment, and accommodation, including more than seven in ten (72%) who strongly favor nondiscrimination laws. Only among Christian nationalism Adherents does a majority (52%) oppose nondiscrimination laws.
- Just 32% of Christian nationalism Adherents oppose allowing religiously based refusals compared with 85% of Christian nationalism Rejecters.
- Just 22% of Christian nationalism Adherents support same-sex marriage, compared with 93% of Christian nationalism Rejecters.
- Across all 50 states, scatter plots show a clear pattern: support for Christian nationalism is negatively correlated with support for the three policies discussed in this report.
Profile of LGBTQ Americans
In 2023, roughly one in ten Americans (10%) identified as part of the LGBTQ community; this includes 3% who identify as gay or lesbian, 4% who identify as bisexual, and 2% who identify as “something else.” Among the LGBTQ population, a plurality identifies as bisexual (45%), 34% identify as gay or lesbian, and 21% identify as “something else.” In addition, 2% of the LGBTQ population are transgender or nonbinary.[1]
The characteristics of LGBTQ Americans show a very young and diverse population. LGBTQ Americans are overrepresented among the youngest generations, Democrats, and liberals, while reflecting the geographic and racial diversity of the general population.
Age and Generation
A plurality of LGBTQ Americans (44%) are between the ages of 18 and 29. Youth representation in the LGBTQ community is more than twice what it is in the general U.S. adult population (44% vs. 19%). Along with one-third of LGBTQ Americans between the ages of 30 and 49 (34%), nearly three-quarters of LGBTQ Americans (78%) are under the age of 50. By contrast, a slim majority of American adults are younger than 50 (51%). Fifteen percent of LGBTQ Americans are between the ages of 50 and 64. Fewer than one in ten are 65 years or older (7%), roughly one-third of the national rate (22%).
More than one in five Americans 18-29 years (22%) identify as LGBTQ. One in ten people ages 30-49 (10%), 6% of people between 50 and 64, and 3% of seniors (65 years or older) identify as LGBTQ.
A plurality of LGBTQ Americans (44%) are millennials. In comparison, nearly three in ten LGBTQ Americans (27%) are members of Generation Z.[2] Overall, more than seven in ten LGBTQ Americans belong to the two youngest generational cohorts. The percentage of Gen Z adults within the LGBTQ adult population (27%) is more than twice the share of Gen Z among the general adult population (11%). Millennials (44%) are also overrepresented among the adult LGBTQ population compared with their share in the general adult population (30%). Members of Generation X (16%), baby boomers (12%), and the Silent Generation (1%) are underrepresented among LGBTQ populations compared with their share in the general population (26%, 28%, and 5%, respectively).
Looking at the share of Americans by generation who identify as LGBTQ, nearly one-quarter of Gen Z adults (24%) identify as LGBTQ, as do 15% of millennials. Fewer than one in ten Gen Xers (6%), baby boomers (4%), and members of the Silent Generation (2%) identify as LGBTQ.
Race and Education
LGBTQ Americans’ racial composition is similar to the U.S. adult general population. A majority of LGBTQ Americans identify as white (59%), one in five are Hispanic (20%), 11% are Black, 5% of LGBTQ Americans are Asian American or Pacific Islanders (AAPI), 3% are multiracial, and 2% have another racial identity. Twelve percent of Hispanic Americans identify as LGBTQ, as do 9% of Black and white Americans and 8% of the AAPI population.
LGBTQ Americans (33%) are as likely as the general population (35%) to be college graduates. LGBTQ Americans account for similar shares of college graduates (9%) and of people without college degrees (10%). Nine percent of white people with college degrees and without college degrees are LGBTQ.
Geography
Similarly, the geographic distribution of the LGBTQ population echoes the general population. More than one-third of LGBTQ Americans (35%) live in the South, about one-quarter live in the West (27%), and about one in five each live in the Northeast (20%) and Midwest (19%). Meanwhile, similar proportions of the population in all of the country’s regions identify as LGBTQ: 9% of Midwesterners, 9% of Southerners, 11% of Northeasterners, and 12% of Westerners.
New Mexico (16%), the District of Columbia (15%), Nebraska (14%), Nevada (14%), and Oregon (14%) have the highest proportion of LGBTQ residents. The three states in the Northeast with the highest share of LGBTQ residents are Vermont (13%), Massachusetts (13%), and New York (12%).
The five states with the lowest proportion of LGBTQ residents are Alabama (4%), South Carolina (4%), Louisiana (5%), Iowa (5%), and Hawaii (6%).
Compared with 2016, the size of the LGBTQ population has more than doubled from 4% to 10%. In 2016, the state with the highest proportion of LGBTQ residents was Nevada (7%). With the exception of six states, most states matched or surpassed this percentage in 2023.
In addition, when we sort states into safe Republican states, safe Democratic states, and the seven states considered to be battlegrounds in the 2024 presidential election and compare them with 2016, LGBTQ Americans living in these states have doubled (roughly from 4% to 10%), and this is especially evident among young Americans.[3] While LGBTQ identification among those under 30 who live in blue states (from 10% in 2016 to 25% in 2023) and battleground states (from 9% in 2016 to 23% in 2023) went up by about 15 percentage points, it also went up by 11 percentage points among those who live in red states (from 9% to 20%). Further, although at a lower rate, LGBTQ identification increased among those over 30, too.
Party and Ideology
A plurality of LGBTQ Americans identify as Democrats (46%), about three in ten are independents (30%), and fewer than one in ten are Republicans (8%). A substantial group (16%) identify with other parties or don’t know their preferred political identity. Fourteen percent of Democrats and 10% of independents identify as LGBTQ. Only 3% of Republicans identify as LGBTQ.
When it comes to political ideology, nearly six in ten LGBTQ Americans (58%) consider themselves liberal, and more than one-quarter are moderate (27%). Thirteen percent say they are conservative. Among self-professed liberals, nearly one in five identify as LGBTQ (19%). Less than one in ten independents (8%) and conservatives (4%) identify as LGBTQ.
Religious Tradition
The majority of LGBTQ Americans identify as religiously unaffiliated (52%), nearly twice the rate of the general U.S. population (27%). More than one-third identify with various Christian faiths (35%), including white mainline/non-evangelical Protestant (8%), white Catholic (6%), Black Protestant (5%), white evangelical Protestant (5%), and Hispanic Catholic (5%). A similar number belong to other non-Christian religions (5%).
The religious traditions with the largest share of LGBTQ people in their midst include Unitarian Universalists (29%), members of other non-Christian religions (28%), and the religiously unaffiliated (19%). Other traditions with shares of LGBTQ adherents similar to the share of LGBTQ representation in the general population include Jewish Americans (13%), Buddhists (14%), Muslims (12%), Hispanic Protestants (10%), and Hindus (8%). The religious traditions with the lowest proportion of LGBTQ adherents are white evangelical Protestants (4%), Jehovah’s Witnesses (4%), and Latter-day Saints (3%).
Attitudes toward LGBTQ policies
As part of the American Values Atlas, PRRI has been asking questions to gauge Americans’ support for or opposition to three critical policies related to LGBTQ rights: (1) nondiscrimination laws, (2) service refusals, and (3) same-sex marriage. The nondiscrimination laws are worded as, “Laws that would protect gay, lesbian, bisexual, and transgender people against discrimination in jobs, public accommodations, and housing.” Service refusal policies are worded as, “Allowing a small business owner in your state to refuse to provide products or services to gay or lesbian people if doing so would violate their religious beliefs.” With respect to same-sex marriage, we asked Americans whether they were in favor of “allowing same-sex couples to marry legally.” [4]
Support for Nondiscrimination Protections 2015-2023
Party Affiliation
Asked about their support for or opposition to policies that protect LGBTQ Americans from discrimination in housing, employment, and public accommodation, more than three-quarters of U.S. adults (76%) favor the enactment of such policies. This represents a five-percentage-point increase compared with when the question was first asked in 2015, although support for such nondiscrimination protections dropped from a high of 80% of Americans in 2022.
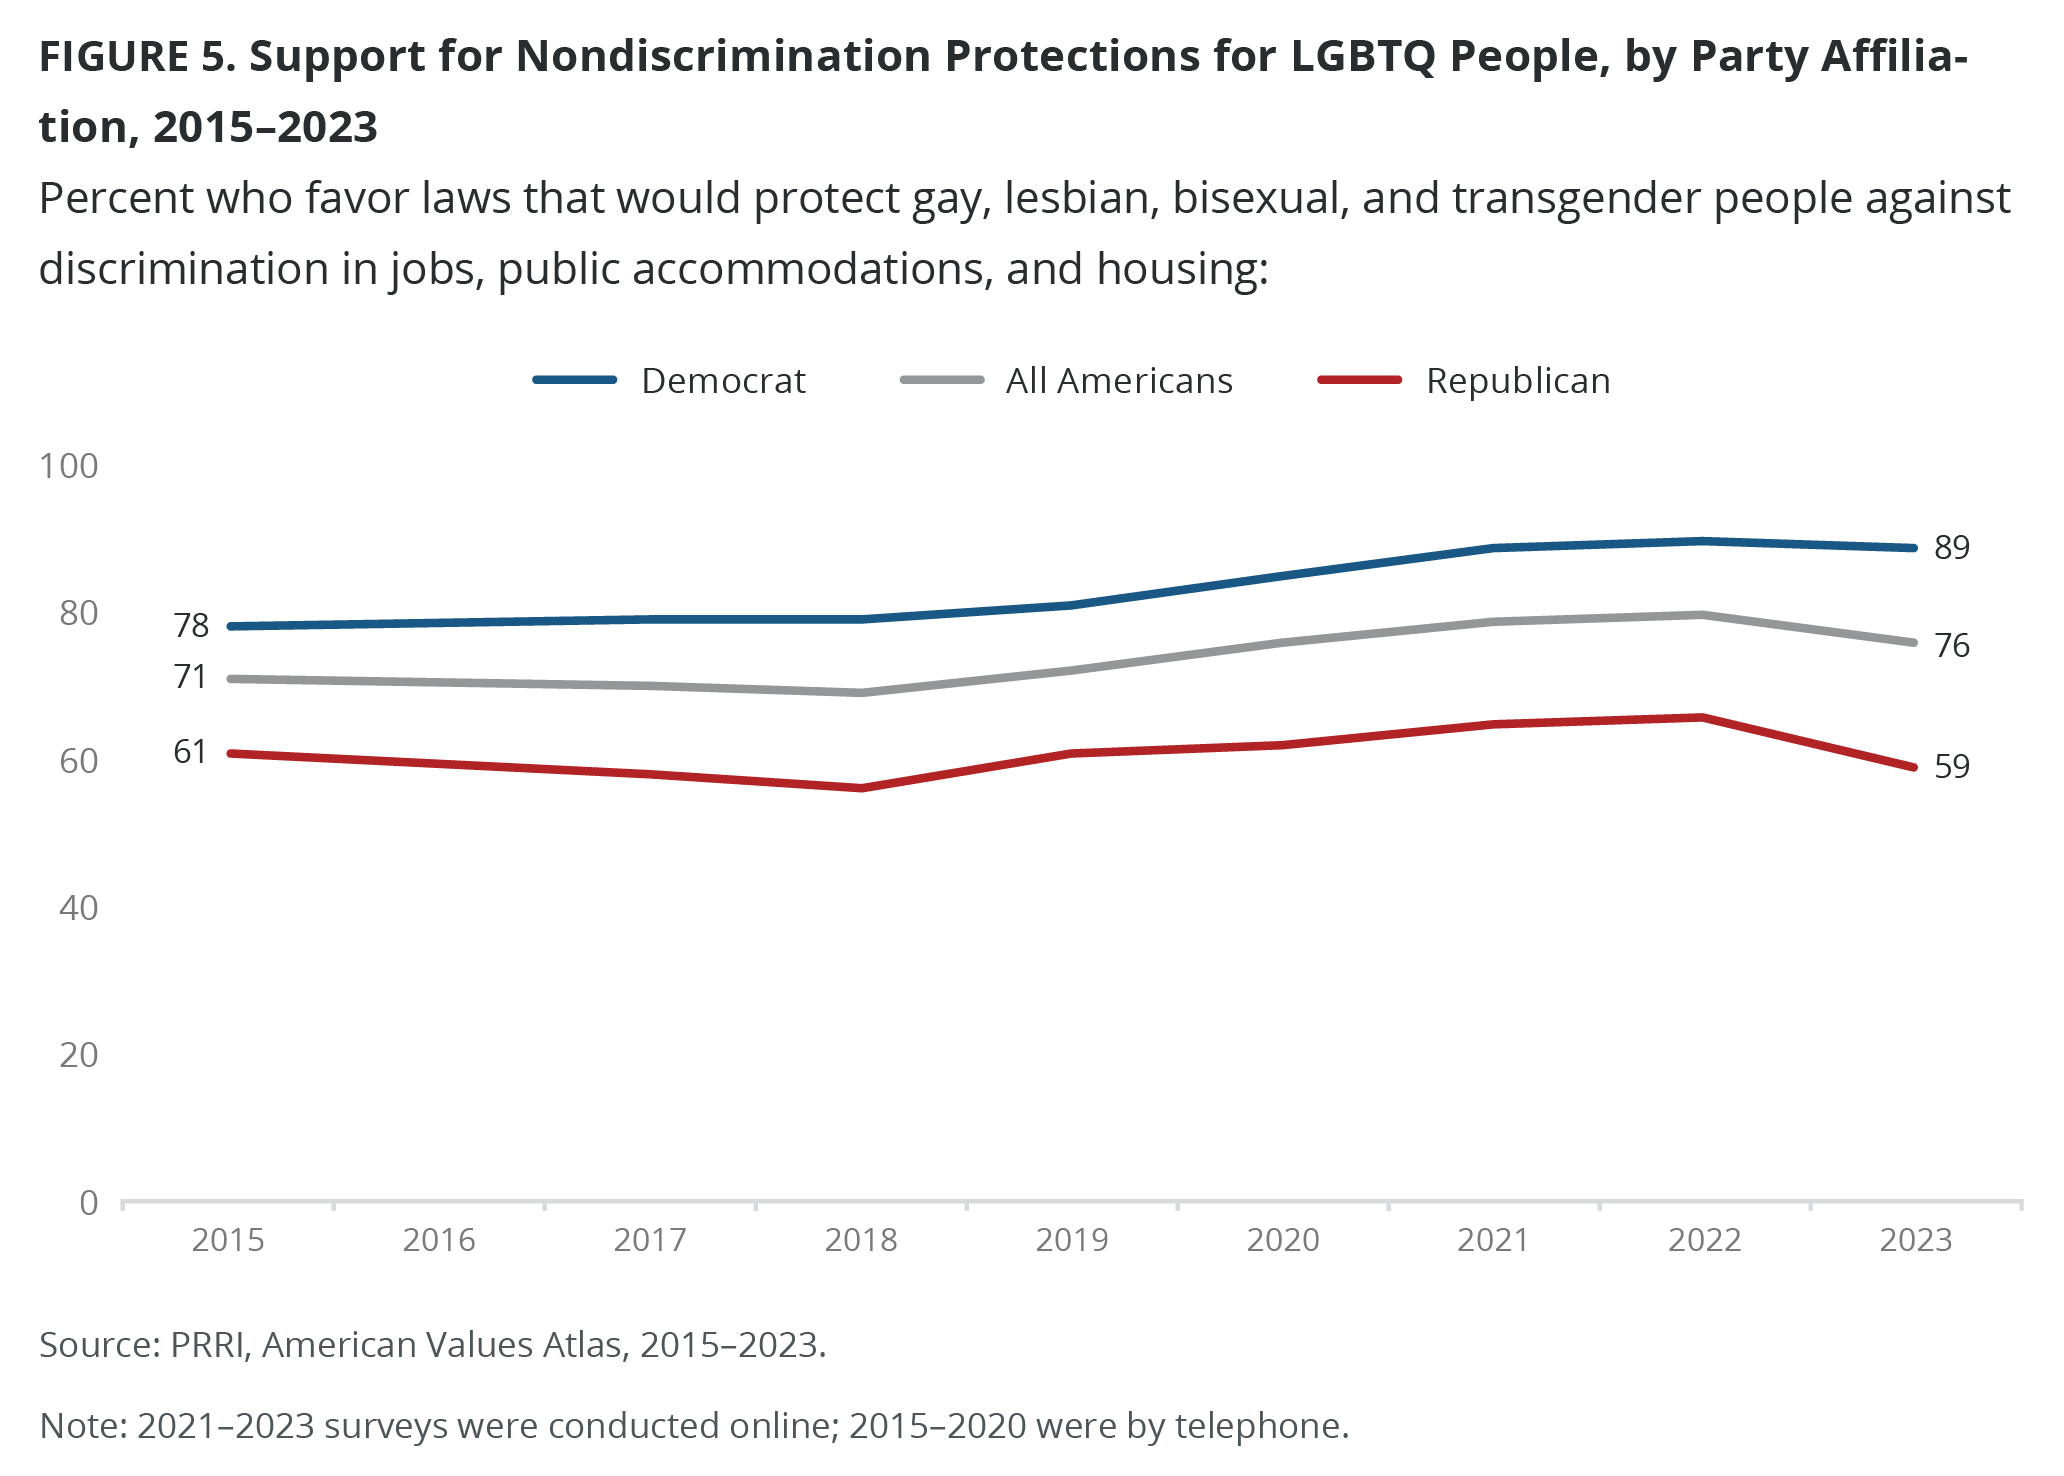
Majorities of Americans, regardless of political affiliation, support laws protecting LGBTQ Americans from discrimination. This includes nearly nine in ten Democrats (89%), about eight in ten independents (78%), and almost six in ten Republicans (59%). Compared with 2015, support for LGBTQ nondiscrimination laws has increased by 11 percentage points among Democrats (89% v. 78%) and by five percentage points among independents (78% v. 73%). Republican support is slightly lower in 2023 compared with 2015 (61%). Yet, support has dropped among both Republicans and independents from 2022. In 2022, two in three Republicans supported laws protecting LGBTQ Americans, compared with roughly six in ten today. Support for nondiscrimination protections among independents also dropped four percentage points, from 82% in 2022 to 78% in 2023.
Religious Affiliation
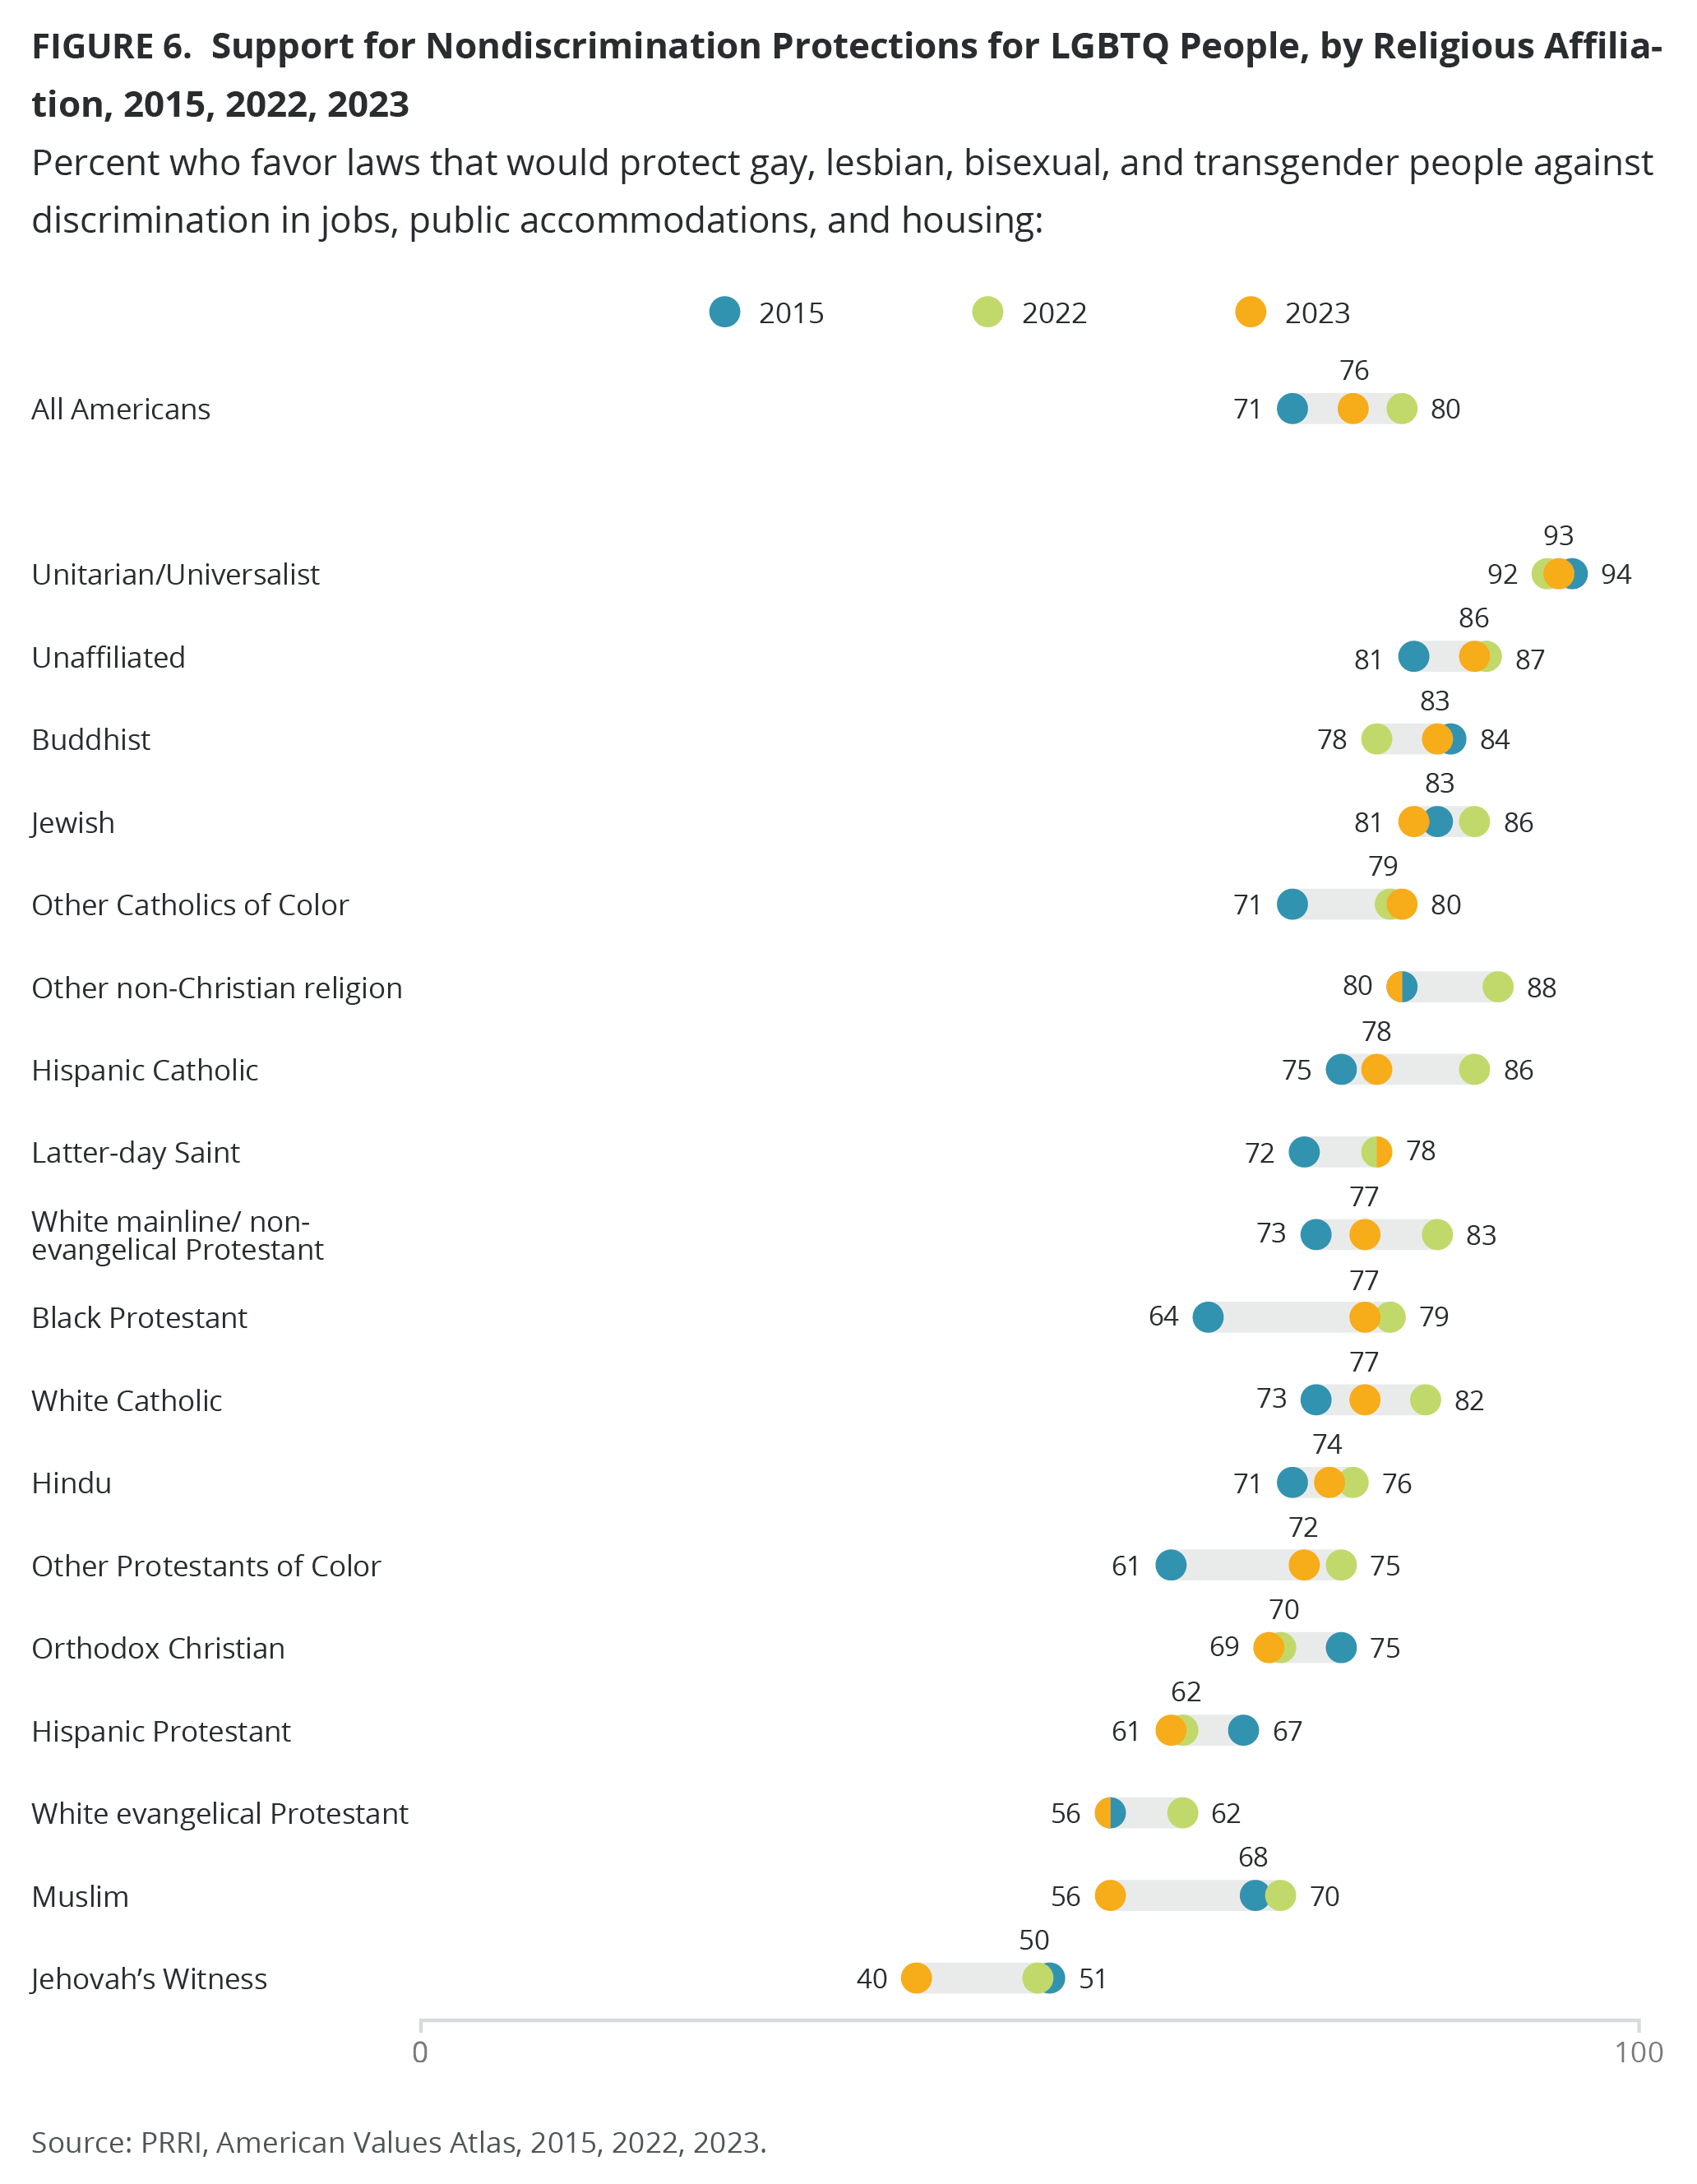
The majority of most religious groups support nondiscrimination protections, the only exception being Jehovah’s Witnesses (40% in favor). The strongest supporters of nondiscrimination protections include Unitarian Universalists (93%), religiously unaffiliated Americans (86%), Buddhists (83%), and Jewish Americans (81%).
Aside from Jehovah’s Witnesses, the lowest levels of support for nondiscrimination protections are from white evangelical Protestants and Muslims (56%) and Hispanic Protestants (61%). Compared with 2015, when PRRI started asking this question, Black Protestants have shown the largest increase in support. In 2015, nearly two-thirds of Black Protestants favored laws protecting LGBTQ Americans from discrimination (64%), compared with more than three-quarters in 2023 (77%), a 13-percentage-point increase. Jehovah’s Witnesses (-10 points), and Hispanic Catholics (-8 points) show the most dramatic declines in support for nondiscrimination laws between 2022 and 2023.
Demographics
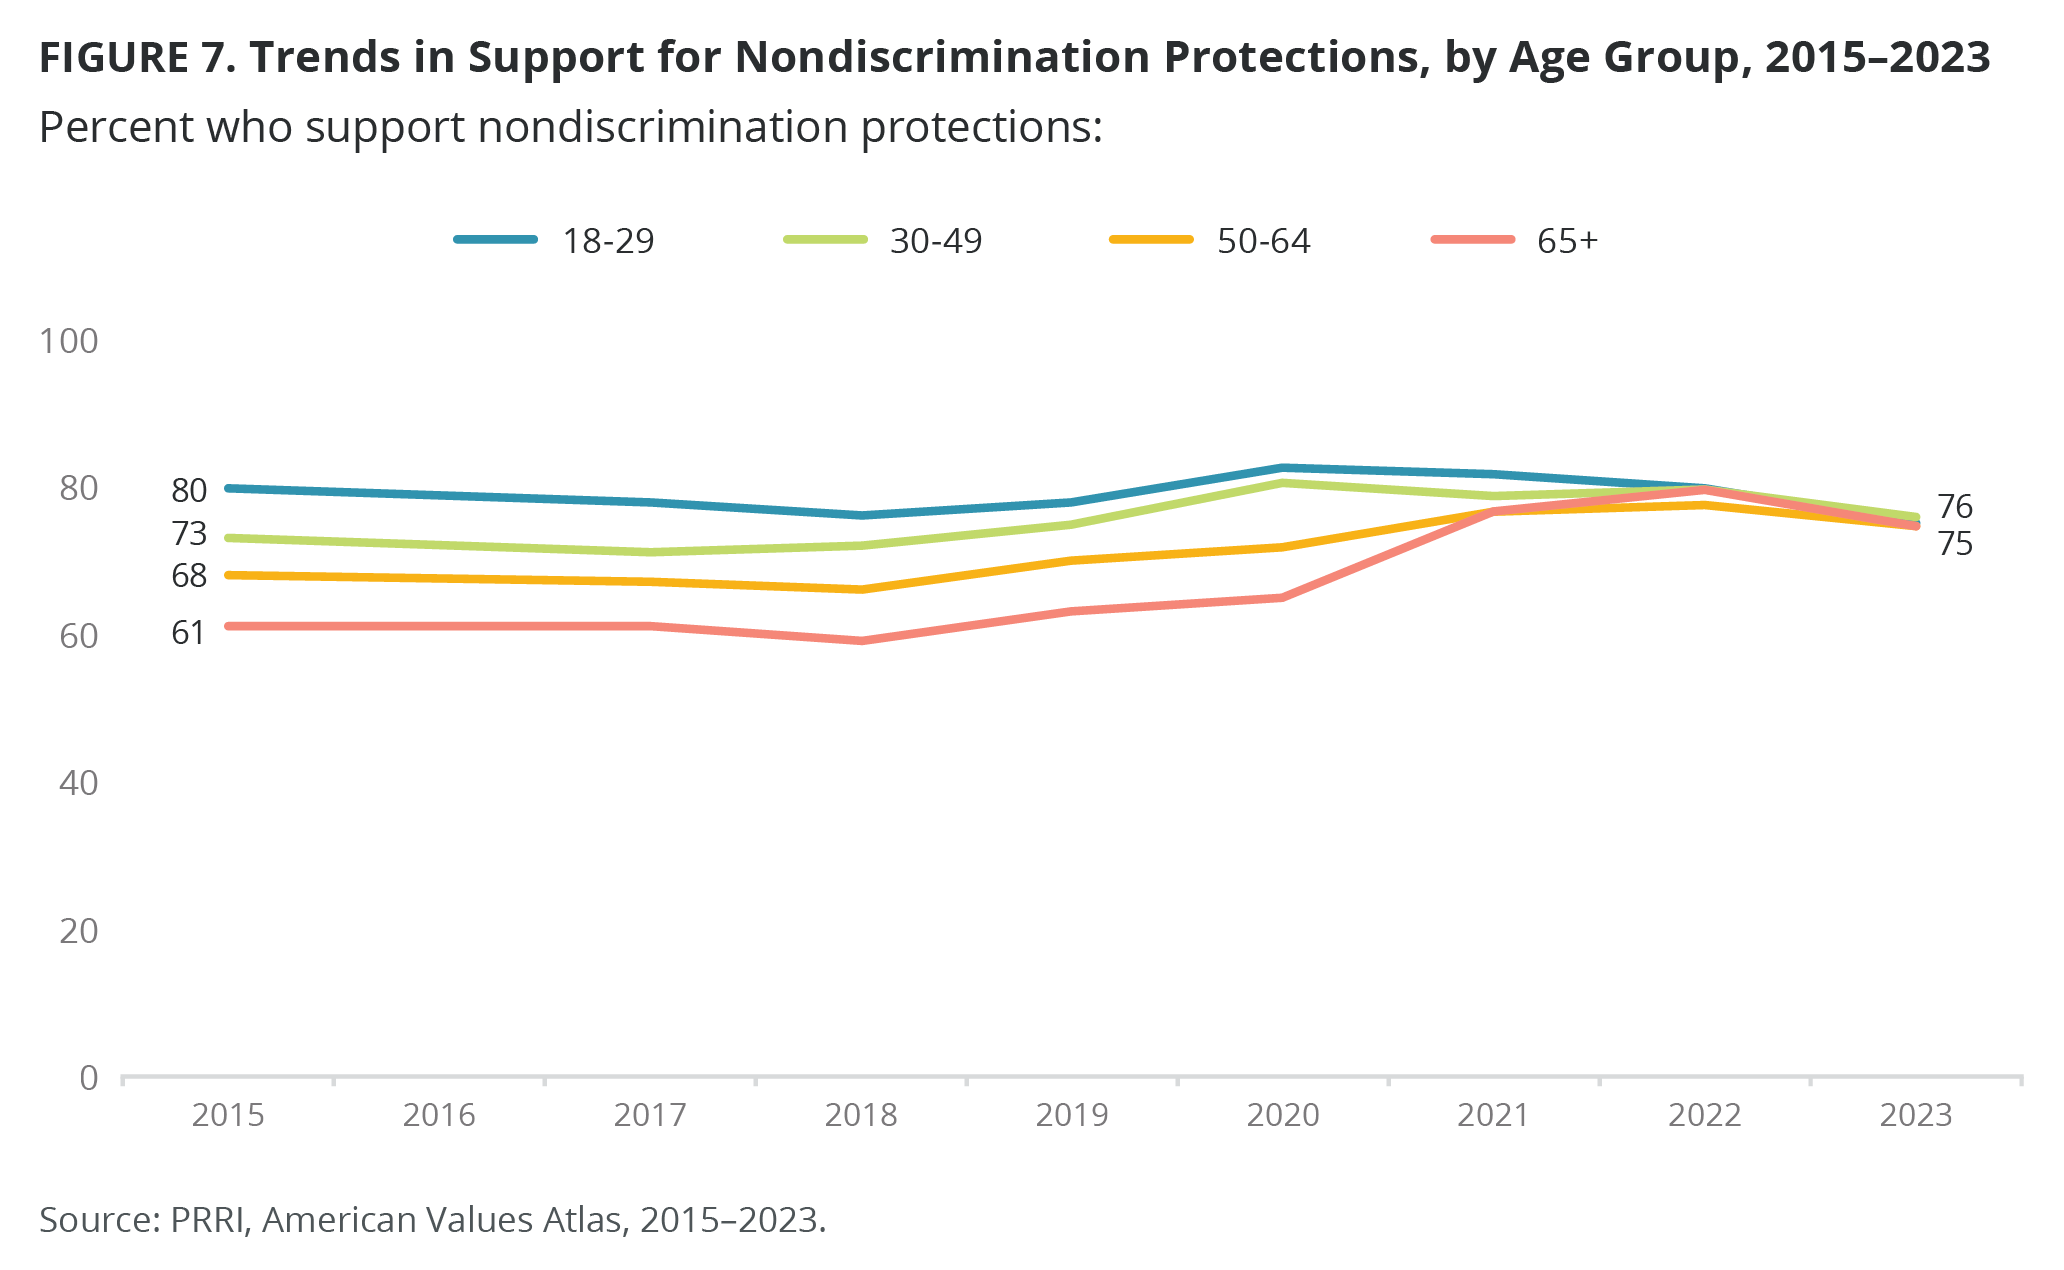
Americans in all age groups favor nondiscrimination laws, including around three-quarters of Americans under 30 (75%), Americans between 30 and 49 (76%), Americans between 50 and 64 (75%), and seniors over the age of 65 (75%). Americans 18 to 29, however, have experienced a gradual decline in support for LGBTQ nondiscrimination laws over the last three years. Support among this age group peaked in 2020 when 83% expressed support for LGBTQ nondiscrimination laws. In 2022, support declined to 80%, then dropped an additional five percentage points between 2022 and 2023. Support among other age cohorts has also declined in recent years from their peak levels, but those peak levels of support were not as high as the 18-29 cohort.
About three-quarters of white (75%), Black (74%), and Hispanic (75%) Americans, and 82% of Asian American and Pacific Islanders favor laws protecting LGBTQ people from discrimination. Nearly eight in ten women (78%), more than seven in ten men (72%), and nine in ten LGBTQ Americans (90%) support nondiscrimination laws.
In states where nondiscrimination laws are in place, nearly eight in ten residents favor such laws (79%).[5] More than seven in ten residents of states without LGBTQ nondiscrimination laws are also in favor (72%).
More than eight in ten residents of Hawaii (88%), the District of Columbia (87%), Connecticut (86%), Utah (86%), and Nevada (85%) favor laws protecting LGBTQ Americans from discrimination. The five states with the lowest levels of support for nondiscrimination laws are Arkansas (60%), Alabama (61%), Oklahoma (61%), Wyoming (61%), and South Carolina (65%). There are also six states where support for nondiscrimination laws declined by nine percentage points or more between 2022 and 2023: Rhode Island (-15), Arkansas (-14), Louisiana (-14), New Hampshire (-14), Iowa (-11), and West Virginia (-9).
Dividing the national map into battleground, blue, and red states shows minor differences in support for nondiscrimination laws. More than seven in ten residents of red (71%), battleground (75%), and blue (79%) states favor laws that would protect gay, lesbian, bisexual, and transgender people against discrimination in jobs, public accommodations, and housing. However, residents of blue states are far more likely to strongly favor LGBTQ nondiscrimination laws compared with their red state counterparts (43% vs. 34%).
Opposition to Religiously Based Refusals 2015-2023
Party Affiliation
Since the American Values Atlas started measuring this policy, the American public has consistently opposed “allowing a small business owner in your state to refuse to provide products or services to gay or lesbian people if doing so would violate their religious beliefs.” In 2015, 59% opposed the idea; 60% opposed it in 2023.
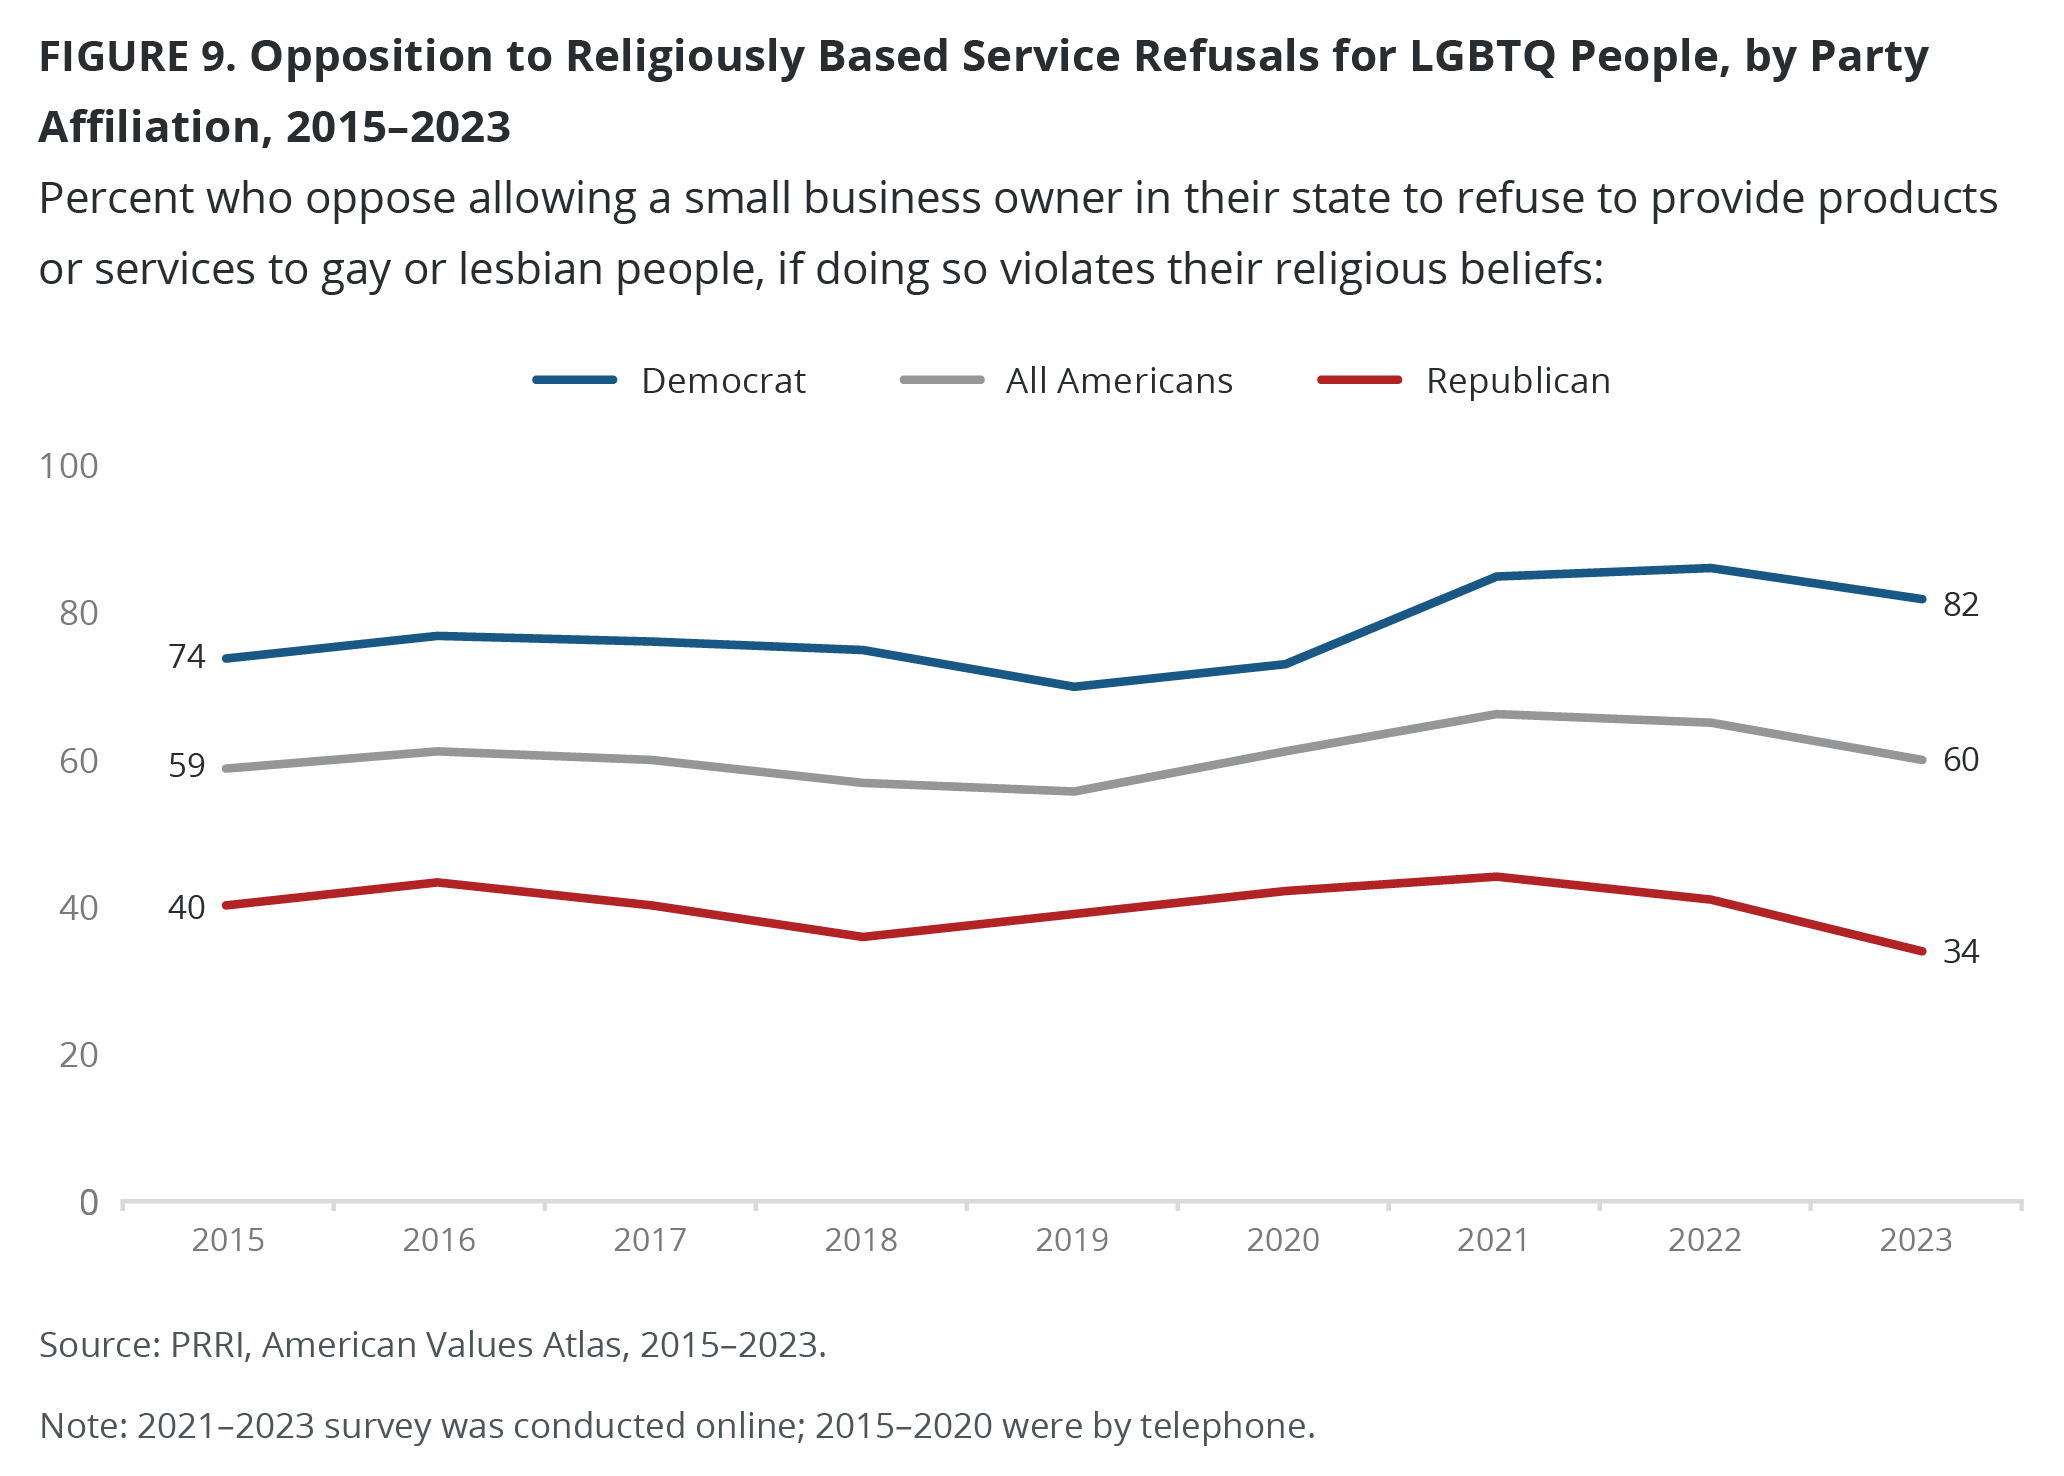
A majority of independents (59%) and more than eight in ten Democrats (82%) oppose allowing small business owners to refuse service to LGBTQ people based on their religious beliefs. By contrast, nearly two-thirds of Republicans (64%) favor this policy, and only about one-third oppose it (34%). Opposition among independents grew from 59% to a high of 66% in 2021 but dropped again to 59% in 2023. Opposition among Democrats also increased from 74% in 2015. However, there has been a four-percentage-point decrease since 2022, from 86%. Meanwhile, fewer Republicans oppose allowing small business owners to refuse service to LGBTQ people if it violates their religious beliefs. In 2015, 40% were opposed, but just 34% oppose religiously based service refusals in 2023.
Religious Affiliation
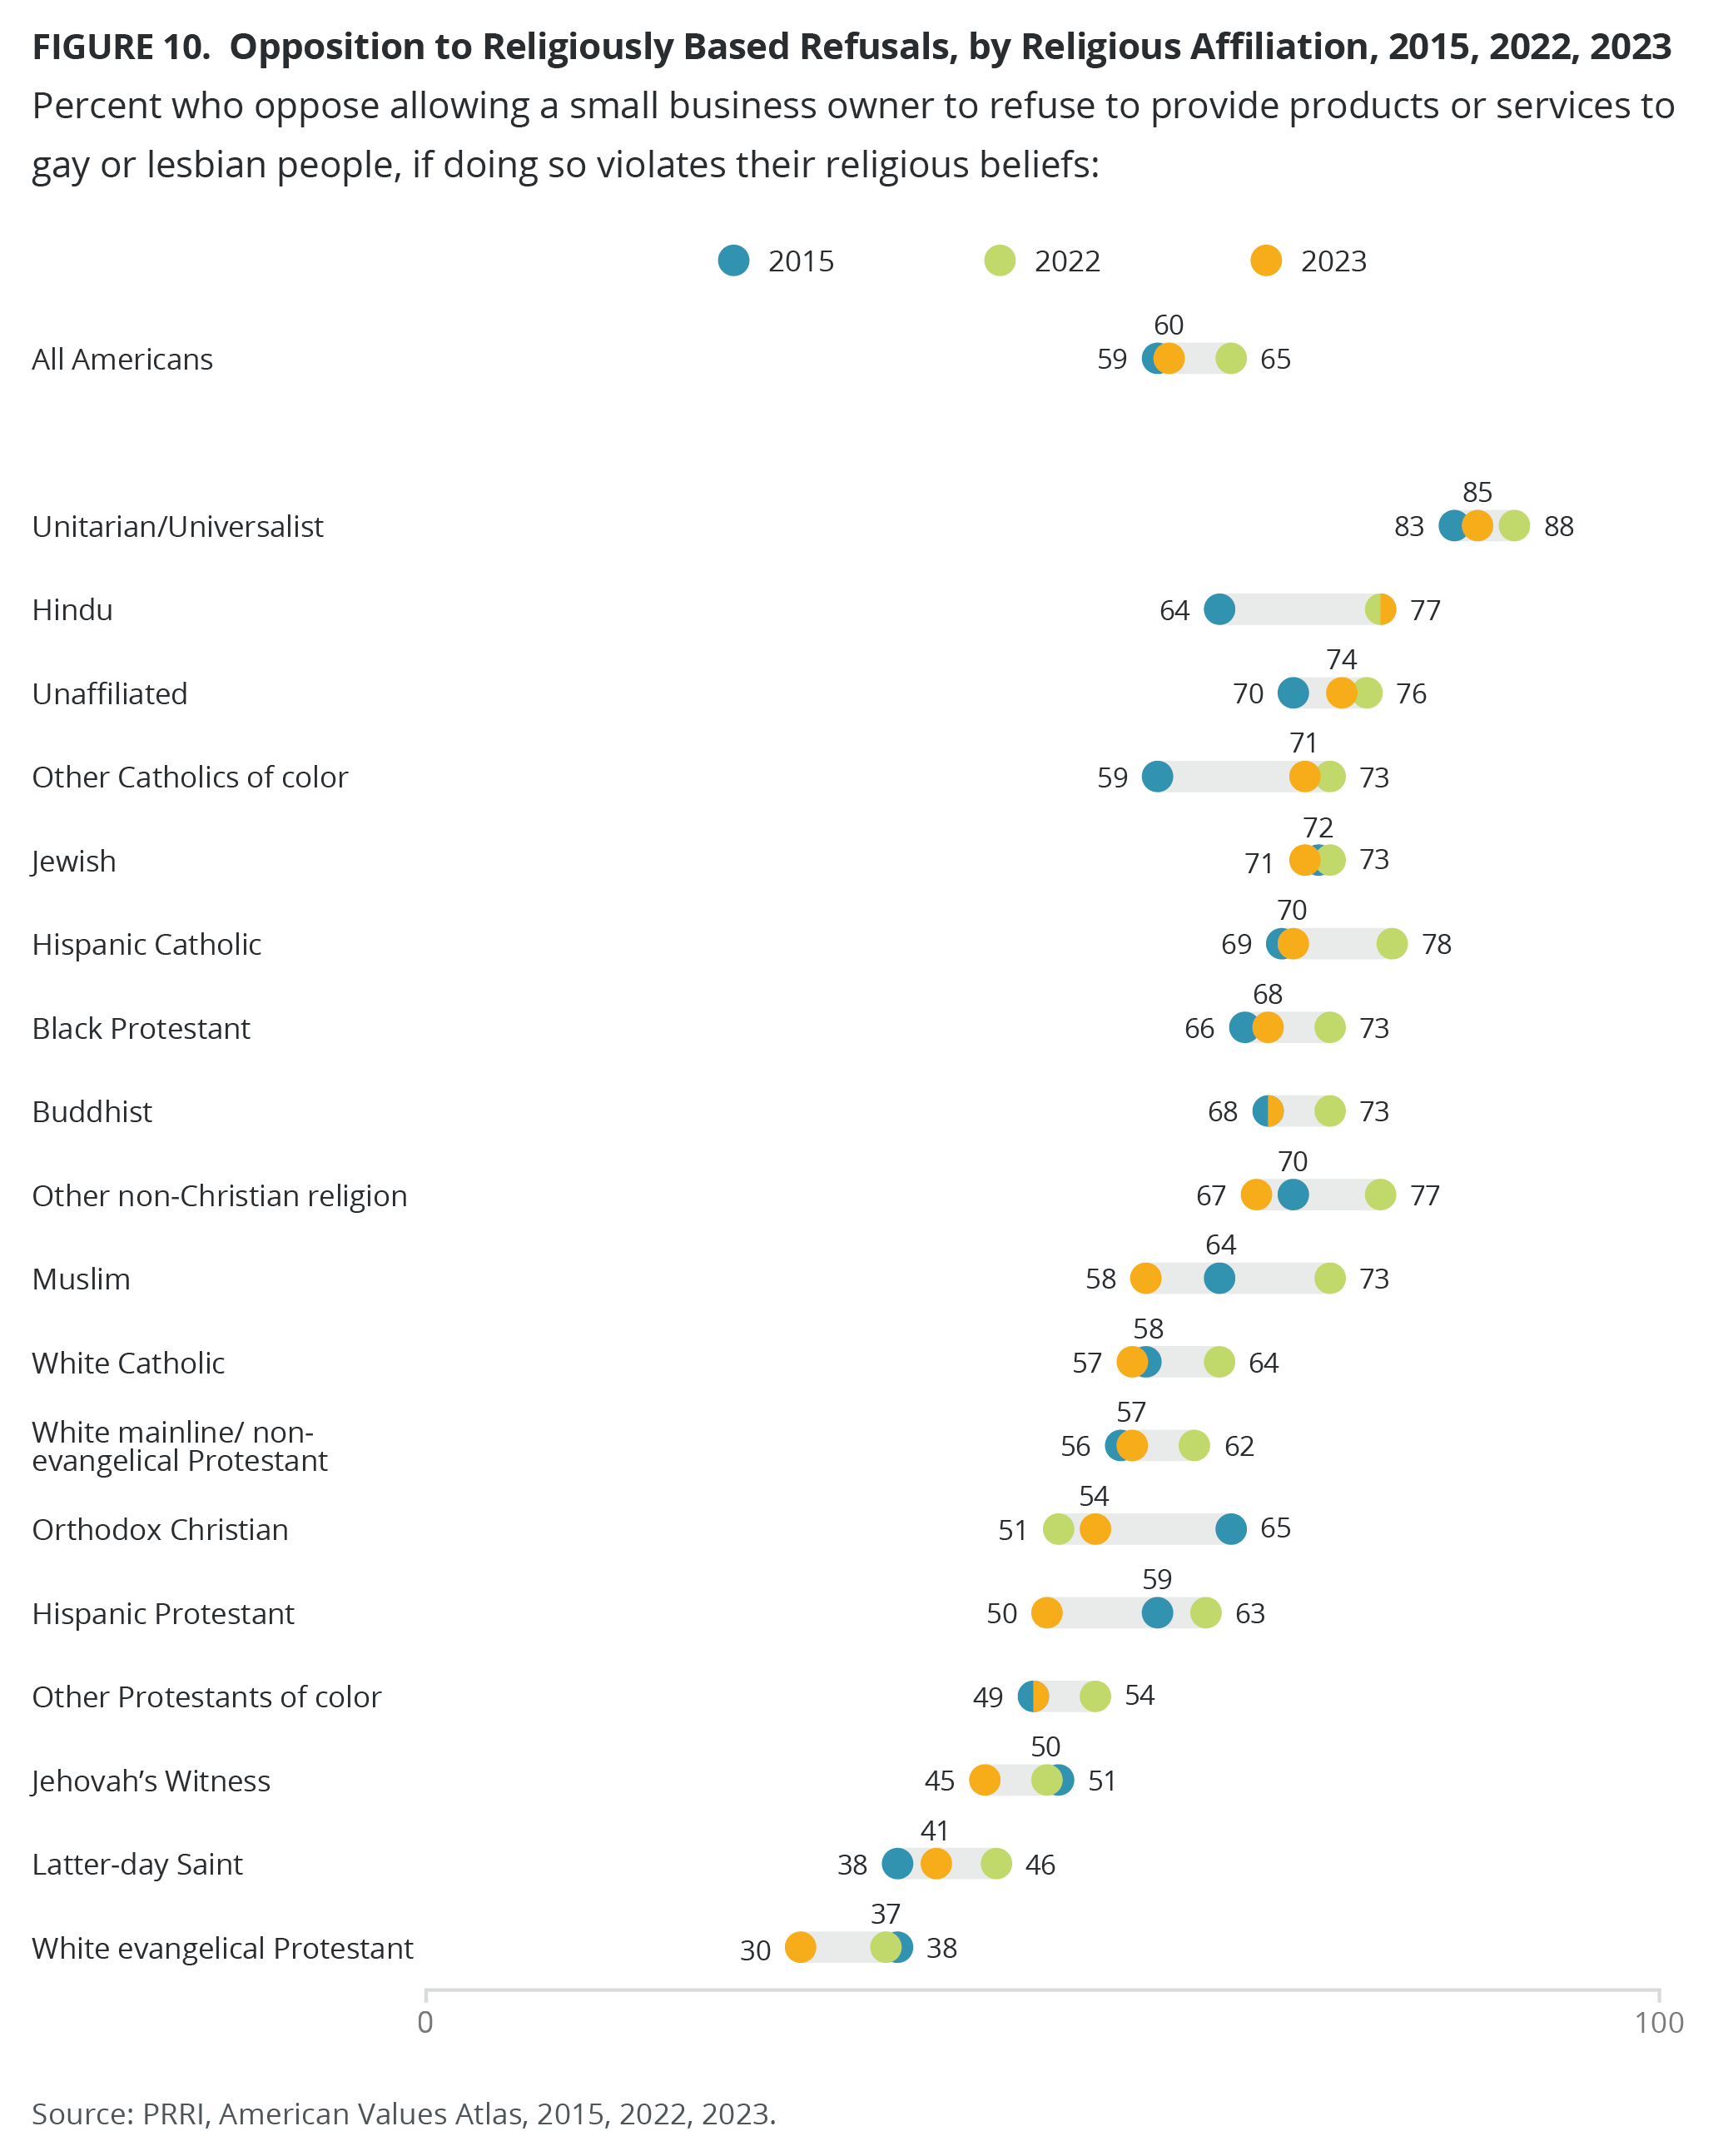
A majority of members of most religious groups oppose religiously based service refusals, with some exceptions. Among the most vigorous opponents of laws allowing small business owners to refuse service to LGBTQ people are Unitarian Universalists (85%), Hindus (77%), the religiously unaffiliated (74%), Jewish Americans (71%), other non-white Catholics (71%), Hispanic Catholics (70%), Black Protestants (68%), Buddhists (68%) and members of other non-Christian religions (67%). [6] Opposition to religiously based refusals among Hispanic Catholics went down by eight percentage points since 2022, from 78% to 70% in 2023, reaching similar 2015 levels (69%).
A slim majority of Muslims (58%), white Catholics (57%), white mainline/non-evangelical Protestants (57%), Orthodox Christians (54%), and half of Hispanic Protestants and other protestants of color (49%) also oppose religiously based refusals. Opposition to religiously based refusals among Hispanic Protestants went down from 63% in 2022 to 50% in 2023, even lower than 2015 levels (59%). Among white Catholics and white mainline/non-evangelical Protestants, opposition also went down from 2022 (64% and 62%, respectively), reaching 2015 levels as well (58% and 56%, respectively).
Among adherents of three religious traditions, white evangelical Protestants (30%), Latter-day Saints (41%), and Jehovah’s Witnesses (45%), a minority opposes while the majority stands in support. Among white evangelical Protestants, opposition has consistently declined from 38% in 2015 and 37% in 2022 to 30% in 2023.
Demographics
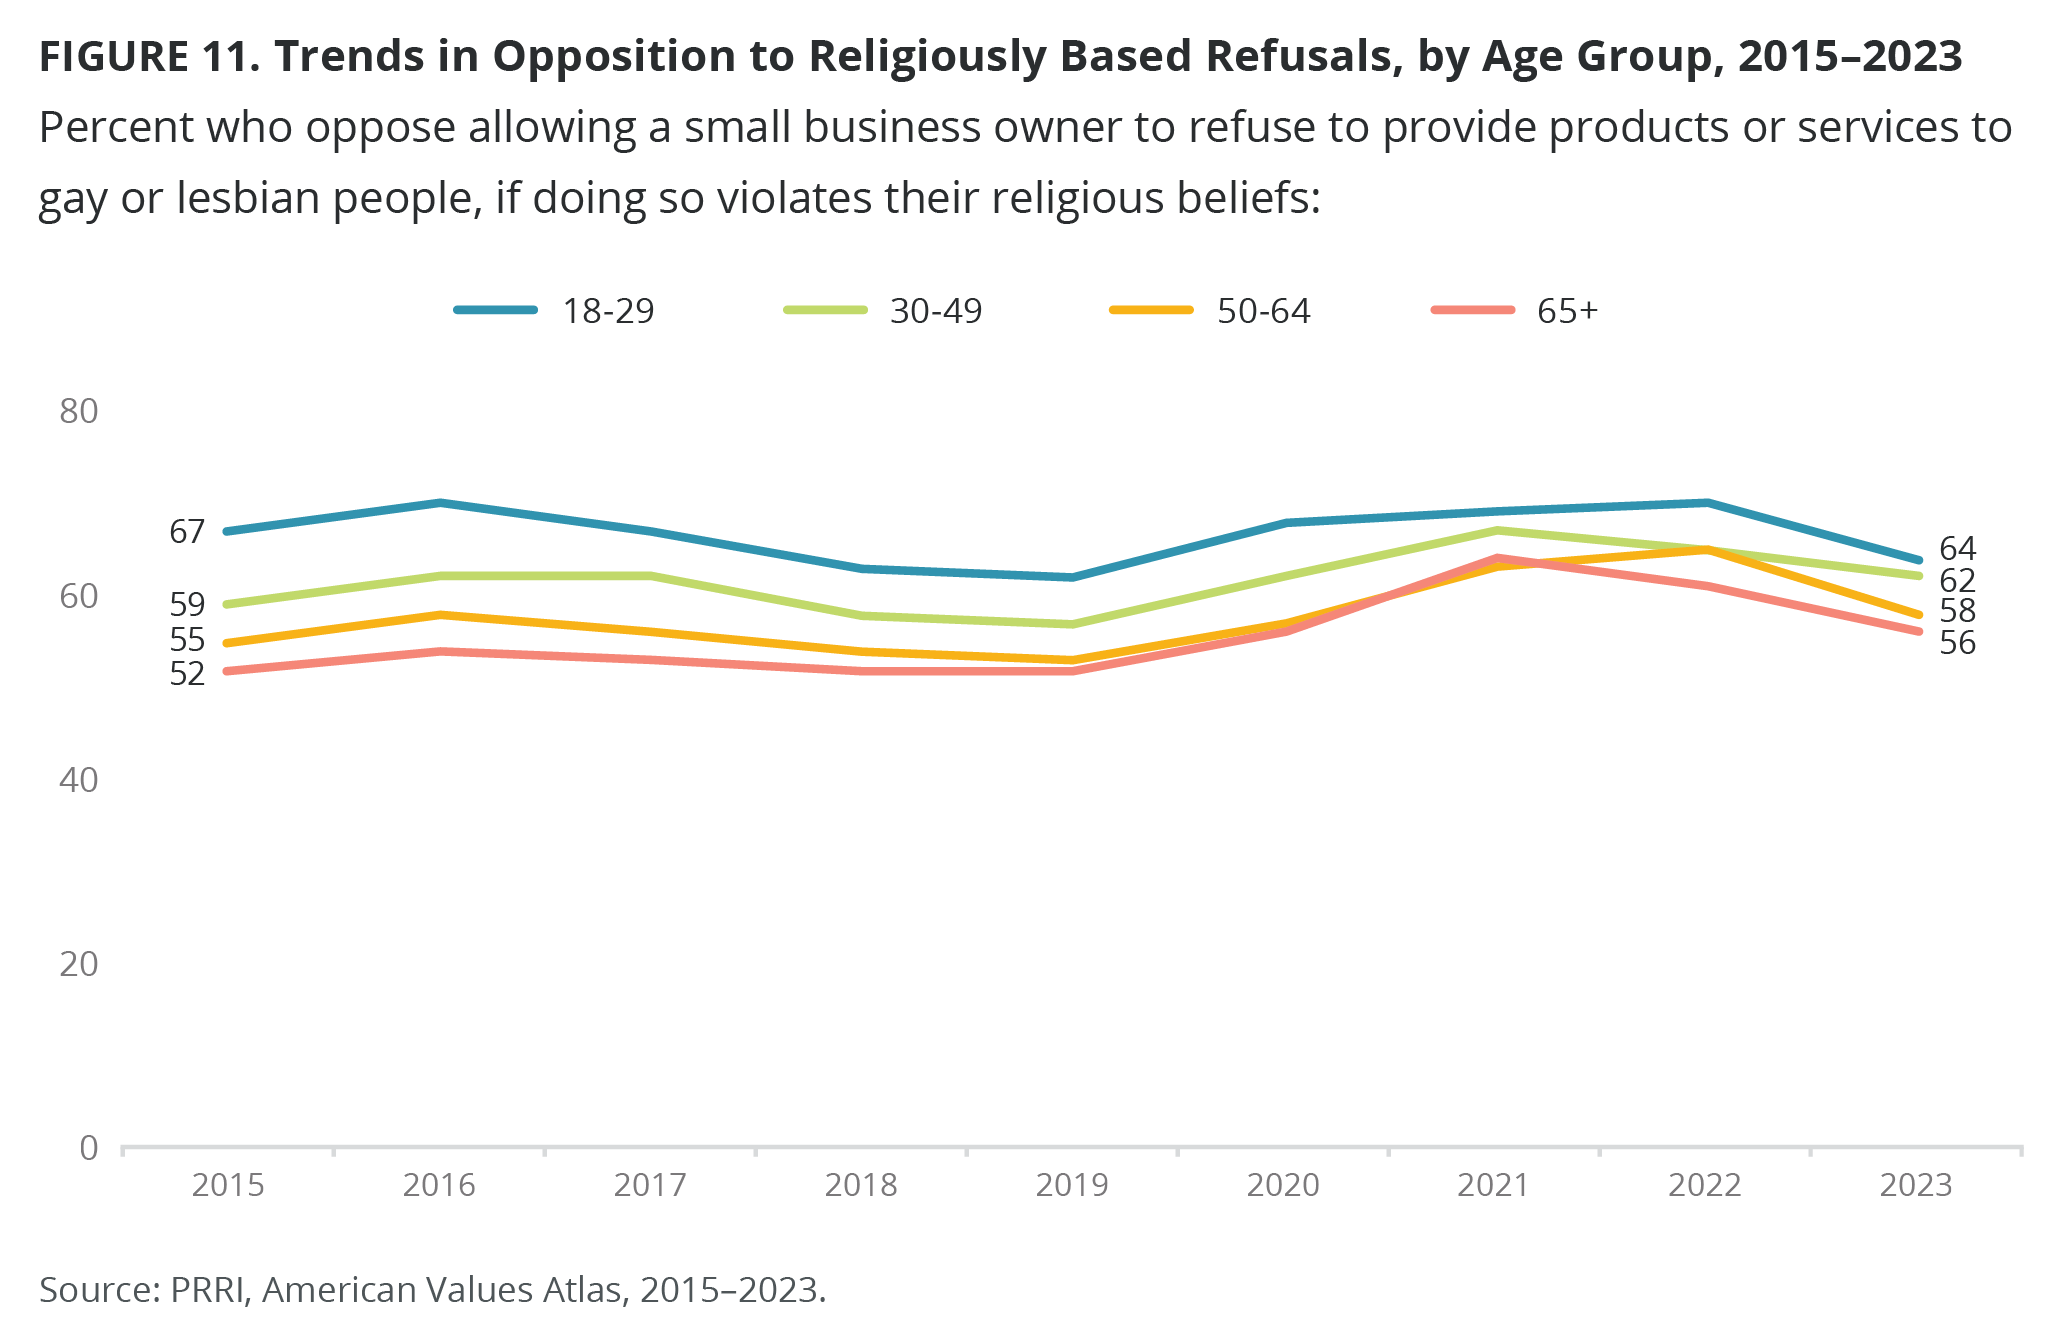
Sixty-four percent of young Americans and a majority of seniors (56%) oppose service refusals. There has been some fluctuation since 2015, but majorities across age groups continue to oppose religiously based refusals. However, there has been a decline in opposition among young Americans (70%), Americans ages 50-64 (65%), and seniors (61%) since 2022.
Majorities of all racial groups oppose small businesses refusing service to LGBTQ people based on religious beliefs, including roughly two-thirds of Hispanics (65%), Black Americans (68%), and Asian Americans (69%). A majority of white Americans (56%) also oppose refusals.
In our 2023 American Values Atlas, there are few differences by educational attainment, with roughly six in ten Americans with no college degree (59%) and with college degrees (63%) opposing businesses refusing service to LGBTQ people. A majority of white people without a college degree (54%) and nearly six in ten whites with college degrees (60%) also oppose service refusals.
Women (64%) are more likely to oppose businesses refusing service to LGBTQ people, though a majority of men (55%) also oppose them. More than eight in ten LGBTQ Americans (82%) also oppose religiously based LGBTQ service refusals.
Majorities of Americans in all regions of the country also oppose allowing small businesses to refuse service to LGBTQ persons if doing so would violate the businesses’ religious beliefs. Opposition ranges from roughly two-thirds of people in the Northeast (67%) and West (63%) to the majority of Midwesterners (59%) and Southerners (56%).
Residents in Massachusetts (75%), Hawaii (73%), Connecticut (70%), New York (70%), and the District of Columbia (69%) have the strongest opposition to religiously based service refusals. By contrast, in five states at least half of residents are in favor of service refusals: Nebraska (56%), South Dakota (55%), Idaho (53%), Montana (52%), and West Virginia (50%).
A majority of residents in red states (54%), 58% of residents of battleground states, and nearly two-thirds of residents in blue states (66%) oppose laws allowing a small business owner to refuse to provide products or services to LGBTQ people if doing so would violate their religious beliefs.
Support for Same-Sex Marriage 2014-2023
Party Affiliation
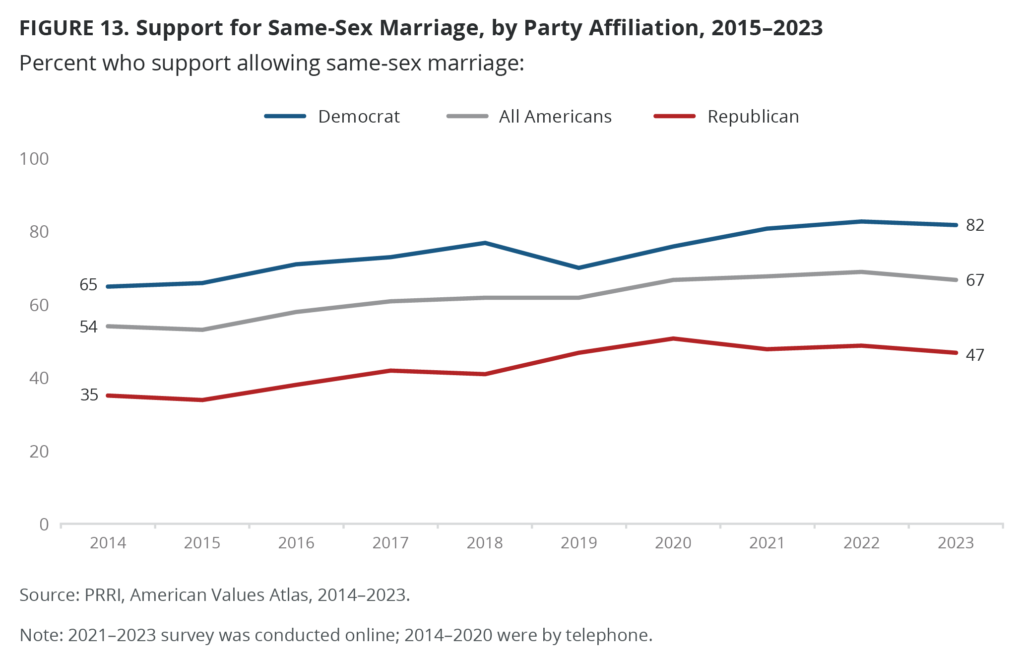
Two-thirds of Americans (67%) support allowing same-sex couples to marry legally, an increase of 13 percentage points from 2014, when a slight majority (54%) favored same-sex marriage. Support for same-sex marriage rates decreased slightly from 2022, when 69% of Americans supported same-sex marriage rights.
More than eight in ten Democrats favor same-sex marriage (82%), a 17% increase since 2014, when 65% of Democrats favored allowing gay and lesbian couples to marry legally. The majority of independents (71%) also support same-sex marriage, showing a similar 13-point increase compared with 2014 (58%). Republicans are more divided on this issue. While a small majority (51%) opposes allowing same-sex couples to marry legally, a substantial minority is in favor (47%). Since 2014, Republican support for same-sex marriage has increased by 12 percentage points, when over one-third (35%) were in favor. However, their support for same-sex marriage rights dropped slightly from 2022, when 49% of Republicans supported such rights. Among independents, there was also a 2% drop in support, from 73% in 2022 to 71% in 2023.
Religious Affiliation
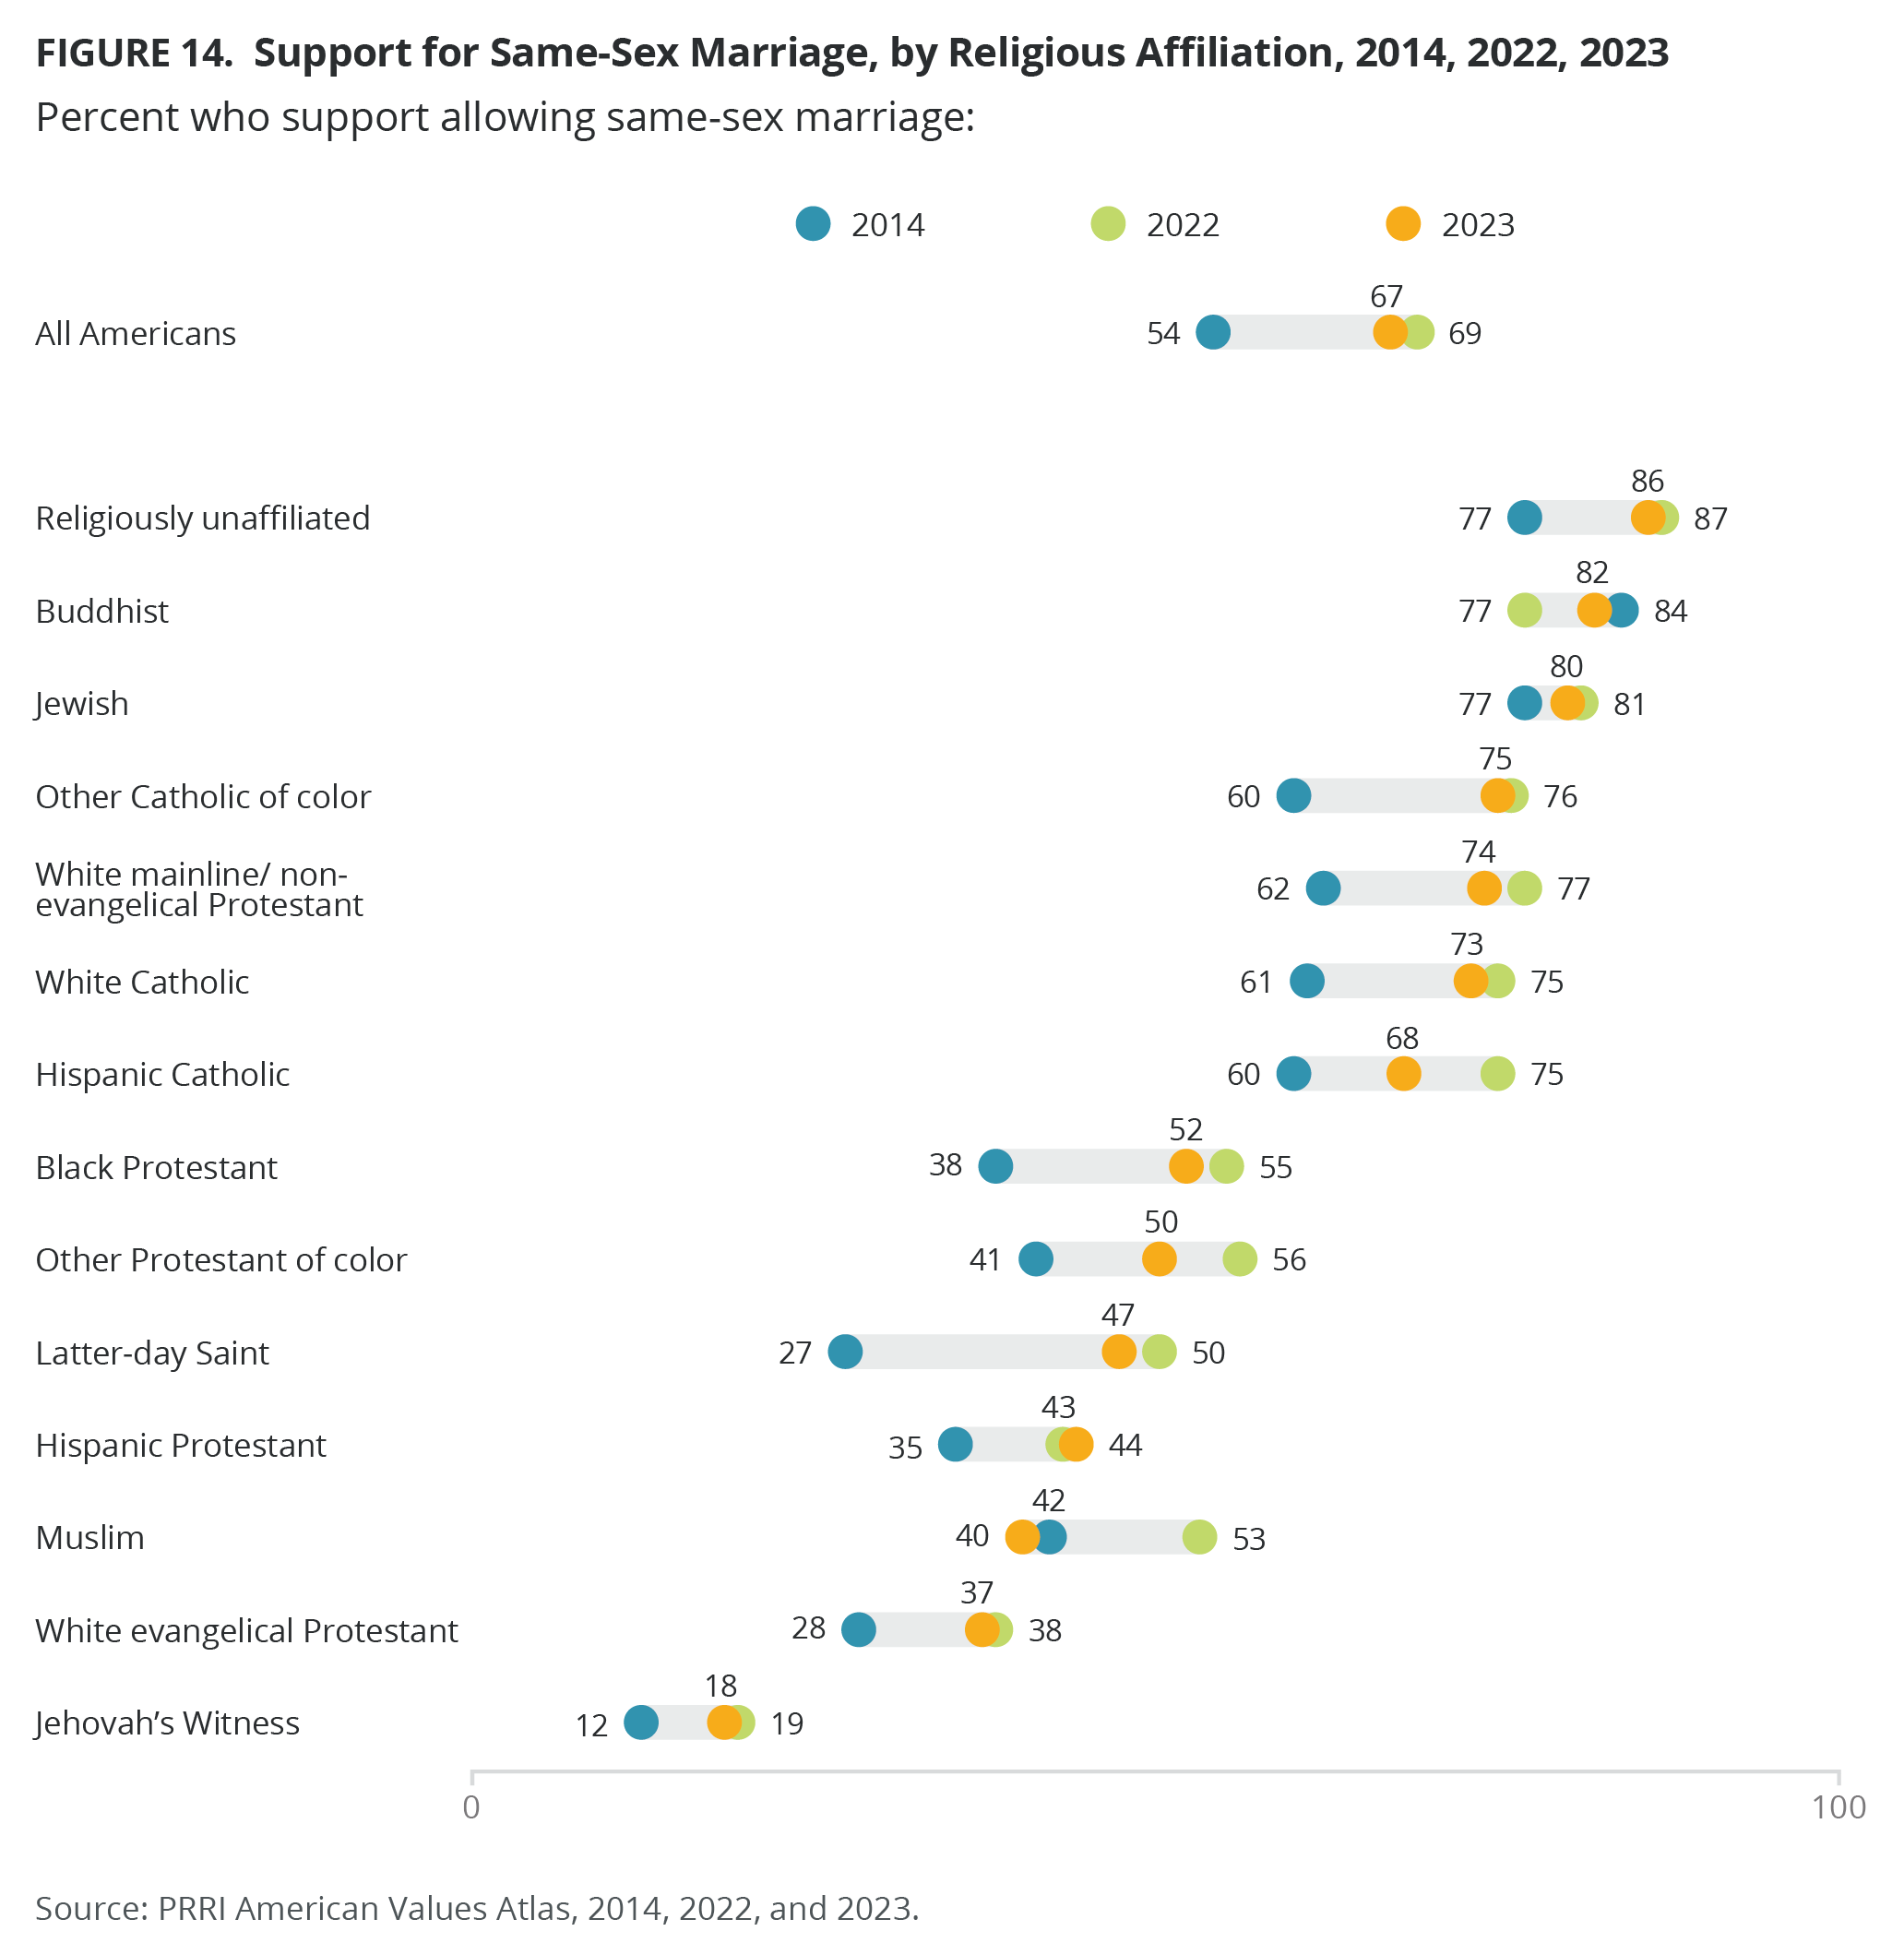
Majorities of most religious traditions are in favor of allowing same-sex couples to marry legally. Most notably, at least eight in ten Unitarian Universalists (88%), religiously unaffiliated (86%), Buddhists (82%), and Jewish Americans (80%) favor same-sex marriage. Hispanic Catholics show the most decline in their support since 2022, from 75% to 68% in 2023.
By contrast, there are four traditions in which a minority is in favor of same-sex marriage, and the majority opposes it. About one in five Jehovah’s Witnesses (18%), roughly four in ten white evangelical Protestants (37%) and Hispanic protestants (44%), 40% of Muslims, and 47% of Latter-day Saints favor allowing gay and lesbian couples to marry. Some of these traditions have seen substantial increases in support for same-sex marriage since 2014, when 12% of Jehovah’s Witnesses, 28% of white evangelical Protestants, and 27% of Latter-day Saints were in favor.
The Role of Age and Support for Same-Sex Marriage
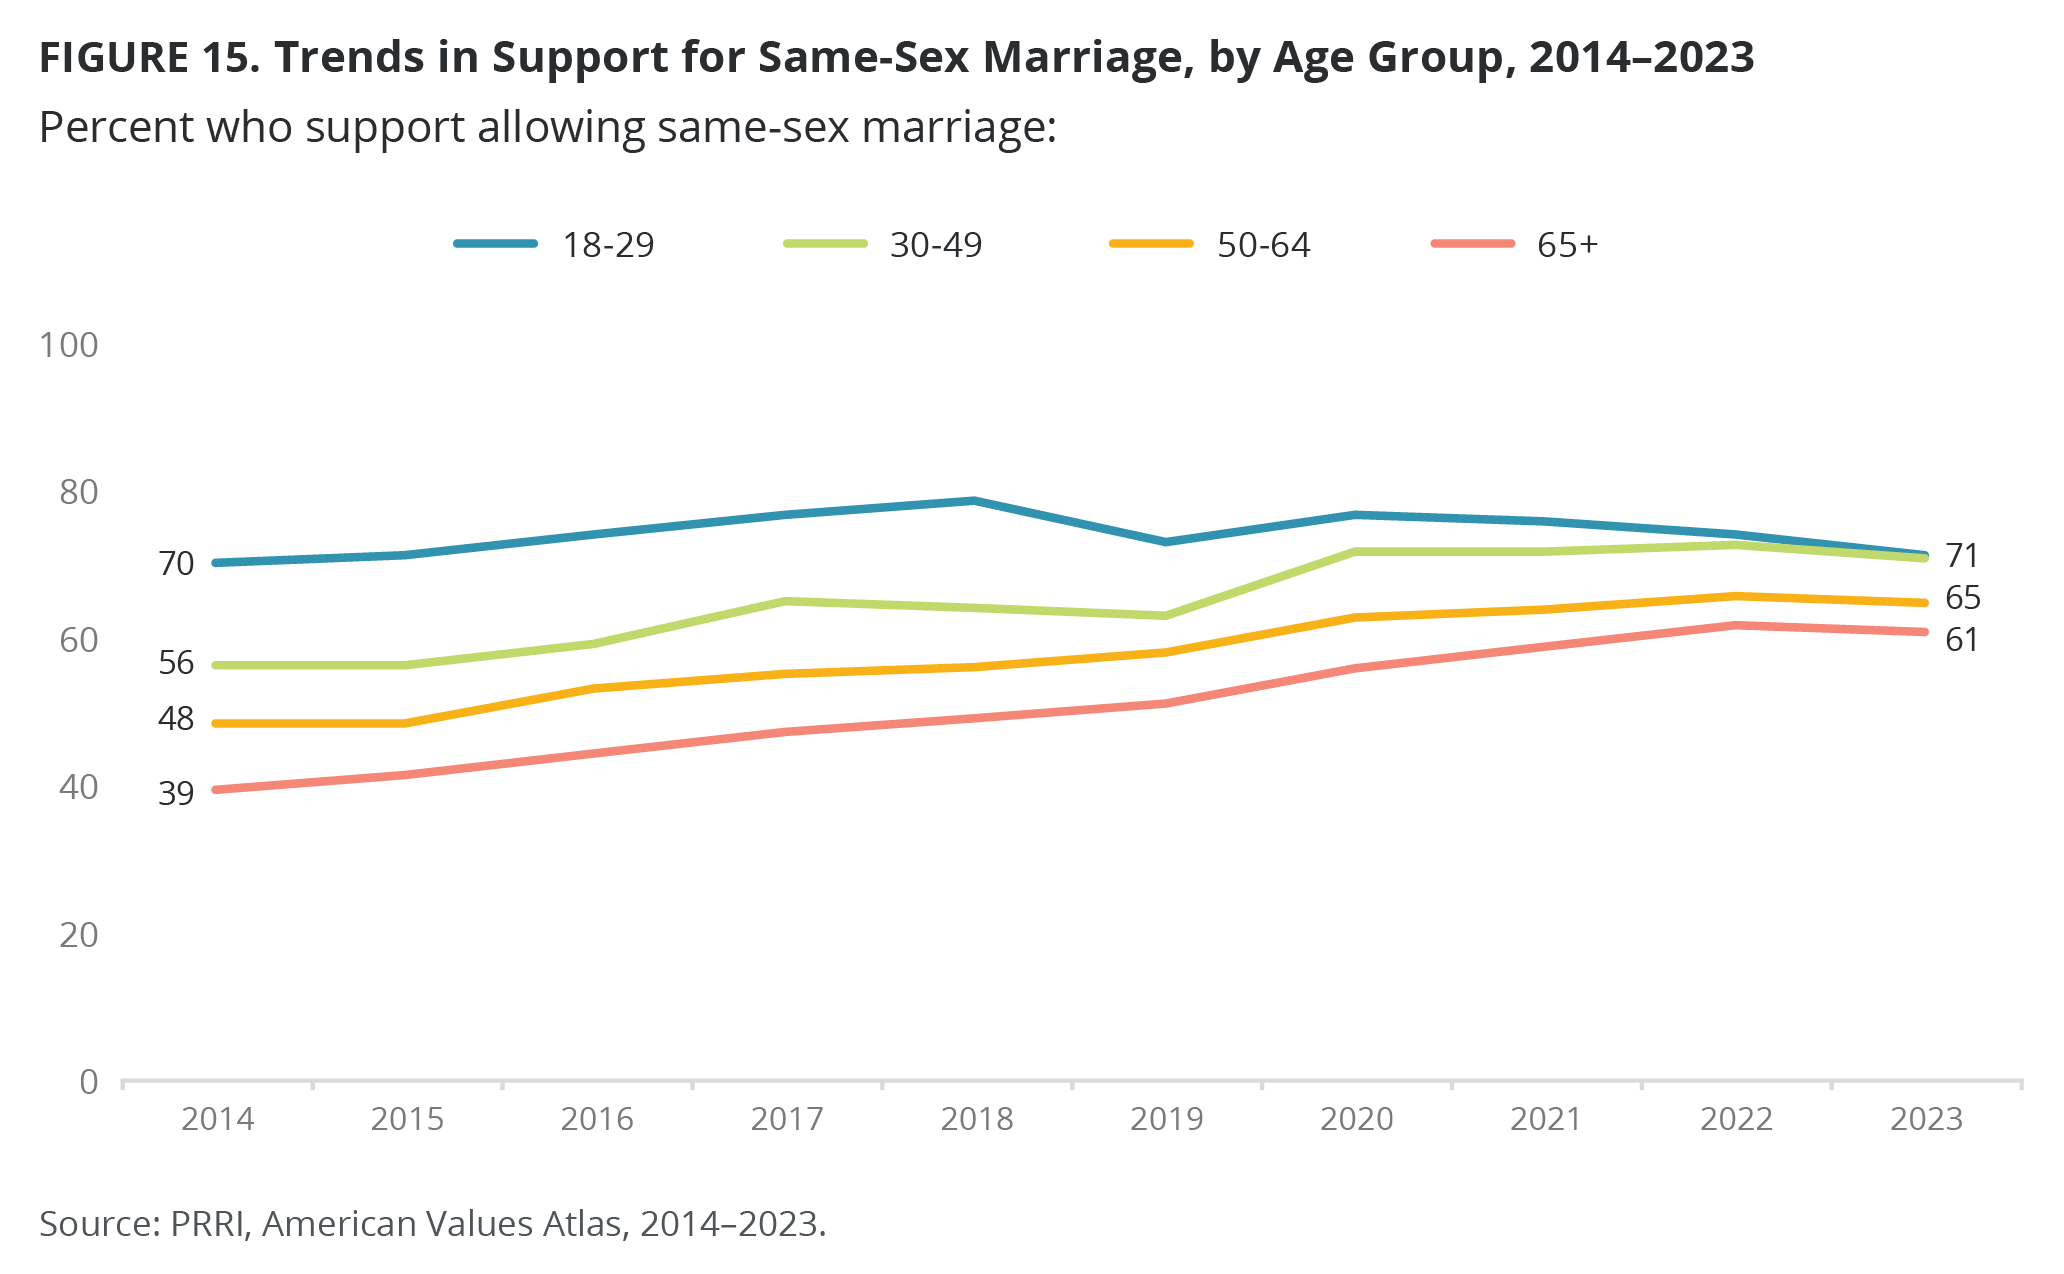
Seventy-one percent of young Americans (18-29) currently favor same-sex marriage. However, this level of support represents a slight but gradual decline among younger Americans for same-sex marriage rights since 2018, when 79% of young Americans supported such rights. A similar share of people aged 30-49 (71%) favor same-sex marriage. More than six in ten Americans ages 50-64 (65%) and seniors (61%) are also in favor of allowing gay and lesbian couples to marry legally.
There are important age differences within various religious groups. A majority of white evangelical Protestants oppose same-sex marriage regardless of age. However, white evangelical Protestants under the age of 50 are less opposed than their older cohorts. Forty-two percent of young white evangelical Protestants and 44% of those between the ages of 30-49 favor same-sex marriage. Only 27% of seniors in their cohort favor allowing same-sex marriage.
Among Black Protestants, only seniors are divided regarding same-sex marriage. Forty-seven percent are in favor and 48% are opposed, while the majority of all other age groups favor same-sex marriage. The pattern is similar among Hispanic Protestants. The majority of people over 30 oppose same-sex marriage, but more than six in ten young Hispanic Protestants (63%) favor allowing same-sex couples to marry legally.
While Republicans are split on the issue of same-sex marriage, among Republican seniors, a majority oppose (59%) and 39% are in favor. Only among Republicans ages 30-49 is a majority in favor of same-sex marriage (52% favor, 47% oppose). Among Democrats, at least 79% of all age groups are in favor of same-sex marriage, including 85% of people under 30, 83% of people aged 30-49, 80% of people between 50 and 64, and 79% of seniors. At least two-thirds of independents of all ages also favor same-sex marriage. Seventy-five percent of young independents, 74% of independents 30-49 years, 69% of independents ages 50-64, and 65% of seniors are in favor of allowing same-sex couples the right to marry.
Women are more likely than men to support same-sex marriage in all age brackets. However, the differences are more substantial between young women (75% in favor) and young men (67%), an eight-point difference. The differences between women and men in other age cohorts are smaller: three points among people ages 30-49 (72% vs. 69%), two points between people 50-64 (66% vs. 64%), and three points between women (62%) and men (59%) 65 years and older.
A majority of Americans of all races are in favor of allowing gay and lesbian couples to marry legally. This support ranges from 56% among Black Americans, 63% of Hispanics, 69% of whites, and 75% of AAPIs.
Demographics
Roughly six in ten Americans without a college degree (61%) and three-quarters of college graduates (77%) are in favor of same-sex marriage. Among whites with no college degree, 63% are in favor of same-sex marriage, while nearly eight in ten whites with college degrees (79%) favor it.
More than six in ten men (65%) and women (69%) favor same-sex marriage, while more than nine in ten LGBTQ Americans (90%) support the policy.
The Northeast (74%) is the region exhibiting the strongest support for same-sex marriage, followed by the West (70%) and Midwest (68%). The weakest support for same-sex marriages is in the South (61%).
Solid majorities across all states support same-sex marriage with the top states showing about eight in ten residents in favor, including 81% in Massachusetts, 81% in Vermont, and 80% in Connecticut, as well as 80% in the District of Columbia. The five states with the least support for same-sex marriage are Arkansas (49%), Mississippi (50%), Alabama (51%), and South Carolina (52%).
Further, 72% of people who live in states where same-sex marriage would continue to be legal if the Supreme Court’s 2015 Obergefell v. Hodges decision were overturned are in favor of allowing gay and lesbian couples to marry legally, while 64% of people who live in states where same-sex marriage would no longer be legal favor same-sex marriage.[7]
The Role of LGBTQ Rights in Elections
PRRI asked a question about the role of LGBTQ rights with respect to respondents’ voting decisions that reads, “Thinking about how the following issues might affect your vote for major political offices, would you: Only vote for a candidate who shares your views on this issue; consider a candidate’s position on this issue as just one of many important factors; not see this as a major issue.” A plurality of Americans (38%) say that LGBTQ rights is one of many important factors they will consider, 30% say they would only vote for a candidate who shares their views on this issue, and 29% say they do not see LGBTQ rights as a major issue. A plurality of young Americans (38%) and members of Gen Z (38%) say they would only vote for a candidate who shares their views on LGBTQ rights.
Though a plurality of Democrats (43%) say LGBTQ rights is one of many issues they consider when voting, they are the least likely to say it is not an issue (17%). Democrats are also the most likely to say they would only vote for a candidate who shares their views on this issue (38%), compared with 29% of Republicans and 25% of independents. The religiously unaffiliated is the only tradition where a plurality (39%) says that they would only vote for a candidate who shares their views on LGBTQ rights, while 36% say they consider a candidate’s position on LGBTQ rights as one of many important issues, and one-quarter do not see LGBTQ rights as a major issue deciding their vote (25%). White evangelical Protestants have views similar to the religiously unaffiliated. More than one-third say they would only vote for a candidate whose views match their own (35%), while 35% say LGBTQ rights is one of many issues they consider when voting for a candidate. Nearly three in ten say this is not a major issue (29%).
The Relationship Between Christian Nationalism and Support for LGBTQ Rights
The link between Christian nationalism and support or opposition to policies affecting LGBTQ populations is stark. Attitudes toward the three policies discussed in this report have opposite reactions depending on peoples’ affinity for Christian nationalism. Using PRRI’s Christian nationalism scale, which sorts respondents into four types depending on their responses to a battery of five questions gauging different tenets of Christian nationalism, we can see how adherence or rejection to Christian nationalism relates to support or opposition to LGBTQ policies.[8]
Support for Nondiscrimination Protections
Christian nationalism Rejecters are nearly unanimous (93%) in their support for laws that protect LGBTQ people from discrimination in housing, employment, and accommodation, including more than seven in ten who strongly favor them (72%). Majorities of Christian nationalism Skeptics (79%) and Sympathizers (63%) are in favor of LGBTQ nondiscrimination laws. Only among Christian nationalism Adherents (52%) does a majority oppose nondiscrimination laws, while 45% favor them.
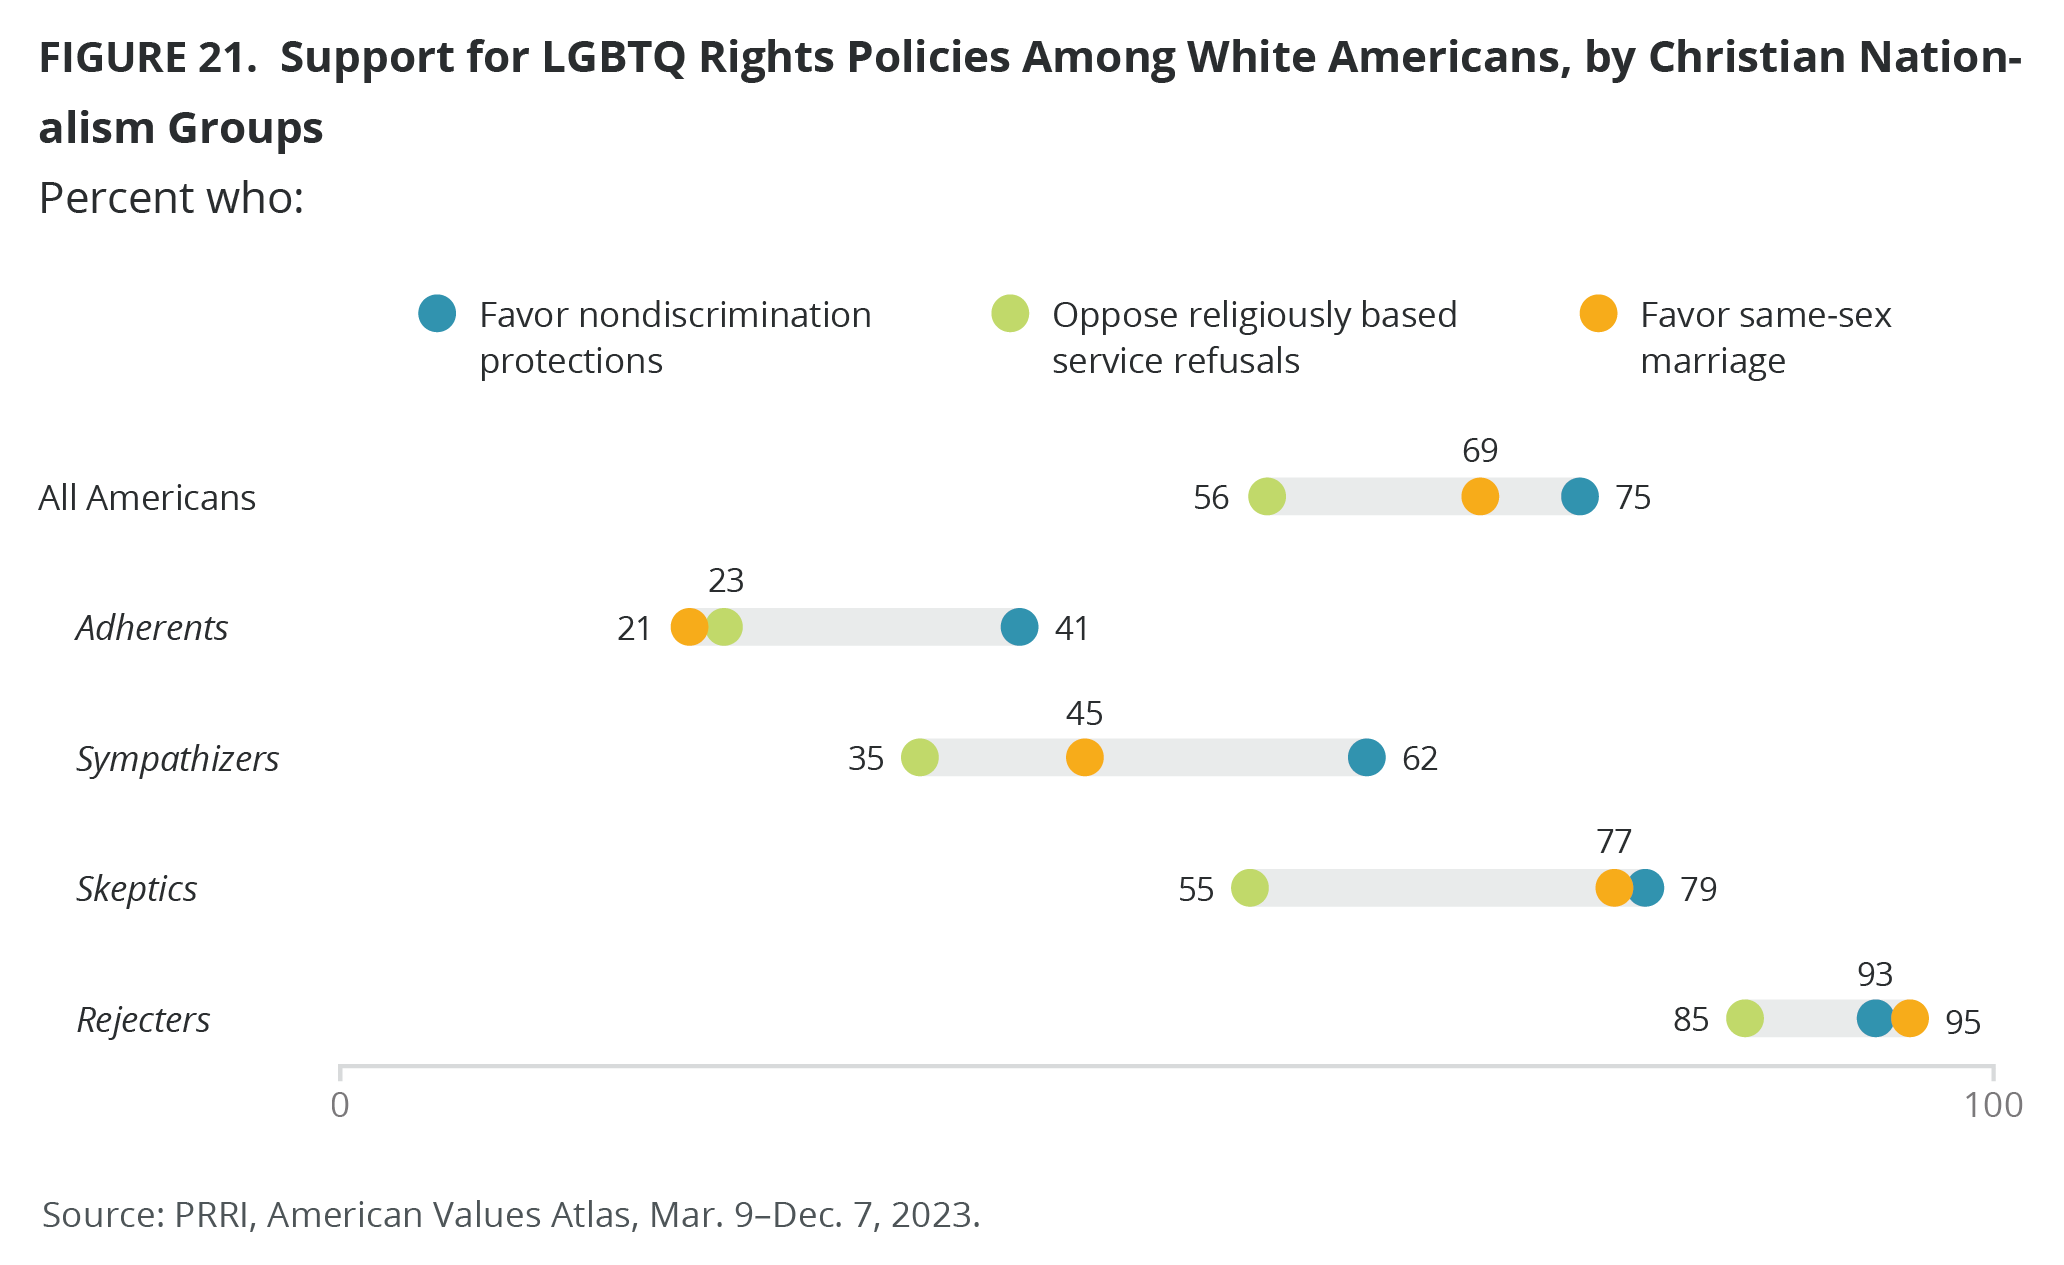
Majorities of white Christian nationalism Rejecters (93%), Skeptics (79%), and Sympathizers (62%) favor laws that protect LGBTQ individuals from discrimination in housing, accommodation, and employment. A majority of white Christian nationalism Adherents (57%) oppose LGBTQ antidiscrimination laws, and 41% are in favor.
Black Americans, regardless of their support for Christian nationalism, are in favor of laws protecting LGBTQ Americans from discrimination. Black Christian nationalism Rejecters (89%) are the most in favor of these laws, including roughly two-thirds who strongly favor them (66%). Eighty percent of Black Christian nationalism Skeptics, 69% of Sympathizers, and 61% of Adherents favor LGBTQ nondiscrimination laws.
Hispanic Americans have a similar pattern to whites in the way Christian nationalism intersects with support for LGBTQ nondiscrimination laws. More than nine in ten Hispanic Christian nationalism Rejecters (92%), 80% of Skeptics, and 60% of Sympathizers favor laws that would protect LGBTQ people from discrimination. Among Hispanic Christian nationalism Adherents, a majority (51%) opposes nondiscrimination laws and 45% favors them.
The Relationship Between Christian Nationalism and Support for Nondiscrimination Protections by State
Support for Christian nationalism is negatively correlated with support for LGBTQ nondiscrimination laws in the 50 states. The scatter plot below shows the relationship between a state’s average raw score on the Christian nationalism scale (with a range from zero to one) on the X axis, plotted against the percentage of that state’s support for LGBTQ nondiscrimination laws on the Y axis.
The downward sloping trend line through the distribution demonstrates that, overall, the higher a state’s residents scored on the Christian nationalism scale, the less likely they are to favor laws protecting LGBTQ people from discrimination.
For example, Alabama has an average score of 0.48 on the Christian nationalism scale, and 61% of its residents favor nondiscrimination protections. Similarly, Mississippi has an average score of 0.48 on the Christian nationalism scale and 74% of that state’s residents support laws protecting LGBTQ people from discrimination. At the other end of the scale, Oregon has an average Christian nationalism score of 0.22 and 81% of its residents support these laws.
Opposition to Religiously Based Refusals
Regarding the policy of allowing small businesses to refuse service to LGBTQ persons if doing so violates their religious beliefs, the vast majority of Christian nationalism Rejecters (85%) and six in ten Skeptics (60%) oppose it. By contrast, among Christian nationalism Sympathizers (58%) and Adherents (66%), the majority favors service refusals. Forty percent of Sympathizers and 32% of Adherents oppose.
White Christian nationalism Rejecters (85%) oppose allowing a small business owner to refuse to provide products or services to LGBTQ people if doing so would violate their religious beliefs, similar to all Christian nationalism Rejecters. A majority of white Christian nationalism Skeptics (55%) also oppose but with a slightly lower majority than Skeptics in general.
Opposition among white Christian nationalism Sympathizers (35%) and Adherents (23%) is weaker than among Christian nationalism Sympathizers and Adherents overall. A larger majority of white Christian nationalism Sympathizers (65%) and Adherents (76%) are in favor of LGBTQ service refusal laws than among Christian nationalism Sympathizers and Adherents overall.
A majority of Black Americans oppose service refusals independent of their support for Christian nationalism. Eighty-five percent of Black Christian nationalism Rejecters oppose laws allowing businesses to refuse service to LGBTQ people, including 63% who strongly oppose. More than seven in ten Black Christian nationalism Skeptics (72%), 60% of Sympathizers, and 55% of Adherents also oppose service refusal laws.
Hispanic Christian nationalism Rejecters (81%) and Skeptics (70%) have patterns similar to those of Black Americans. However, contrary to white (majority in favor) and Black (majority opposed) Christian nationalism Sympathizers and Adherents, Hispanic Christian nationalism Sympathizers and Adherents are more divided on the issue (47% oppose, 50% favor and 44% oppose, 51% favor, respectively).
The Relationship Between Christian Nationalism and Opposition to Allowing Religiously Based Service Refusal by State
In Figure 20, the downward sloping trend line through the distribution shows that, overall, the higher a state’s residents scored on the Christian nationalism scale, the less likely they are to oppose religiously based refusals. Mississippi has an average score of 0.48 on the Christian nationalism scale, and 53% of residents oppose allowing small business owners to refuse services to LGBTQ people. Similarly, Alabama has an average score of 0.48 on the Christian nationalism scale and 51% of the state’s residents oppose religiously based refusals. At the other end of the scale, Oregon and Washington both have average Christian nationalism scores of 0.22 and 66% and 64% of their residents respectively oppose religiously based refusals.
Support for Same-Sex Marriage
When it comes to same-sex marriage, a similar pattern emerges. While strong majorities of Christian nationalism Rejecters and Skeptics are in favor of allowing gay and lesbian couples the right to marry legally, Christian nationalism Sympathizers and Adherents oppose it.
Ninety-three percent of Christian nationalism Rejecters and nearly three-quarters of Skeptics (74%) favor allowing same-sex couples to marry legally. By contrast, the majority of Christian nationalism Sympathizers (55%) and more than three-quarters of Adherents (77%) oppose same-sex marriage. A majority of Adherents (52%) strongly oppose same-sex marriage. On this issue, Christian nationalism Rejecters, Skeptics, Sympathizers, and Adherents have similar patterns regardless of race.
White Christian nationalism Rejecters are nearly unanimous (95%) in their support for same-sex marriage while 83% of Black Rejecters and 89% of Hispanic Rejecters also favor same-sex marriage. More than three-quarters of white (77%), 62% of Black, and 70% of Hispanic Christian nationalism Skeptics also favor allowing gay and lesbian couples the right to marry legally.
Majorities of Christian nationalism Sympathizers and Adherents, regardless of race, oppose same-sex marriage. Among Sympathizers opposition is weaker than among Adherents, but still 53% of white, 56% of Black, and 55% of Hispanic Sympathizers oppose allowing same-sex marriage. Strong majorities of Christian nationalism Adherents oppose same-sex marriage across racial groups, including 78% of white, 70% of Black, and 75% of Hispanic Adherents.
The Relationship Between Christian Nationalism and Support for Same-Sex Marriage by State
Figure 22 shows a clear negative correlation between a state’s score on the Christian nationalism scale and support for same-sex marriage. For example, both Alabama and Mississippi score 0.48 on the Christian nationalism scale, and 51% and 50% of their residents favor same-sex marriage, respectively. At the other end of the scale, Oregon and Washington have average Christian nationalism scores of 0.22 and 75% and 78% of their residents favor same-sex marriage, respectively.
APPENDIX A. Methodology for Measuring LGBTQ Identity
Measuring Gender Identity
We derive our gender identity measure from the following two questions:
What sex were you assigned at birth on your original birth certificate? Select one answer only.
1. Male
2. Female
What is your current gender identity? Select all answers that apply.
1. Male
2. Female
3. Transgender
4. Non-binary
5. A different identity, please specify
We first count the number of responses to the current gender identity question. If respondents give one answer only, and it matches their response for sex assigned at birth, they are considered cisgender. All other cases are classified as transgender/non-binary, including: if respondents answer the current gender identity question with the gender that is opposite their sex at birth, the transgender response alone, or the transgender response in combination with the gender opposite their sex at birth; if respondents select the non-binary alone, or a different identity option alone; or if the respondents pick the non-binary or different identity option along with male or female.
Measuring Sexual Orientation
We measure sexual orientation using the following question:
Which of the following best describes how you think of yourself? Select one answer only.
1. Gay or lesbian
2. Straight, that is, not gay
3. Bisexual
4. Something else
Creating the LGBTQ Identity Variable
We code “gay or lesbian,” “bisexual,” and “something else” responses as LGBTQ and “straight, that is, not gay” into straight or non-LGBTQ. Then we combine this variable with our gender identity variable and code those who identify as “transgender/non-binary/something else” and “gay or lesbian/ bisexual/something else,” as LGBTQ and code “cisgender males and females” who identify as “straight” as non-LGBTQ. We also code those who identify as “transgender/non-binary/something else” and “straight” as part of our LGBTQ identity category.
APPENDIX B. Methodology for Measuring Christian Nationalism Scale
The Christian nationalism scale replicates the methodology developed in the PRRI/Brookings Christian Nationalism Survey (fielded November – December 2022). To measure Christian nationalism, PRRI used a battery of five questions about the relationship between Christianity, American identity, and the U.S. government, which were first developed for the PRRI/Brookings Christian Nationalism Survey, which was based on data collected in late 2022 and released in a major report in February 2023. PRRI included these five questions in four follow-up surveys throughout 2023, which were each conducted among a representative sample of more than 5,000 Americans Respondents in our American Values Atlas were asked whether they completely agree, mostly agree, mostly disagree, or completely disagree with each of the following statements:
- The U.S. government should declare America a Christian nation.
- U.S. laws should be based on Christian values.
- If the U.S. moves away from our Christian foundations, we will not have a country anymore.
- Being Christian is an important part of being truly American.
- God has called Christians to exercise dominion over all areas of American society.
Based on their answers to these five questions, each respondent receives a composite score on the Christian nationalism scale using an additive scale and recalibrates the scores to values from 0 (low) to 1 (high). Respondents’ answers across all five questions are highly correlated, with a Cronbach’s alpha of 0.93, indicating a high degree of reliability for the scale and is then assigned to one of four groups:
Christian Nationalism Adherents (Score 0.75–1): These Americans overwhelmingly either agree or completely agree with all five statements in the scale. This group includes 10% of Americans.
Christian Nationalism Sympathizers (Score 0.5–0.74): These Americans agree with most statements in the scale, but they are less likely than Adherents to completely agree. This group includes 20% of Americans.
Christian Nationalism Skeptics (Score 0.01-0.49): These Americans disagree with most statements in the scale, but they are less likely than Rejecters to completely disagree. This group includes 37% of Americans.
Christian Nationalism Rejecters (Score 0): These Americans completely disagree with all five statements in the scale. This group includes 30% of Americans.
To see the components of the Christian nationalism scale, please see Appendix A in PRRI’s February 2024 report.
APPENDIX C. Survey Methodology
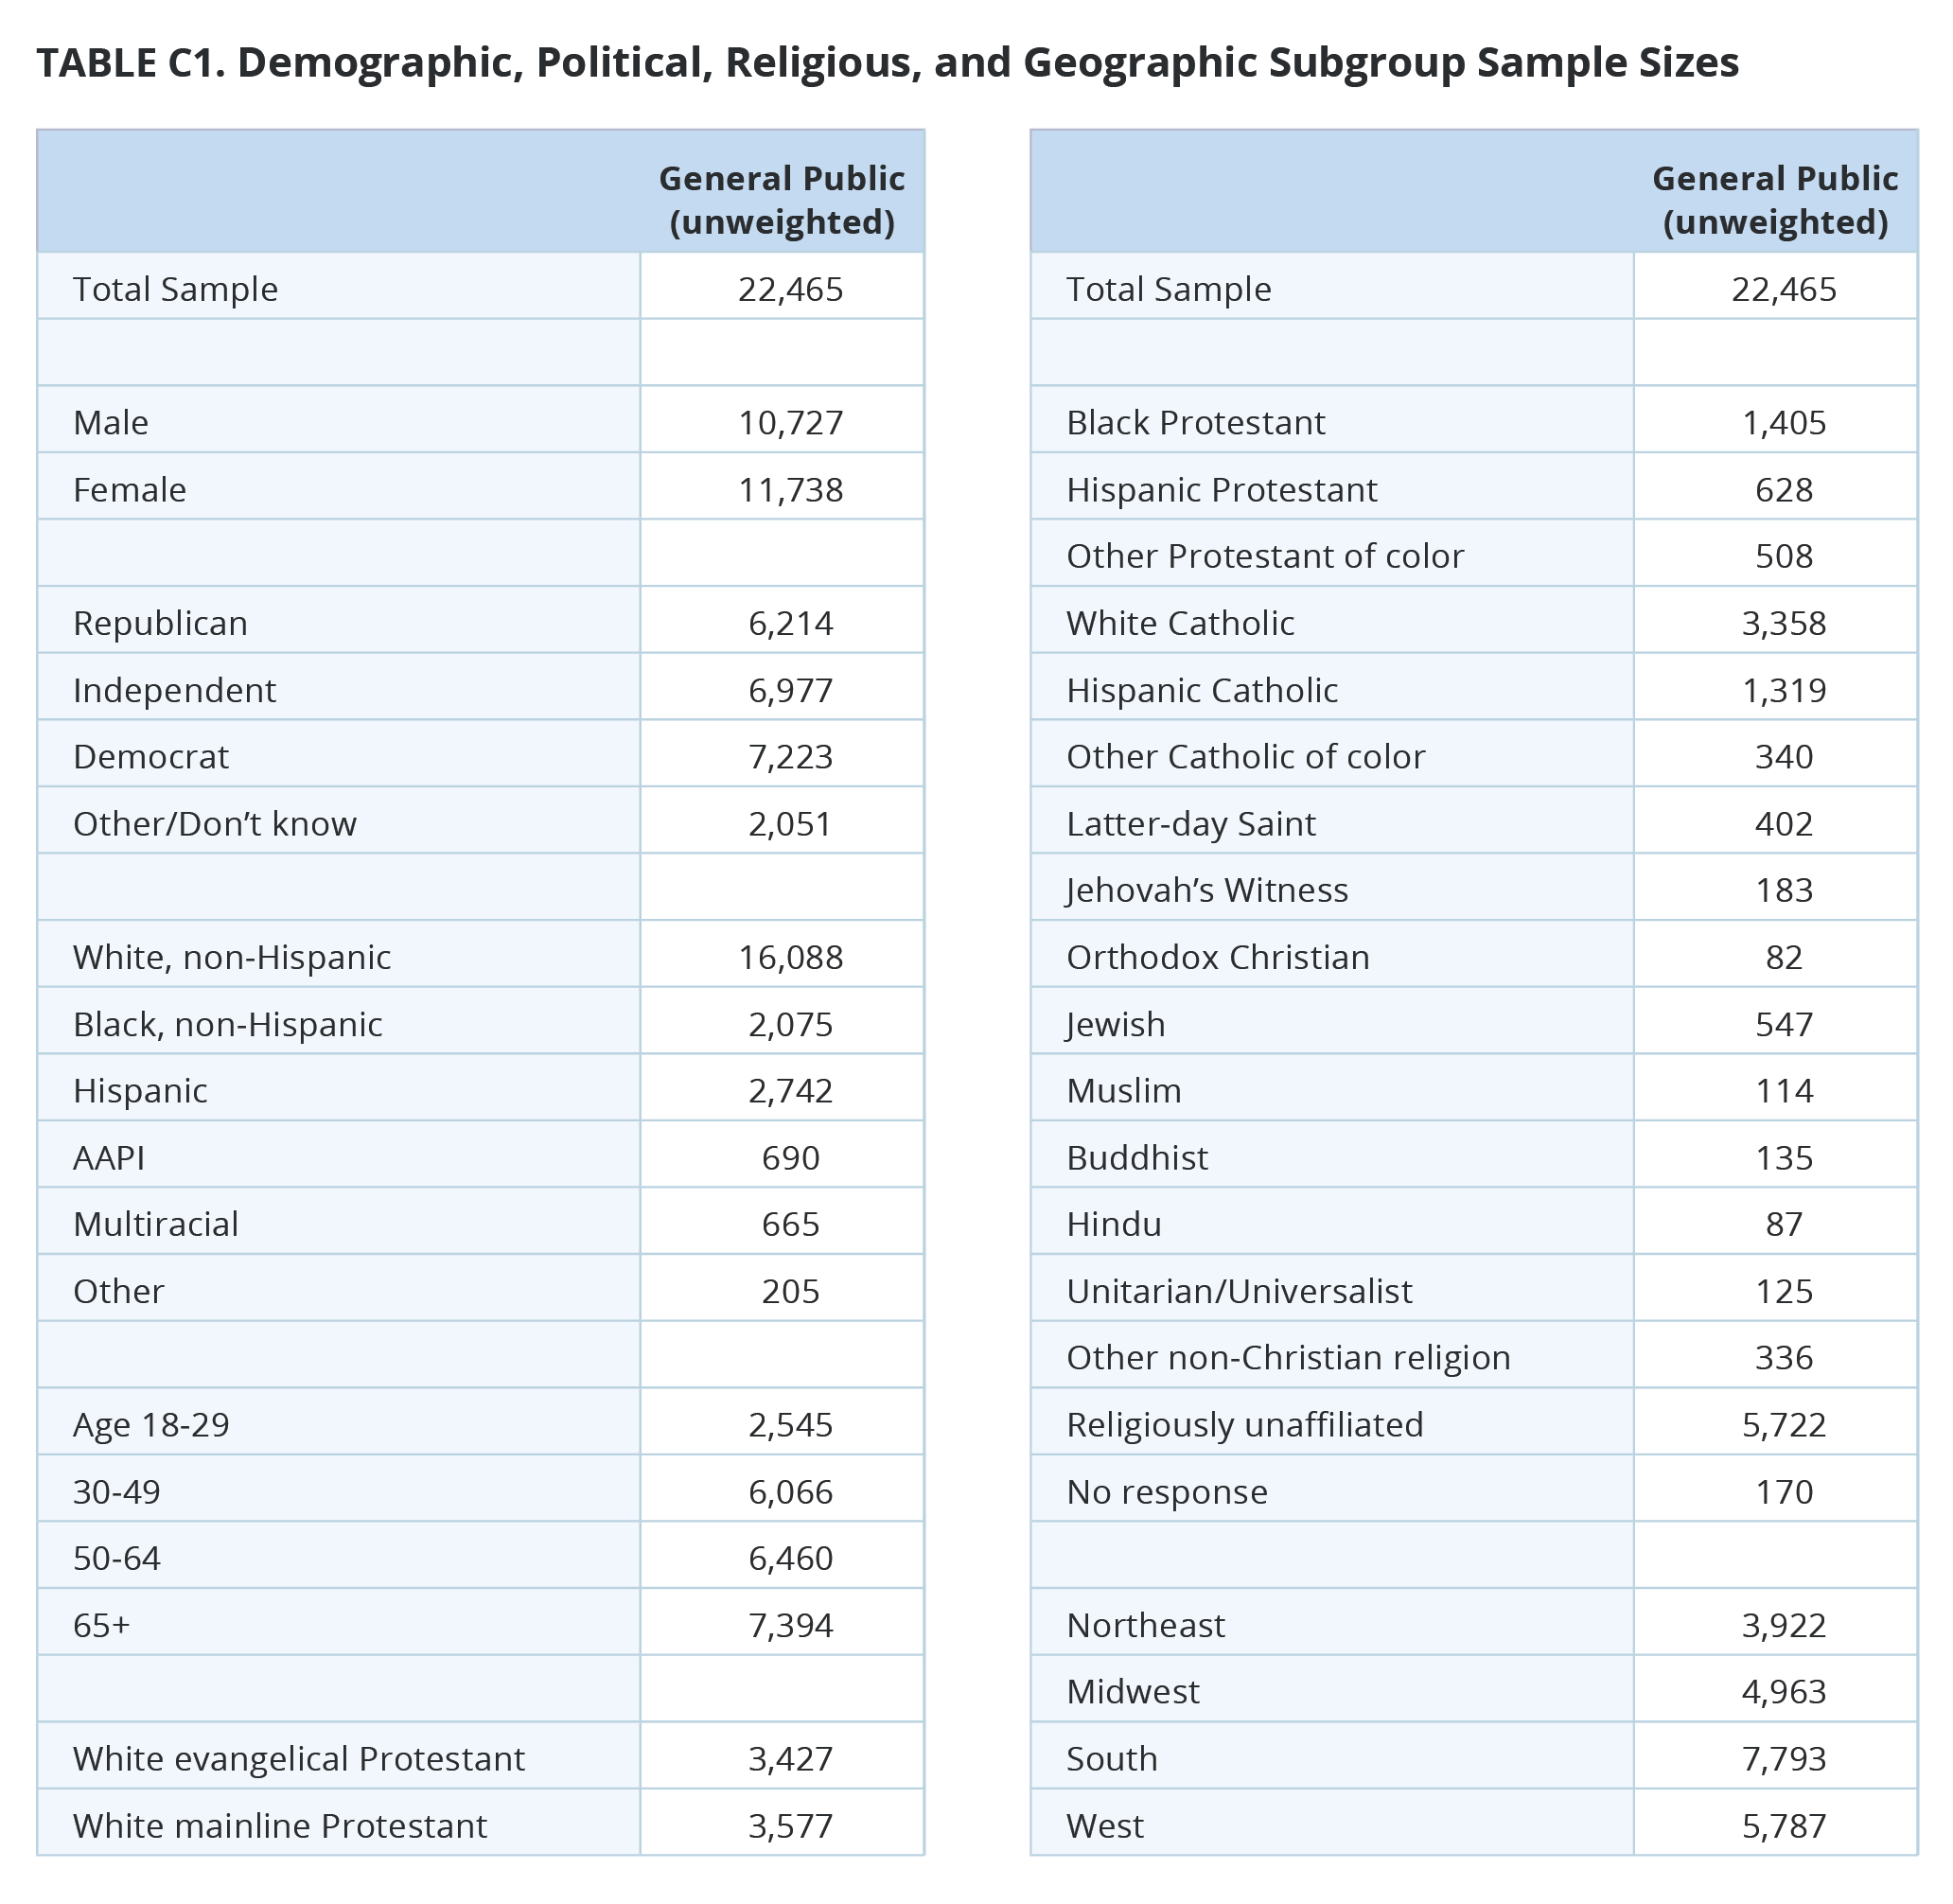
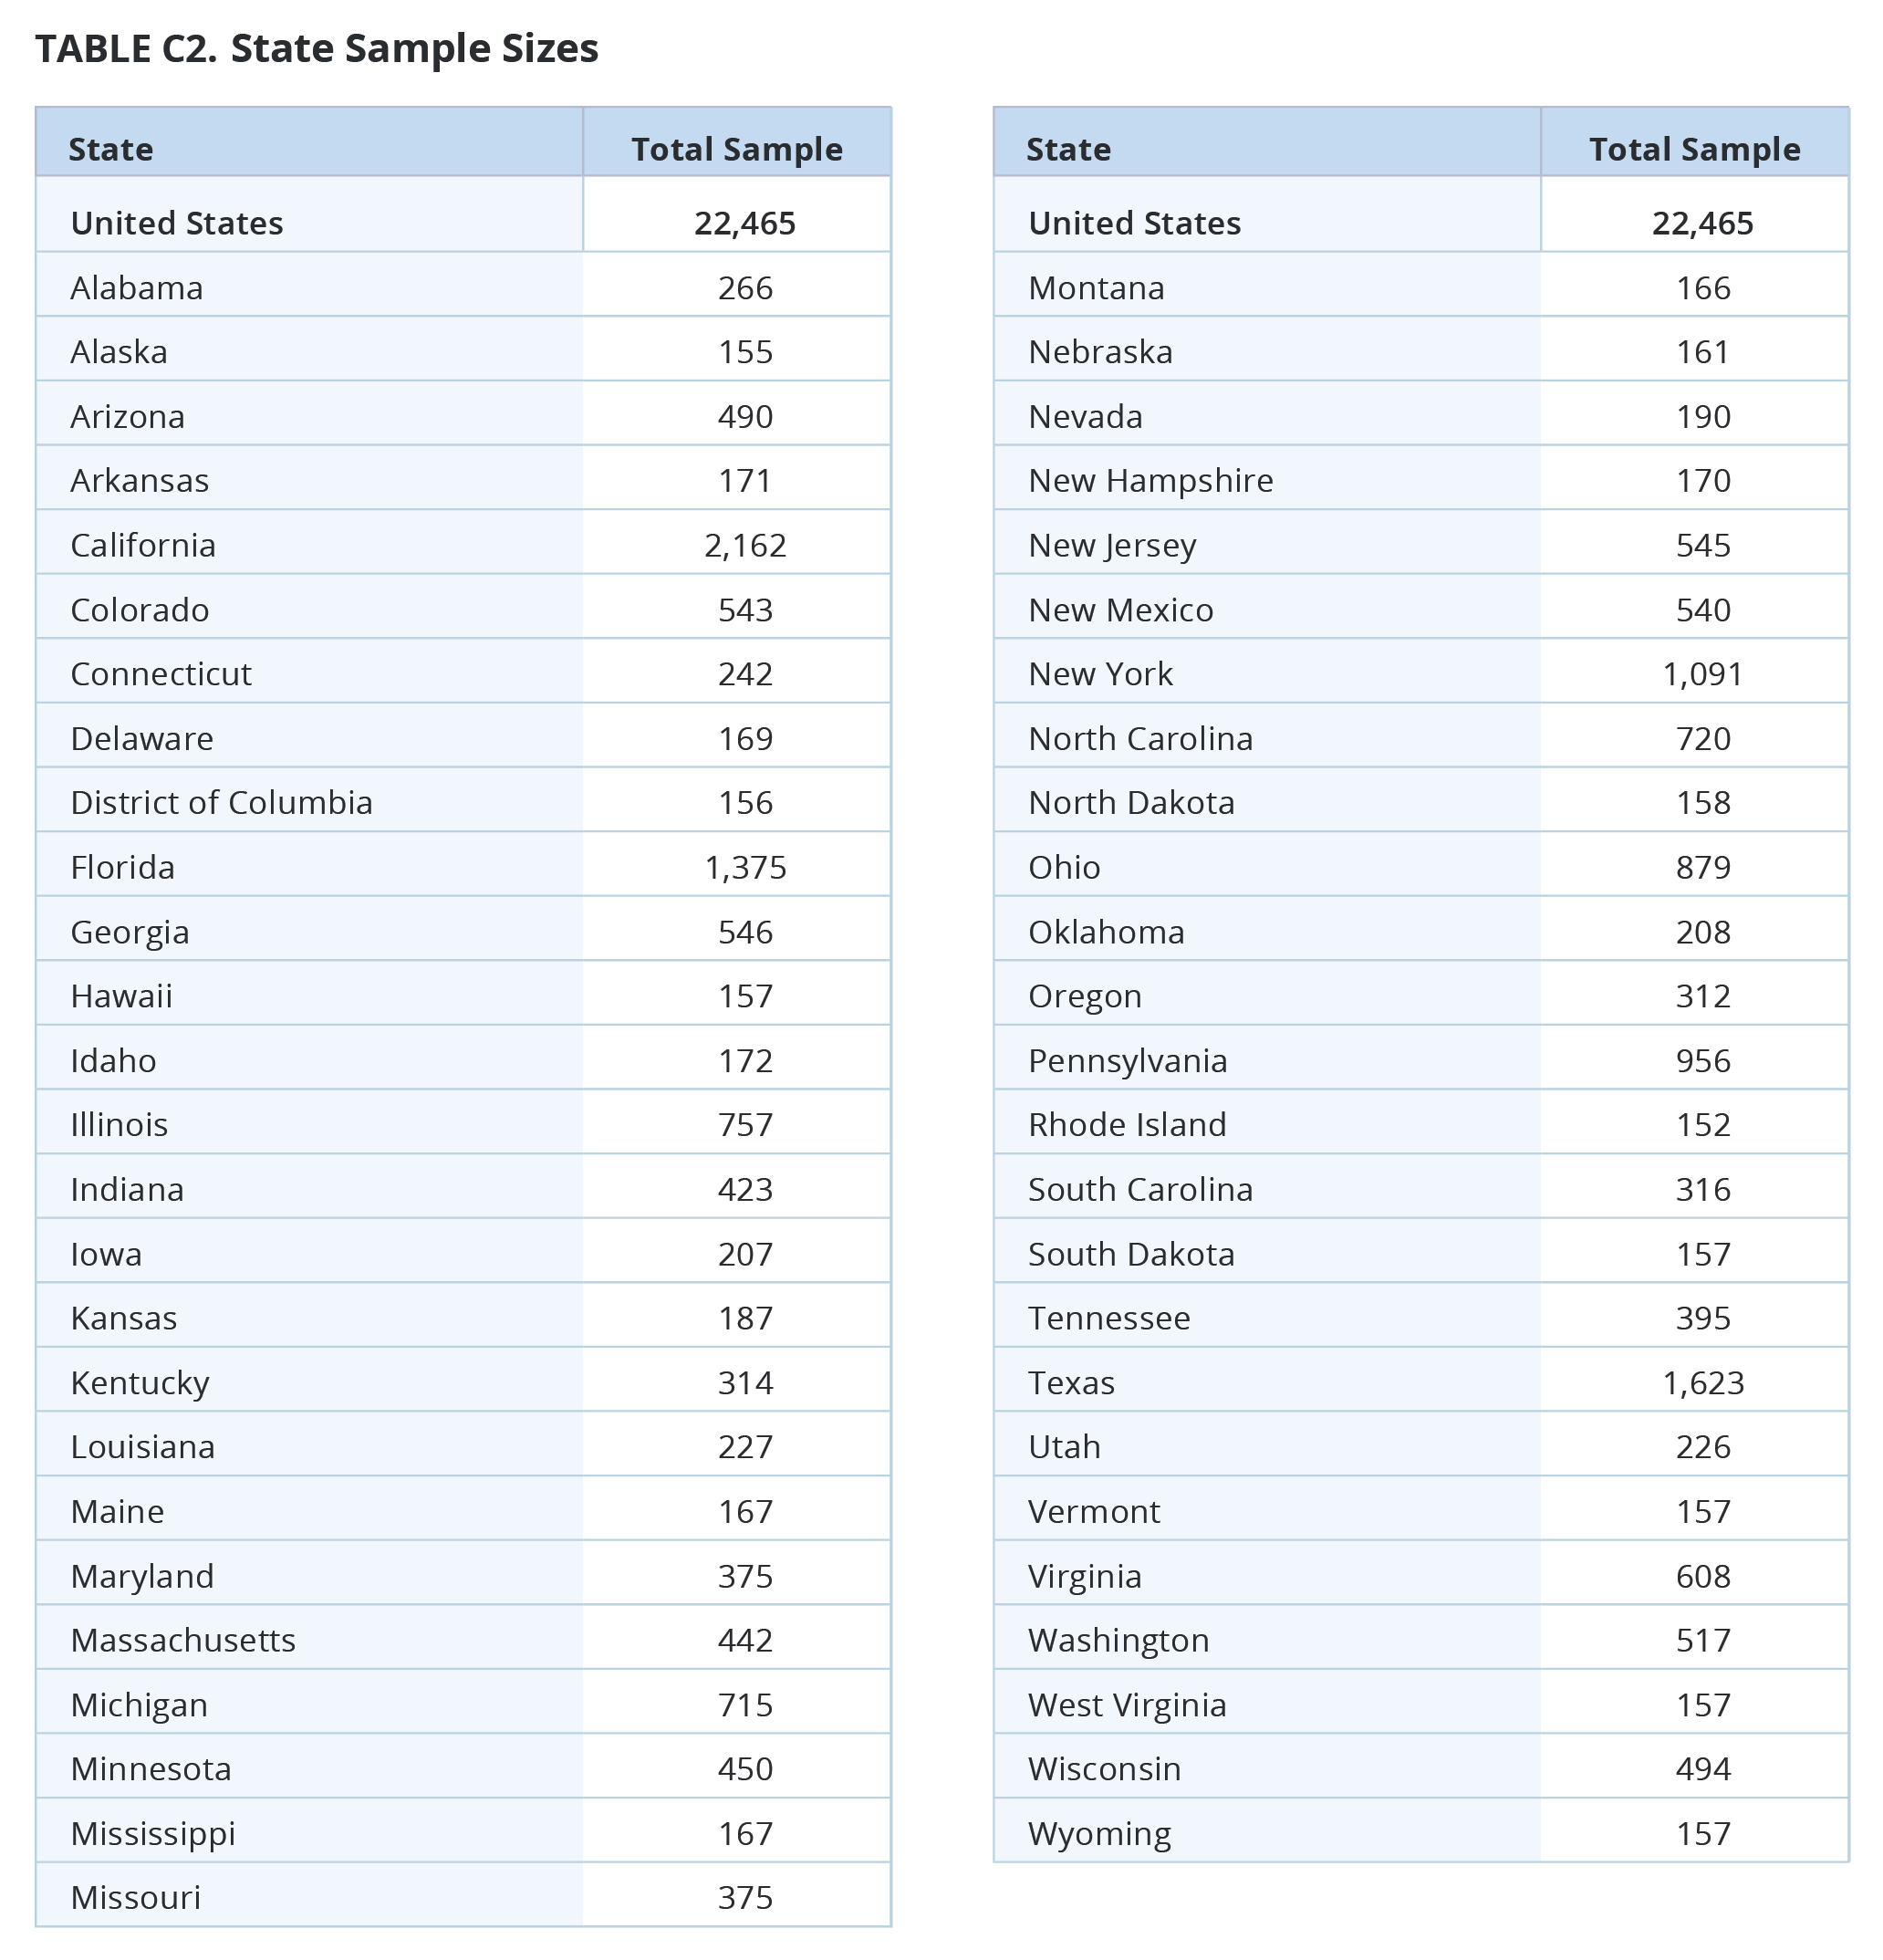
The survey was designed and conducted by PRRI. The survey was made possible through the generous support of the Arcus Foundation, the E. Rhodes and Leona B. Carpenter Foundation, the Gill Foundation, and the Unitarian Universalist Veatch Program at Shelter Rock. The survey was carried out among a random representative sample of 22,465 adults (age 18 and up) living in all 50 states and the District of Columbia. Among those, 20,799 are part of Ipsos’s KnowledgePanel and an additional 1,666 were recruited by Ipsos using opt-in survey panels to increase the sample sizes in smaller states. Interviews were conducted online between March 9 and December 7, 2023.
Respondents are recruited to the KnowledgePanel using an addressed-based sampling methodology from the Delivery Sequence File of the USPS – a database with full coverage of all delivery addresses in the U.S. As such, it covers all households regardless of their phone status, providing a representative online sample. Unlike opt-in panels, households are not permitted to “self-select” into the panel; and are generally limited to how many surveys they can take within a given time period.
The initial sample drawn from the KnowledgePanel was adjusted using pre-stratification weights so that it approximates the adult U.S. population defined by the 2022 March Supplement of the Current Population Survey (CPS), except language proficiency, which is not available from CPS, were obtained from the 2021 American Community Survey (ACS). Next, a probability proportional to size (PPS) sampling scheme was used to select a representative sample.
To reduce the effects of any non-response bias, a post-stratification adjustment was applied based on demographic distributions from the CPS. The post-stratification weight rebalanced the sample based on the following benchmarks: age, race and ethnicity, gender, Census division, metro area, education, and income. The sample weighting was accomplished using an iterative proportional fitting (IFP) process that simultaneously balances the distributions of all variables. Weights were trimmed to prevent individual interviews from having too much influence on the final results. In addition to an overall national weight, separate weights were computed for each state to ensure that the demographic characteristics of the sample closely approximate the demographic characteristics of the target populations. The state-level post-stratification weights rebalanced the sample based on the following benchmarks: age, race and ethnicity, gender, education, and income.
These weights from the KnowledgePanel cases were then used as the benchmarks for the additional opt-in sample in a process called “calibration.” This calibration process is used to correct for inherent biases associated with nonprobability opt-in panels. The calibration methodology aims to realign respondents from nonprobability samples with respect to a multidimensional set of measures to improve their representation.
The margin of error for the national survey is +/- 0.82 percentage points at the 95% level of confidence, including the design effect for the survey of 1.56. In addition to sampling error, surveys may also be subject to error or bias due to question wording, context, and order effects. Additional details about the KnowledgePanel can be found on the Ipsos website: https://www.ipsos.com/en-us/solution/knowledgepanel
[1] For an overview of how we measure gender identity and sexual orientation, please see Appendix A.
[2] Members of Generation Z were born after 1996; millennials were born between 1981 and 1996; members of Generation X were born between 1965 and 1980; baby boomers were born between 1946 and 1964; and members of the Silent Generation were born before 1964. In this report, Gen Z adults fall into the 18- to 25-year-old category.
[3] Battleground states include Arizona, Georgia, Michigan, Nevada, North Carolina, Pennsylvania, and Wisconsin.
[4] Prior to 2023, PRRI asked Americans how favorable they were toward “allowing gay and lesbian couples to marry legally.”
[5] The states with nondiscrimination protections for LGBTQ people are California, Colorado, Connecticut, Delaware, Hawaii, Illinois, Iowa, Maine, Maryland, Massachusetts, Michigan, Minnesota, Nevada, New Hampshire, New Jersey, New Mexico, New York, Oregon, Rhode Island, Utah, Vermont, Virginia, and Washington, as well as the District of Columbia. States were determined to fall into this category if they had laws explicitly protecting LGBTQ people from housing, employment, and public accommodations discrimination, https://www.lgbtmap.org/equality-maps/non_discrimination_laws
[6] The number of cases for Hindu Americans is 87. Results need to be interpreted with caution.
[7] Same-sex couples would be legally allowed to marry in the District of Columbia and 18 states: California, Connecticut, Delaware, Hawaii, Illinois, Iowa, Maine, Maryland, Massachusetts, Minnesota, Nevada, New Hampshire, New Jersey, New Mexico, New York, Rhode Island, Vermont, and Washington. In the rest of the states, same-sex marriage would become banned.
[8] For more information on the Christian nationalism scale, see Appendix B.


