

To view a PDF of findings presented October 22, 2025, click here. To view the release event featuring a panel discussion of the survey’s findings, click here.
Executive Summary
Americans remain pessimistic about the country’s direction and the state of the country, with sharp partisan reversals since 2024.
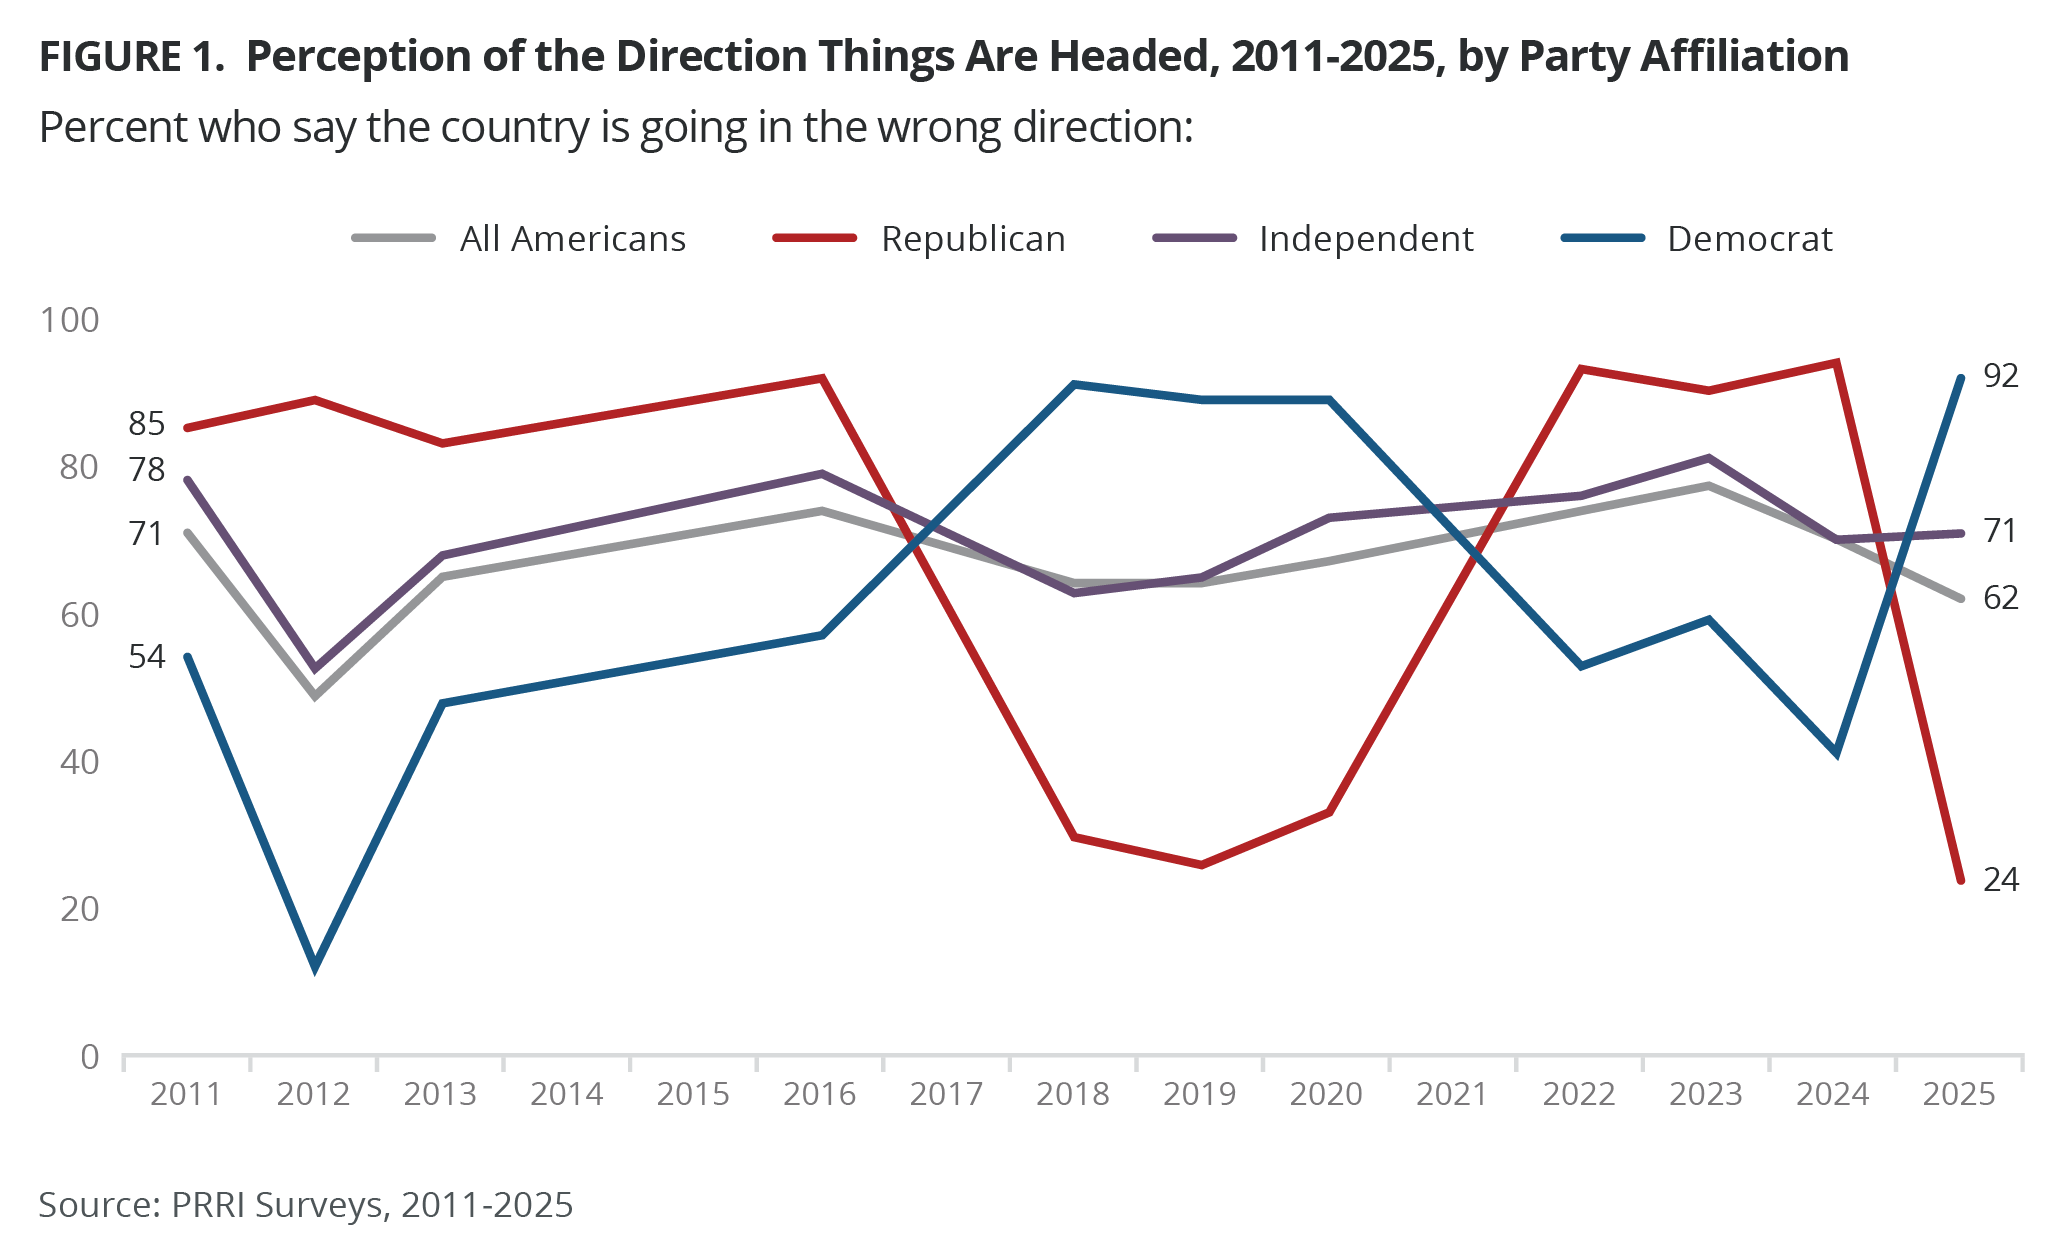
- Six in ten Americans (62%) believe things in the country are going in the wrong direction, including most Democrats (92%) and independents (71%), compared with 24% of Republicans. In 2024, 94% of Republicans, 70% of independents, and 41% of Democrats said the same.
- While partisanship has always colored Americans’ outlook on the direction of the country, partisan polarization has dramatically increased on this measure over time. In 2011, during Obama’s presidency, 85% of Republicans and 54% of Democrats said the country was going in the wrong direction — a 31-point gap. Today, the 68-point gap between Republicans and Democrats represents an all-time high.
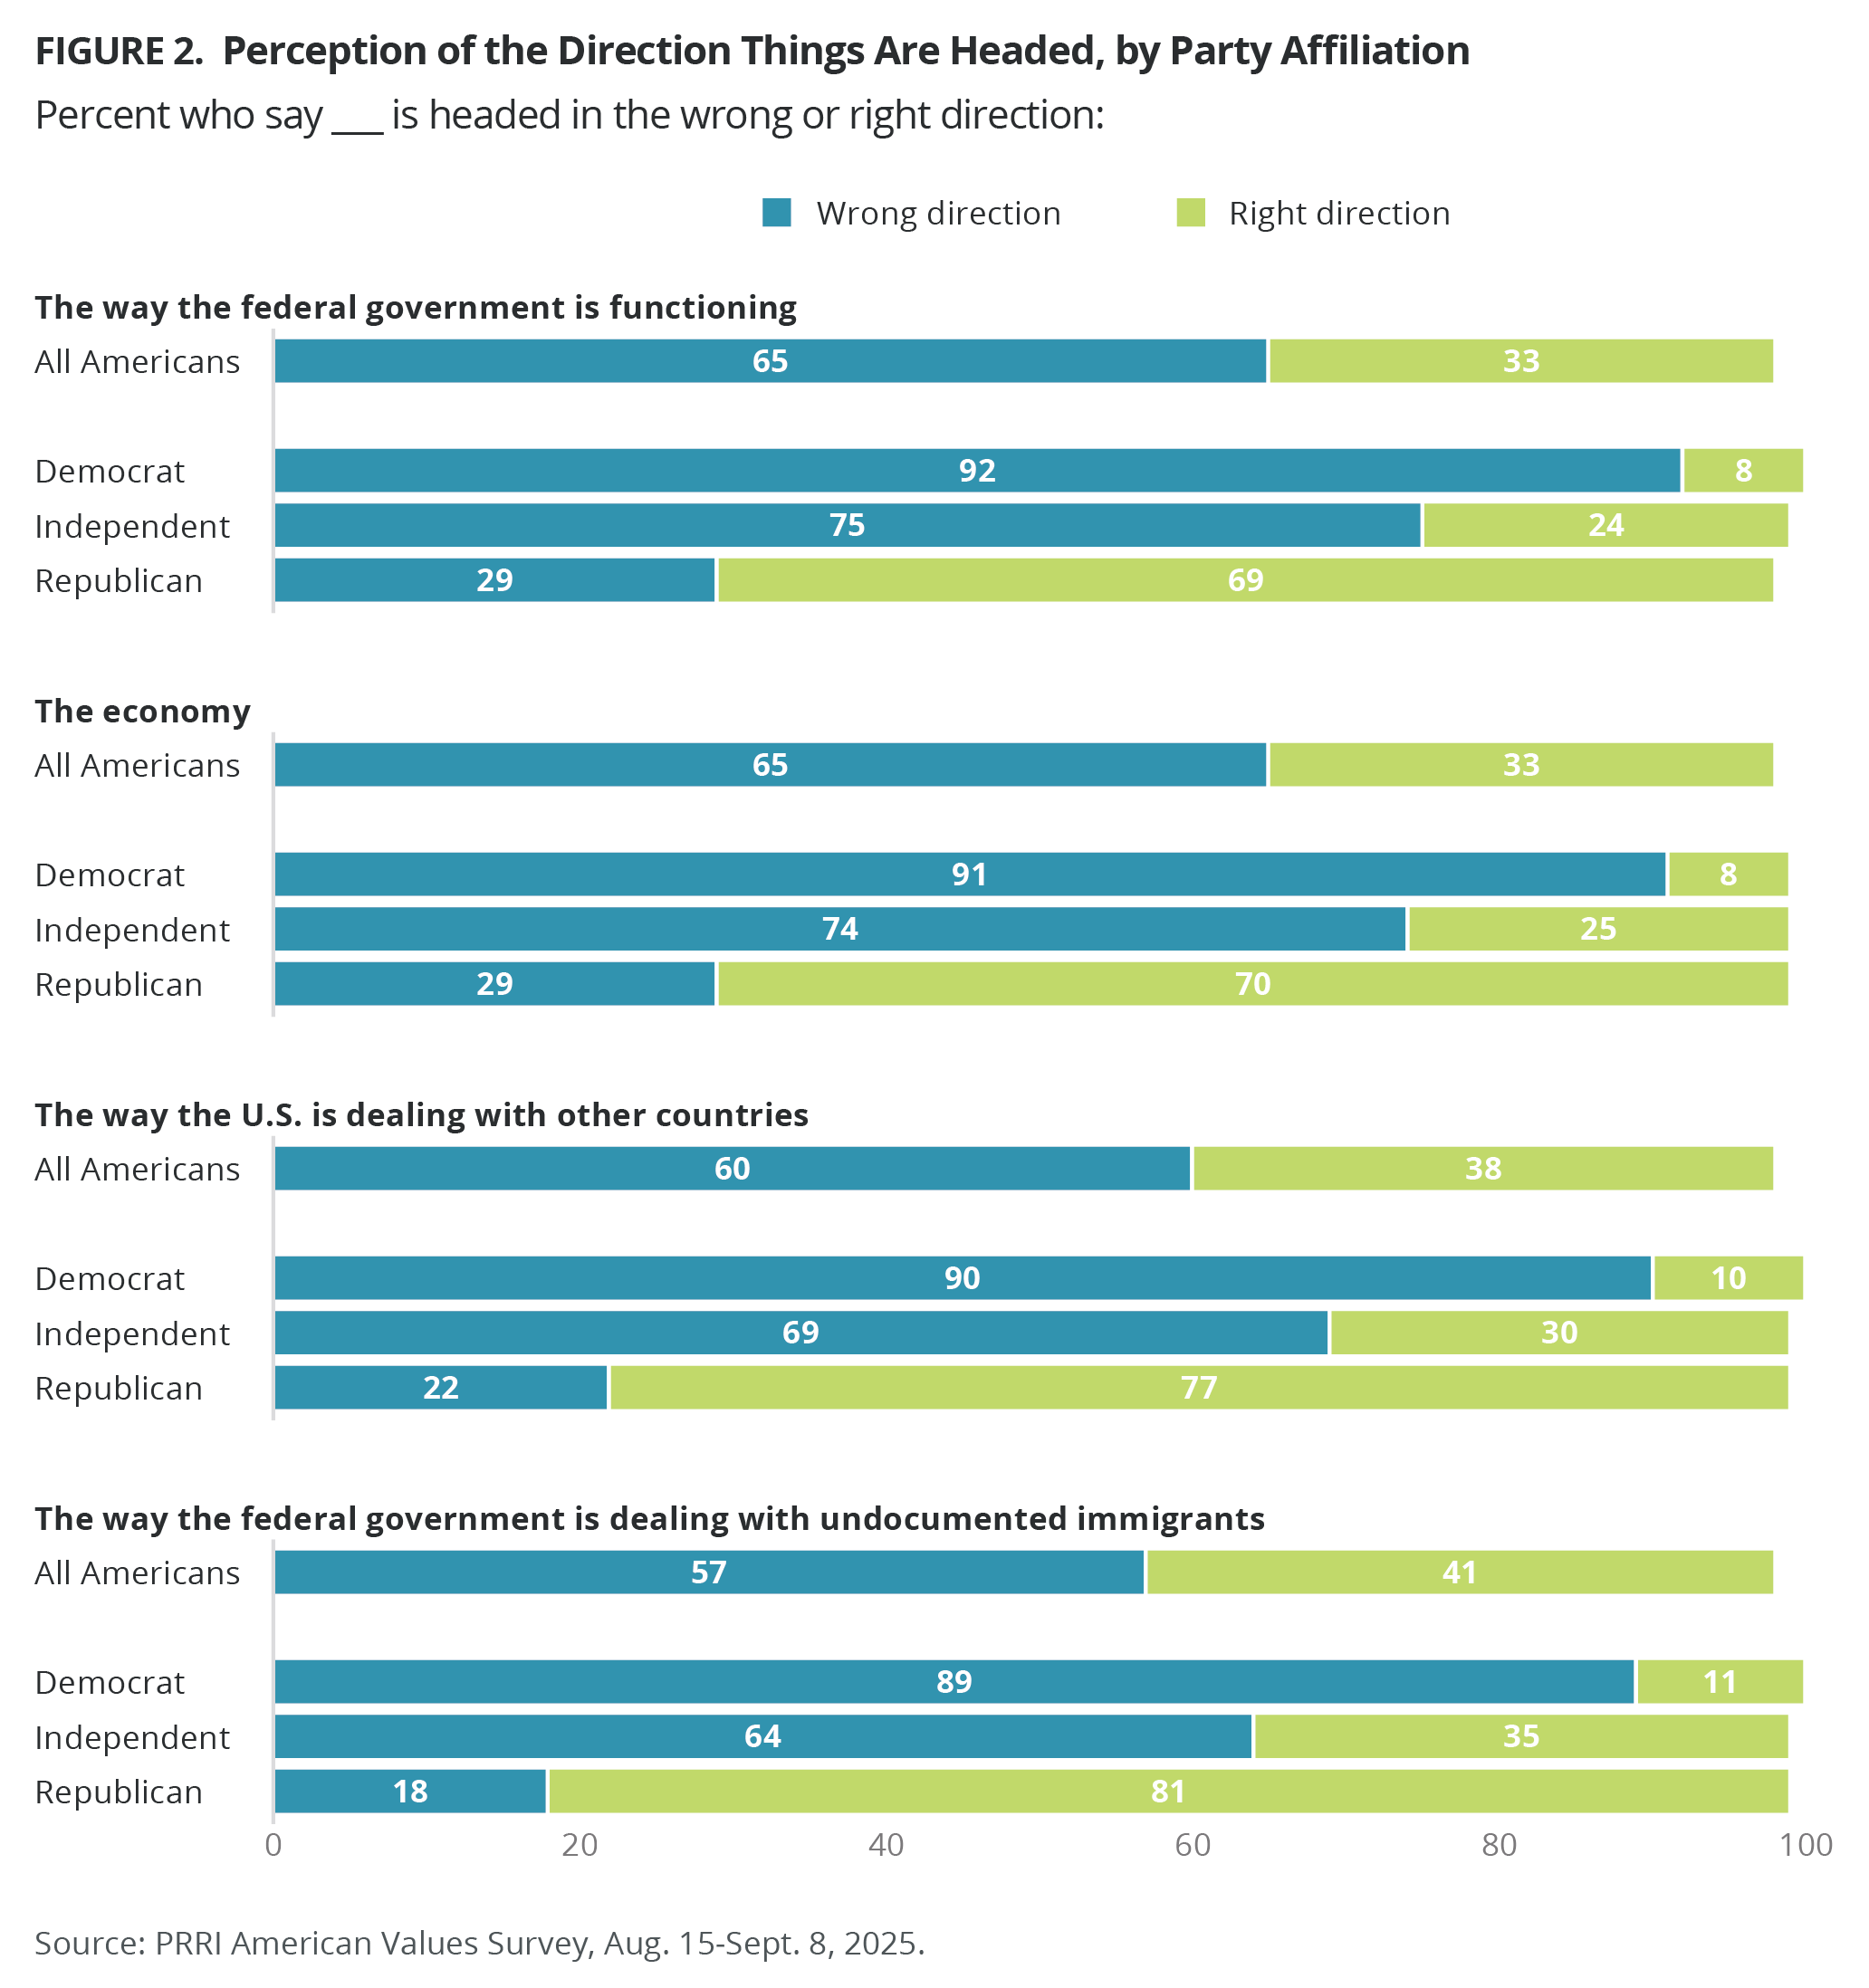
- Majorities of Americans say the economy (65%) and the ways the federal government is functioning (65%) or dealing with undocumented immigrants (57%) are headed in the wrong direction. Most Americans (60%) also say the way the U.S. is dealing with other countries is going in the wrong direction. Republicans rate these areas far more positively than Democrats and independents.
Inflation remains a main concern among all Americans; among Republicans, immigration and crime are the top critical issues, while the protection of basic rights, the health of democracy, and health care are the top critical issues for Democrats and independents.
- Majorities of Americans across party lines rate increasing the cost of housing and everyday expenses as a critical issue, though Democrats and independents are roughly 10 points more likely to do so than Republicans. Aside from inflation, Republicans are most likely to rank immigration (56%) and crime (53%) as critical issues.
- Majorities of both Democrats and independents rate the protection of basic rights such as free speech (65% vs. 52%) and health care (64% vs. 52%) as critical issues.
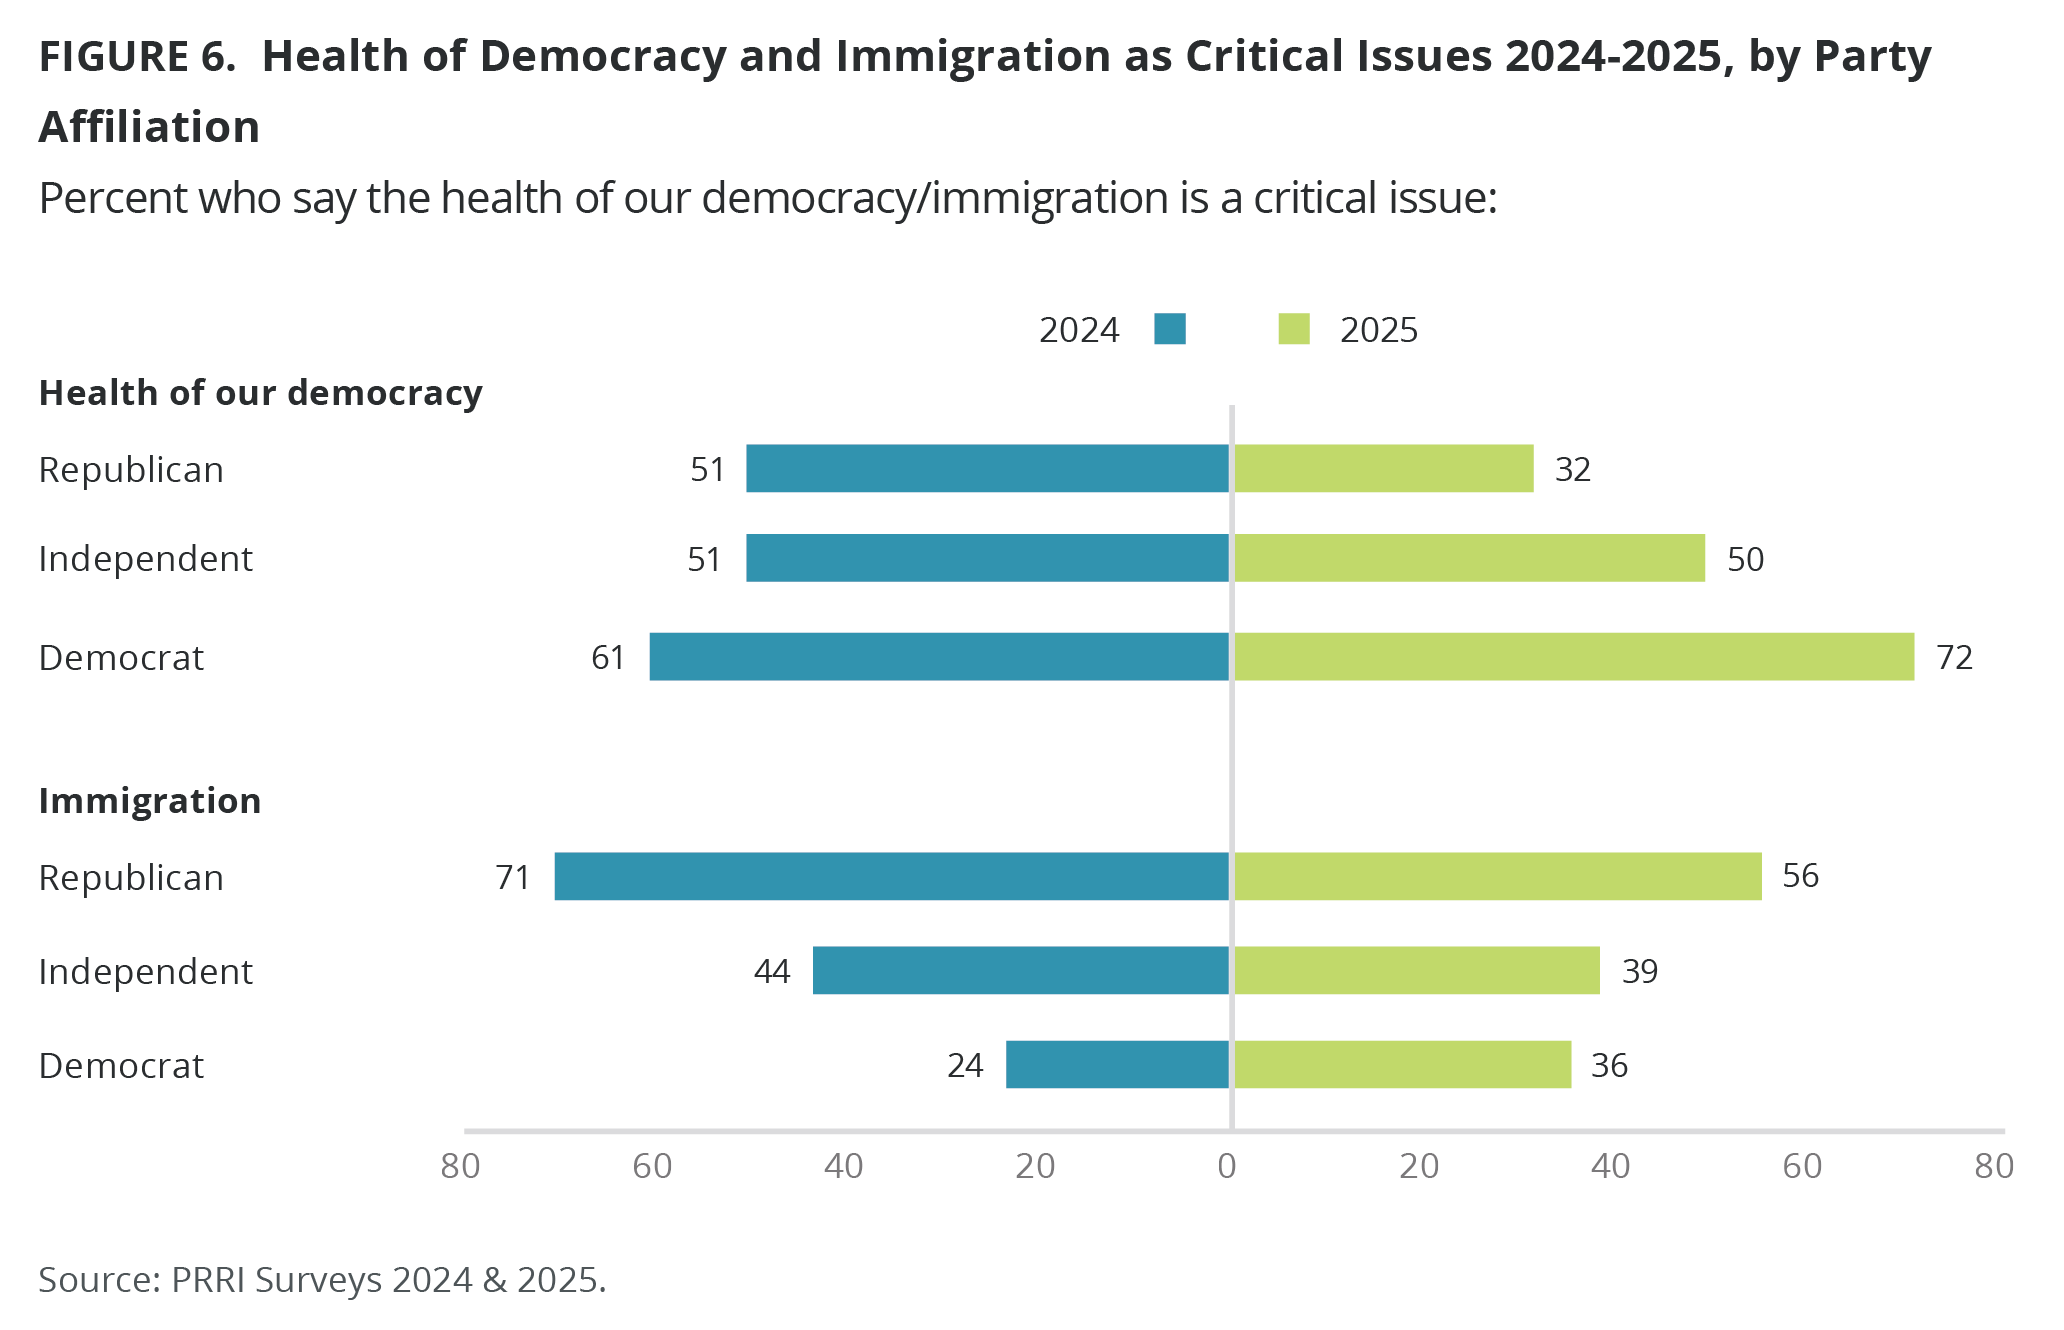
- More than seven in ten Democrats (72%) rate the health of our democracy as a critical issue, an increase from 61% in 2024.
At least half of Americans say recent federal changes have gone too far, and most disagree with federal control of colleges. Republicans, white Christian groups, and Hispanic Protestants are the least likely to share these views.
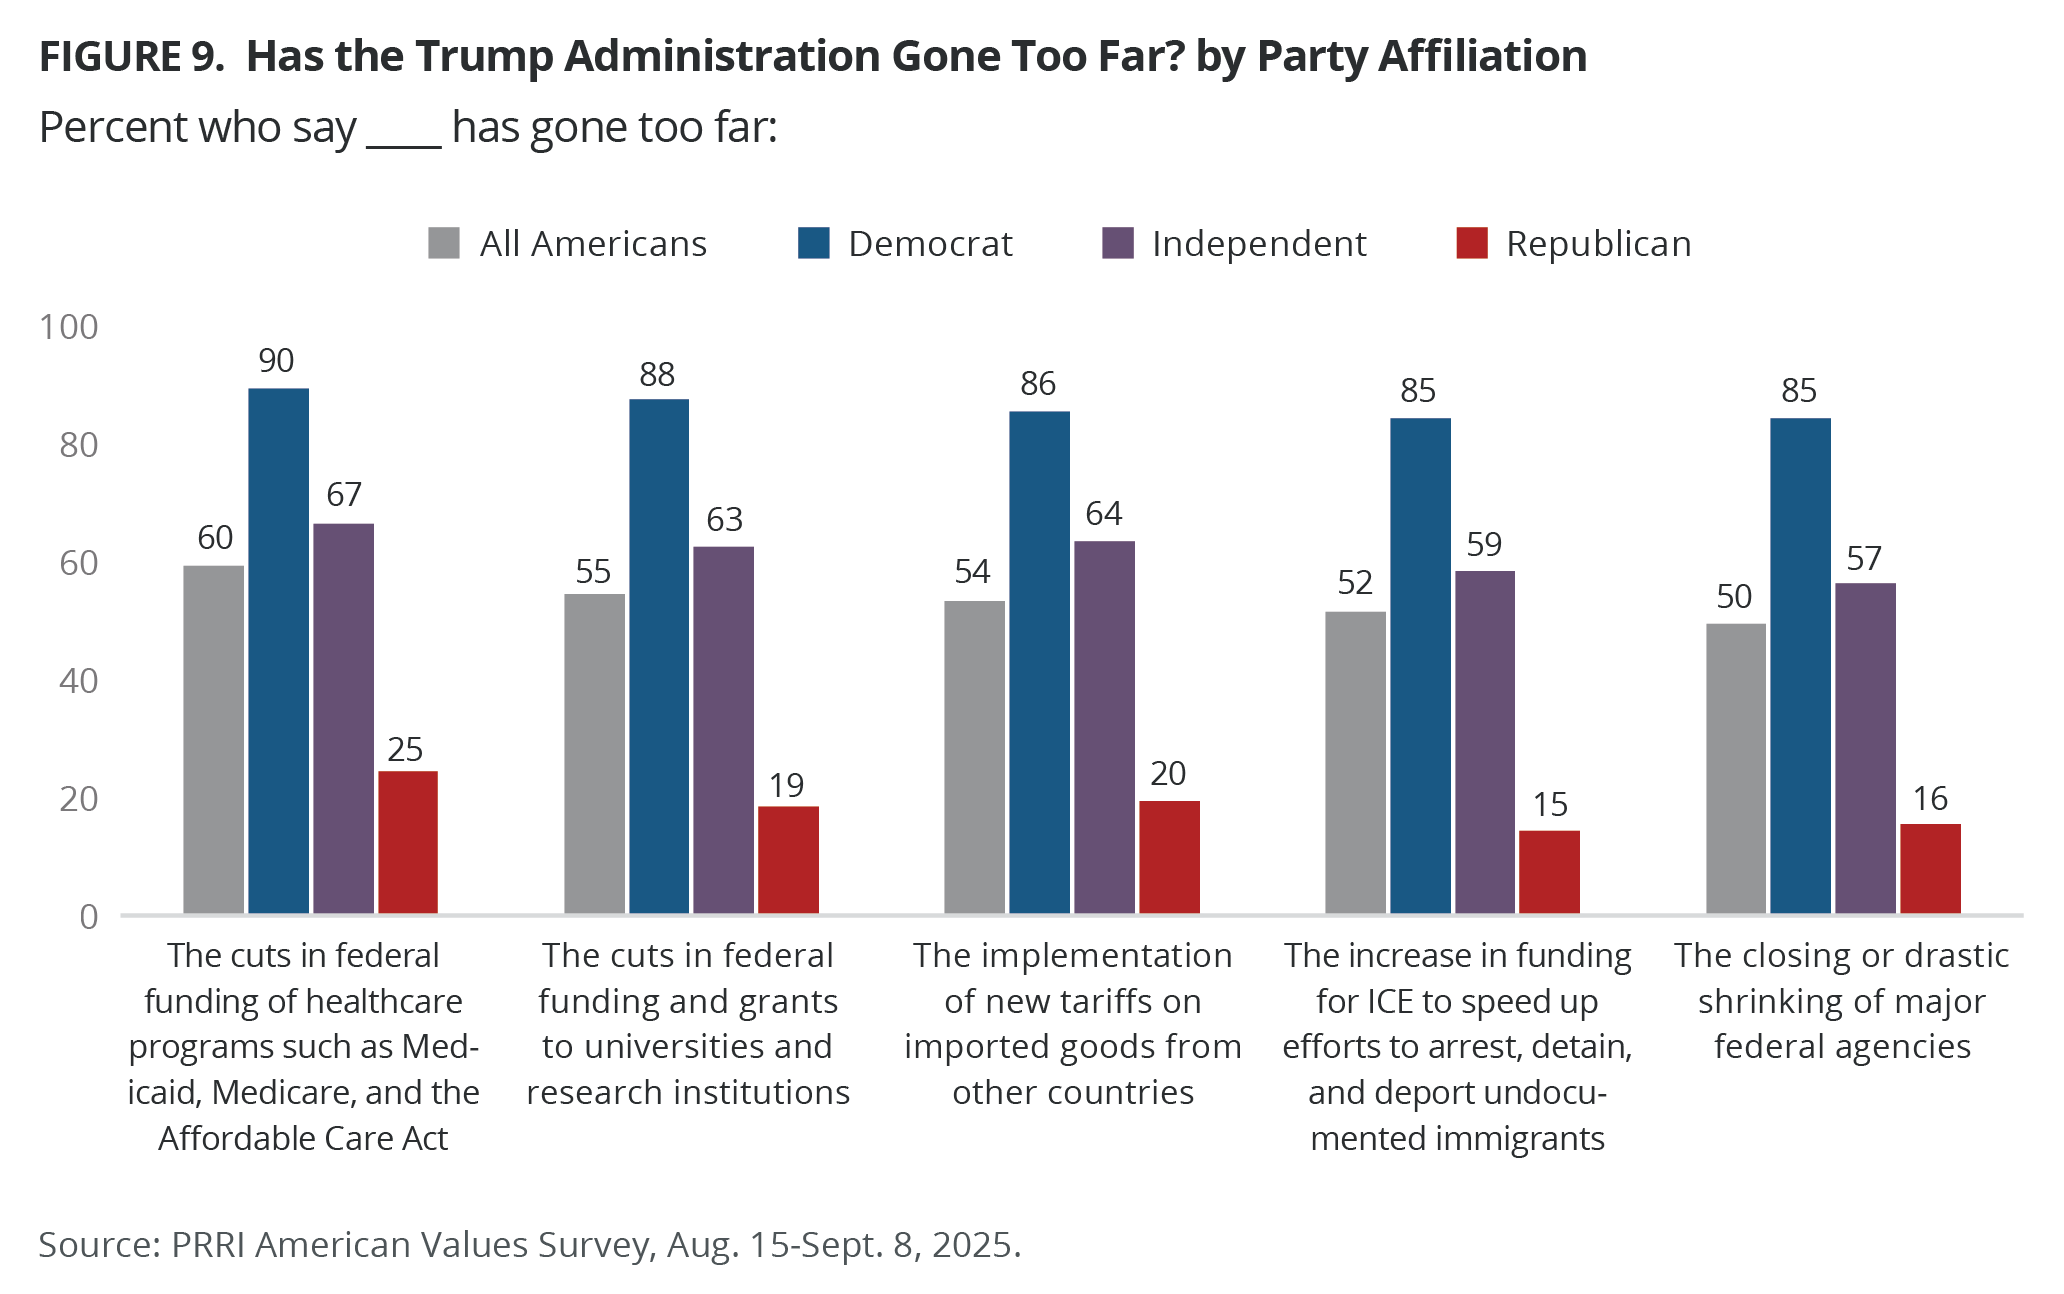
- Majorities say that the cuts in federal funding of health care programs (60%) and universities and research institutions (55%), the implementation of new tariffs on imported goods (54%), and the increase in funding for ICE to speed up efforts to arrest, detain, and deport undocumented immigrants (52%) have gone too far, though partisan differences are stark, with Democrats being far more likely to say such changes have gone too far.
- Most independents also agree that such changes have gone too far, including roughly two-thirds saying that cuts in federal funding for health care and research and higher education have gone too far.
- Except for white Christian groups and Hispanic Protestants, majorities of all other religious groups say federal changes have gone too far. However, a majority of Hispanic Protestants (57%) say the increase in funding for ICE to speed up deportations has gone too far.
- Most Americans (70%), including 58% of Republicans, disagree that the federal government should have the authority to control student admissions, faculty hiring, and curriculum at U.S. colleges and universities to ensure they do not teach inappropriate material.
Trump’s job approval and favorability are low, with deep partisan and racial divides, though Trump is also strongly underwater among independents.
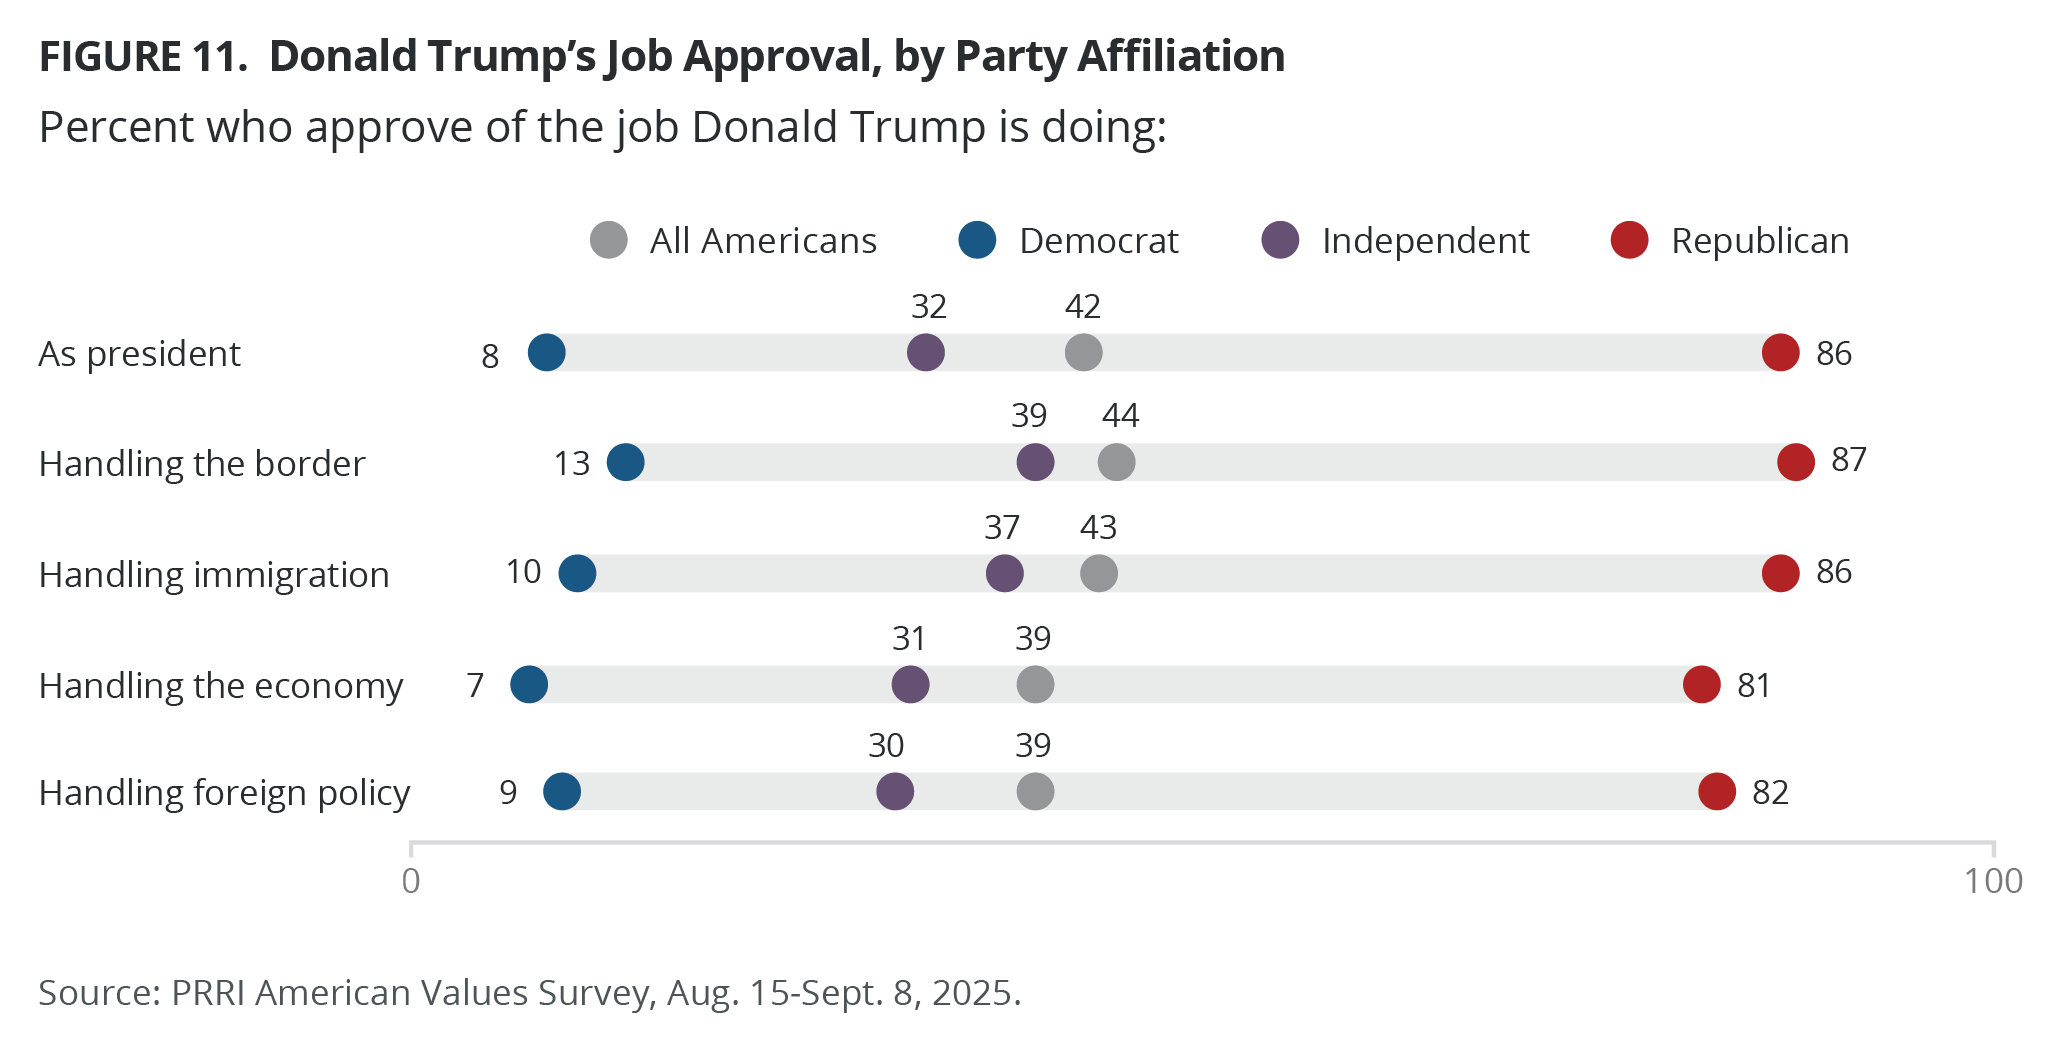
- While the majority of Americans disapprove of the job Donald Trump is doing as president (56%), most Republicans approve (86%), compared with 32% of independents, and just 8% of Democrats.
- Roughly four in ten Americans approve of the job Trump is doing in handling the border (44%), immigration (43%), the economy (39%), and foreign policy (39%). Most Republicans approve (around eight in ten) of his handling of these issues, compared with far fewer independents (around one-third) and Democrats (around one in ten).
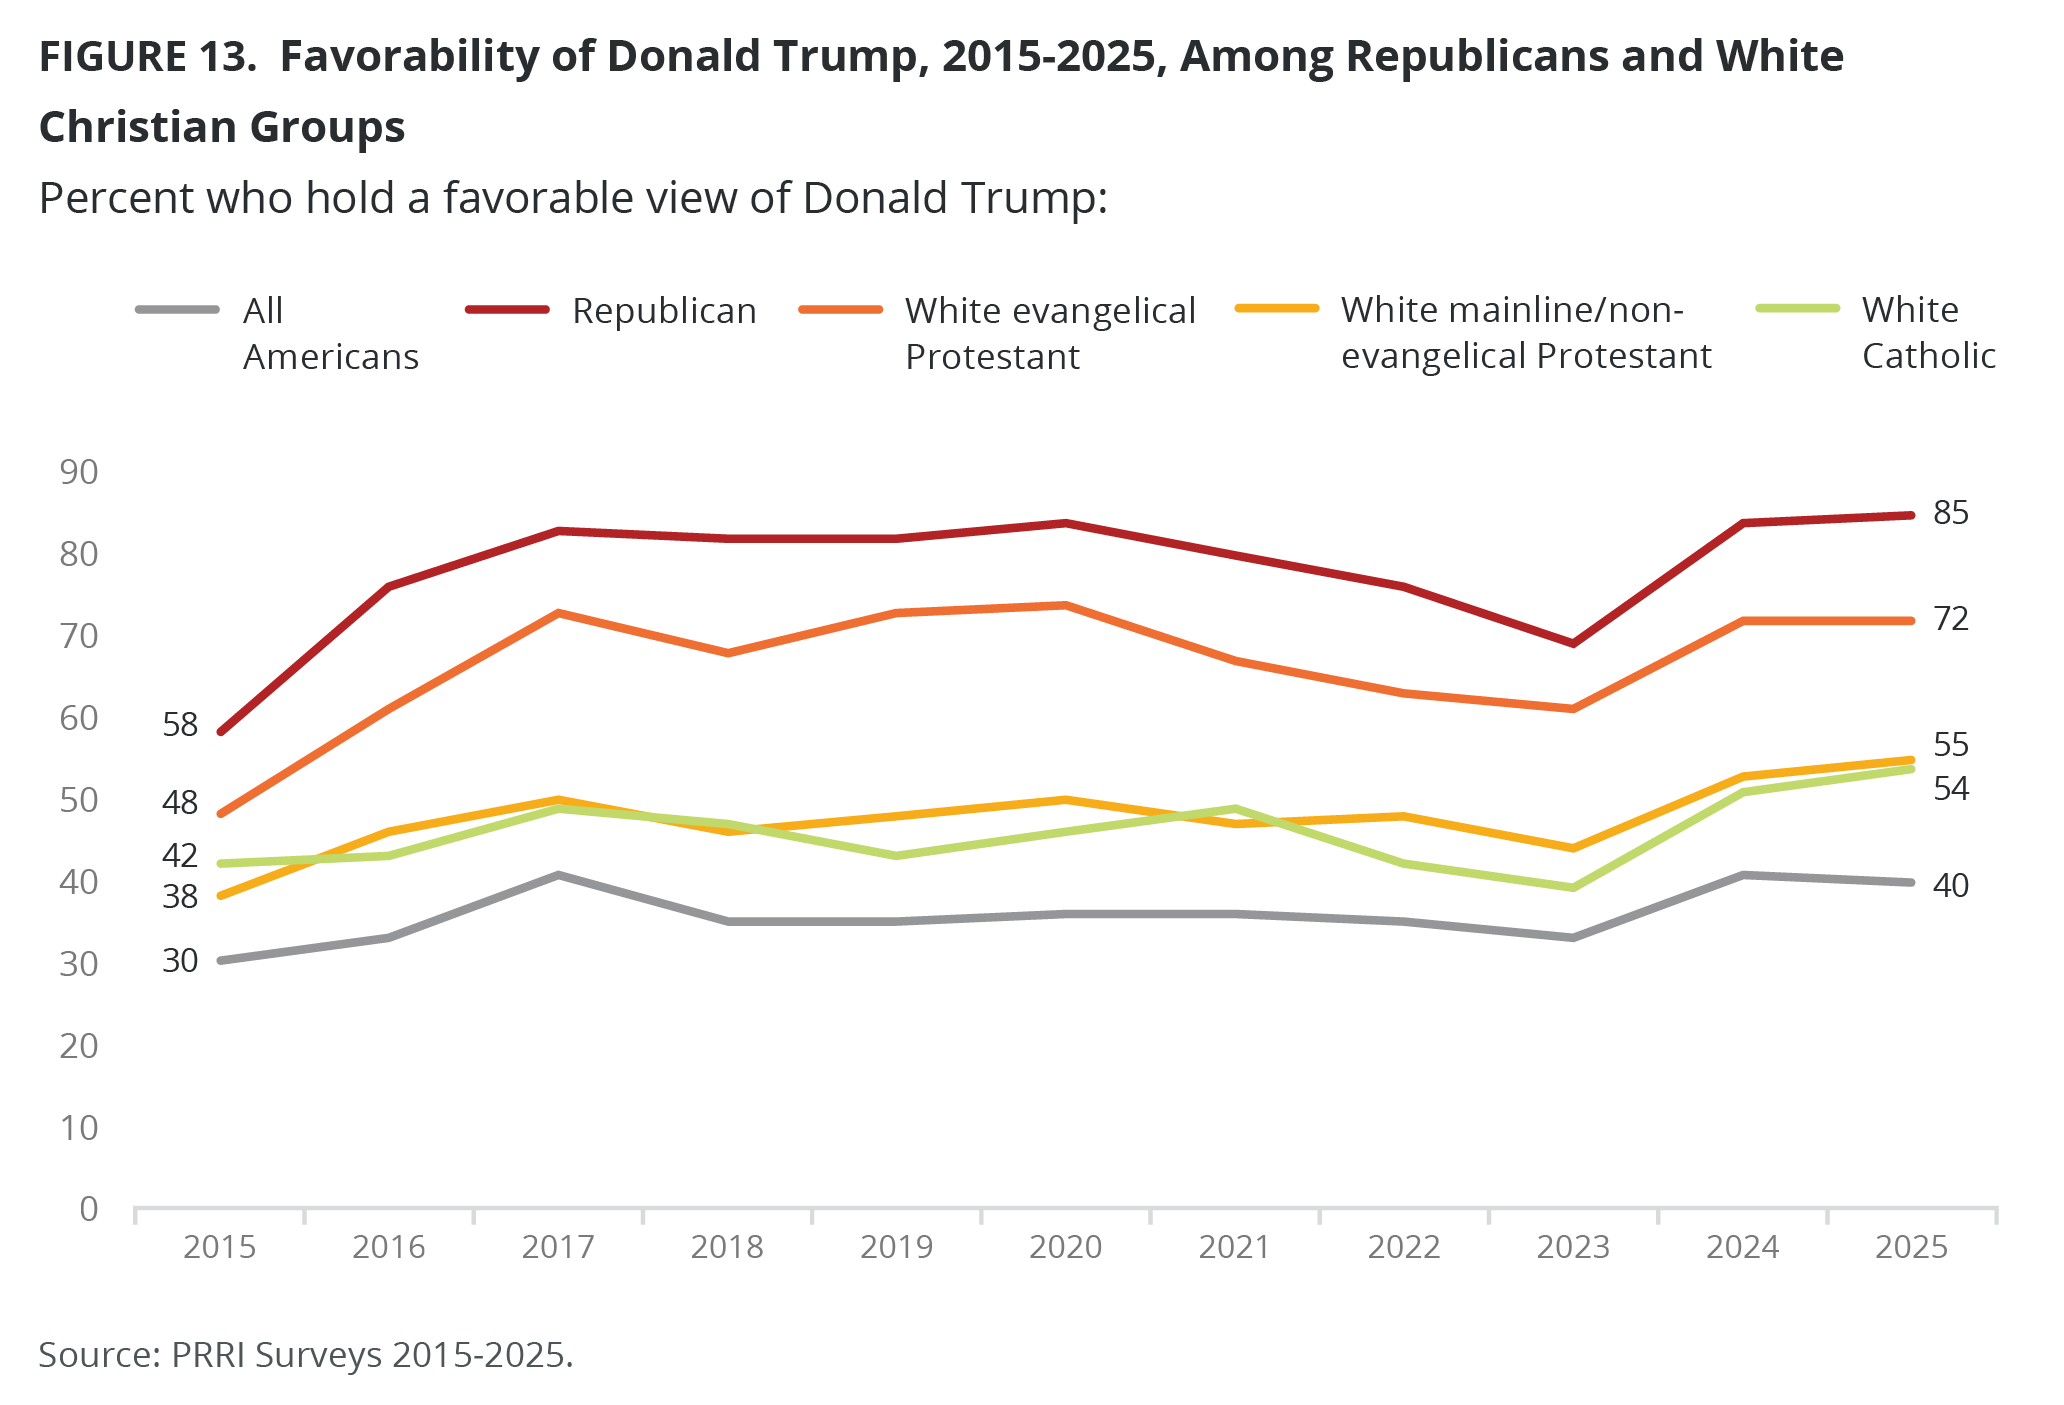
- Trump’s favorability mirrors his job approval: 40% favorable vs. 58% unfavorable.
- Around half of white Americans (48%) hold favorable views of the president, compared with just 16% of Black Americans and three in ten Hispanic and AAPI Americans. Trump’s favorability among Hispanic Americans has dropped from 39% in 2024 to 30%.
More Americans view Trump as a “dangerous dictator” rather than a “strong leader,” though views differ strongly by partisanship and religion.
- A majority of Americans agree “President Trump is a dangerous dictator whose power should be limited before he destroys American democracy” (56%), up from 52% in March 2025, compared with 41% who agree “President Trump is a strong leader who should be given the power he needs to restore America’s greatness.”
- Most Democrats (91%) and independents (65%) agree with the first statement, while most Republicans agree with the second statement (82%).
- Seven in ten white evangelicals (73%) agree that Trump is a strong leader, as do 54% of white mainline Protestants and 55% of white Catholics. In contrast, majorities of other religious groups view Trump more as a dangerous dictator, including 53% of Hispanic Protestants.
Americans are more likely to believe that Trump’s changes to the federal government represent an “assault” on constitutional checks and balances rather than a “long-overdue correction” of disastrous policies.
- Most Americans agree with the statement “What President Trump is doing to the federal government is an assault on constitutional checks and balances and the rule of law” (54%), compared with 43% who agree with the statement “What President Trump is doing to the federal government is a long-overdue correction of disastrous policies pushed by elites at the expense of ordinary Americans.”
- Most Democrats (87%) and independents (62%) agree with the first statement, while most Republicans agree with the second statement (82%).
- Majorities of Christian nationalism Adherents (77%) and Sympathizers (69%) view Trump’s changes as a “long-overdue correction,” compared with far fewer Christian nationalism Skeptics (45%) and Rejecters (12%).
Confidence in institutions varies widely with striking partisan differences.
- Majorities of Americans have confidence in the military (73%), the police (67%), and colleges and universities (57%).
- However, fewer than half of Americans have confidence in the Supreme Court (49%), the Department of Justice (47%), organized religion (44%), ICE (42%), the federal government (41%), news organizations (38%), and large corporations (34%).
- While majorities of both Republicans and Democrats express confidence in the military and the police, there are deep partisan divides with respect to trust in all other institutions.
Majorities of Americans, but especially independents, view the Republican and Democratic parties unfavorably.
- Around four in ten Americans (39%) hold favorable views of the Republican Party, while 35% hold a favorable view of the Democratic Party, though partisans largely hold favorable views of their own parties. Just three in ten independents hold favorable views of either party.
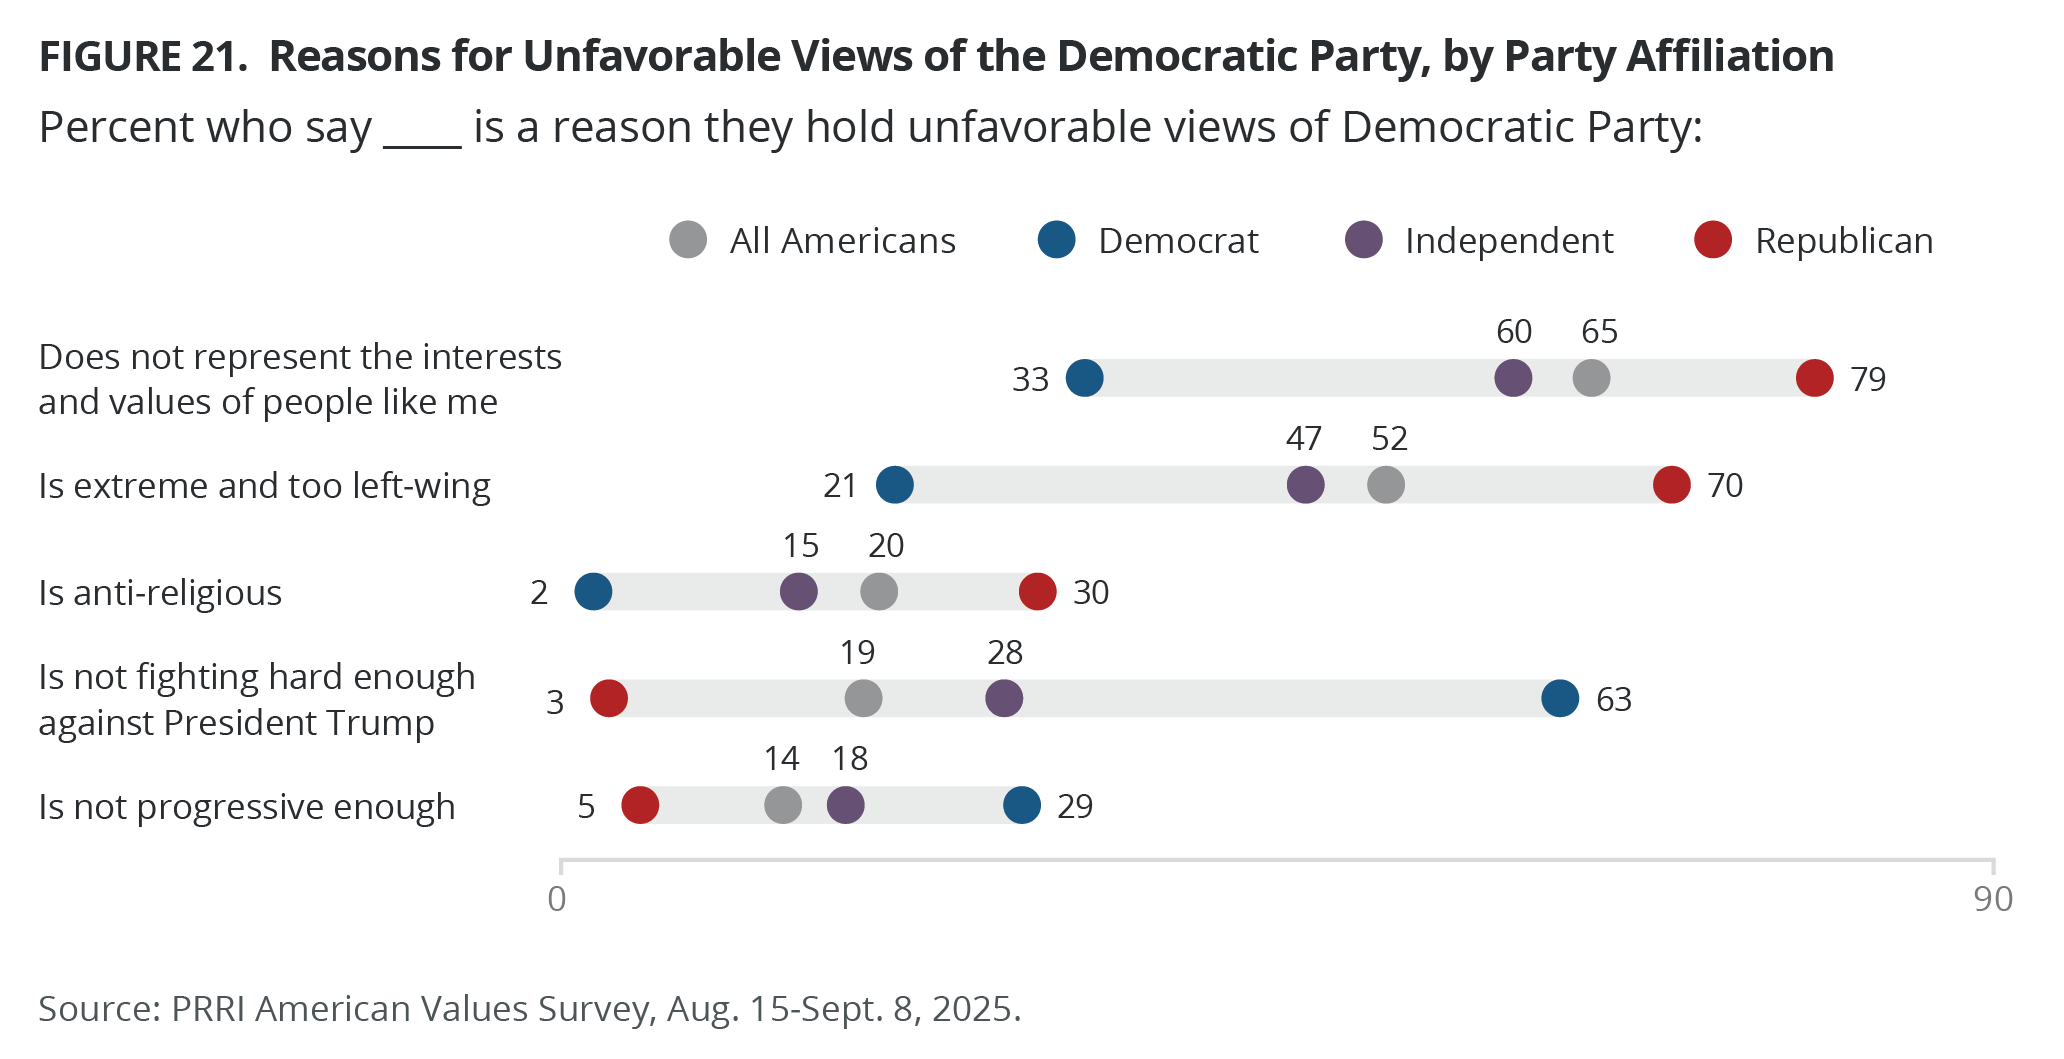
- Most Americans who hold unfavorable views of the Republican and Democratic parties say it is because they do not represent the interests and values of people like them (69% and 65%).
- More than half (56%) of Americans who rate the GOP unfavorably say it is because the party is too deferential to President Trump (56%) and that it is extreme and too right-wing (55%). Roughly half (52%) of Americans who hold unfavorable views of the Democratic Party say it is extreme and too left-wing.
- Four in ten Republicans who hold unfavorable views of their party say it is because the GOP is too deferential to Trump; more than six in ten Democrats who view their own party unfavorably say it is because their party is not fighting hard enough against President Trump.
Most Americans think free speech is less protected today, back SCOTUS term limits, and broadly support the separation of powers in American government.
- Most Americans (69%) agree that “the ability of Americans to freely criticize the government without fear of punishment is a right that seems less protected than in previous years,” including majorities of Democrats (86%), independents (73%), and Republicans (54%).
- Most Americans (75%) agree there should be term limits for U.S. Supreme Court justices, including Democrats (85%), independents (76%), and Republicans (67%).
- Only 16% of Americans agree with the statement “When decisions by Congress or the Supreme Court hold our country back, the president should be able to ignore them,” including 24% of Republicans, 14% of independents, and 10% of Democrats.
Support for potential political violence has declined slightly from its peak in September 2023; Republicans are still more likely to support political violence, though below Biden-era peaks.
- Most Americans (78%) disagree that “Because things have gotten so far off track, true American patriots may have to resort to violence in order to save our country,” compared with 17% of those who agree. Agreement peaked in September 2023 at 23%.
- Republicans (22%), whose support was higher during Biden’s presidency (ranging from 27%-35%), are more likely than independents (16%) and Democrats (12%) to agree that political violence may be necessary to save the country.
- Support for potential political violence to save the country is higher among those who score very high (38%) or high (25%) on the Right-Wing Authoritarian Scale (RWAS) and among Christian nationalism Adherents (33%) and Sympathizers (25%), compared with those who score low (13%) or very low (5%) on the RWAS and those who qualify as Christian nationalism Skeptics (15%) or Rejecters (10%).
Republicans are more likely to express pride in being an American than independents or Democrats; few express deep pride in America’s economic achievements or the way democracy is working in America today.
- Just half of Americans are extremely or very proud of being an American (50%) or of America’s 250-year history (48%): Most Republicans (80% and 77%, respectively) are extremely or very proud, compared with nearly half of independents (46% and 47%), and three in ten Democrats (31% and 28%).
- Fewer Americans are extremely or very proud of America’s economic achievements (32%), America’s good moral example for the world (23%), and the way democracy is working in America today (19%), though Republicans (60%, 45%, 41%) are prouder than independents (30%, 18%, 15%) and Democrats (16%, 9%, 7%).
There is a broad consensus on civic ideals as important traits to being truly American, but more disagreement as to whether being Christian or being of Western European heritage is necessary to being truly American.
- Most Americans say believing in individual freedoms (93%), the Constitution (91%), and the Declaration of Independence (88%), accepting diverse backgrounds (89%), respecting American political institutions and laws (88%), and speaking English (75%) are important to “being truly American.”
- Americans are mixed on whether belief in God (57%) and being born in the U.S. (54%) are true American traits. Fewer Americans say being Christian (43%), having military-ancestor ties (42%), or Western European heritage (23%) are important to being truly American.
- There are wide partisan divides, with Republicans most likely to rate nearly all traits as important to being truly American, while Democrats prioritize civic ideals more than identity traits.
- White Christians and Christians of color place more emphasis than non-Christians or the religiously unaffiliated on the belief in God, being born in America, and Christian identity as being important to being truly American. Christian nationalism Adherents and Sympathizers also place more emphasis on military ancestry than other Americans.
Most Americans remain committed to a vision of America that is religiously diverse. Strong majorities also agree that America is best understood as a nation built on the idea that all people have equal rights and freedoms rather than as a nation comprised of people with a shared heritage and homeland.
- About two-thirds of Americans, including most Democrats (85%) and independents (70%), say they would prefer the U.S. to be a nation made up of people belonging to a wide variety of religions, compared with 32% of Americans who say they would prefer a nation primarily made up of people who follow the Christian faith. Most Republicans (55%) agree with the second statement.
- A majority of white evangelical Protestants 67% and Hispanic Protestants 58% favor a primarily Christian nation, while most other religious groups prefer diversity.
- Most Americans (78%) agree “America is best understood as a nation built around the idea that all people, regardless of the circumstances of their birth or station in life, have equal rights and freedoms,” including 70% of Republicans. Just 19% believe that “America is best understood as a nation comprised of people with a shared heritage and homeland.”
Most Americans agree that empathy is a moral value that is a foundation of a healthy society, rather than a dangerous emotion that undermines society.
- Most Americans agree with the statement “Empathy is a moral value that is the foundation of a healthy society” (80%), compared with 16% who agree with the statement “Empathy is a dangerous emotion that undermines our ability to set up a society that is guided by God’s truth.” While a majority of Republicans agree with the first statement (72%), they are more likely to agree with the second statement (25%) than independents (14%) and Democrats (8%).
- Nearly four in ten (37%) Christian nationalism Adherents say empathy is a dangerous emotion that undermines the ability to set up a society guided by God’s truth.
Democrats are now more likely than Republicans to agree that things have changed so much, they often feel like strangers in their country.
- Nearly half of Americans (46%, up from 41% in 2016) agree that “Things have changed so much that I often feel like a stranger in my own country,” while 51% disagree.
- The last time PRRI asked this question in 2022, 65% of Republicans agreed with this sentiment; by 2025, Republican agreement dropped to 30%. For the first time, Democrats, today, are far more likely to express cultural alienation in America, with 59% agreeing that they feel like a stranger in their own country — up from 42% in 2022 and 33% in 2016.
Most Americans do not agree that discrimination against Christians and white Americans has become as big a problem as discrimination against other minority groups, though views differ by party and religion.
- Nearly four in ten Americans agree that discrimination against Christians (37%) and white Americans (39%) has become as big a problem as discrimination against other groups, including 62% and 66% of Republicans, compared with two in ten Democrats (20% and 18%, respectively).
- White evangelical Protestants are the only religious group where the majority believe discrimination against Christians (65%) and white Americans (63%) has become as big a problem as discrimination against other groups.
Most Americans agree that immigrants strengthen American society and disagree with the Great Replacement Theory.
- Most Americans (57%) agree that the growing number of newcomers from other countries strengthens American society, while 41% disagree. Agreement has fallen from 63% in 2022 and is driven mainly by changes in Republicans’ and independents’ stances.
- About two-thirds of Americans (65%) disagree with the idea that “Immigrants are invading our country and replacing our cultural and ethnic background.” Republicans (62%) are more likely than independents (26%) and Democrats (10%) to agree.
Most Americans support preserving immigrant rights and protections, but views are sharply polarized, with Republicans consistently showing the least support.
- Two-thirds of Americans (67%) favor the “U.S. Constitution’s existing guarantee that all children who are born in the United States are automatically granted U.S. citizenship, regardless of their parents’ citizenship status.” Most Democrats (88%) and independents (71%) are in favor, compared with 47% of Republicans.
- About six in ten Americans (61%) agree “Immigrants, regardless of legal status, should have basic rights and protections such as the ability to challenge their deportation before a judge in court.” Most Democrats (88%) and independents (67%) agree, compared with just one-third of Republicans (34%).
- Six in ten Americans (60%) favor allowing immigrants brought illegally to the U.S. as children to gain legal resident status, while 36% oppose. Democrats (84%) and independents (64%) are more likely than Republicans (38%) to favor this policy.
Support for a pathway to citizenship remains the majority position among Americans, though partisans differ. Among religious groups, Hispanic Protestants differ from white Christians, particularly white evangelical Protestants, in their support.
- Six in ten Americans (60%) say that immigrants living in the United States illegally should be given a pathway to become citizens, provided they meet certain requirements, a slight decline from 63% in 2013.
- Among Republicans, support for a pathway to citizenship has dropped from 53% in 2013 to 40% in 2025, and support for identifying and deporting undocumented immigrants increased from 32% to 48%.
- More than six in ten Hispanic Protestants (63%) support a pathway to citizenship, compared with 56% of white mainline/non-evangelical Protestants, 54% of white Catholics, and 46% of white evangelical Protestants.
While most Americans disagree with punitive immigration measures, Republicans are the most likely to agree.
- About two-thirds of Americans (65%) oppose the U.S. government deporting undocumented immigrants to foreign prisons in El Salvador, Rwanda, or Libya without due process, while 32% favor. Republicans (62%) are more likely than independents (25%) and Democrats (10%) to favor this policy.
- Most Americans (63%) oppose arresting and detaining undocumented immigrants who have resided in the United States with no criminal record, compared with 33% who favor. Most Republicans (61%) favor this policy, compared with just 26% of independents, and one in ten Democrats (12%).
- Six in ten Americans (58%) disagree that the federal government should detain immigrants who are in the country illegally in internment camps until they can be deported, while over one-third agree (37%). Republicans (69%) are far more likely than independents (32%) and Democrats (13%) to agree.
Most Americans disagree that ICE agents should be allowed to conceal their identity, though Christian nationalists are far more supportive of ICE’s use of masks or unmarked vehicles than other Americans.
- Nearly six in ten Americans (58%) agree that “Immigration and Customs Enforcement (ICE) officers should not be allowed to conceal their identity with masks or use unmarked vehicles when arresting people,” including most Democrats (84%) and independents (64%). Just three in ten Republicans (31%) agree.
- Except for white Christian groups, majorities agree that ICE officers should not be allowed to conceal their identity with masks or use unmarked vehicles during arrests, including 67% of Hispanic Protestants. In contrast, 48% of white Catholics, 46% of white mainline/non-evangelical Protestants, and 34% of white evangelical Protestants agree.
- Most Christian nationalism Rejecters (84%) and Skeptics (59%) agree that ICE officers should not be allowed to conceal their identity, compared with 42% of Sympathizers and 36% of Adherents.
There are wide partisan and religious divides on whether society has become too soft and feminine. Yet, most Americans disagree that young men are struggling more than young women today or that gains that women have made come at the expense of men.
- Over four in ten Americans (42%) agree that society has become too soft and feminine, while a majority disagree (54%). The partisan divide has widened sharply. Two-thirds of Republicans (67%) now agree that society has become too soft and feminine, up from 53% in 2011, while just 20% of Democrats agree today, down from 30% in 2011.
- Among religious groups, only white evangelical Protestants (60%) show majority agreement that society is too soft and feminine, followed by half of white Catholics (51%) and Hispanic Protestants (50%).
- Over four in ten Americans (42%) agree that “Today, young men are struggling more than young women to find their place in society,” while 53% disagree. Republicans (48%) are more likely than independents (44%) and Democrats (37%) to agree.
- However, most Americans (75%) reject the notion that the gains women have made in recent years have come at the expense of men, with 21% agreeing, including 28% of Republicans, 21% of independents, and 12% of Democrats.
The State of the Country
The Right or Wrong Direction?
The Country
Most Americans say things in the country are going in the wrong direction (62%), compared with 36% who say the country is going in the right direction. While views about the direction of the country are more optimistic than in 2024 (70% wrong vs. 29% right), perceptions are strongly polarized along partisanship. This year, most Democrats say the country is going in the wrong direction (92%), compared with 24% of Republicans. By contrast, in September 2024 — two months before the last presidential election, under President Joe Biden — most Republicans (94%) said the same, compared with 41% of Democrats. Roughly seven in ten independents (71%) said the country is going in the wrong direction, which mirrors findings from last year.
Federal Government Functioning
Most Americans say the way the federal government is functioning is going in the wrong direction (65%), compared with one-third who say it is going in the right direction (33%). Solid majorities of Democrats (92%) and independents (75%) say the way the federal government is functioning is going in the wrong direction, compared with 29% of Republicans. Most Republicans say it is going in the right direction (69%).
Economy
About two-thirds of Americans say the economy is going in the wrong direction (65%), while one-third say that the economy is going in the right direction (33%). This outlook is more optimistic than last year (69% wrong, 29% right). Most Democrats (91%) and independents (74%) say the economy is going in the wrong direction, compared with 29% of Republicans. These views are opposite to those in September 2024, when 93% of Republicans, 69% of independents, and 42% of Democrats said the economy was going in the wrong direction.
Foreign Affairs
Most Americans say the way the U.S. is dealing with other countries is going in the wrong direction (60%), while 38% say it is going in the right direction. Republicans overwhelmingly support U.S. foreign policy (77%), compared with just 30% of independents and 10% of Democrats.
Immigration
Most Americans also say that the way the federal government is dealing with undocumented immigrants is going in the wrong direction (57%), compared with 41% who say it is going in the right direction. Majorities of Democrats (89%) and independents (64%) say the way the federal government is dealing with undocumented immigrants is going in the wrong direction, compared with just 18% of Republicans. Most Republicans say that it is going in the right direction (81%).
Change Since the 1950s
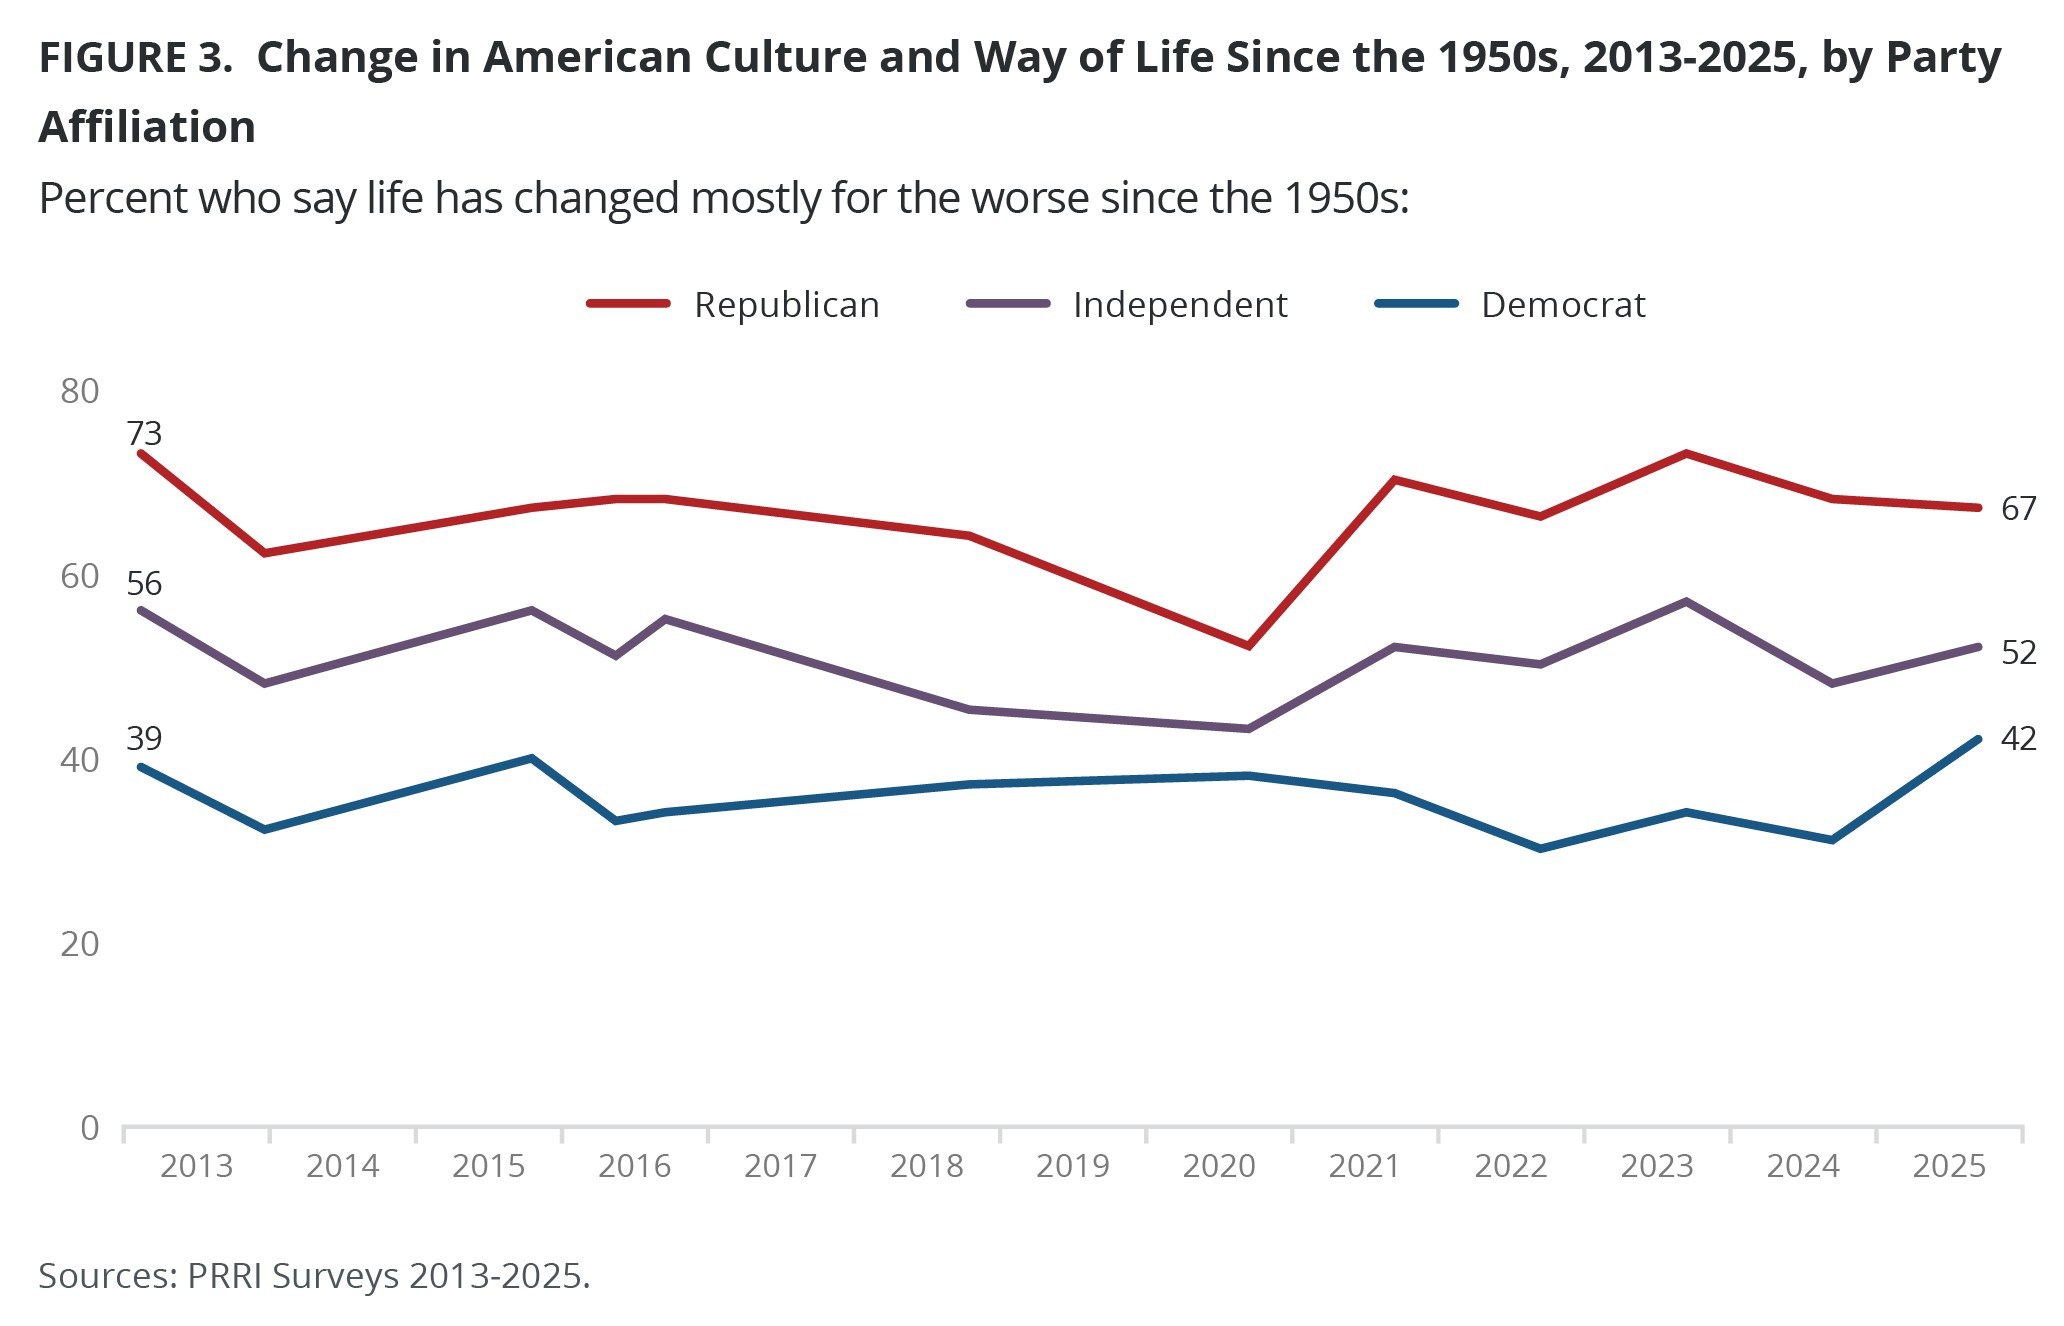
Most Americans say that American culture and way of life have mostly changed for the worse since the 1950s (55%), while 43% say it has mostly changed for the better. Republicans (67%) are the most likely to say American culture and way of life has mostly changed for the worse, compared with 52% of independents and 42% of Democrats. Conversely, most Democrats (57%), 45% of independents, and 32% of Republicans say it has mostly changed for the better. Over the past decade, Republicans have been consistently less likely than independents or Democrats to say that American culture and way of life has changed mostly for the better since the 1950s. Democrats have become more likely to do so, from 55% in 2013 to 68% in 2024. This year, however, there is an 11-percentage-point drop to 57% among Democrats.
White and Hispanic Christian groups are the most likely to say American culture and way of life has changed for the worse since the 1950s: 67% of white evangelical Protestants, 58% of Hispanic Protestants, 57% of white and Hispanic Catholics, and 56% of white mainline/non-evangelical Protestants. Fewer Jewish Americans (47%), other non-Christian groups (43%), and religiously unaffiliated Americans (47%) say things have changed for the worse since the 1950s. Over the past decade, white Christian groups have become less likely to say that things have changed for the worse since the 1950s, while Christians of color and members of non-Christian groups have become more likely to do so.
Changes Since Donald Trump Came into Office
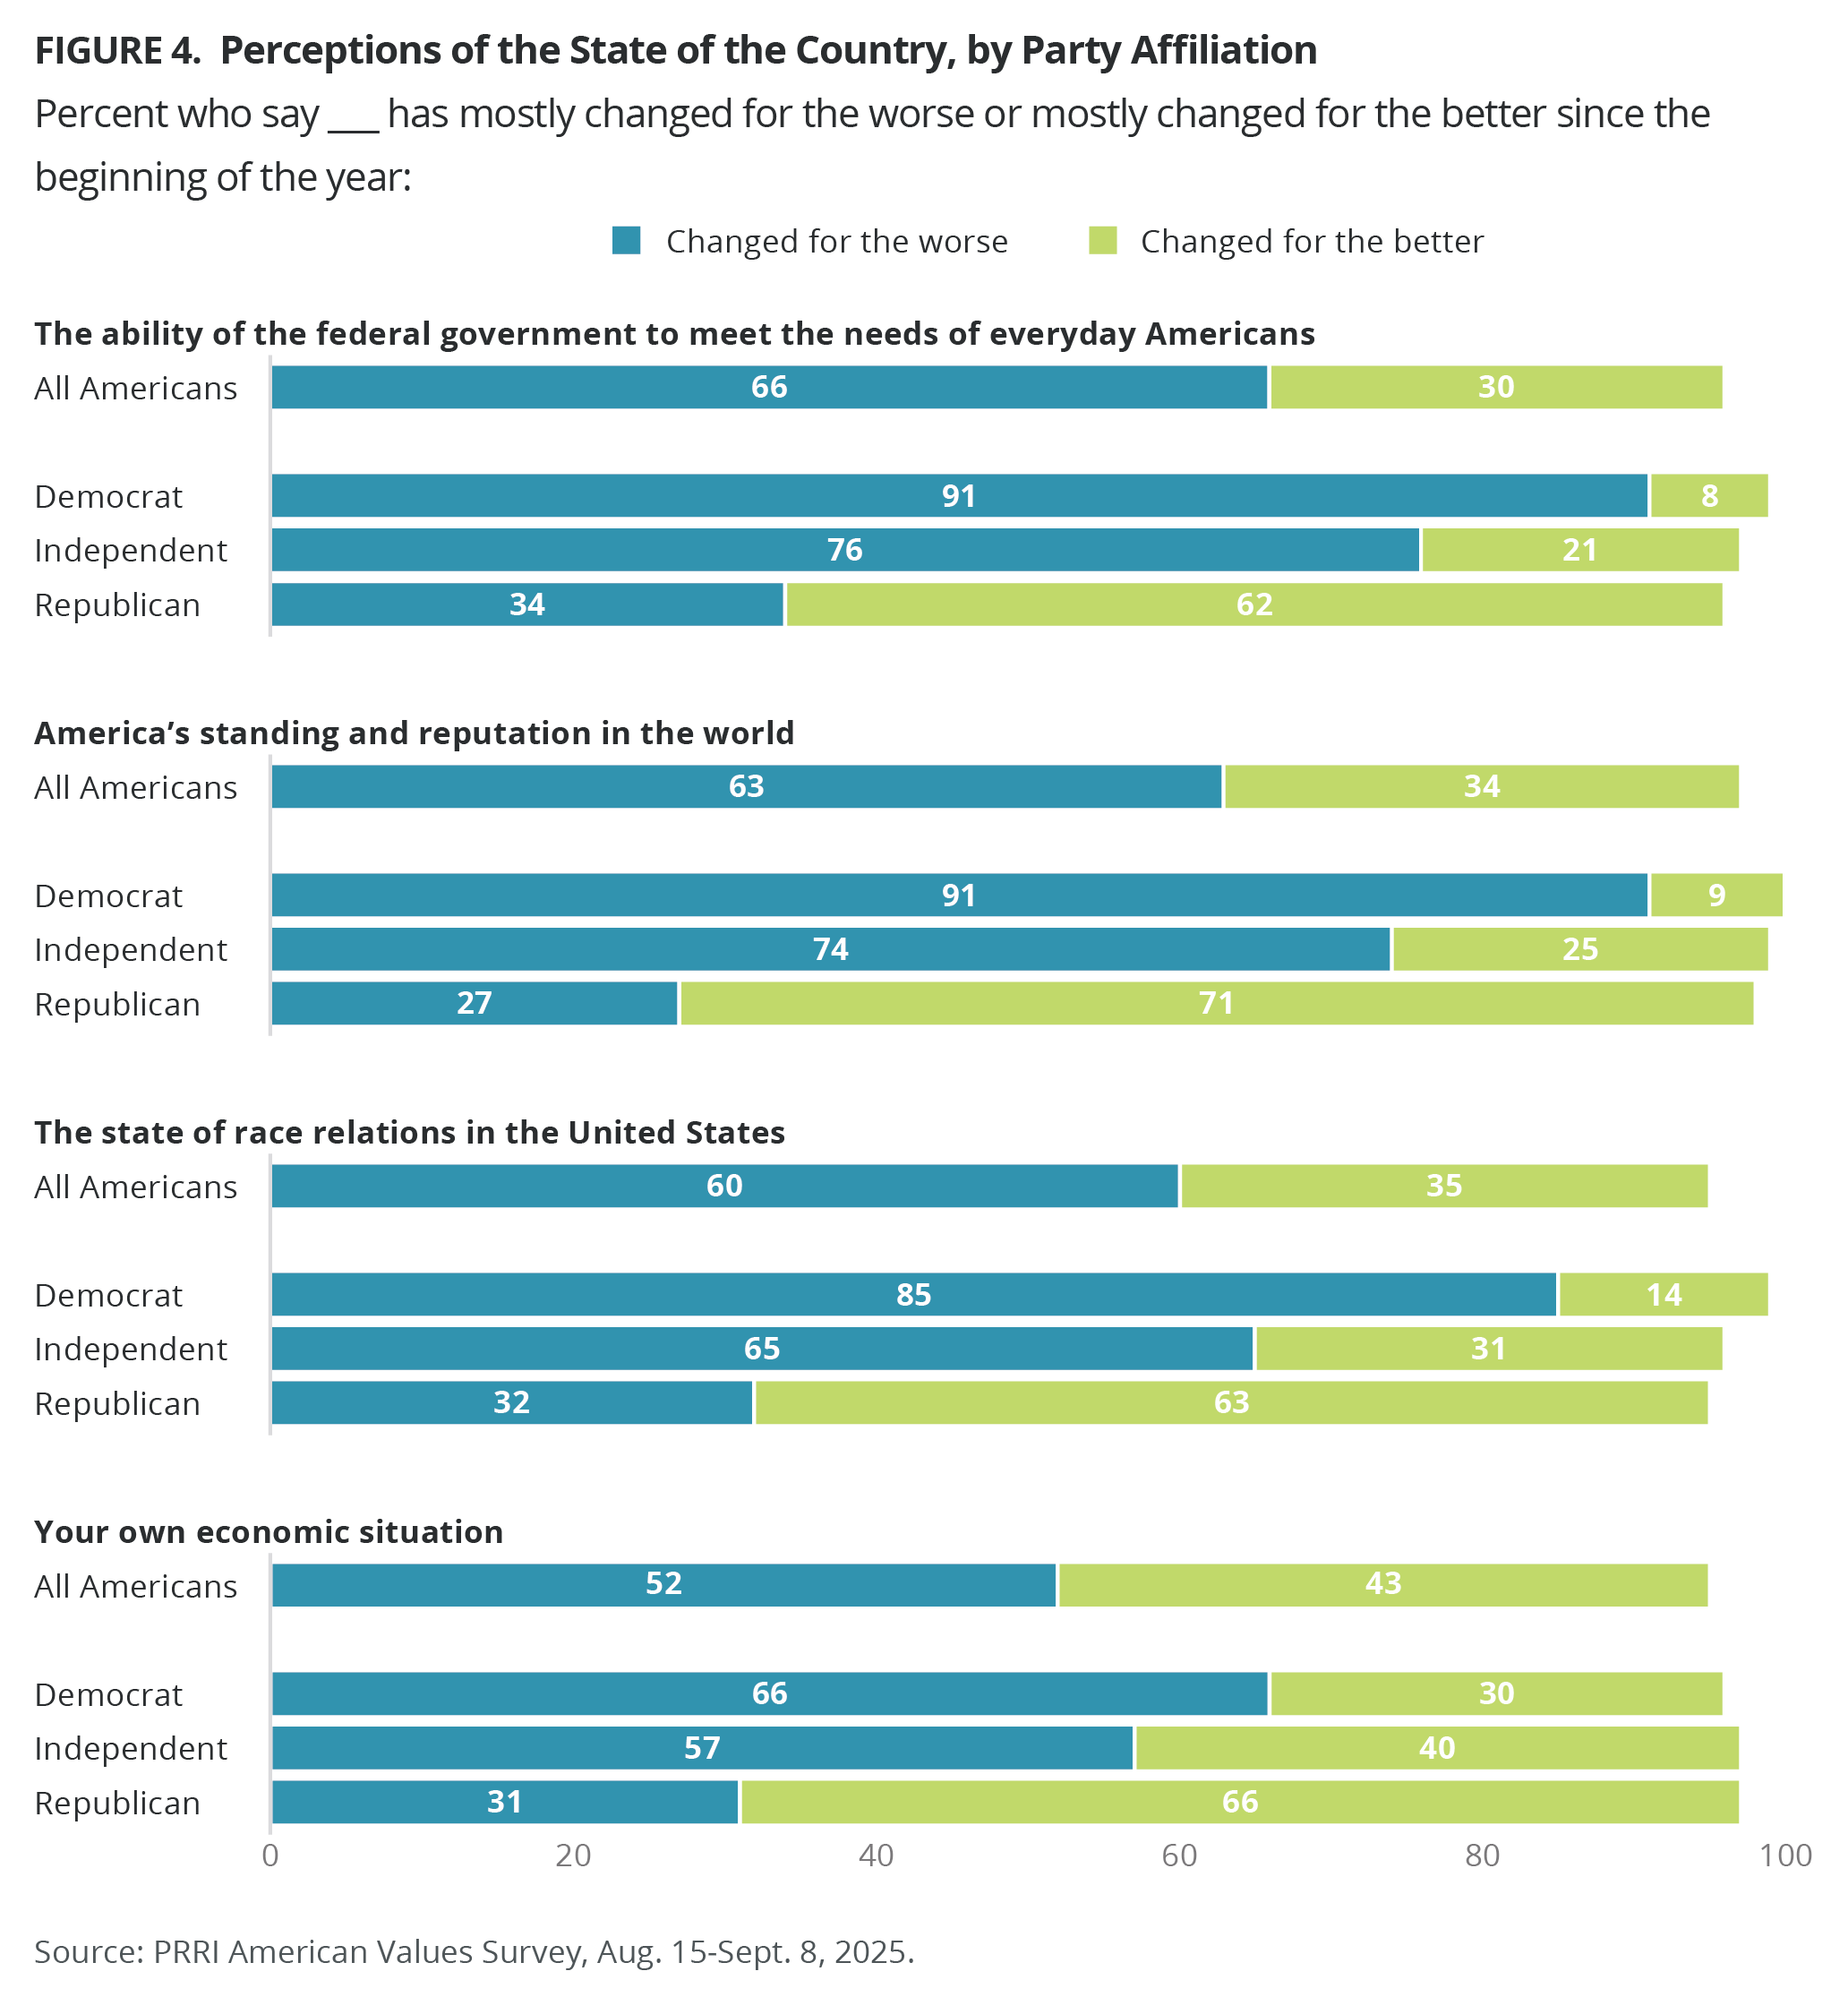
Most Americans say that the ability of the federal government to meet the needs of everyday Americans has mostly changed for the worse since the beginning of the year (66%), while 30% say it has mostly changed for the better. Most Democrats (91%) and independents (76%) say it has mostly changed for the worse, compared with one-third of Republicans (34%). Over six in ten Republicans (62%) say it has mostly changed for the better.
A majority of Americans say that America’s standing and reputation in the world has mostly changed for the worse since the beginning of the year (63%), while one-third (34%) say it has mostly changed for the better. Most Democrats (91%) and independents (74%) say it has mostly changed for the worse, compared with 27% of Republicans. Instead, most Republicans (71%) say it has mostly changed for the better.
Six in ten Americans say that the state of race relations in the United States has mostly changed for the worse since the beginning of the year (60%), while over one-third say it has mostly changed for the better (35%). Most Democrats (85%) and independents (65%) say it has mostly changed for the worse, compared with one-third of Republicans (32%). Over six in ten Republicans (63%) say it has mostly changed for the better.
A slim majority of Americans say their own economic situation has mostly changed for the worse since the beginning of the year (52%), while 43% say it has mostly changed for the better. These views have remained consistent since 2024 (54% vs. 44%). Two-thirds of Democrats (66%) and 57% of independents say their economic situation mostly changed for the worse, compared with 31% of Republicans. Last year, the reverse was true when most Republicans (74%), independents (52%), and 32% of Democrats said the same.
Critical Issues
Among 10 political issues, Americans are the most likely to rate increasing costs of housing and everyday expenses (59%) as critical. It is the only issue that a clear majority of Americans rank as critical. Half of Americans say health care (49%), the health of democracy (49%), and the protection of basic rights such as free speech (49%) are critical issues. Around four in ten say immigration (43%), crime (41%), and jobs and unemployment (37%) are critical issues, compared with three in ten who say racial inequality (30%) and abortion (28%) are critical issues. Just 19% of Americans say the controversy over the release of the Epstein files is a critical issue.
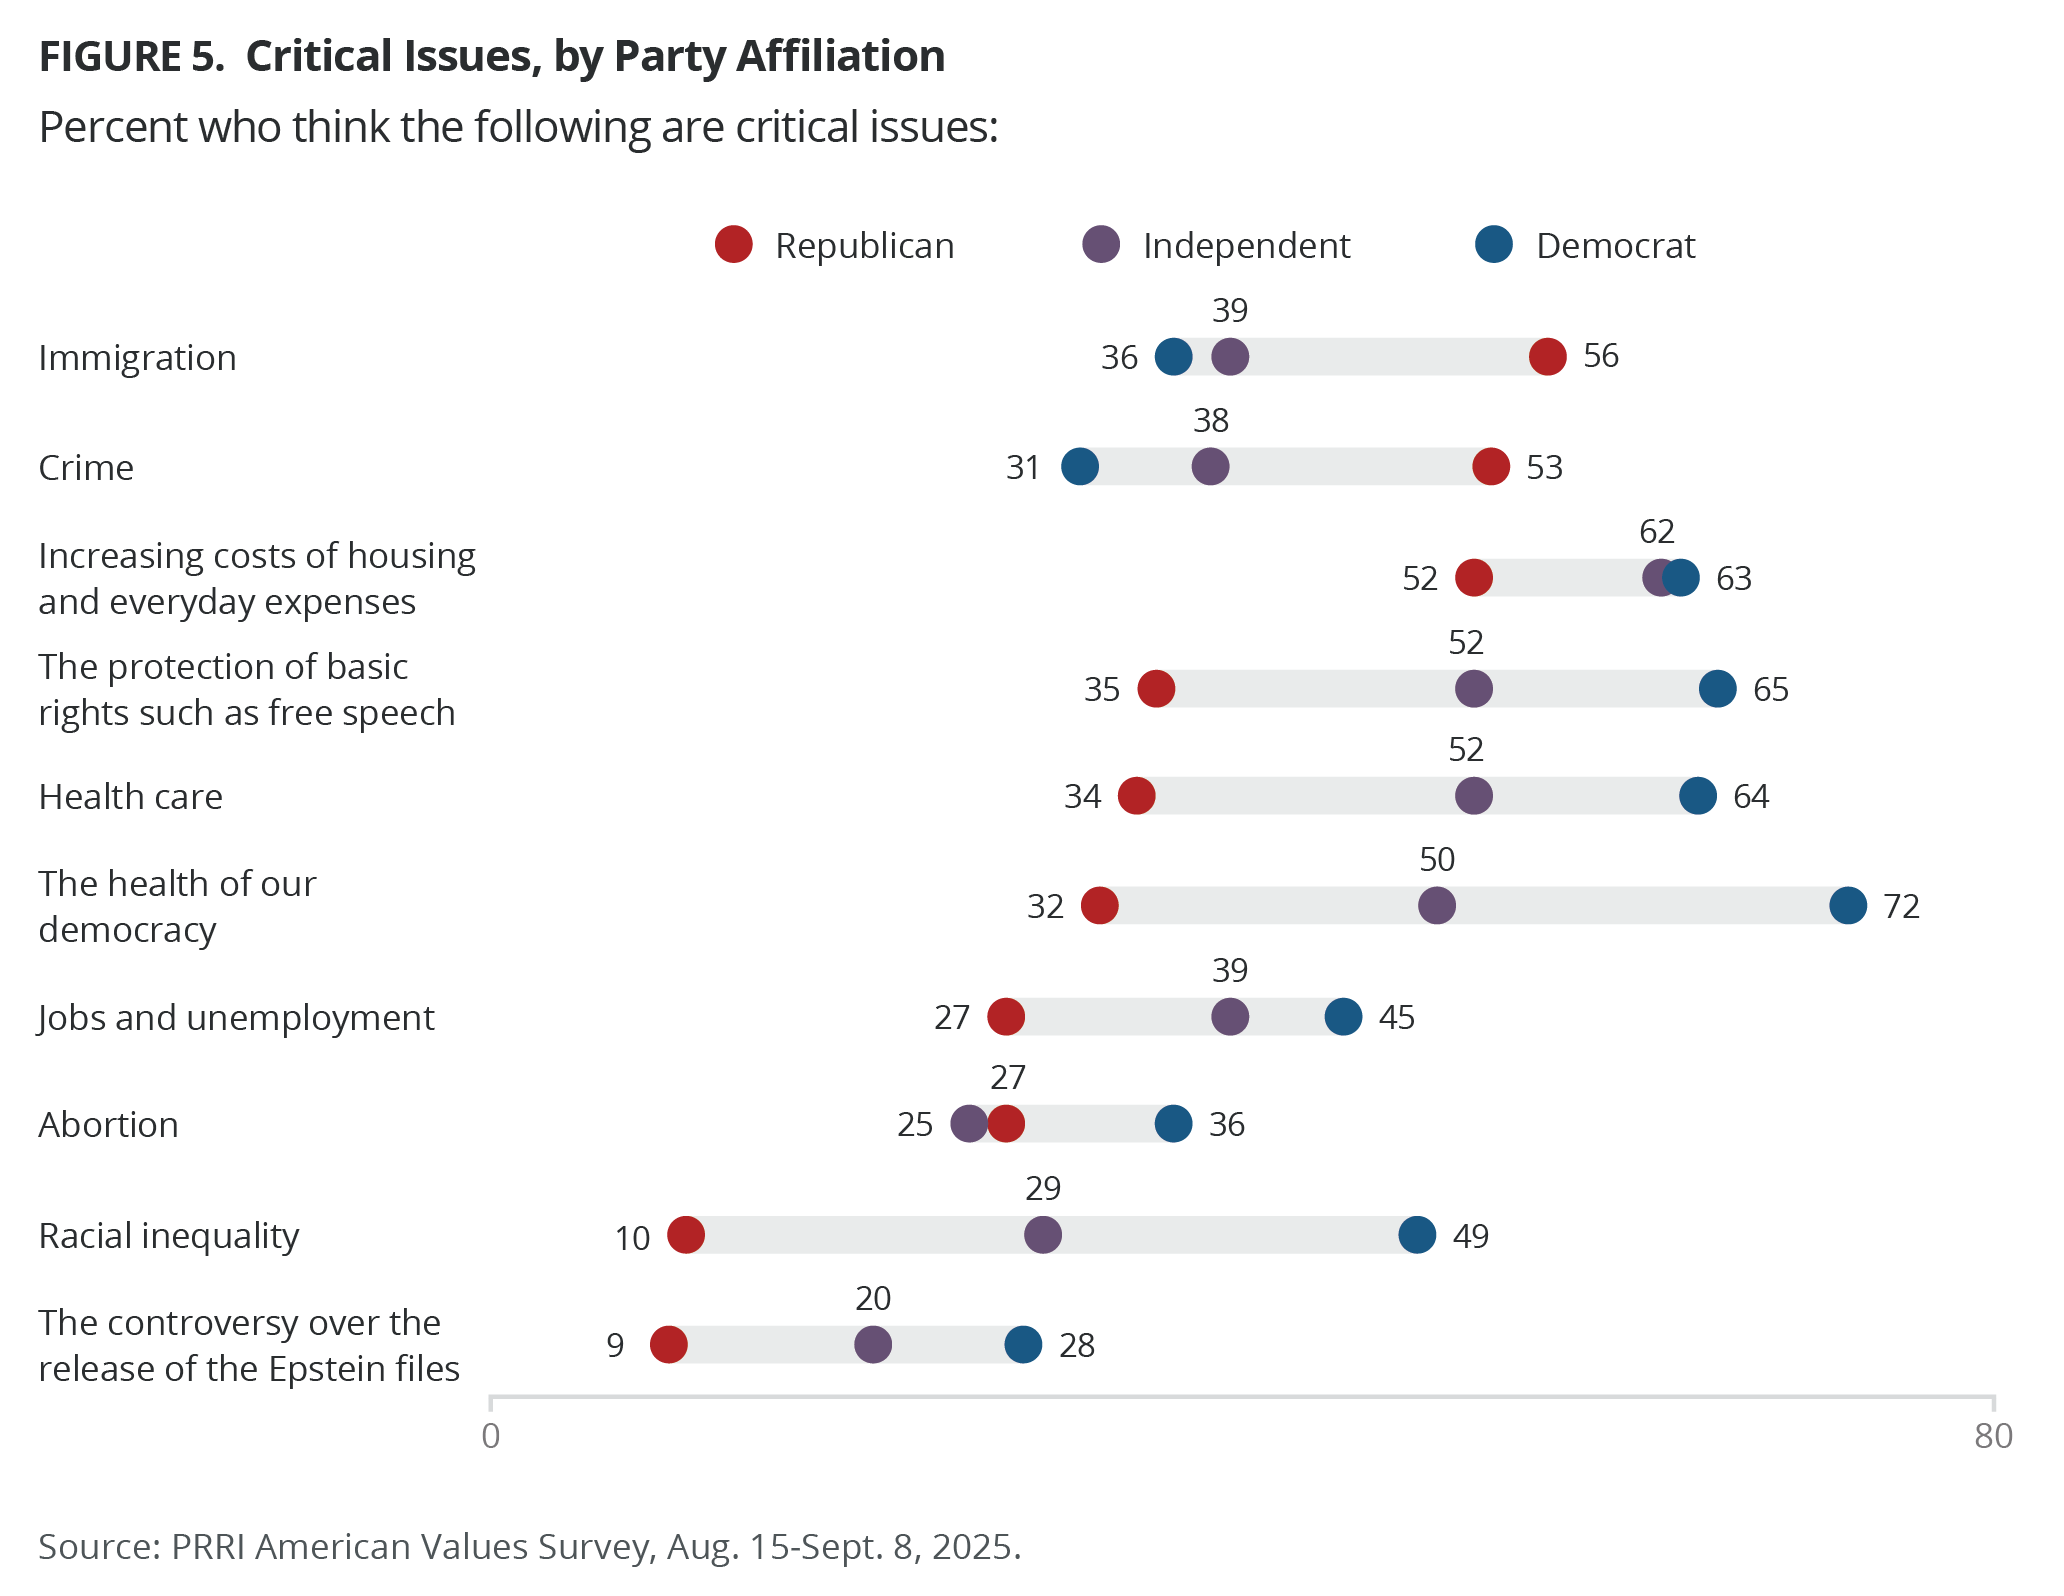
Majorities of Republicans (52%), independents (62%), and Democrats (63%) consider the increasing cost of housing and everyday expenses to be a critical issue, but the partisan agreement ends there. Majorities of Democrats rate the health of democracy (72%), the protection of basic rights such as free speech (65%), and health care (64%) as critical issues, compared with only about one-third of Republicans. By contrast, majorities of Republicans rate immigration (56%) and crime (53%) as critical issues, compared with only about one-third of Democrats. Majorities of neither party rank jobs and unemployment, abortion, racial inequality, or the release of the Epstein files as critical issues.
The salience of two key issues dominating political discussions this year has shifted significantly among Democrats, Republicans, and independents since President Donald Trump’s re-election. While Republicans have become less likely to say immigration is a critical issue (71% to 56%), Democrats have become more likely to do so (24% to 36%). Democrats have also become more likely to say that the health of democracy is a critical issue (61% to 72%), while Republicans have become less likely to do so (51% to 32%). Independents’ views on immigration and the health of democracy as critical issues have not shifted much. However, independents care more about health care today than last year (41% to 52%).
Race
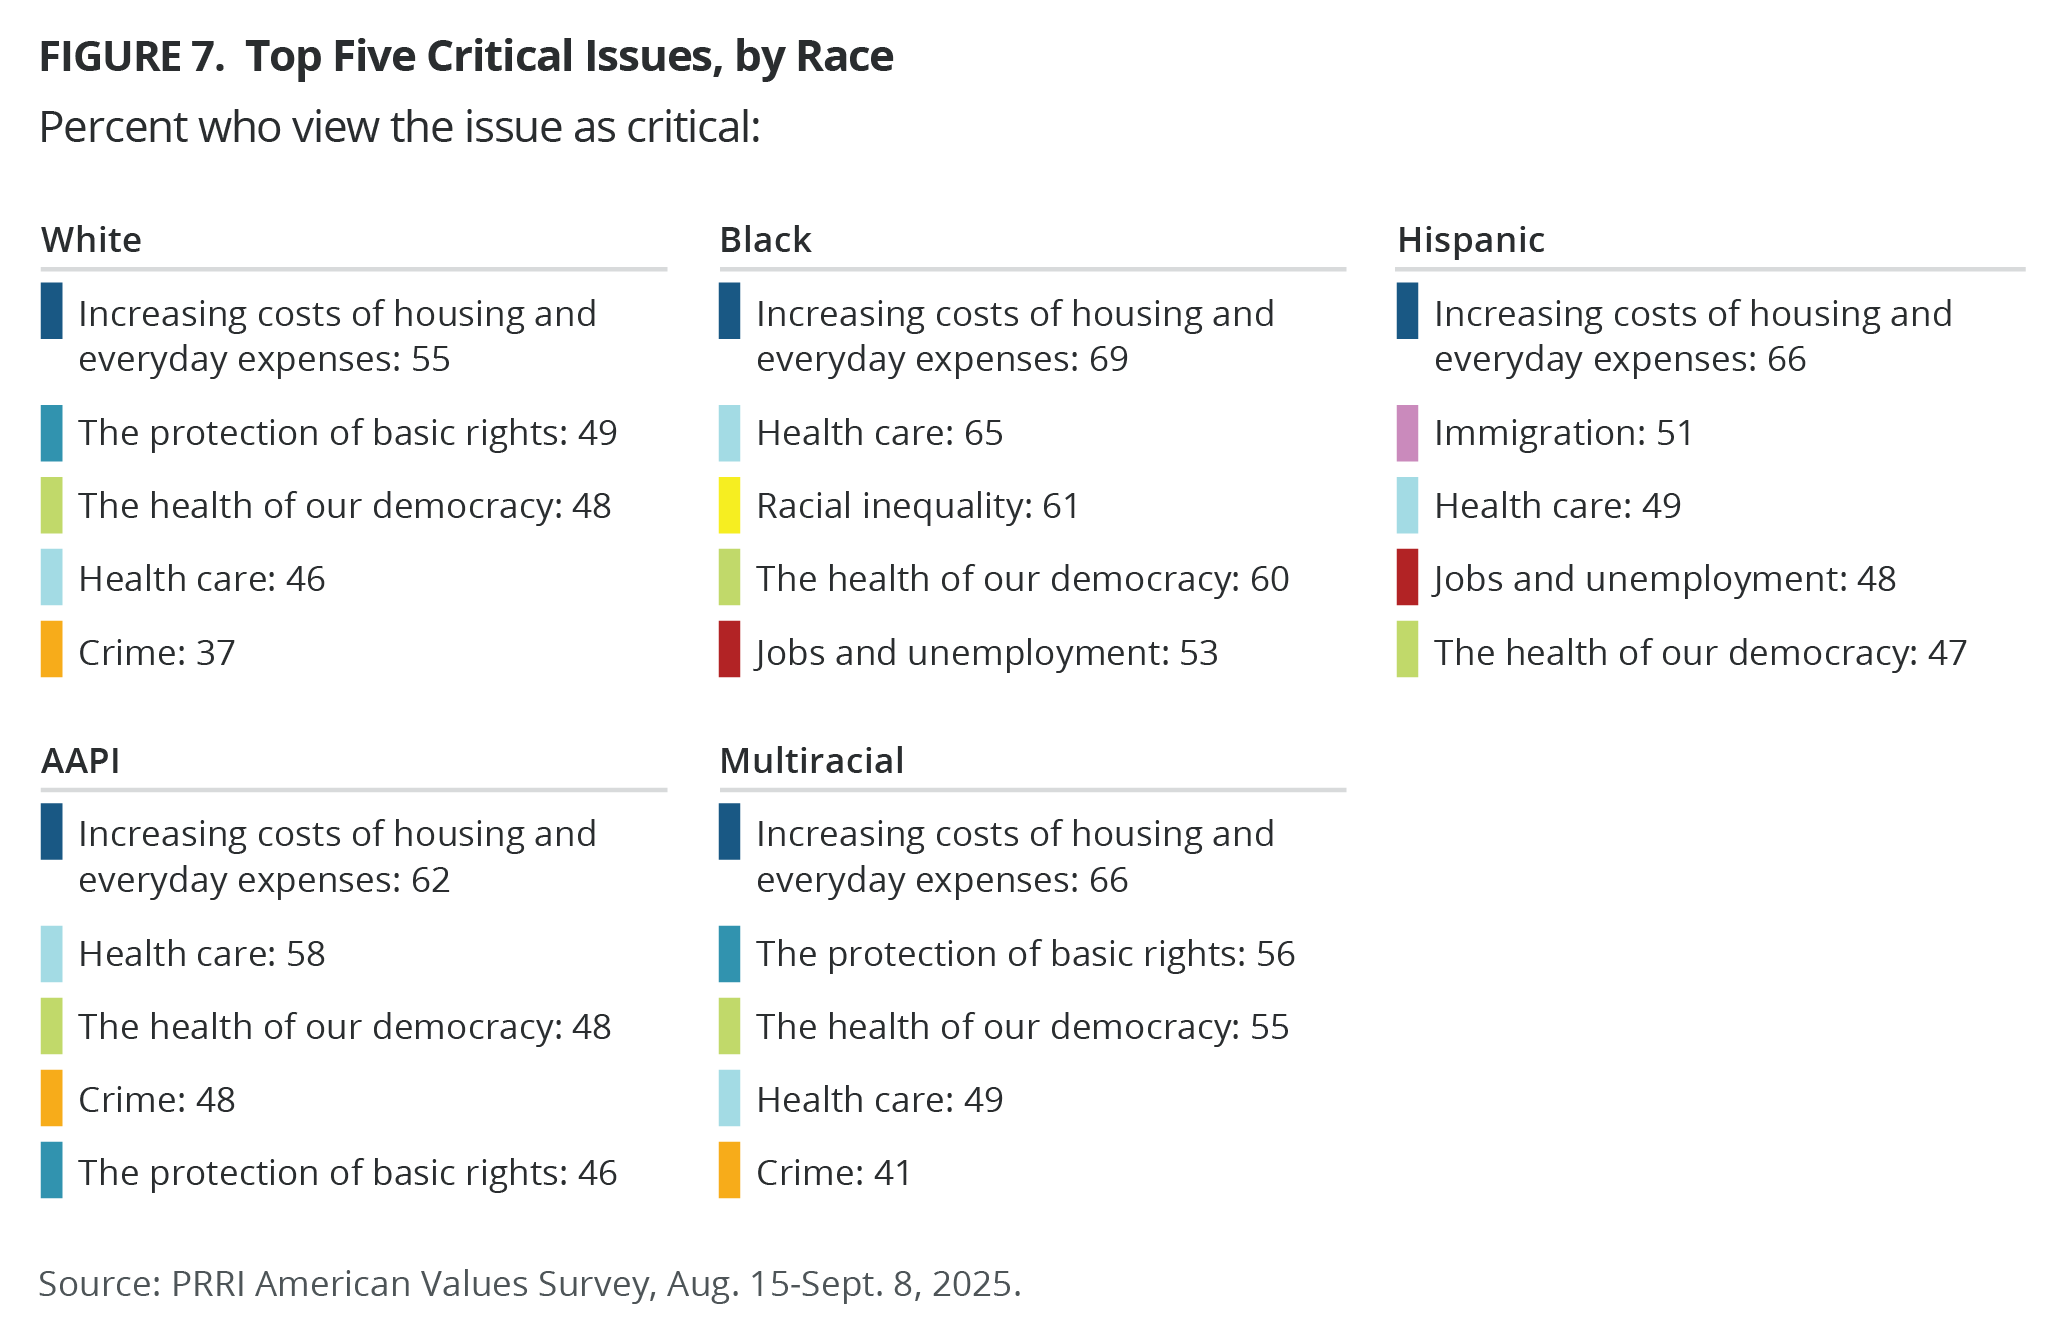
While majorities across racial groups say rising costs of housing and everyday expenses are a critical issue, priorities diverge. Black Americans most often cite health care (65%), racial inequality (61%), and the health of our democracy (60%). Hispanic Americans highlight immigration (51%), health care (49%), and jobs and unemployment (48%). AAPI Americans point to health care (58%), the health of our democracy (48%), and crime (48%). Multiracial Americans prioritize the protection of basic rights (56%), the health of our democracy (55%), and health care (49%). White Americans rank the protection of basic rights (49%), the health of our democracy (48%), and health care (46%) among their top critical issues.
The State of the Economy in America
Concerns Over the Economy
Concerns Over Living Expenses
Nearly four in ten Americans (38%) agree with the statement “I am very concerned that my family will not be able to pay for housing and basic living expenses over the next year,” while 59% disagree. Democrats (42%) and independents (38%) are more likely than Republicans (30%) to be very concerned over their family’s expenses over the next year.
Most Hispanic Americans (61%) say they are very concerned that their family will not be able to pay for housing and basic living expenses over the next year, followed by 51% of Black Americans and 43% of multiracial Americans. AAPI (33%) and white Americans (30%) are the least likely to be concerned over their family’s expenses. Americans without a college degree (46%) and women (42%) are more likely than those with a college degree (25%) and men (33%) to be concerned over their family’s expenses.
Economic concerns decrease by generation: 46% of millennials and 42% of Gen Zers indicate they are very concerned about living expenses, compared with 37% of Gen Xers, 30% of baby boomers, and 28% of members of the Silent Generation.
The American Dream and Upward Mobility
Does the American Dream Hold True Today?
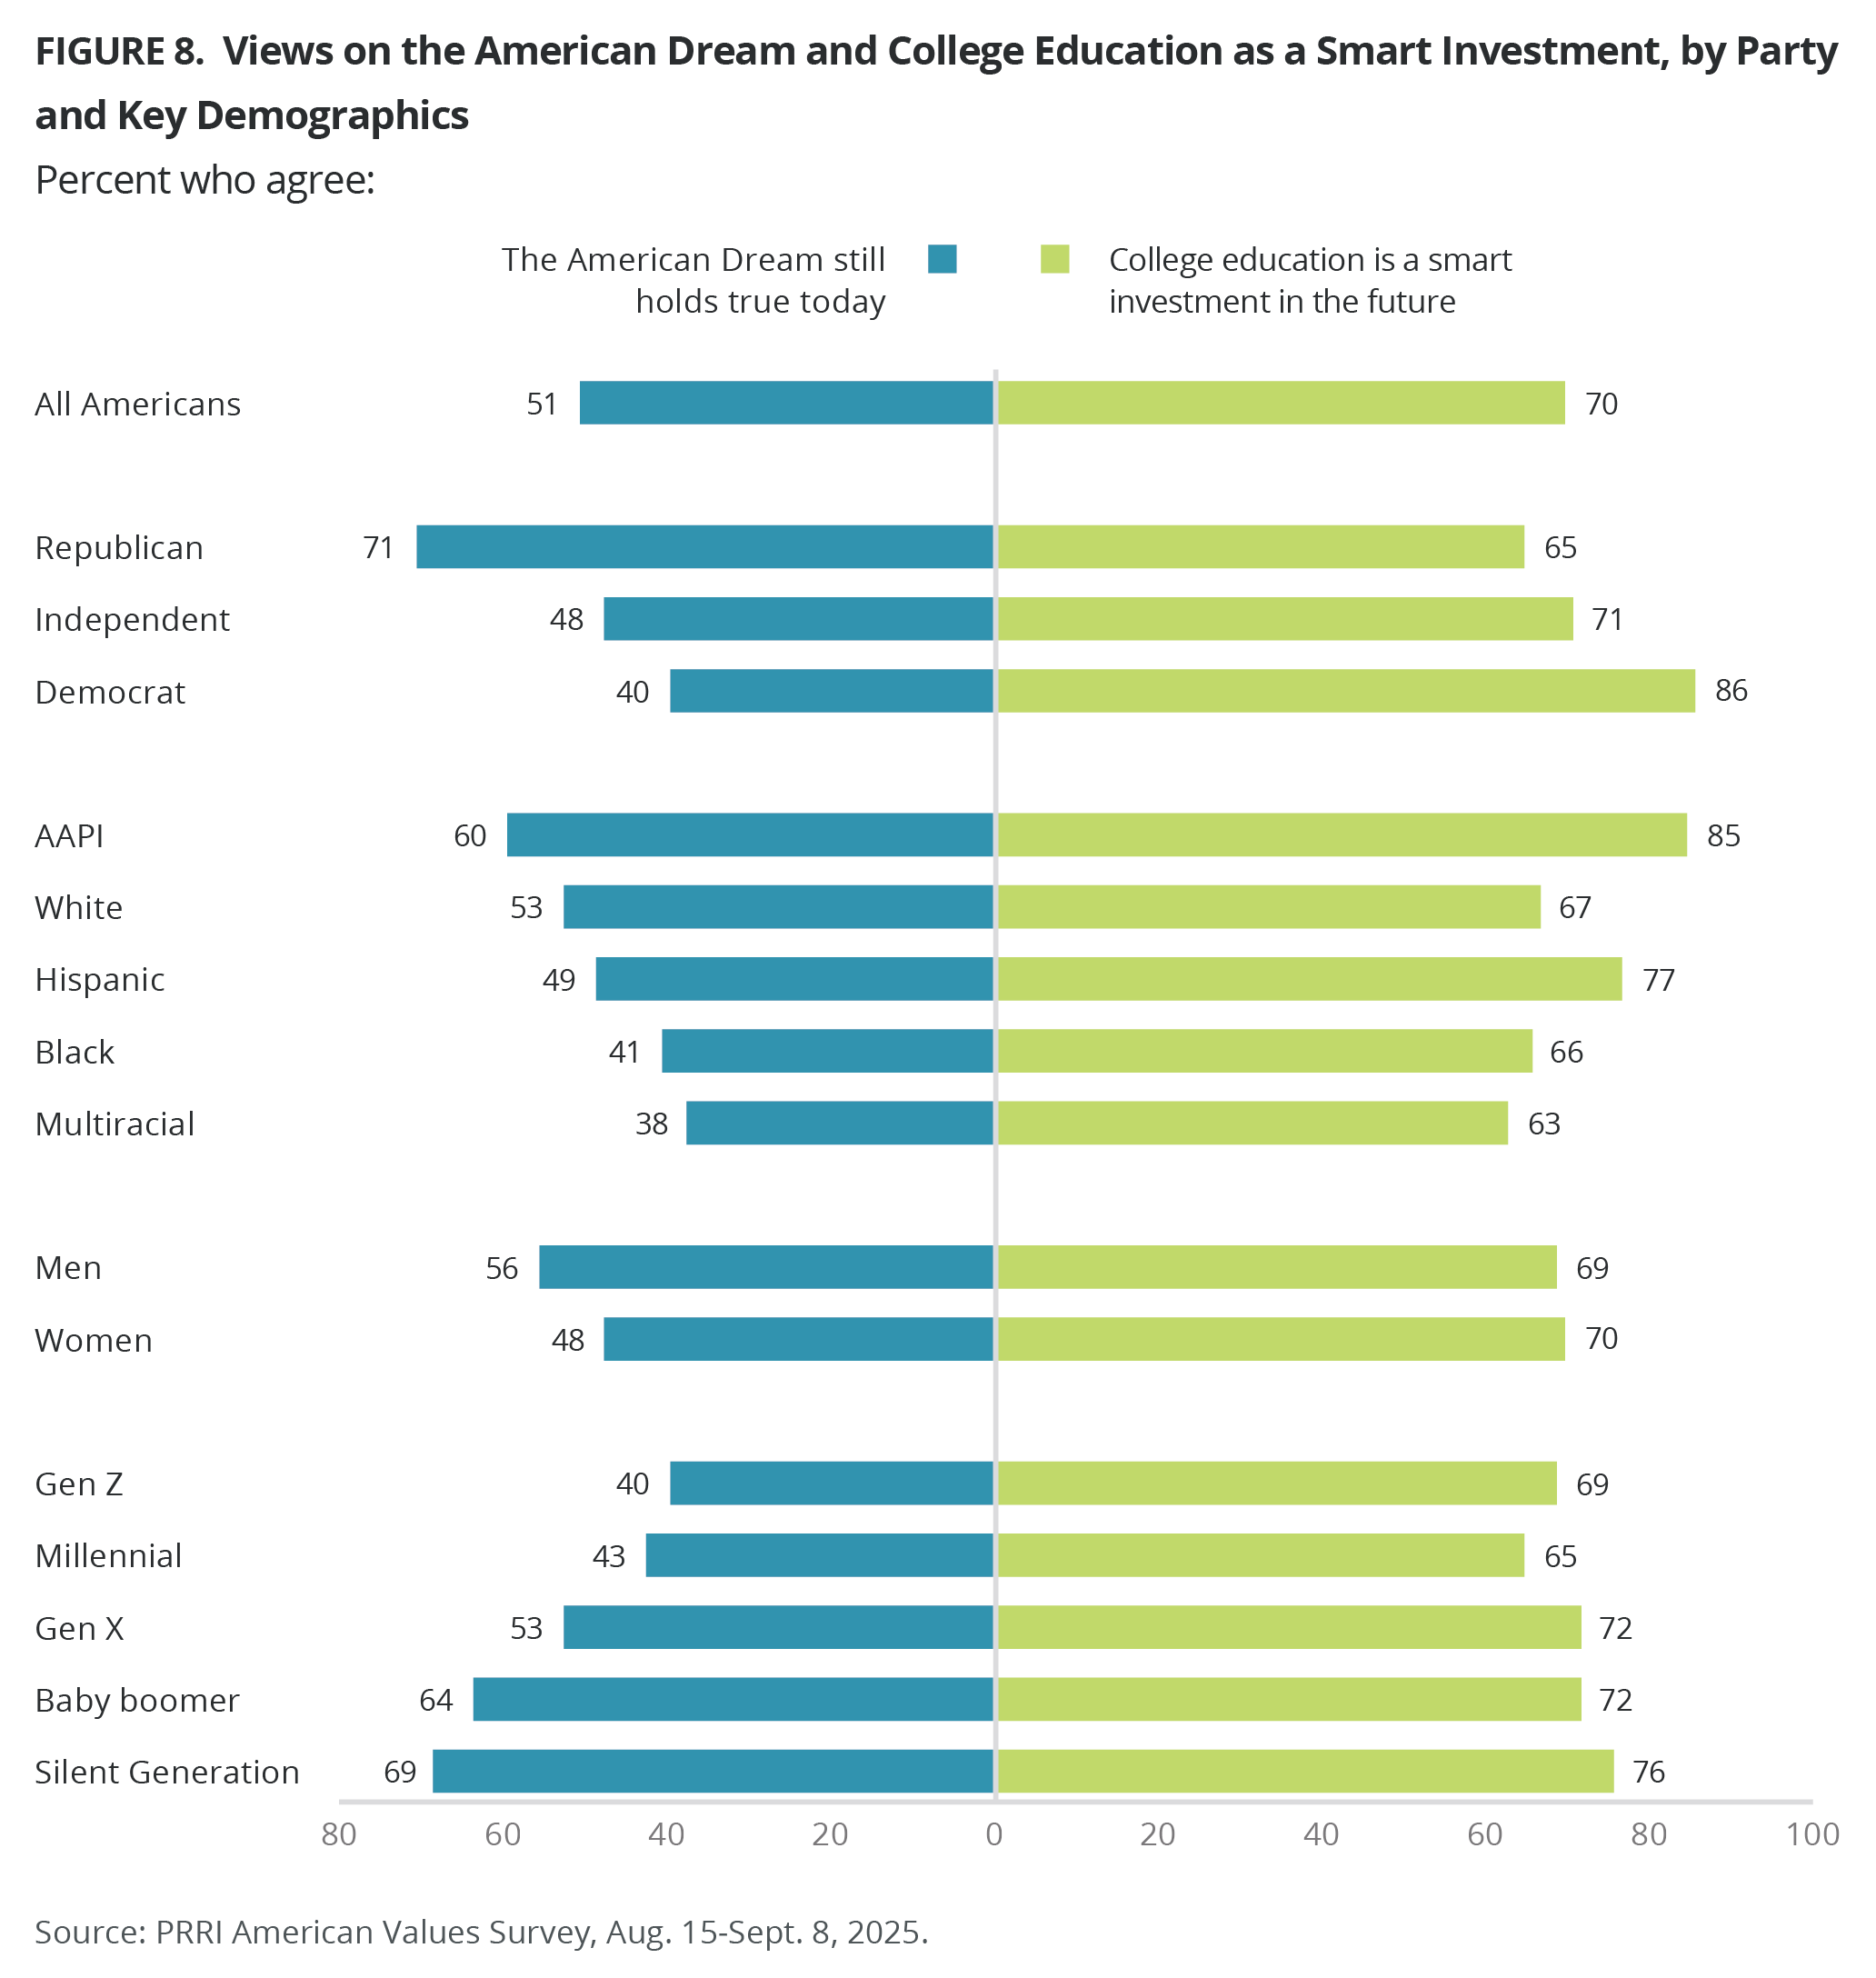
Americans are divided on whether the American Dream — that if you work hard, you’ll get ahead — still holds true today (51% agree vs. 46% disagree). These views have become slightly more pessimistic since last year (55% agree vs. 44% disagree). More than seven in ten Republicans (71%) agree, compared with 48% of independents and 40% of Democrats.
AAPI (60%) and white Americans (53%) are more likely than Hispanic (49%), Black (41%), and multiracial Americans (38%) to agree that the American Dream still holds true today, as are Americans with a college degree, compared with those without a college degree (54% vs. 50%).
There is no significant education gap among Hispanic or Black Americans with respect to views on the American Dream. Among white Americans, however, college graduates are more likely than non-college graduates to agree that the American Dream still holds true today (57% vs. 52%).
Women (48%) and younger generations are less likely than men (56%) and older generations to believe in the American Dream. A plurality of Gen Zers (40%) and millennials (43%) believe the American Dream still holds true today; majorities of Gen Xers (53%), baby boomers (64%), and the Silent Generation (69%) share this belief.
College as a Smart Investment
Nearly seven in ten Americans (70%) agree that a college education is a smart investment in the future, while 27% disagree. Majorities of Democrats (86%), independents (71%), and Republicans (65%) agree that a college education is a smart investment.
Nearly nine in ten AAPI Americans (85%) view a college education as a smart investment in the future, followed by 77% of Hispanic, 67% of white, 66% of Black, and 63% of multiracial Americans. Across racial groups, college graduates are more likely than non-college graduates to view a college education as a smart investment: Hispanic (83% vs. 76%), white (80% vs. 60%), and Black Americans (77% vs. 62%).
Has Trump’s Transformation of the Federal Government Gone Too Far?
The Cuts in Federal Funding of Health Care Programs Have Gone Too Far
Six in ten Americans (60%) say that the cuts in federal funding of health care programs such as Medicaid, Medicare, and the Affordable Care Act have gone too far, compared with nearly three in ten who say this change seems about right (28%), and only 9% who say it has not gone far enough. Most Democrats (90%) and independents (67%) say that this change has gone too far, compared with only 25% of Republicans.
Except for white Christian groups and Hispanic Protestants, majorities of all other religious groups say that the cuts in federal funding of health care programs have gone too far, including roughly three in four Black Protestants (75%), unaffiliated Americans (75%), other non-Christians (73%), Hispanic Catholics (72%), and Jewish Americans (72%). Roughly half of white mainline/non-evangelical Protestants (50%), white Catholics (50%), and Hispanic Protestants (48%) also say this change has gone too far. Only 37% of white evangelical Protestants say the same.
The Cuts in Federal Funding and Grants to Universities and Research Institutions Have Gone Too Far
The majority of Americans say that the cuts in federal funding and grants to universities and research institutions have gone too far (55%), compared with nearly three in ten who say this change seems about right (27%), and 15% who say it has not gone far enough. Most Democrats (88%) and independents (63%) say that this change has gone too far, compared with only 19% of Republicans.
Except for white Christian groups and Hispanic Protestants, majorities of all other religious groups say that the cuts in federal funding and grants to universities and research institutions have gone too far, including roughly seven in ten Black Protestants (72%), unaffiliated Americans (72%), other non-Christians (71%), Jewish Americans (70%), and Hispanic Catholics (68%). Under half of Hispanic Protestants (48%) and white Catholics (45%), as well as 42% of white mainline/non-evangelical Protestants, also say this change has gone too far. Only 27% of white evangelical Protestants say the same.
Most Christian nationalism Rejecters (87%) and Skeptics (55%) say the cuts in federal funding and grants to universities and research institutions have gone too far, compared with one-third of Sympathizers (34%) and 22% of Adherents.
The Implementation of New Tariffs on Imported Goods Has Gone Too Far
The majority of Americans say that the implementation of new tariffs on imported goods from other countries has gone too far (54%), compared with over one-third who say this change seems about right (35%), and only 7% who say it has not gone far enough. Most Democrats (86%) and independents (64%) say that this change has gone too far, while only 20% of Republicans say the same.
Except for white Christian groups and Hispanic Protestants, majorities of all other religious groups say that the implementation of new tariffs on imported goods from other countries has gone too far, including roughly seven in ten other non-Christians (74%), unaffiliated Americans (71%), Hispanic Catholics (69%), and Jewish Americans (68%), as well as 63% of Black Protestants. A plurality of white Catholics (47%), Hispanic Protestants (47%), and white mainline/non-evangelical Protestants (43%) also say this change has gone too far. Only 25% of white evangelical Protestants say the same.
Most Christian nationalism Rejecters (86%) and Skeptics (56%) say the implementation of new tariffs has gone too far, compared with one-third of Sympathizers (33%) and 20% of Adherents.
The Closing or Drastic Shrinking of Major Federal Agencies Has Gone Too Far
Half of Americans say that the closing or drastic shrinking of major federal agencies has gone too far (50%), compared with three in ten who say this change seems about right (30%), and 16% who say it has not gone far enough. Majorities of Democrats (85%) and independents (57%) say that this change has gone too far, compared with just 16% of Republicans.
Except for white Christian groups and Hispanic Protestants, majorities of all other religious groups say that the closing or drastic shrinking of major federal agencies has gone too far, including 65% of Black Protestants, Hispanic Catholics, Jewish Americans, and unaffiliated Americans, as well as 59% of other non-Christians. Roughly four in ten white Catholics (42%), white mainline/non-evangelical Protestants (39%), and Hispanic Protestants (37%) also say this change has gone too far. Only 25% of white evangelical Protestants say the same.
Most Christian nationalism Rejecters (81%) and half of Skeptics (50%) say the closing or drastic shrinking of major federal agencies has gone too far, compared with 31% of Sympathizers and 21% of Adherents.
Increase in ICE Funding to Speed Immigration Enforcement Has Gone Too Far
A slim majority of Americans (52%) say that the increase in funding for U.S. Immigration and Customs Enforcement (ICE) to speed up efforts to arrest, detain, and deport undocumented immigrants has gone too far, compared with one-third who say this change seems about right (33%), and only 12% who say it has not gone far enough. There is a 70-percentage-point gap between Democrats (85%) and Republicans (15%) who say that this change has gone too far. The majority of independents (59%) also say this change has gone too far.
With the exception of white Christian groups, majorities of all other religious groups say that the increase in ICE funding to speed up immigration enforcement has gone too far, including seven in ten unaffiliated Americans (70%) and Hispanic Catholics (70%), about two-thirds of other non-Christians (65%), Black Protestants (65%), and Jewish Americans (63%), and 57% of Hispanic Protestants. Four in ten white Catholics (39%) and white mainline/non-evangelical Protestants (39%) also say this change has gone too far, while only 22% of white evangelical Protestants say the same.
Wide Disagreement With the Federal Control of College Admissions, Hiring, and Curriculum
The majority of Americans (70%) disagree that the federal government should have the authority to control student admissions, faculty hiring, and curriculum at U.S. colleges and universities to ensure they do not teach inappropriate material, including 42% who completely disagree. Most Democrats (84%), independents (75%), and Republicans (58%) disagree.
Over eight in ten Jewish Americans (83%) and unaffiliated Americans (81%) disagree with the federal control of college admissions, hiring, and curriculum, followed by over seven in ten Black Protestants (74%), white Catholics (73%), and white mainline/non-evangelical Protestants (72%), and two-thirds of other non-Christians (68%) and white evangelical Protestants (67%). Hispanic Catholics (53%) and Hispanic Protestants (49%) are the least likely to disagree.
President Trump’s Job Approval, Favorability, and Leadership
Job Approval
As President
A majority of Americans (56%) disapprove of the job Donald Trump is doing as president, compared with 42% who approve. Trump’s approval has hovered around 40% since PRRI first asked the question in October 2017. Most Republicans (86%) approve of the job Trump is doing as president, compared with 32% of independents and only 8% of Democrats.
Americans who most trust far-right news, including Newsmax and One America News, for accurate political information show the highest level of approval of Trump’s job as president (92%), followed by 86% who most trust Fox News. Smaller majorities of Americans who most trust the radio (67%) and who do not trust any media source also approve (61%). Far fewer Americans who most trust YouTube or podcasts (46%), social media (42%), mainstream TV news (25%), and newspapers (19%) approve of the job Trump is doing as president.
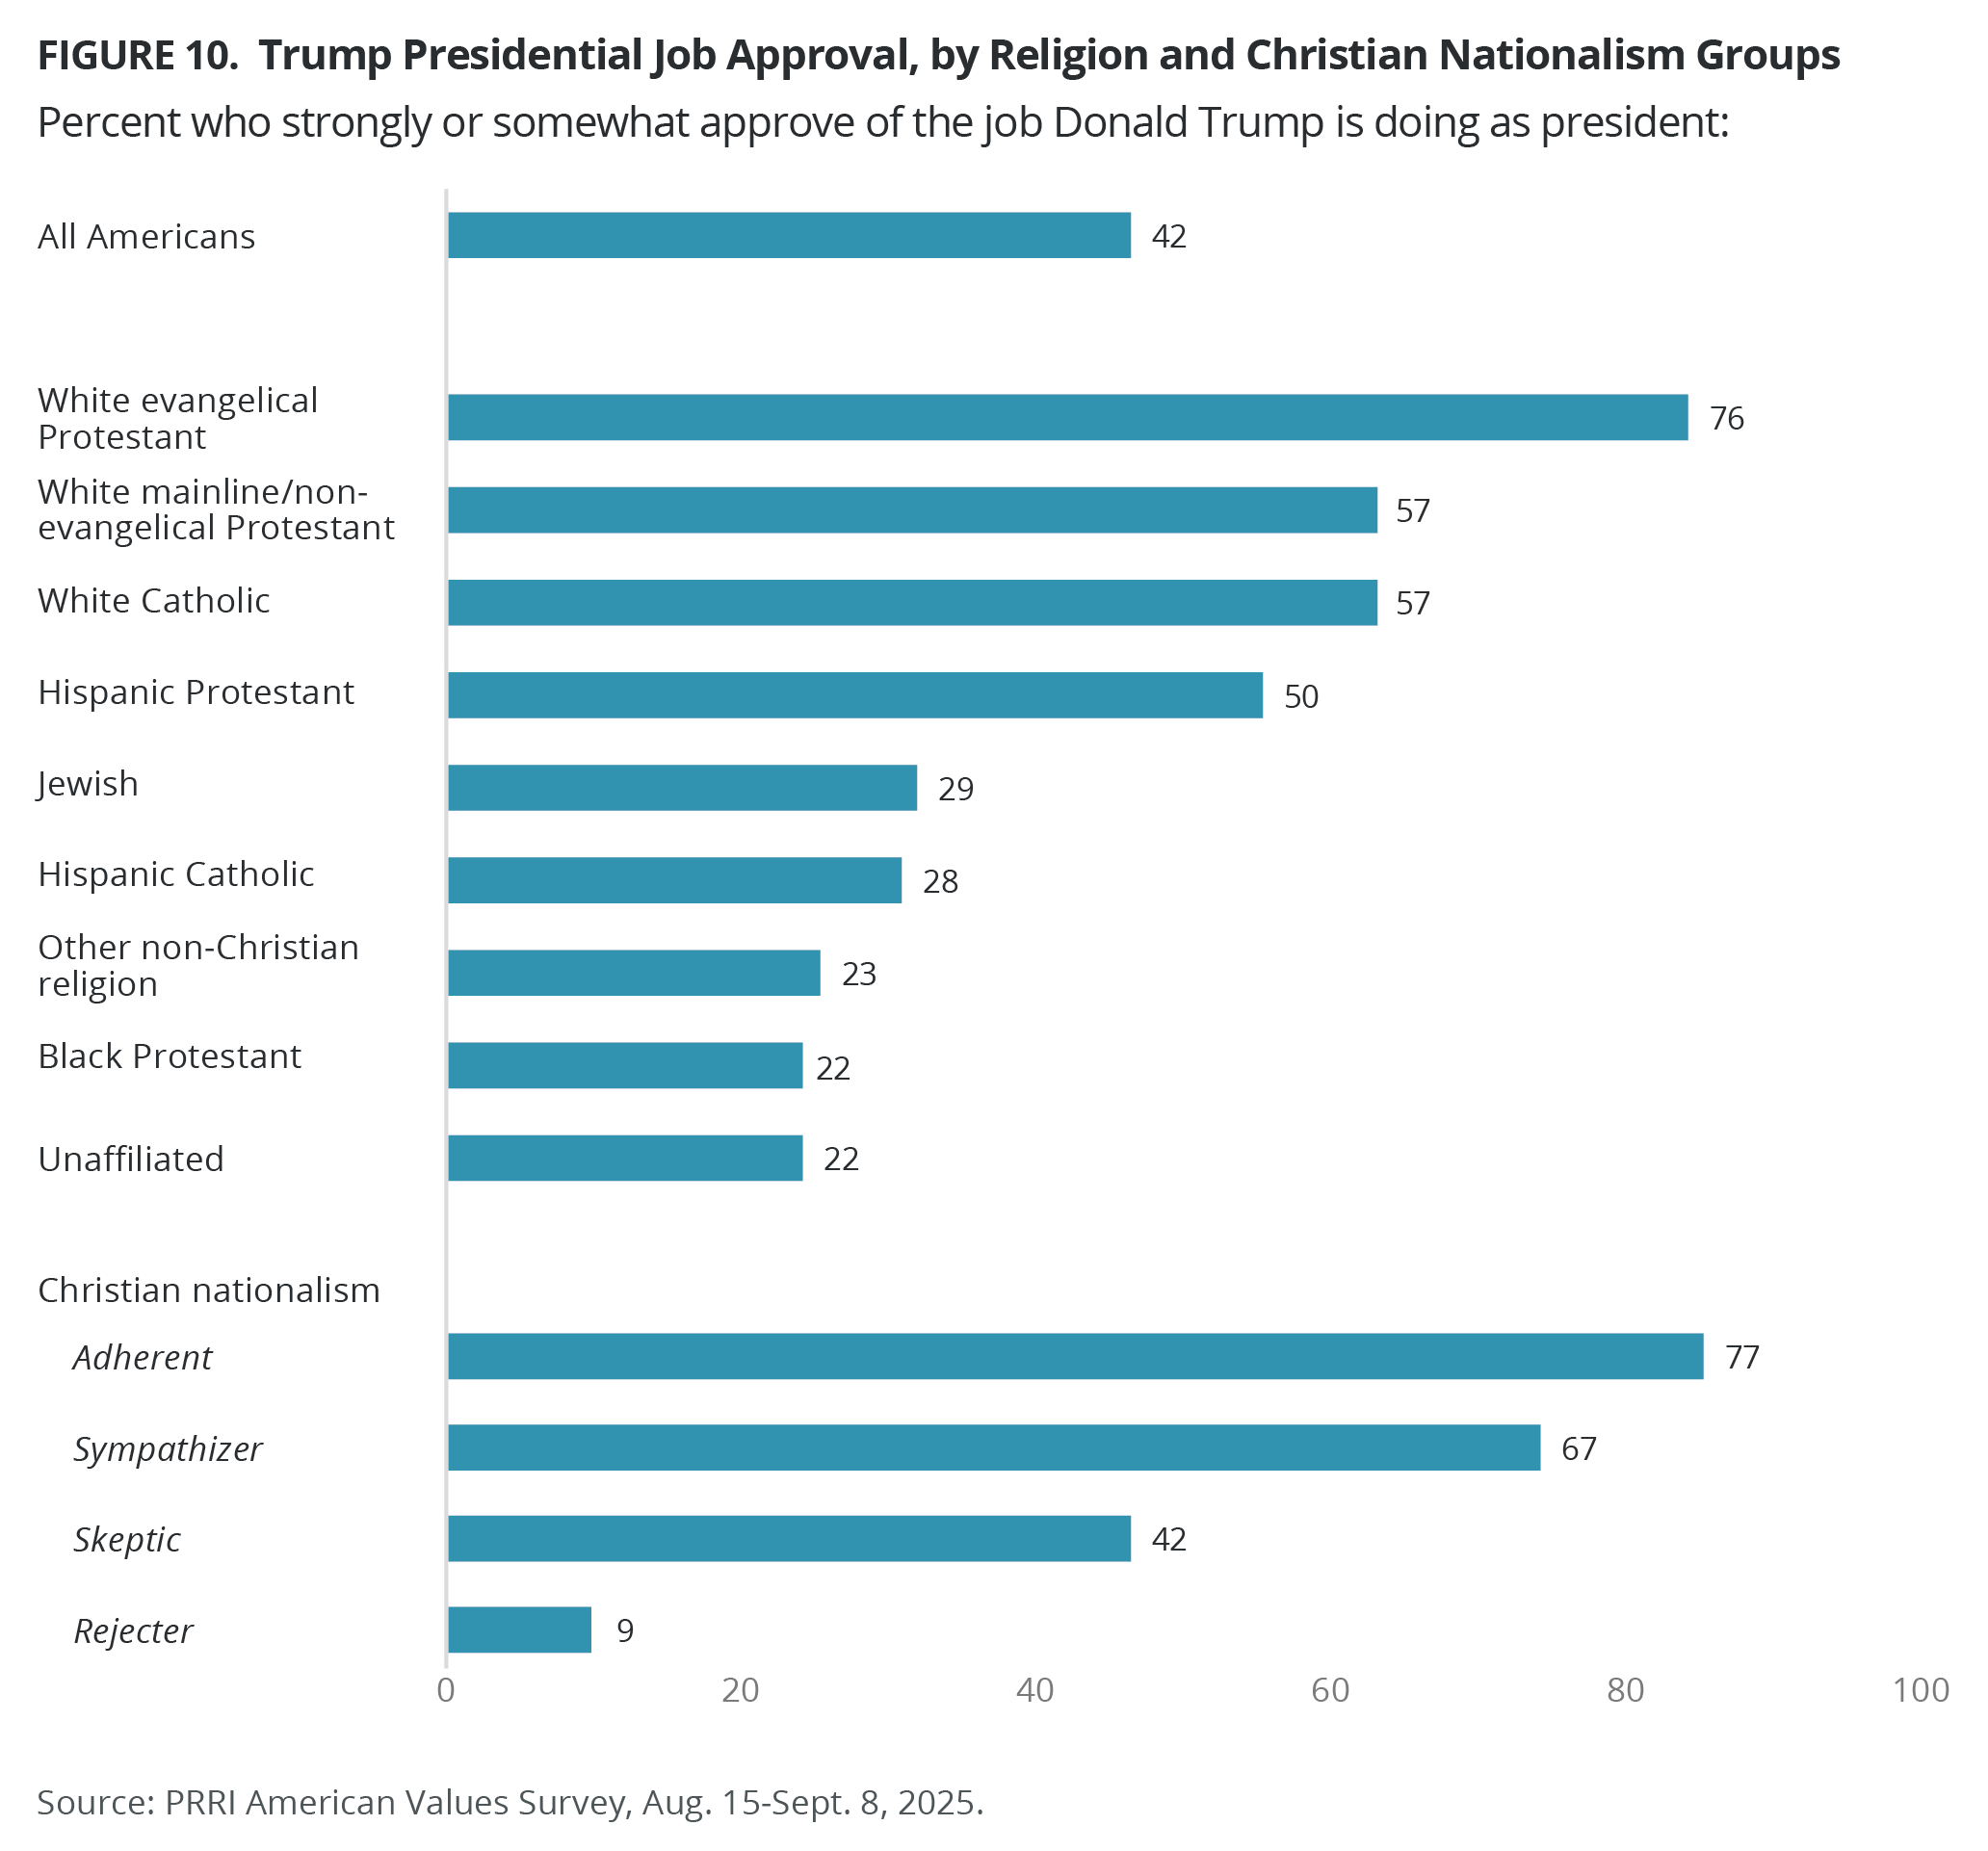
Majorities of white evangelical Protestants (76%), white Catholics (57%), and white mainline/non-evangelical Protestants (57%) approve of the job Trump is doing as president. Hispanic Protestants are split (50% approve vs. 49% disapprove). In contrast, solid majorities of Black Protestants (77%), religiously unaffiliated (77%), members of other non-Christian religions (76%), Hispanic Catholics (71%), and Jewish Americans (70%) disapprove of Trump’s job as president. Compared with March 2025, Hispanic Protestants have become more likely to approve of the job Trump is doing, from 34% to 50%, while religiously unaffiliated have become less likely to approve, from 30% to 22%.
Among Christian nationalism Adherents, 77% approve of the job Trump is doing as president, followed by 67% of Sympathizers, 42% of Skeptics, and 9% of Rejecters.
On the Issues
More Americans disapprove than approve of Trump’s handling of immigration (54% vs. 43%). Views are similar on his handling of the border (52% disapprove vs. 44% approve). Nearly all Republicans approve of the job Trump is doing on immigration (86%) and the border (87%), compared with roughly four in ten independents (37% and 39%, respectively) and only one in ten Democrats (10% and 13%, respectively).
Four in ten Americans (39%) approve of the job Trump is doing handling the economy, while the majority disapprove (58%). The share of those who approve has decreased significantly, from 50% in September 2020. Most Republicans (81%) approve of Trump’s handling of the economy, compared with 31% of independents and only 7% of Democrats.
Four in ten Americans (39%) approve of the job that Trump is doing handling foreign policy, while 57% disapprove. Most Republicans (82%) approve of Trump’s handling of foreign policy, compared with 30% of independents and 9% of Democrats.
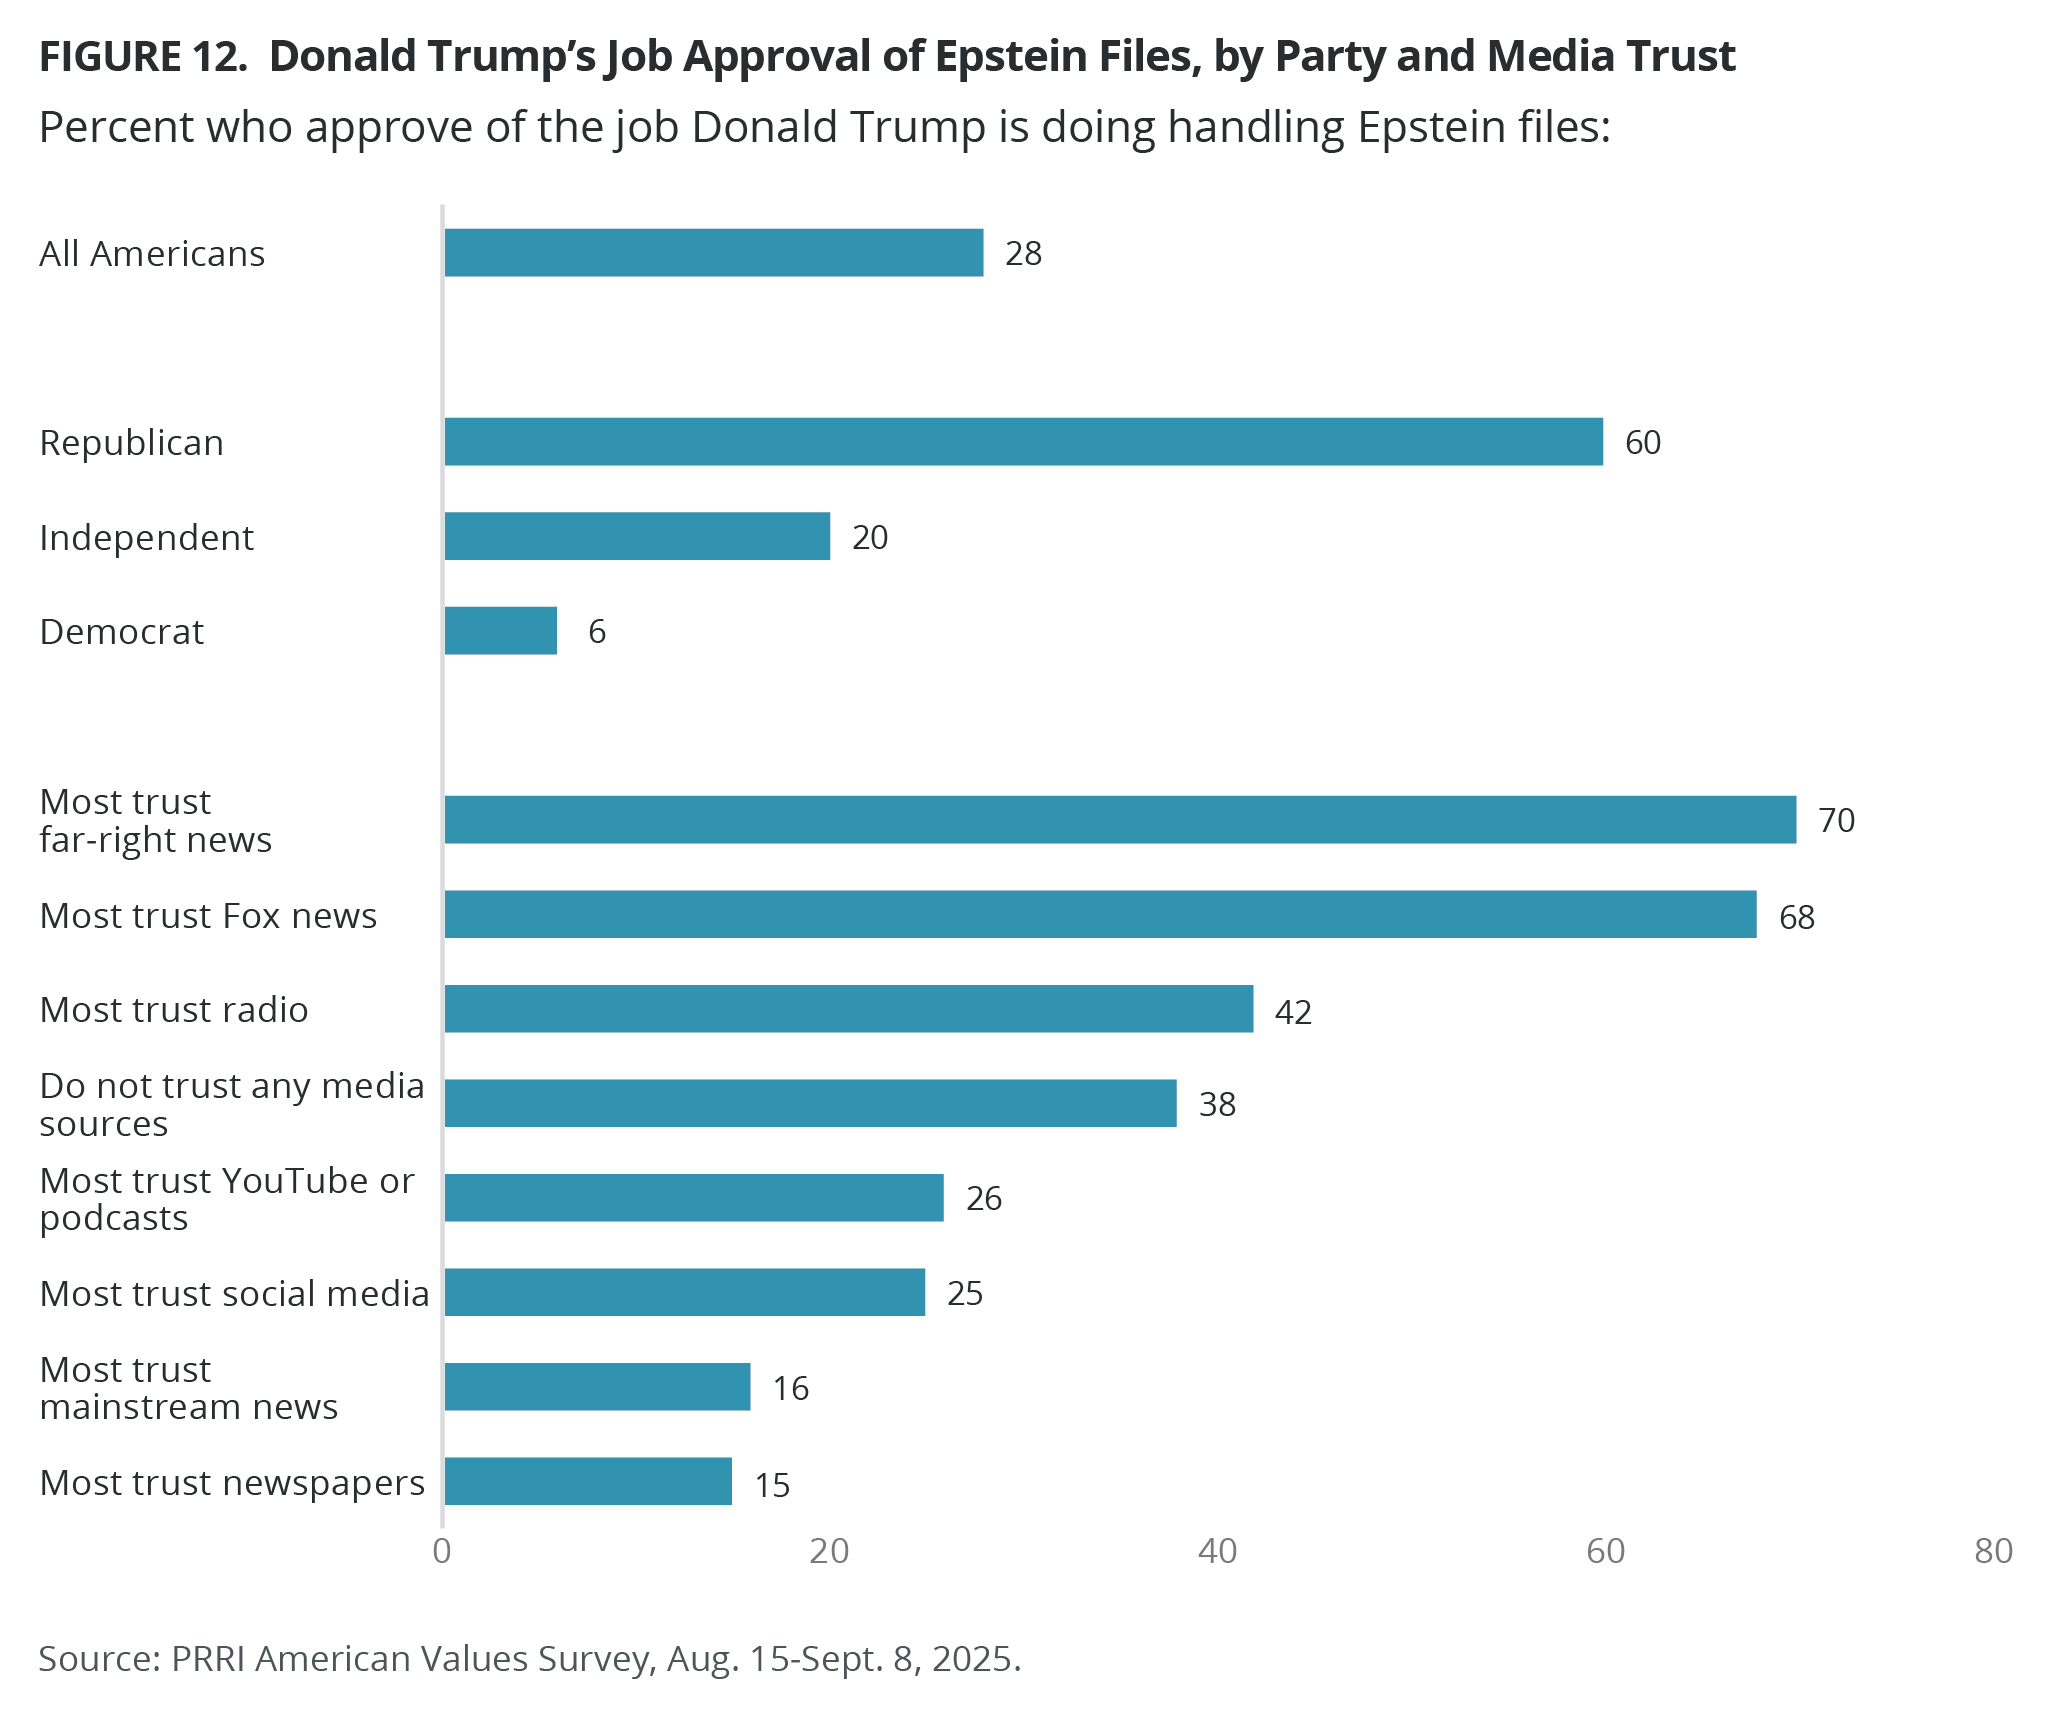
When asked specifically about the job Trump is doing handling the controversy over the Epstein files, just 28% approve, while most disapprove (68%). Most Republicans (60%) approve of the job Trump is doing handling the Epstein files, compared with 20% of independents and 6% of Democrats.
Americans who most trust far-right news show the highest level of approval of Trump’s job handling the Epstein files at 70%, followed by 68% who most trust Fox News. Around four in ten Americans who most trust the radio (42%) and who do not trust any media source also approve (38%). Far fewer Americans who most trust YouTube or podcasts (26%), social media (25%), mainstream news (16%), and newspapers (15%) approve of Trump’s job handling the Epstein files.
Favorability Ratings
Donald Trump
Four in ten Americans (40%) express favorable views of Trump, while 58% express unfavorable views, including 46% who say they have a very unfavorable view of him. In April 2016, before Trump officially secured the Republican Party presidential nomination, his favorability stood at 24%. By the 2016 election, his favorability rating had risen to 33%. Since his first election as president, Trump’s favorability ratings have fluctuated, ranging from a high of 44% in the first quarter of 2019 to a low of 31% in 2021, shortly after the Jan. 6 insurrection at the U.S. Capitol.
Unsurprisingly, most Republicans hold a favorable view of Trump (85%), including a majority who say they hold a very favorable view (50%). Republican favorable views of Trump have remained consistently strong over the past decade. In April 2016, 53% of Republicans expressed favorable views of Trump. That number jumped to 76% ahead of the 2016 election and to 87% by February 2017, staying above 80% through 2020. Following the 2020 election, Trump’s favorability among Republicans declined to 72% in the beginning of both 2021 and 2023. However, by 2025, those numbers have rebounded above 80%. In contrast, just 5% of Democrats express a favorable view of Trump, a share that has remained steady over the past decade. Independents have largely mirrored the views of all Americans over the years, with a smaller share expressing a favorable view of Trump in 2025 (30%) than all Americans (40%).
Among religious groups, Trump’s favorability is highest among white evangelical Protestants (72%), followed by 55% of white mainline/non-evangelical Protestants, and 54% of white Catholics. These groups have become more favorable toward Trump since 2016 (61%, 46%, and 43%, respectively). Fewer Hispanic Protestants (48%), Jewish Americans (27%), other non-Christians (24%), Hispanic Catholics (25%), religiously unaffiliated (20%), and Black Protestants (19%) rate Trump favorably. Since 2016, Trump’s favorability has grown among Black Protestants (from 7%) and Hispanic Catholics (from 14%). A majority of Americans who attend religious services weekly or more hold favorable views (55%), along with 43% of those who attend monthly or a few times a year and 32% of those who seldom or never attend services.
Most Christian nationalism Adherents (74%) and Sympathizers (64%) have a favorable opinion of Trump, compared with four in ten Skeptics (40%) and one in ten Rejecters (9%).
JD Vance
Over one-third of Americans have a favorable view of Vice President JD Vance (35%), compared with a majority who hold an unfavorable view (52%), and 10% who have not heard of him. Nearly eight in ten Republicans hold a favorable opinion of Vance (78%), while only 25% of independents and 5% of Democrats say the same.
White evangelical Protestants (67%) are the only religious group with strong majority favorable views of Vance, followed by half of white mainline/non-evangelical Protestants (51%) and white Catholics (50%). Far fewer Hispanic Protestants (35%), Jewish Americans (31%), Hispanic Catholic (21%), unaffiliated Americans (17%), Black Protestants (17%), and members of other non-Christian religions (17%) express a favorable view of Vance. Two in ten Hispanic Protestants (20%) and Hispanic Catholics (19%) remain unfamiliar with the vice president.
A majority of Christian nationalism Adherents (68%) and Sympathizers (56%) have a favorable opinion of Vance, compared with one-third of Skeptics (34%) and just 8% of Rejecters.
Trump’s Leadership
Is Trump a Strong Leader or a Dangerous Dictator?
A majority of Americans are more likely to agree with the statement “President Trump is a potentially dangerous dictator whose power should be limited before he destroys American democracy” (56%) than with the statement “President Trump is a strong leader who should be given the power he needs to restore America’s greatness” (41%). The percentage of Americans who see Trump as a potentially dangerous dictator has increased slightly since March 2025, when PRRI first asked this question (52%). Most Democrats (91%, up from 87%) agree with the first statement, and most Republicans agree with the second statement (82%, consistent with 81% in March). The proportion of independents who agree that Trump is a dangerous dictator has increased by 9 percentage points since March, from 56% to 65%.
Solid majorities of Americans who most trust newspapers (78%), mainstream news (73%), and social media (59%) for accurate political information agree that Trump is a potentially dangerous dictator. By contrast, solid majorities of those who most trust far-right news (88%), Fox News (82%), and the radio (63%), and 57% of those who do not trust any media sources agree that Trump is a strong leader who should be given the power he needs to restore America’s greatness.
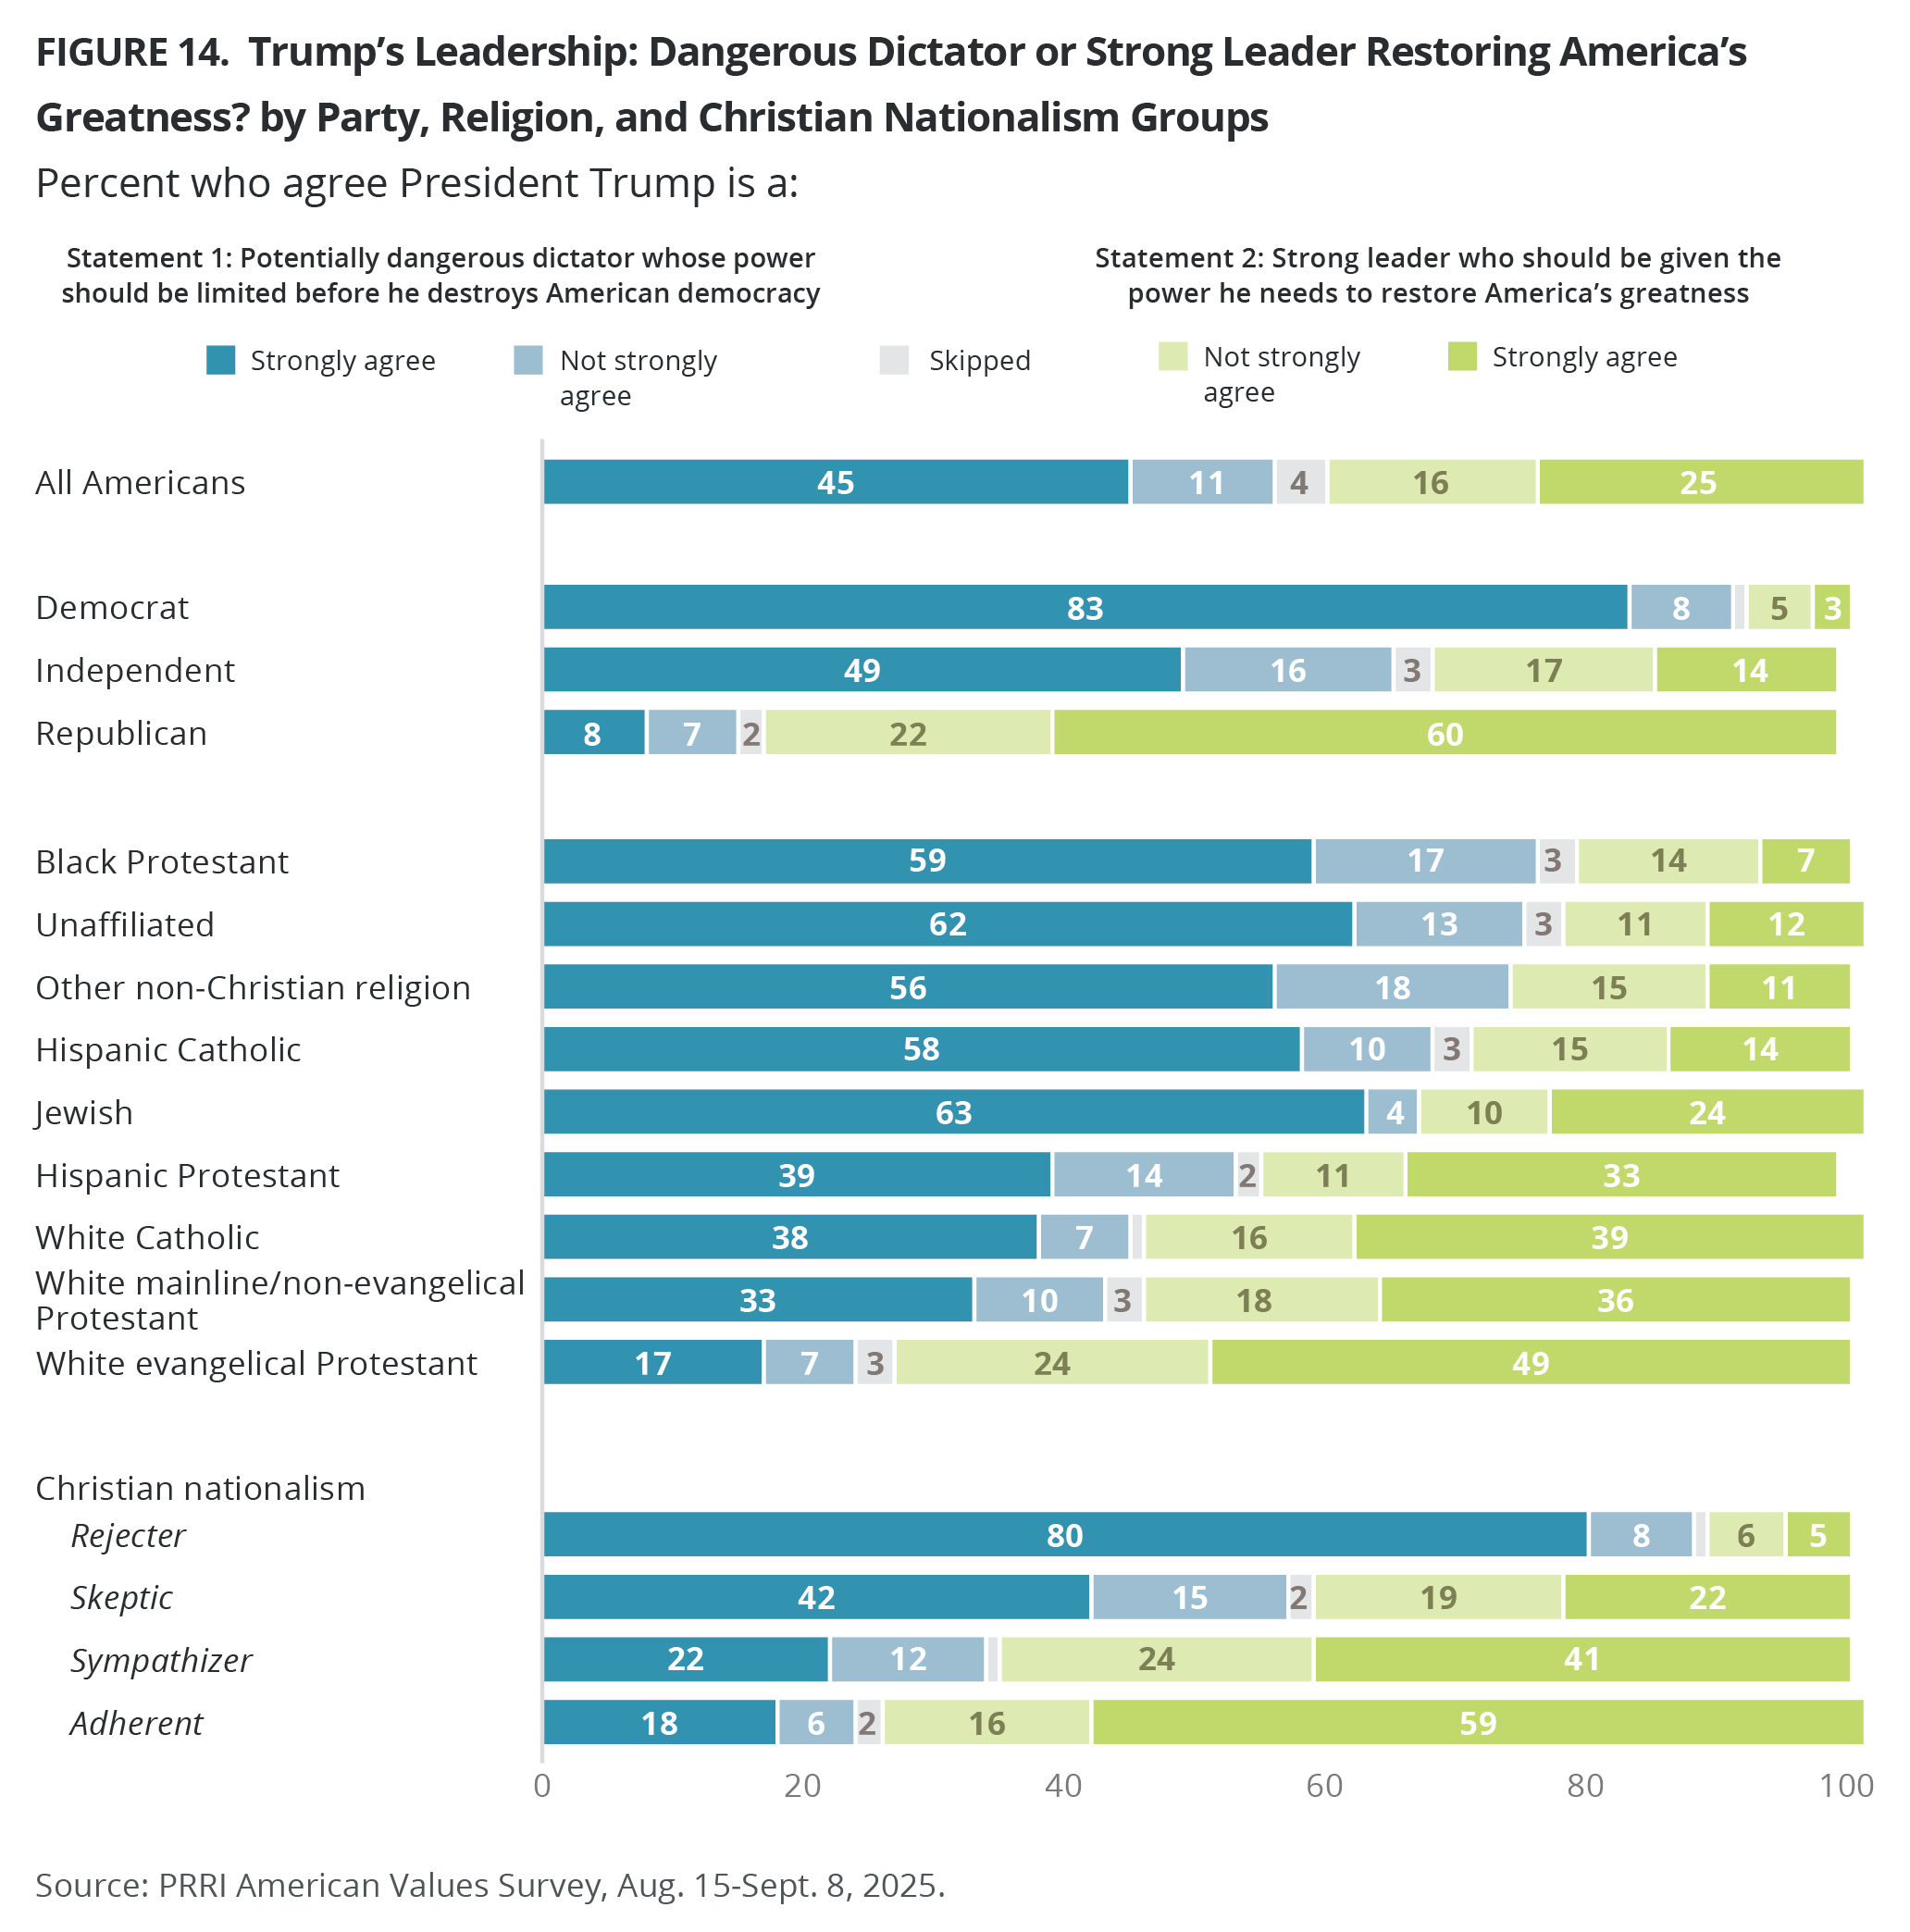
Majorities of white Christian groups, including three in four white evangelical Protestants (73%), 55% of white Catholics, and 54% of white mainline/non-evangelical Protestants, view Trump as a strong leader who should be given the power to restore America’s greatness. By contrast, majorities of Christians of color, non-Christians, and unaffiliated Americans — including 76% of Black Protestants, 75% of unaffiliated Americans, 74% of other non-Christians, 68% of Hispanic Catholics, 67% of Jewish Americans, and 53% of Hispanic Protestants — view Trump as a potentially dangerous dictator whose power should be limited. Those who attend religious services seldom or never (65%) are more likely than those who attend monthly (53%) or weekly (39%) to view Trump as a dangerous dictator.
Most Christian nationalism Rejecters (88%) and Skeptics (57%) agree that Trump is a potentially dangerous dictator, compared with just 34% of Sympathizers and 24% of Adherents. By contrast, most Adherents (75%) and Sympathizers (65%) view Trump as a strong leader who should be given the power to restore America’s greatness, compared with 41% of Skeptics and just 11% of Rejecters.
Trump’s Federal Overhaul: Assault on Checks and Balances or Long-Overdue Correction?
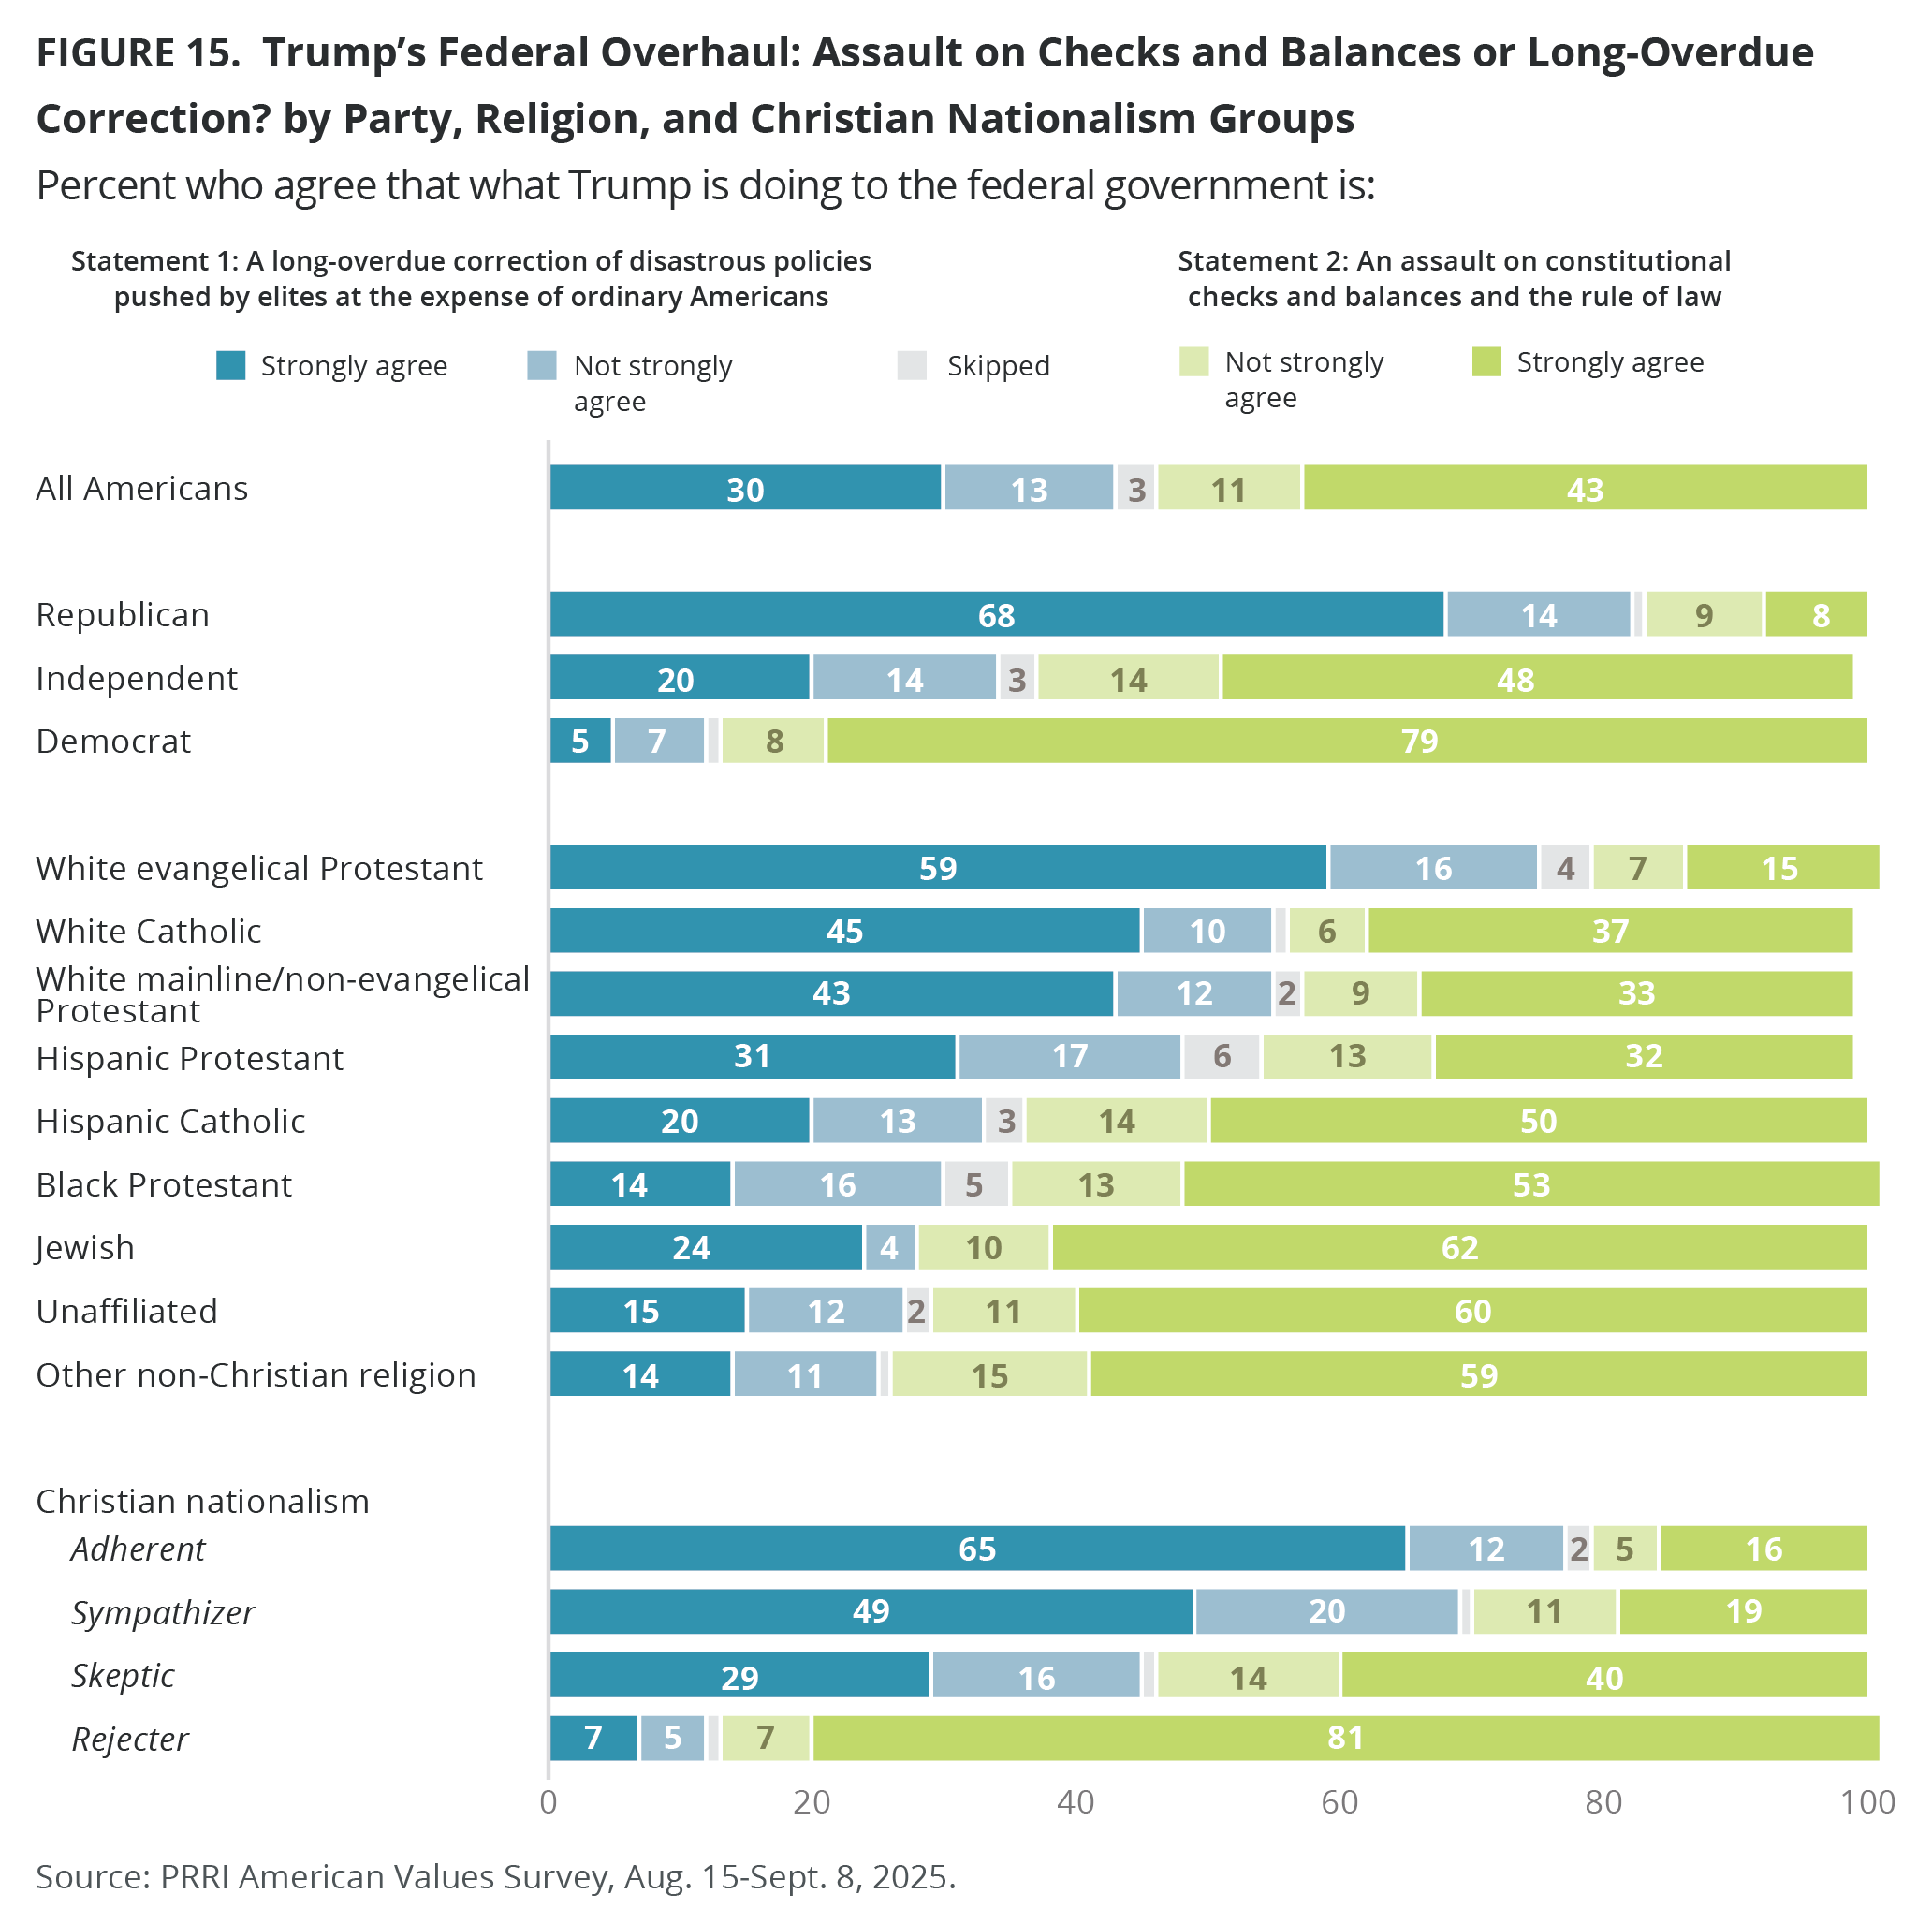
Most Americans agree with the statement “What President Trump is doing to the federal government is an assault on constitutional checks and balances and the rule of law” (54%), compared with 43% who agree with the statement “What President Trump is doing to the federal government is a long-overdue correction of disastrous policies pushed by elites at the expense of ordinary Americans.” Most Democrats (87%) and independents (62%) agree with the first statement, compared with only 17% of Republicans. Conversely, most Republicans (82%) agree with the second statement.
Majorities of white Christians — including white evangelical Protestants (75%), white Catholics (55%), and white mainline/non-evangelical Protestants (55%) — agree that what Trump is doing to the federal government is a long-overdue correction. Hispanic Protestants are equally divided over both statements (45% vs. 48%). By contrast, majorities of all other religious groups agree that what Trump is doing to the federal government is an assault on constitutional checks and balances and the rule of law, including roughly seven in ten other non-Christians (74%), Jewish Americans (72%), unaffiliated Americans (71%), Black Protestants (66%), and Hispanic Catholics (64%). Most of those who attend religious services weekly (59%) and half of those who attend monthly (49%) agree that what Trump is doing to the federal government is a long-overdue correction, compared with 35% of those who attend religious services seldom or never.
Most Christian nationalism Rejecters (88%) and Skeptics (54%) agree that Trump’s changes to the federal government are an assault on constitutional checks and balances and the rule of law, compared with just 30% of Sympathizers and 21% of Adherents. By contrast, 77% of Adherents and 69% of Sympathizers view Trump’s changes to the federal government as a long-overdue correction, compared with 45% of Skeptics and just 12% of Rejecters.
God Saved Trump From Being Assassinated
In the wake of the assassination attempts on Trump, most Americans disagree with the statement “God saved Donald Trump from being assassinated so that he could lead America into a glorious future” (70%), compared with 25% who agree. Strong majorities of Democrats (93%) and independents (80%) disagree, compared with 41% of Republicans. Most Republicans (54%) agree with the statement.
Except for white evangelical Protestants, most religious groups disagree that God saved Trump from being assassinated so he could lead America into a glorious future, including religiously unaffiliated Americans (87%), Jewish Americans (83%), non-Christians (82%), Hispanic Catholics (79%), Black Protestants (77%), white Catholics (65%), white mainline/non-evangelical Protestants (65%), and Hispanic Protestants (59%). By contrast, a majority of white evangelical Protestants agree (53%) that God saved Trump from being assassinated, compared with 41% who disagree. Majorities of those who attend religious services weekly or more (55%), attend monthly or a few times a year (66%), and seldom or never attend services disagree (81%).
Overwhelming majorities of Christian nationalism Rejecters (97%) and Skeptics (81%) and half of Sympathizers (49%) disagree that God saved Trump from being assassinated so he could lead America into a glorious future, but most Adherents (68%) agree.
Confidence in Institutions
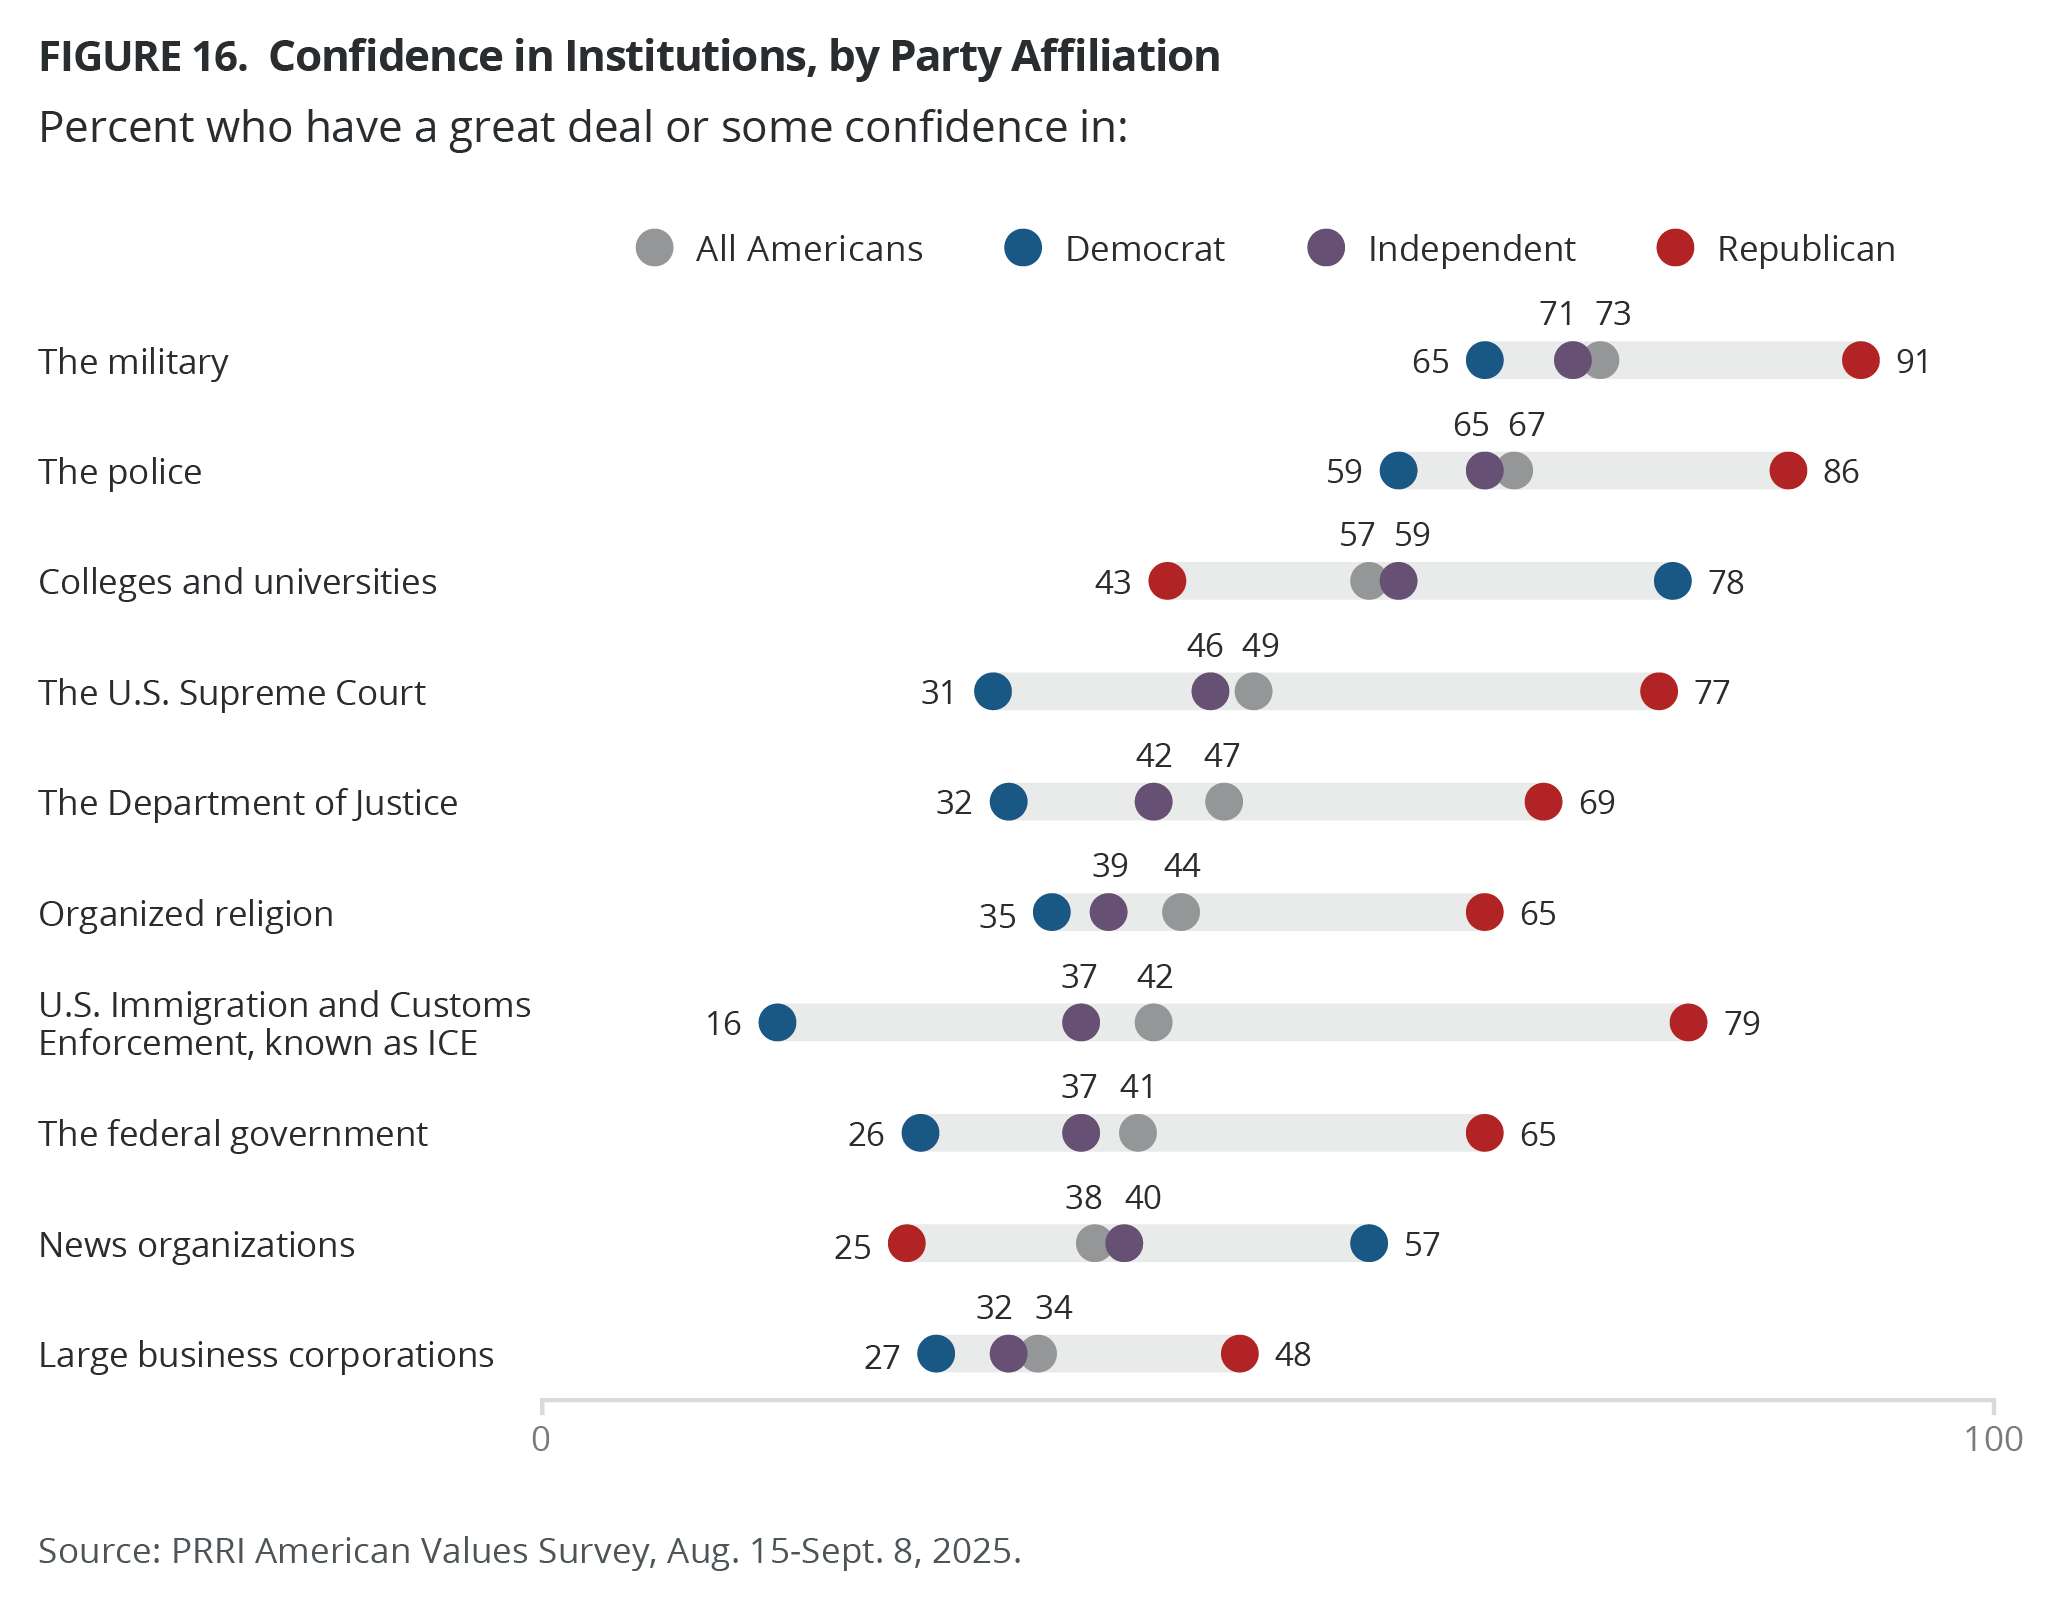
There is a wide disparity in public confidence in different major institutions in the country. While majorities of Americans report having a great deal or some confidence in the military (73%), the police (67%, down from 75% in 2015), and colleges and universities (57%), no more than half say they have a great deal or some confidence in the U.S. Supreme Court (49%), the Department of Justice (47%), and organized religion (44%, down from 55% in 2015). Far fewer Americans have a great deal or some confidence in ICE (42%), the federal government (41%, down from 50% in 2015), news organizations (38%, down from 47% in 2015), and large business corporations (34%, down from 46% in 2015).[1]
However, Republicans and Democrats remain deeply polarized. Most Republicans have a great deal or some confidence in the military (91%), the police (86%), ICE (79%), the U.S. Supreme Court (77%), the Department of Justice (69%), the federal government (65%), and organized religion (65%). Democrats have the most confidence in colleges and universities (78%), the military (65%), the police (59%), and news organizations (57%). Democrats are far less likely to have a great deal of confidence in organized religion (35%), the Department of Justice (32%), the U.S. Supreme Court (31%), large business corporations (27%), the federal government (26%), and ICE (16%). By contrast, half of Republicans have confidence in large business corporations (48%), and only 25% have confidence in news organizations.
While independents tend to mirror all Americans, they are slightly less likely to have a great deal or some confidence in the Department of Justice (42%), organized religion (39%), the federal government (37%), and ICE (37%).
Elections and Political Parties
The 2026 Midterm Election
If the 2026 midterm election were held today, 33% of Americans say they would vote for the Democratic candidate, 30% say they would vote for the Republican candidate, 20% say they do not know who they would vote for, and one in ten (12%) say they would not vote in the midterms. Just 4% say they would vote for a third party or some other candidate. Unsurprisingly, most Democrats (83%) and Republicans (79%) say they would vote for their respective party’s candidates. Independents are twice as likely to say they would vote for the Democratic candidate (30%) over the Republican candidate (15%). However, one-third do not know who they would vote for (33%) and one in ten would either not vote (11%) or vote for a third-party candidate (10%).
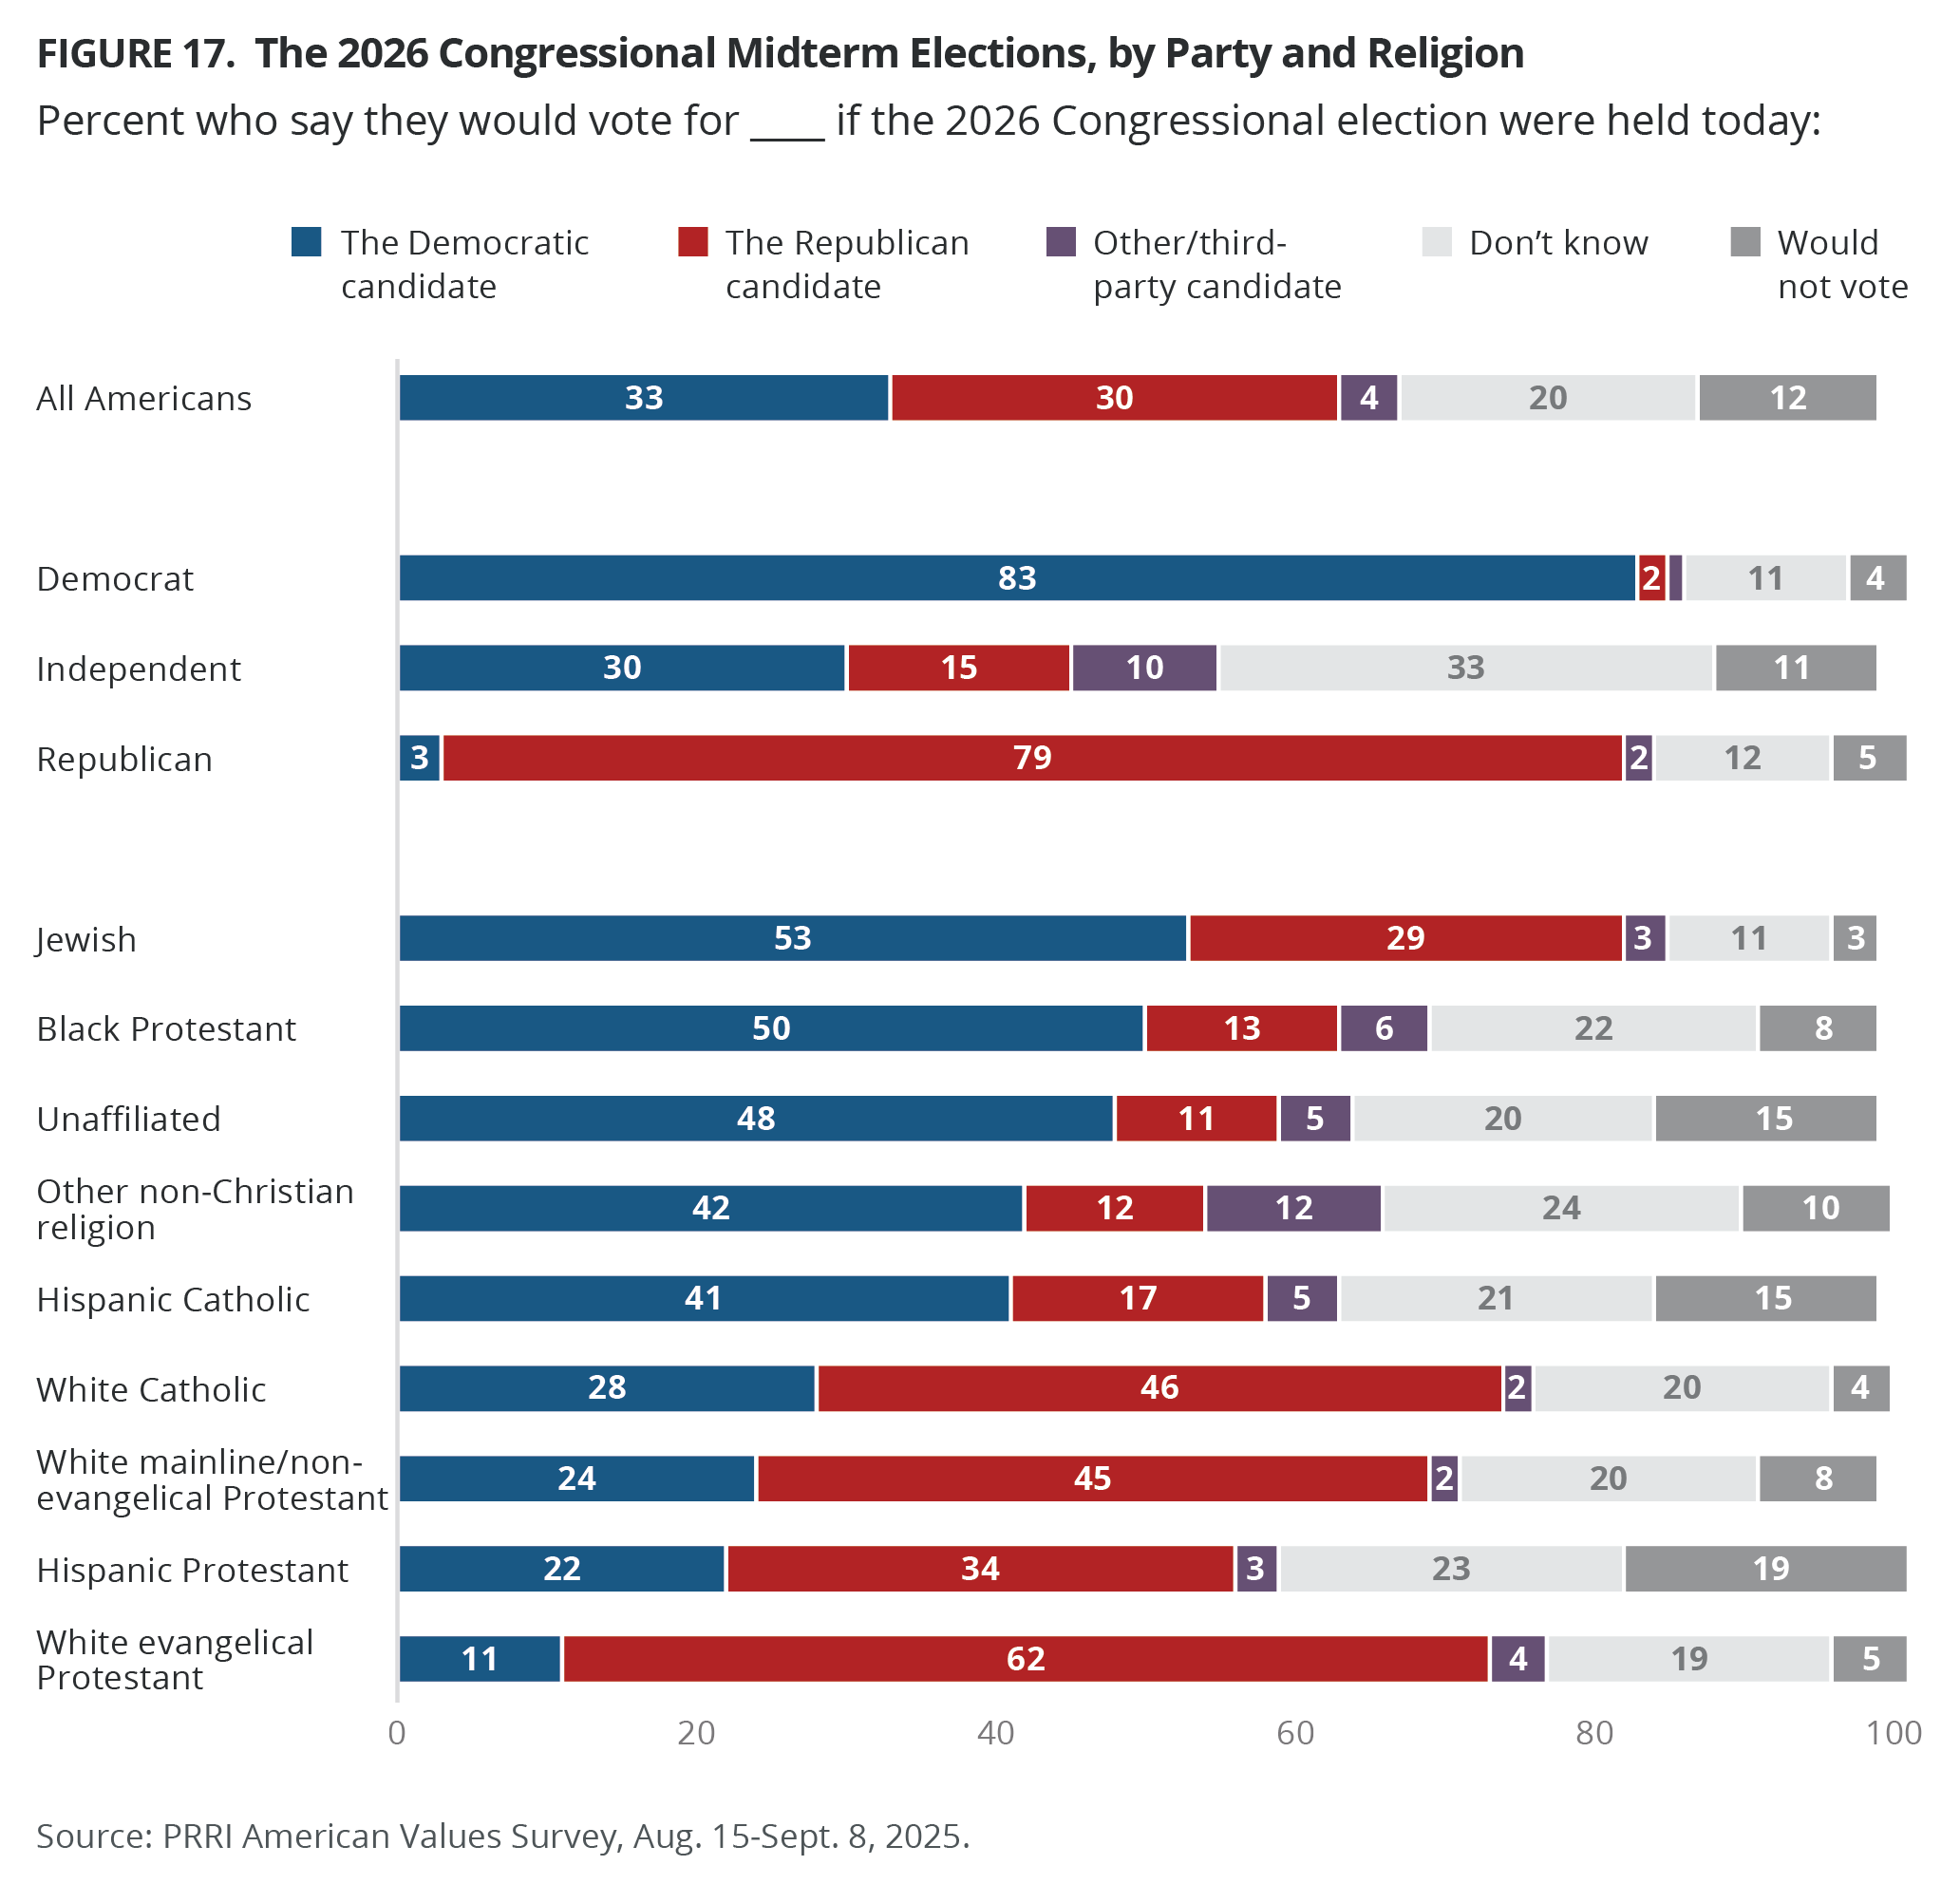
White evangelical Protestants (62%) are the only religious group with a majority who would vote for the Republican candidate if the 2026 elections were held today. By contrast, Jewish Americans (53%) are the only religious group with a majority who would vote for the Democratic candidate. White Catholics (46% vs. 28%), white mainline/non-evangelical Protestants (45% vs. 24%), and Hispanic Protestants (34% vs. 22%) are more likely to say they would vote for the Republican candidate than the Democratic candidate. Conversely, Black Protestants (50% vs. 13%), unaffiliated Americans (48% vs. 11%), members of other non-Christian religions (42% vs. 12%), and Hispanic Catholics (41% vs. 17%) are more likely to say they would vote for the Democratic candidate than the Republican candidate. About two in ten Hispanic Protestants (19%), Hispanic Catholics (15%), and unaffiliated Americans (15%) say they would not vote if the 2026 congressional election were held today.
Among racial groups, white Americans are more likely to say they would vote for the Republican candidate (39%) over the Democratic candidate (30%), while Black (46% vs. 8%), multiracial (38% vs. 21%), AAPI (37% vs. 18%), and Hispanic Americans (35% vs. 19%) are more likely to say they would vote for the Democratic than the Republican candidate. Black and Hispanic Americans, with or without a college degree, favor the Democratic candidate. However, white college graduates prefer the Democratic candidate (42% vs. 35%), while whites without a college degree prefer the Republican candidate (41% vs. 22%).
Millennials (34% vs. 24%) and Gen Zers (31% vs. 21%) are more likely to say they would vote for the Democratic candidate than the Republican candidate, while Gen Xers (31% vs. 32%), baby boomers (35% vs. 39%), and members of the Silent Generation (40% vs. 39%) are equally likely to vote for either candidate.
Support for Trump Possibly Postponing the 2026 Midterm Elections
Most Americans (69%) disagree with the statement “If states cannot get voter fraud under control, President Trump should postpone the 2026 midterm elections for Congress,” compared with 26% who agree. While majorities of Democrats (82%), independents (75%), and Republicans (59%) disagree with postponing the 2026 midterms, 40% of Republicans agree.
Majorities of all religious groups oppose Trump postponing the 2026 midterms, including 87% of Jewish Americans, about three in four unaffiliated (76%), white Catholics (75%), and non-Christians (73%), as well as roughly two-thirds of white mainline/non-evangelical Protestants (68%), Black Protestants (67%), and white evangelical Protestants (64%). Six in ten Hispanic Catholics (61%) and 51% of Hispanic Protestants also oppose postponing the 2026 midterm elections.
Most Christian nationalism Rejecters (87%), Skeptics (72%), and Sympathizers (60%) disagree with postponing the midterms, compared with 44% of Adherents.
Favorability for the Parties
The Republican Party
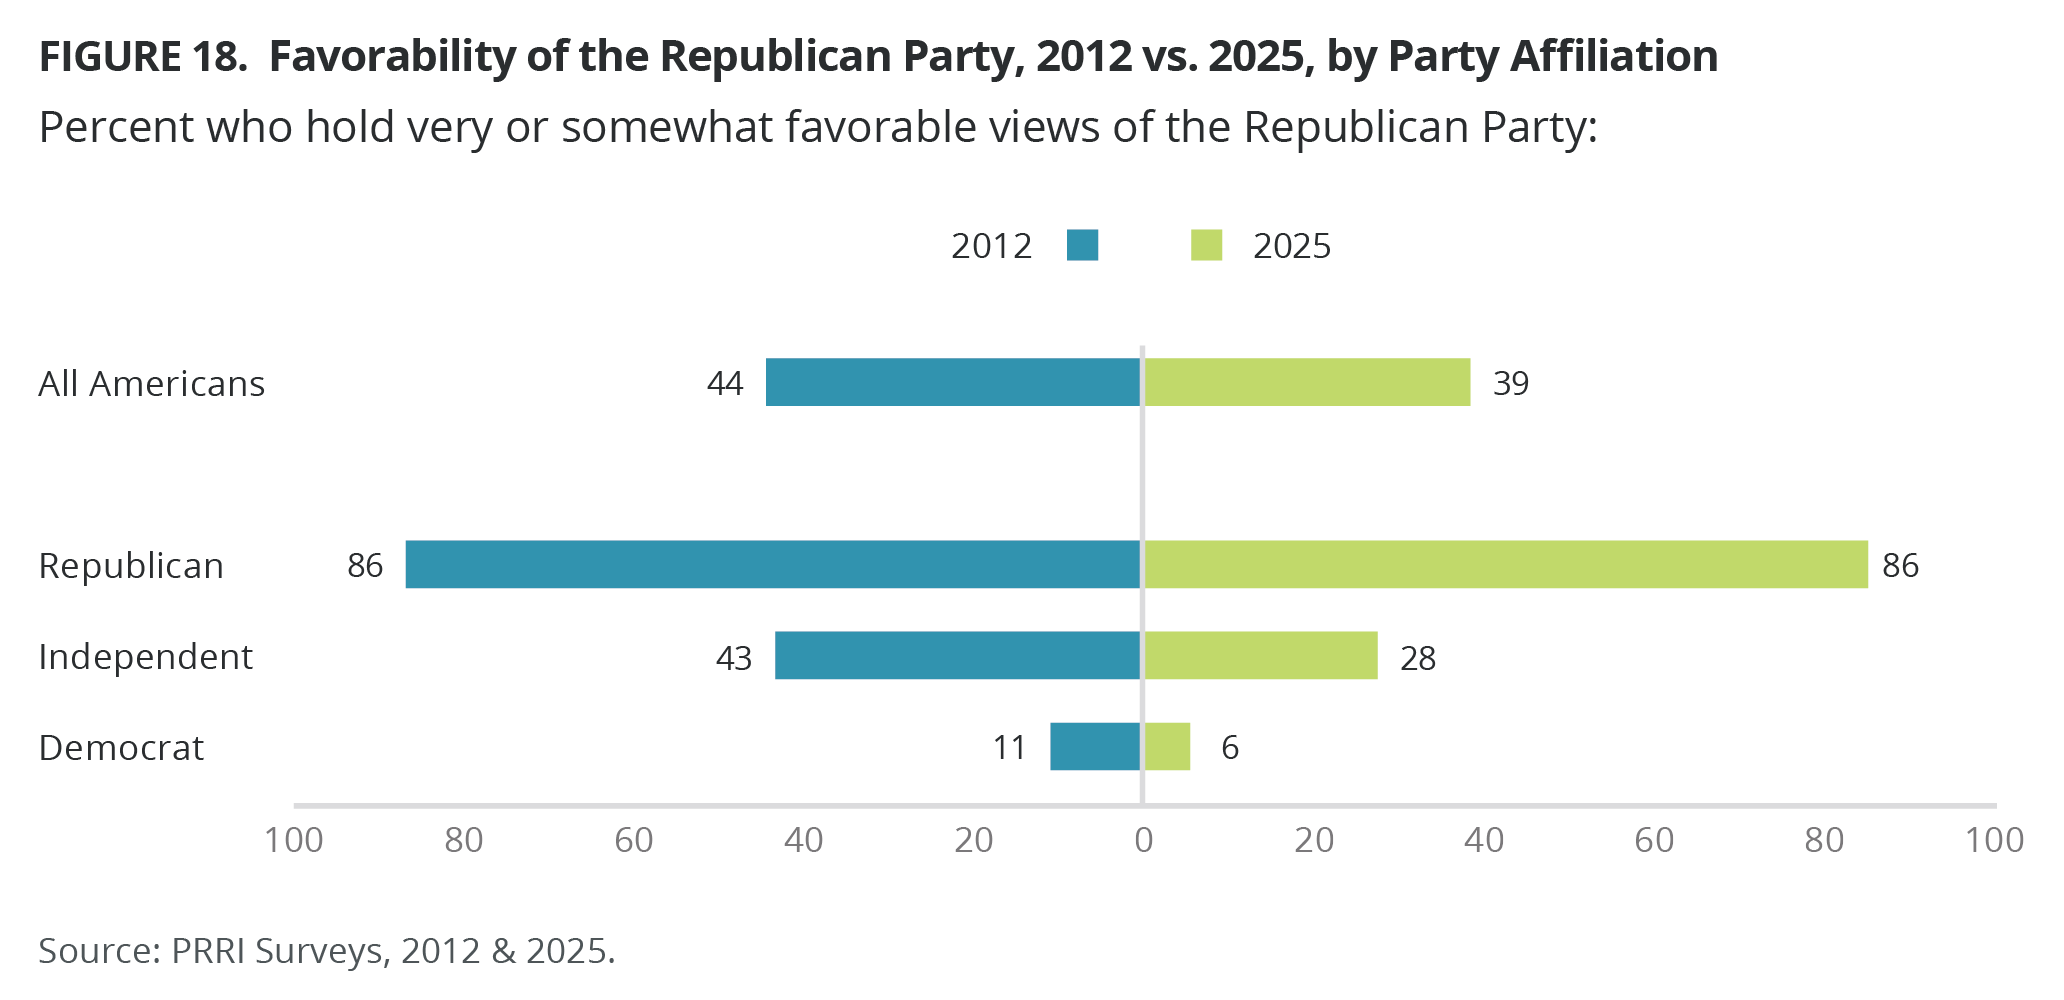
Around four in ten Americans (39%) hold favorable views of the Republican Party, while the majority (57%) view the party unfavorably. Favorability for the Republican Party has declined since the first time PRRI asked this question in 2012 (44%). Most Republicans (86%) hold favorable views of their party, compared with only 28% of independents and 6% of Democrats. Since 2012, independents (43% to 28%) and Democrats (11% to 6%) have shown a decrease in favorable views, while Republicans have remained consistent (86%).
White evangelical Protestants (71%) are the most likely to hold favorable views of the Republican Party, followed by at least half of white mainline/non-evangelical Protestants (55%), white Catholics (52%), and Hispanic Protestants (49%). Around three in ten Jewish Americans (31%) and Hispanic Catholics (28%), as well as two in ten members of other non-Christian religions (20%), Black Protestants (19%), and unaffiliated Americans (19%), hold favorable views of the Republican Party.
Most Christian nationalism Adherents (73%) and Sympathizers (64%) view the Republican Party favorably, compared with 40% of Skeptics and only 8% of Rejecters.
Reasons Americans View the Republican Party Unfavorably
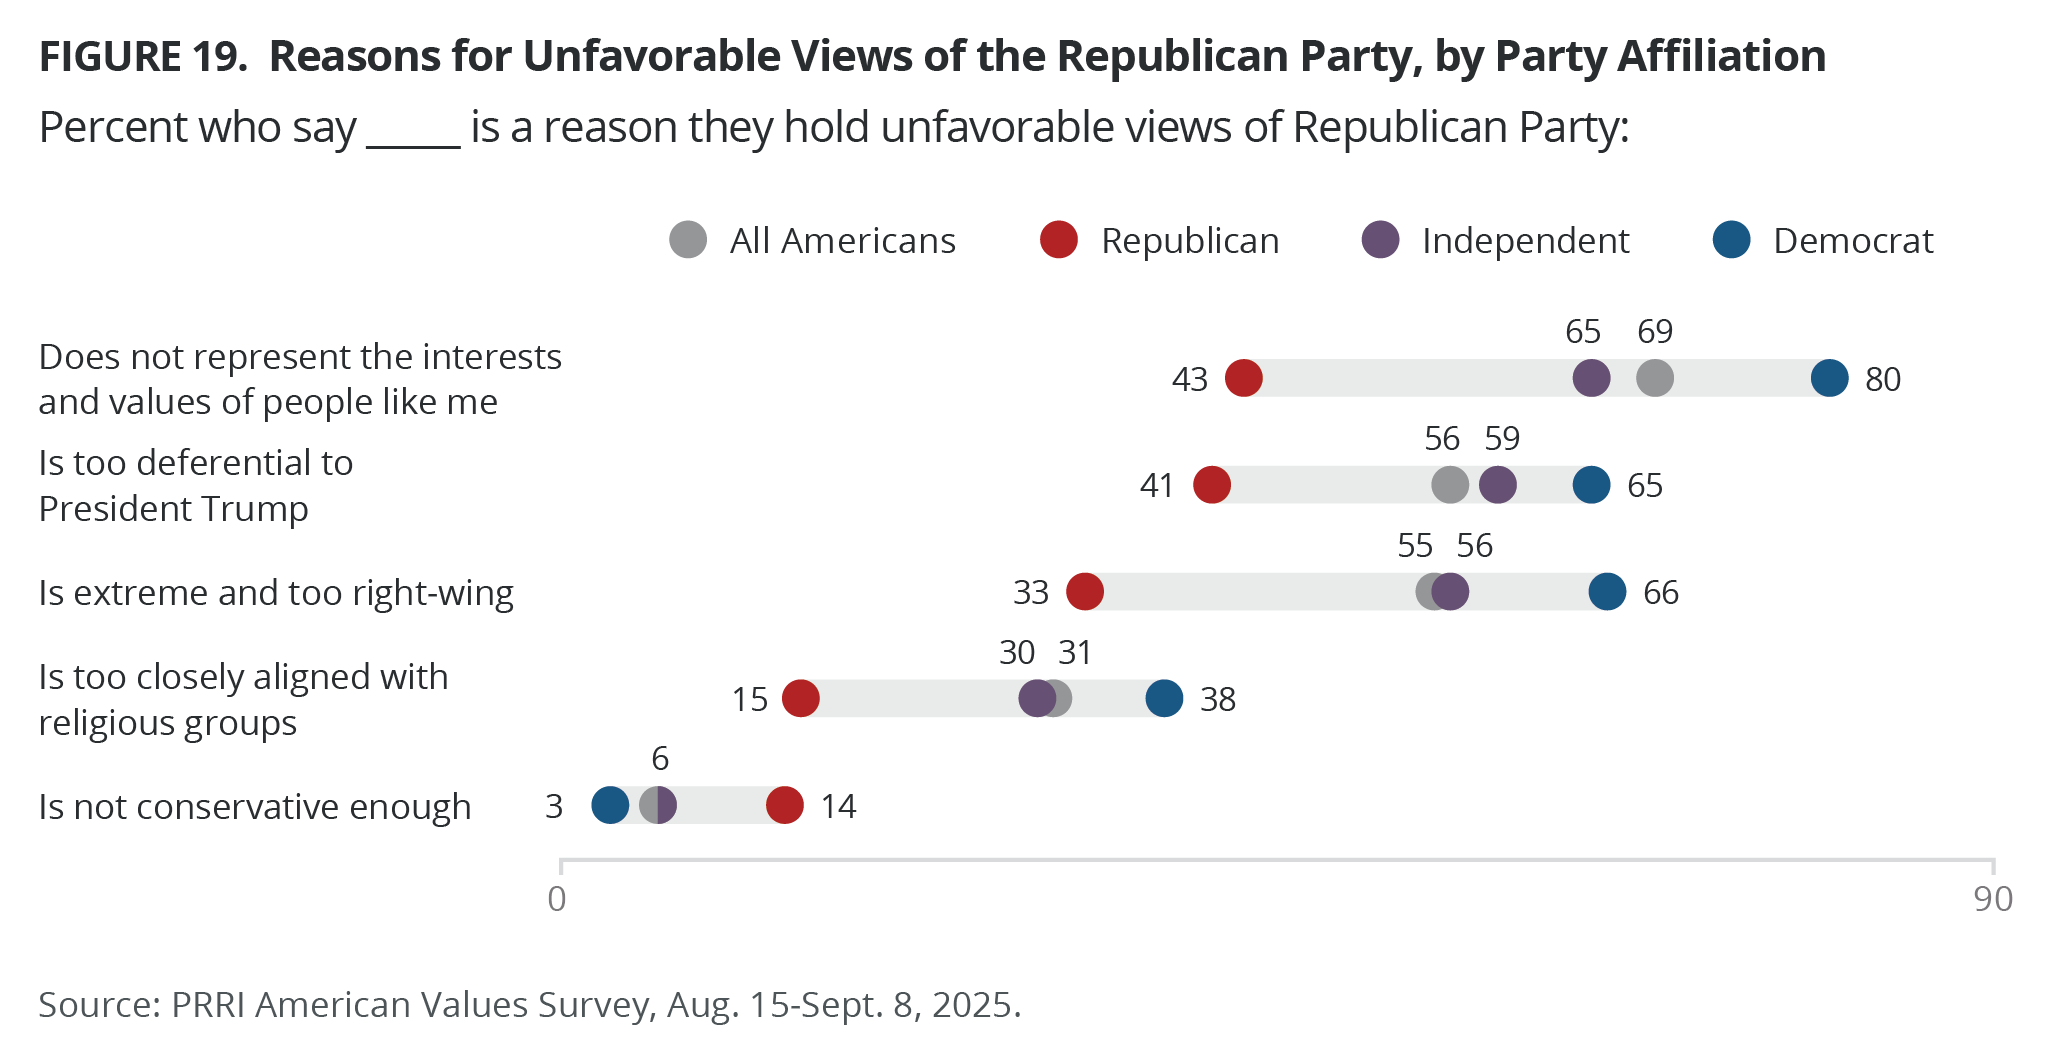
PRRI asked Americans to select all the reasons they hold an unfavorable view of the Republican Party. Of the 57% who hold unfavorable views, seven in ten say it is because the party does not represent the interests and values of people like them (69%). About six in ten say it is either because the party is too deferential to President Trump (56%) or it is extreme and too right-wing (55%). Three in ten say the Republican party is too closely aligned with religious groups (31%), and just 6% say it is because the party is not conservative enough.
Only 13% of Republicans view their own party unfavorably. Around four in ten of these Republicans say it is either because the party does not represent the interests and values of people like them (43%) or it is too deferential to Trump (41%). One-third say it is because the party is extreme and too right-wing (33%). Less than two in ten say the party is too closely tied to religious groups (15%) or is not conservative enough (14%).
Of the 69% of independents who hold an unfavorable view of the Republican Party, most say it is because the party does not represent the interests and values of people like them (65%), is too deferential to Trump (59%), or is extreme and too right-wing (56%). Three in ten say it is too closely tied to religious groups (30%), and 6% say the party is not conservative enough.
The Democratic Party
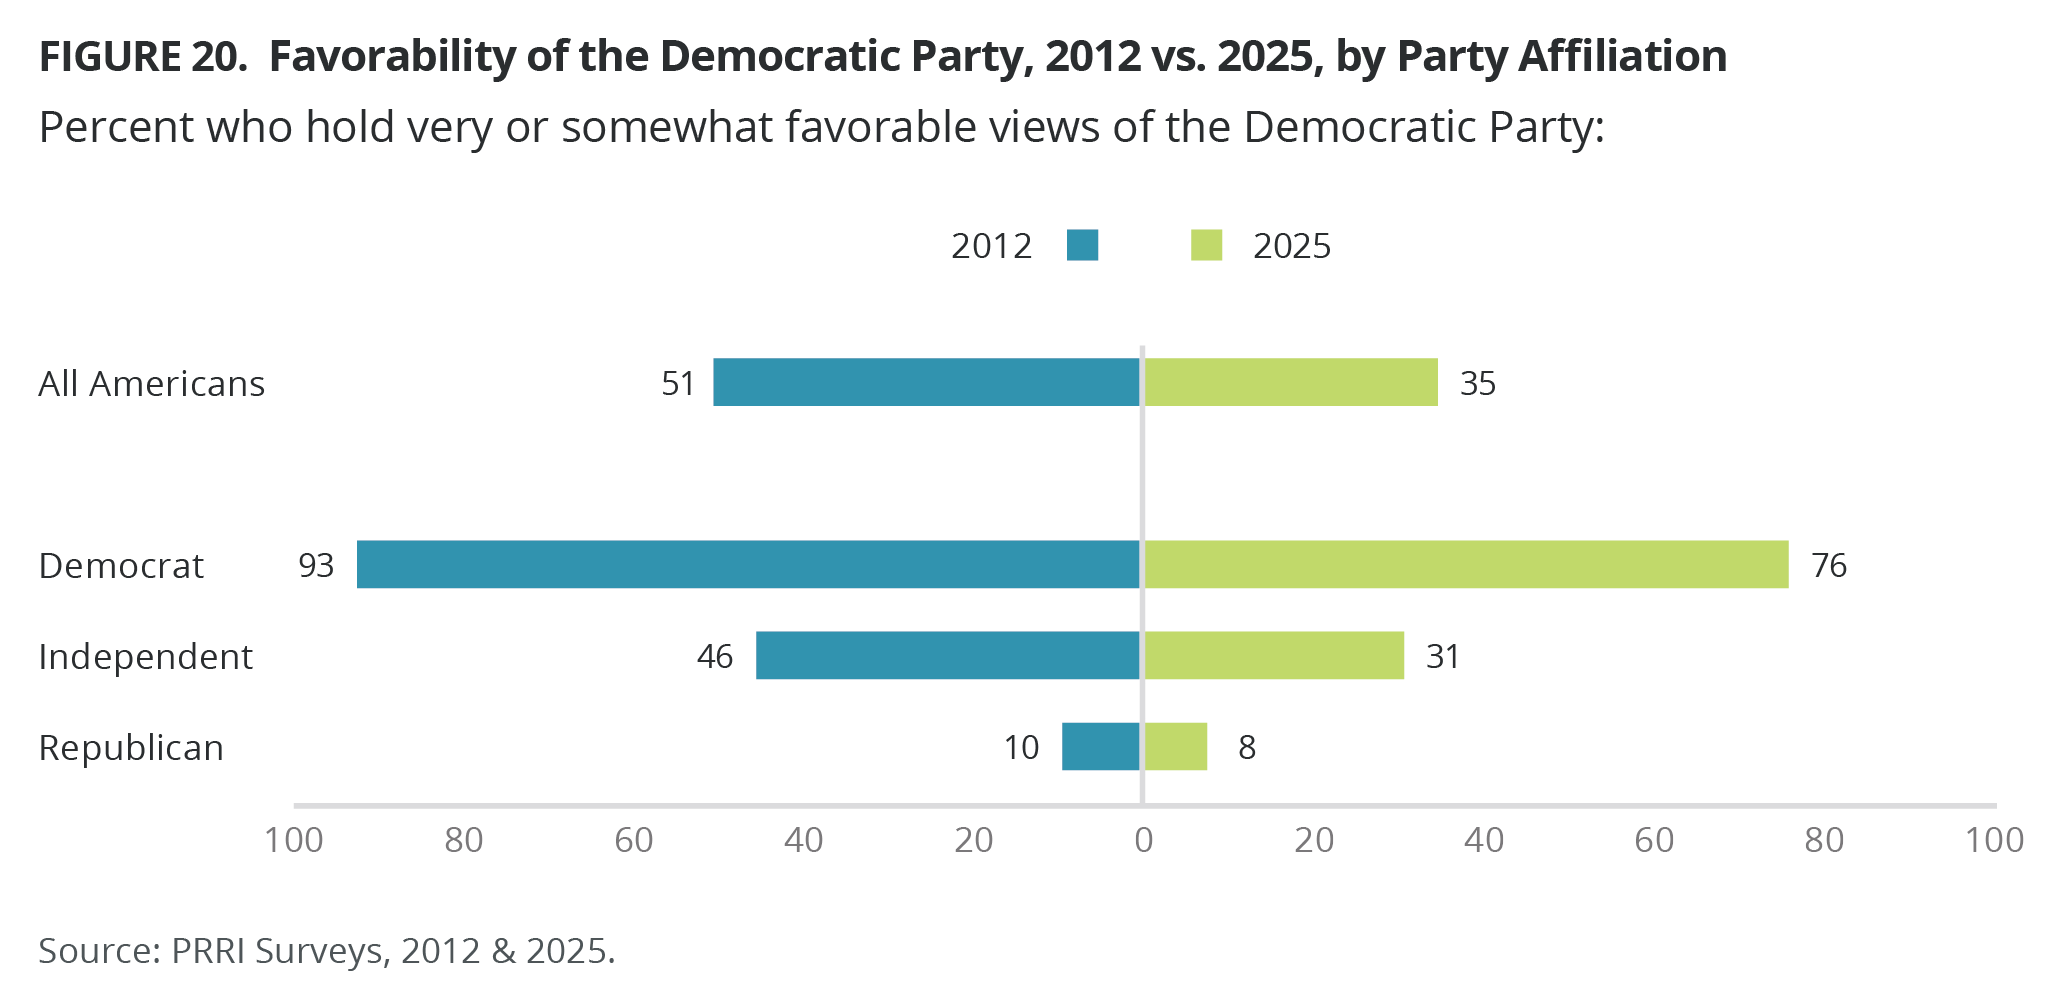
About one-third of Americans view the Democratic Party favorably (35%), compared with six in ten who hold an unfavorable view (60%). Favorable views of the Democratic Party have declined since 2012, when a slim majority of Americans (51%) viewed it favorably. Three in four Democrats hold favorable views of their own party (76%). However, this is a significant decline from 93% in 2012. Favorable views among independents have also declined, from 46% in 2012 to 31% in 2025. Republicans have held consistently low views of the Democratic Party (10% to 8%).
Around half of Black Protestants (52%), Hispanic Catholics (51%), and members of other non-Christian religions (49%) hold favorable views of the Democratic Party, as do about four in ten Jewish (43%) and unaffiliated Americans (42%). Around three in ten Hispanic Protestants (32%), white Catholics (29%), and white mainline/non-evangelical Protestants (26%) also hold favorable views. Only 16% of white evangelical Protestants view the Democratic Party favorably.
The majority of Americans who qualify as Christian nationalism Rejecters (56%) say they hold favorable views of the party, compared with 33% of Skeptics, 22% of Sympathizers, and 18% of Adherents.
Reasons Americans View the Democratic Party Unfavorably
Of the six in ten Americans (60%) who view the Democratic Party unfavorably, the majority say it is because the party does not represent the interests and values of people like them (65%) or because the party is extreme and too left-wing (52%). Around two in ten say it is because the Democratic Party is anti-religious (20%) or not fighting hard enough against President Trump (19%), and 14% say the party is not progressive enough.
Of the 22% of Democrats who hold unfavorable views of their own party, over six in ten say it is because the party is not fighting hard enough against Trump (63%). Around three in ten say the party does not represent the interests and values of people like them (33%) or it is not progressive enough (29%). Two in ten believe the party is extreme and too left wing (21%), and only 2% hold unfavorable views because the party is anti-religious.
Of the 65% of independents who view the Democratic Party unfavorably, the majority say it is because the party does not represent the interests and values of people like them (60%). Nearly half of independents say the Democratic Party is extreme and too left-wing (47%), 28% say it is not fighting hard enough against Trump, 18% say it is not progressive enough, and 15% say it is anti-religious.
Democracy and the Supreme Court
The Ability to Criticize the Government Is Less Protected in Recent Years
Nearly seven in ten Americans (69%) agree with the statement “The ability of Americans to freely criticize the government without fear of punishment is a right that seems less protected than in previous years.” One-quarter of Americans (25%) disagree with the statement. Majorities of Democrats (86%), independents (73%), and Republicans (54%) agree with this statement.
The System of Checks and Balances Is Working as it Should
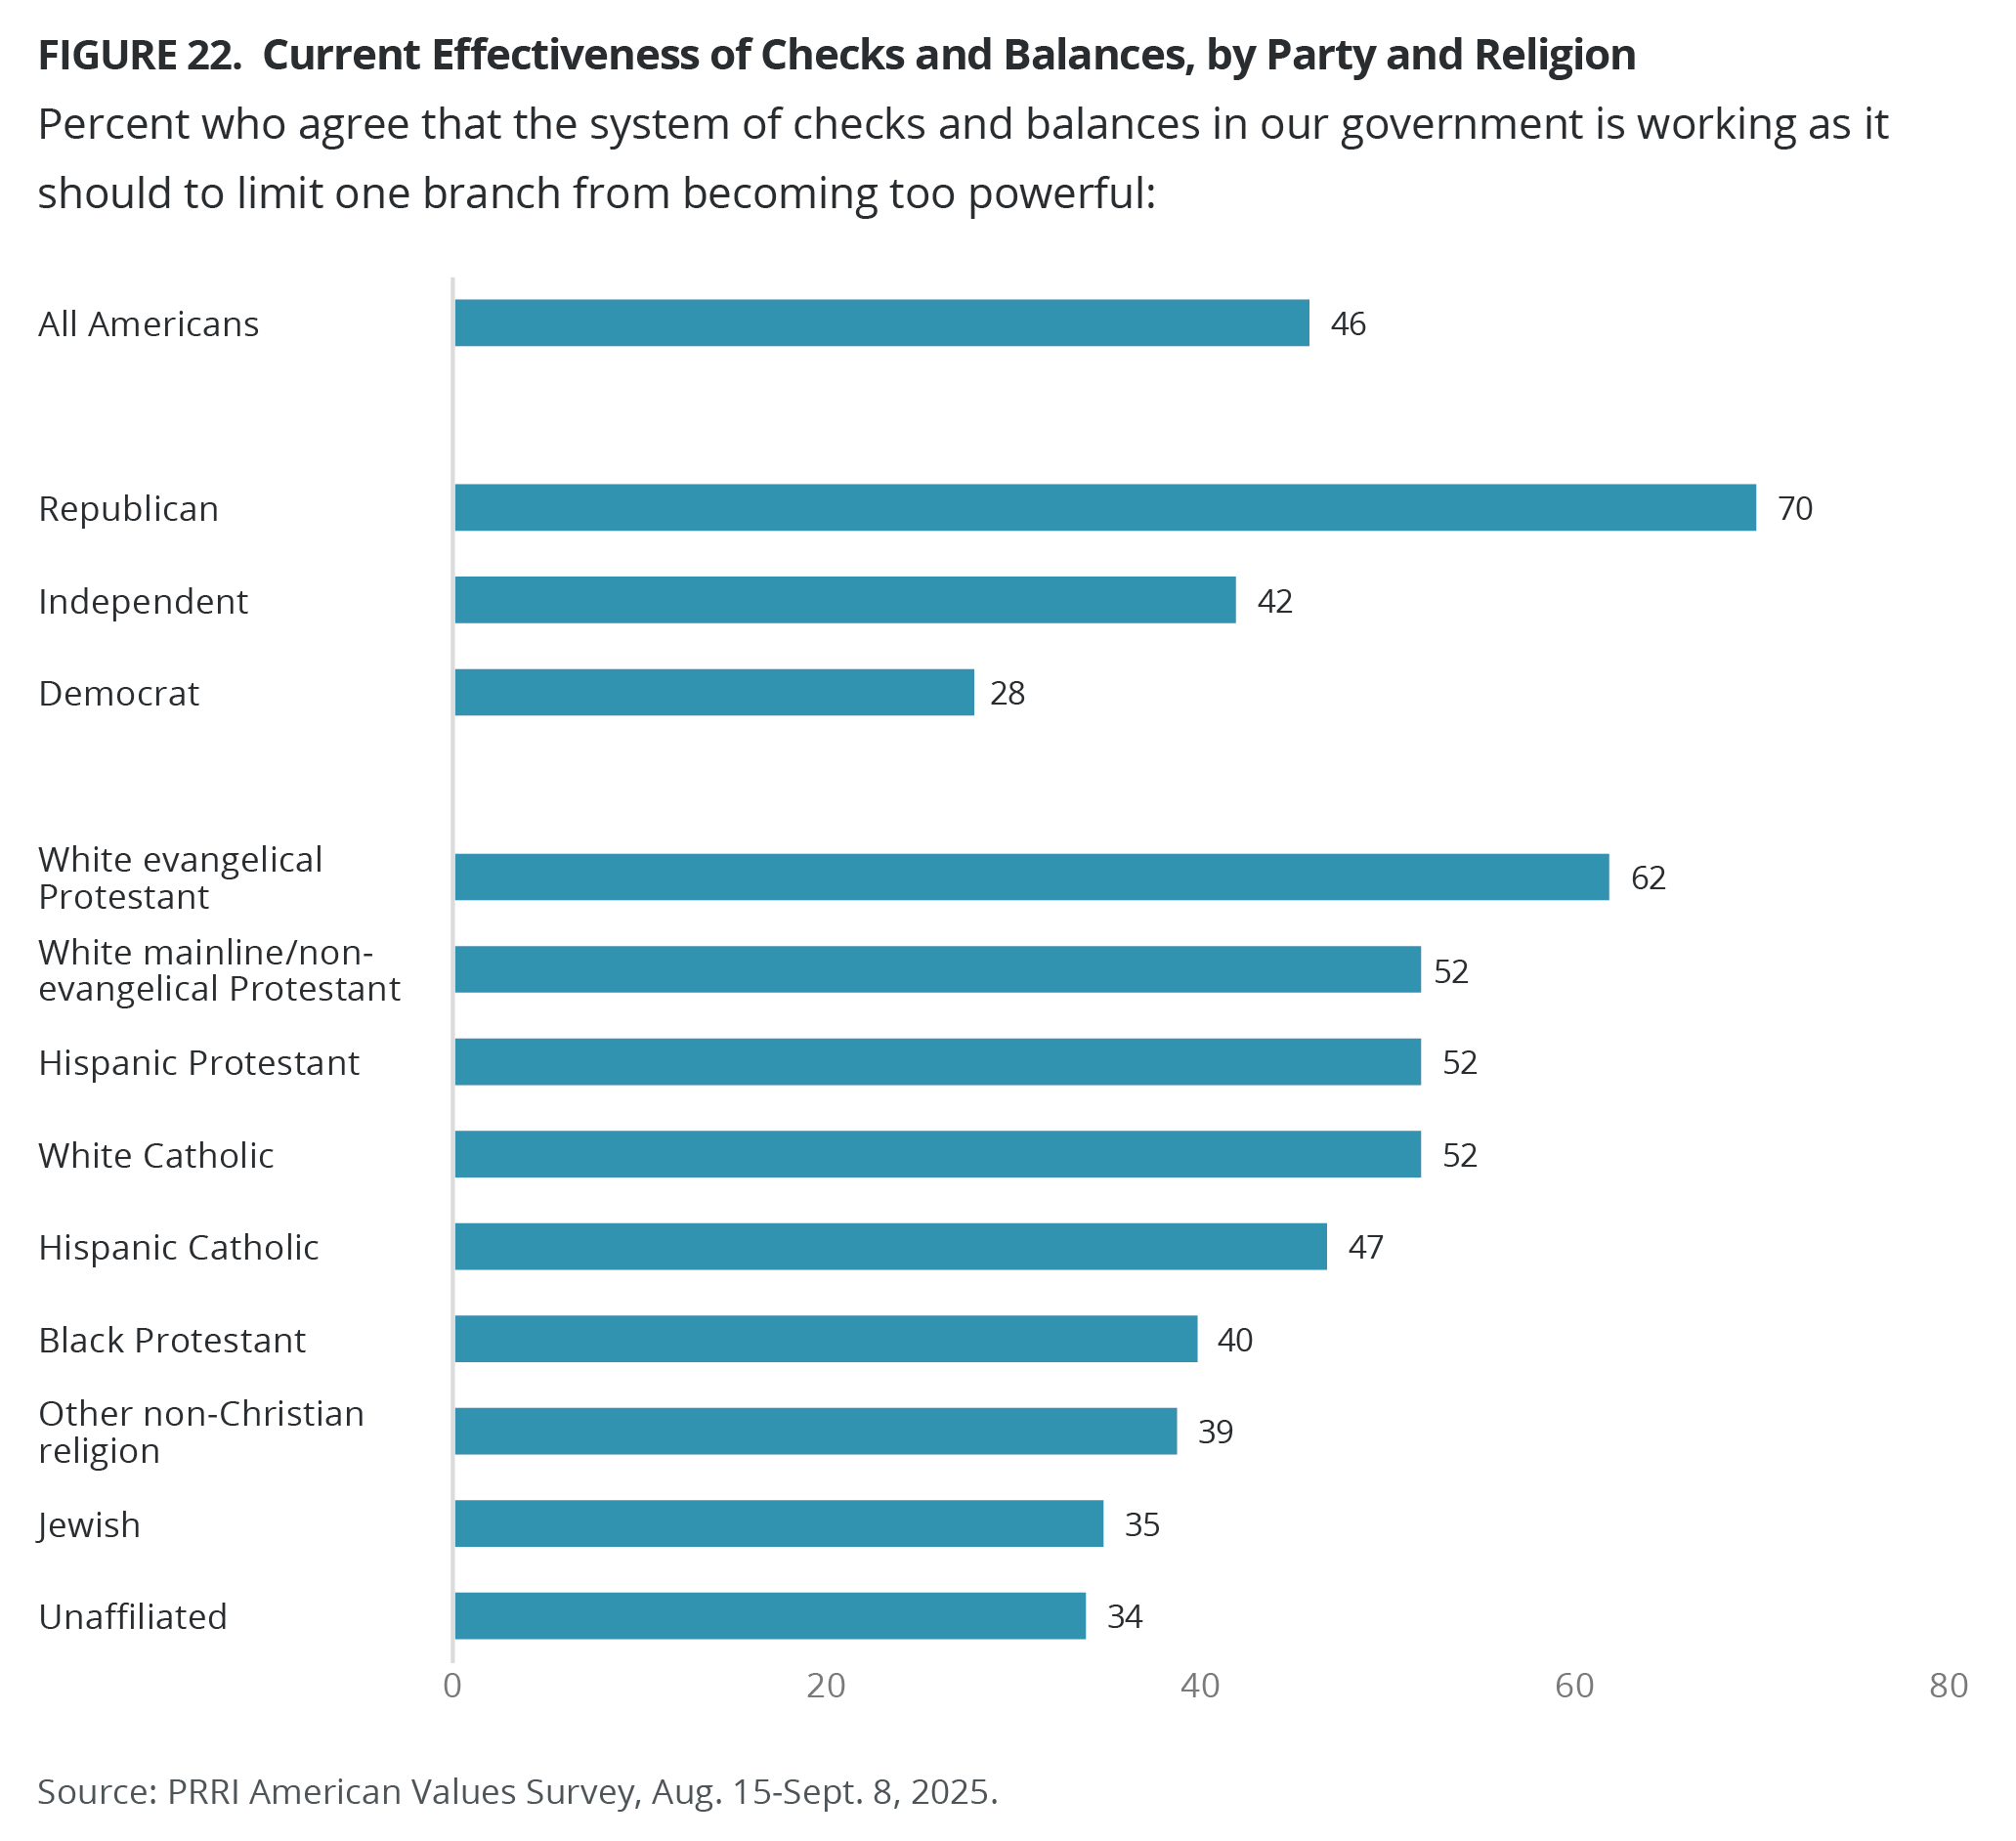
Americans are divided about whether “the system of checks and balances in our government is working as it should to limit one branch of the government from becoming too powerful” (46% agree vs. 50% disagree). Republicans (70%) are more likely than independents (42%) and Democrats (28%) to agree that the system of checks and balances is working as it should be.
Over six in ten white evangelical Protestants (62%), as well as a slim majority of white mainline/non-evangelical Protestants (52%), Hispanic Protestants (52%), and white Catholics (52%), agree the system of checks and balances is working as it should. A plurality of Hispanic Catholics (47%), Black Protestants (40%), and members of other non-Christian religions (39%), as well as one-third of Jewish Americans (35%) and the unaffiliated (34%), also agree.
The Supreme Court
Term Limits for Supreme Court Justices
Most Americans (75%) agree there should be term limits for U.S. Supreme Court justices, while less than one-quarter disagree (22%). Most Democrats (85%), independents (76%), and Republicans (67%) agree there should be term limits for justices.
The Supreme Court Has Been Too Willing to Give Trump More Power
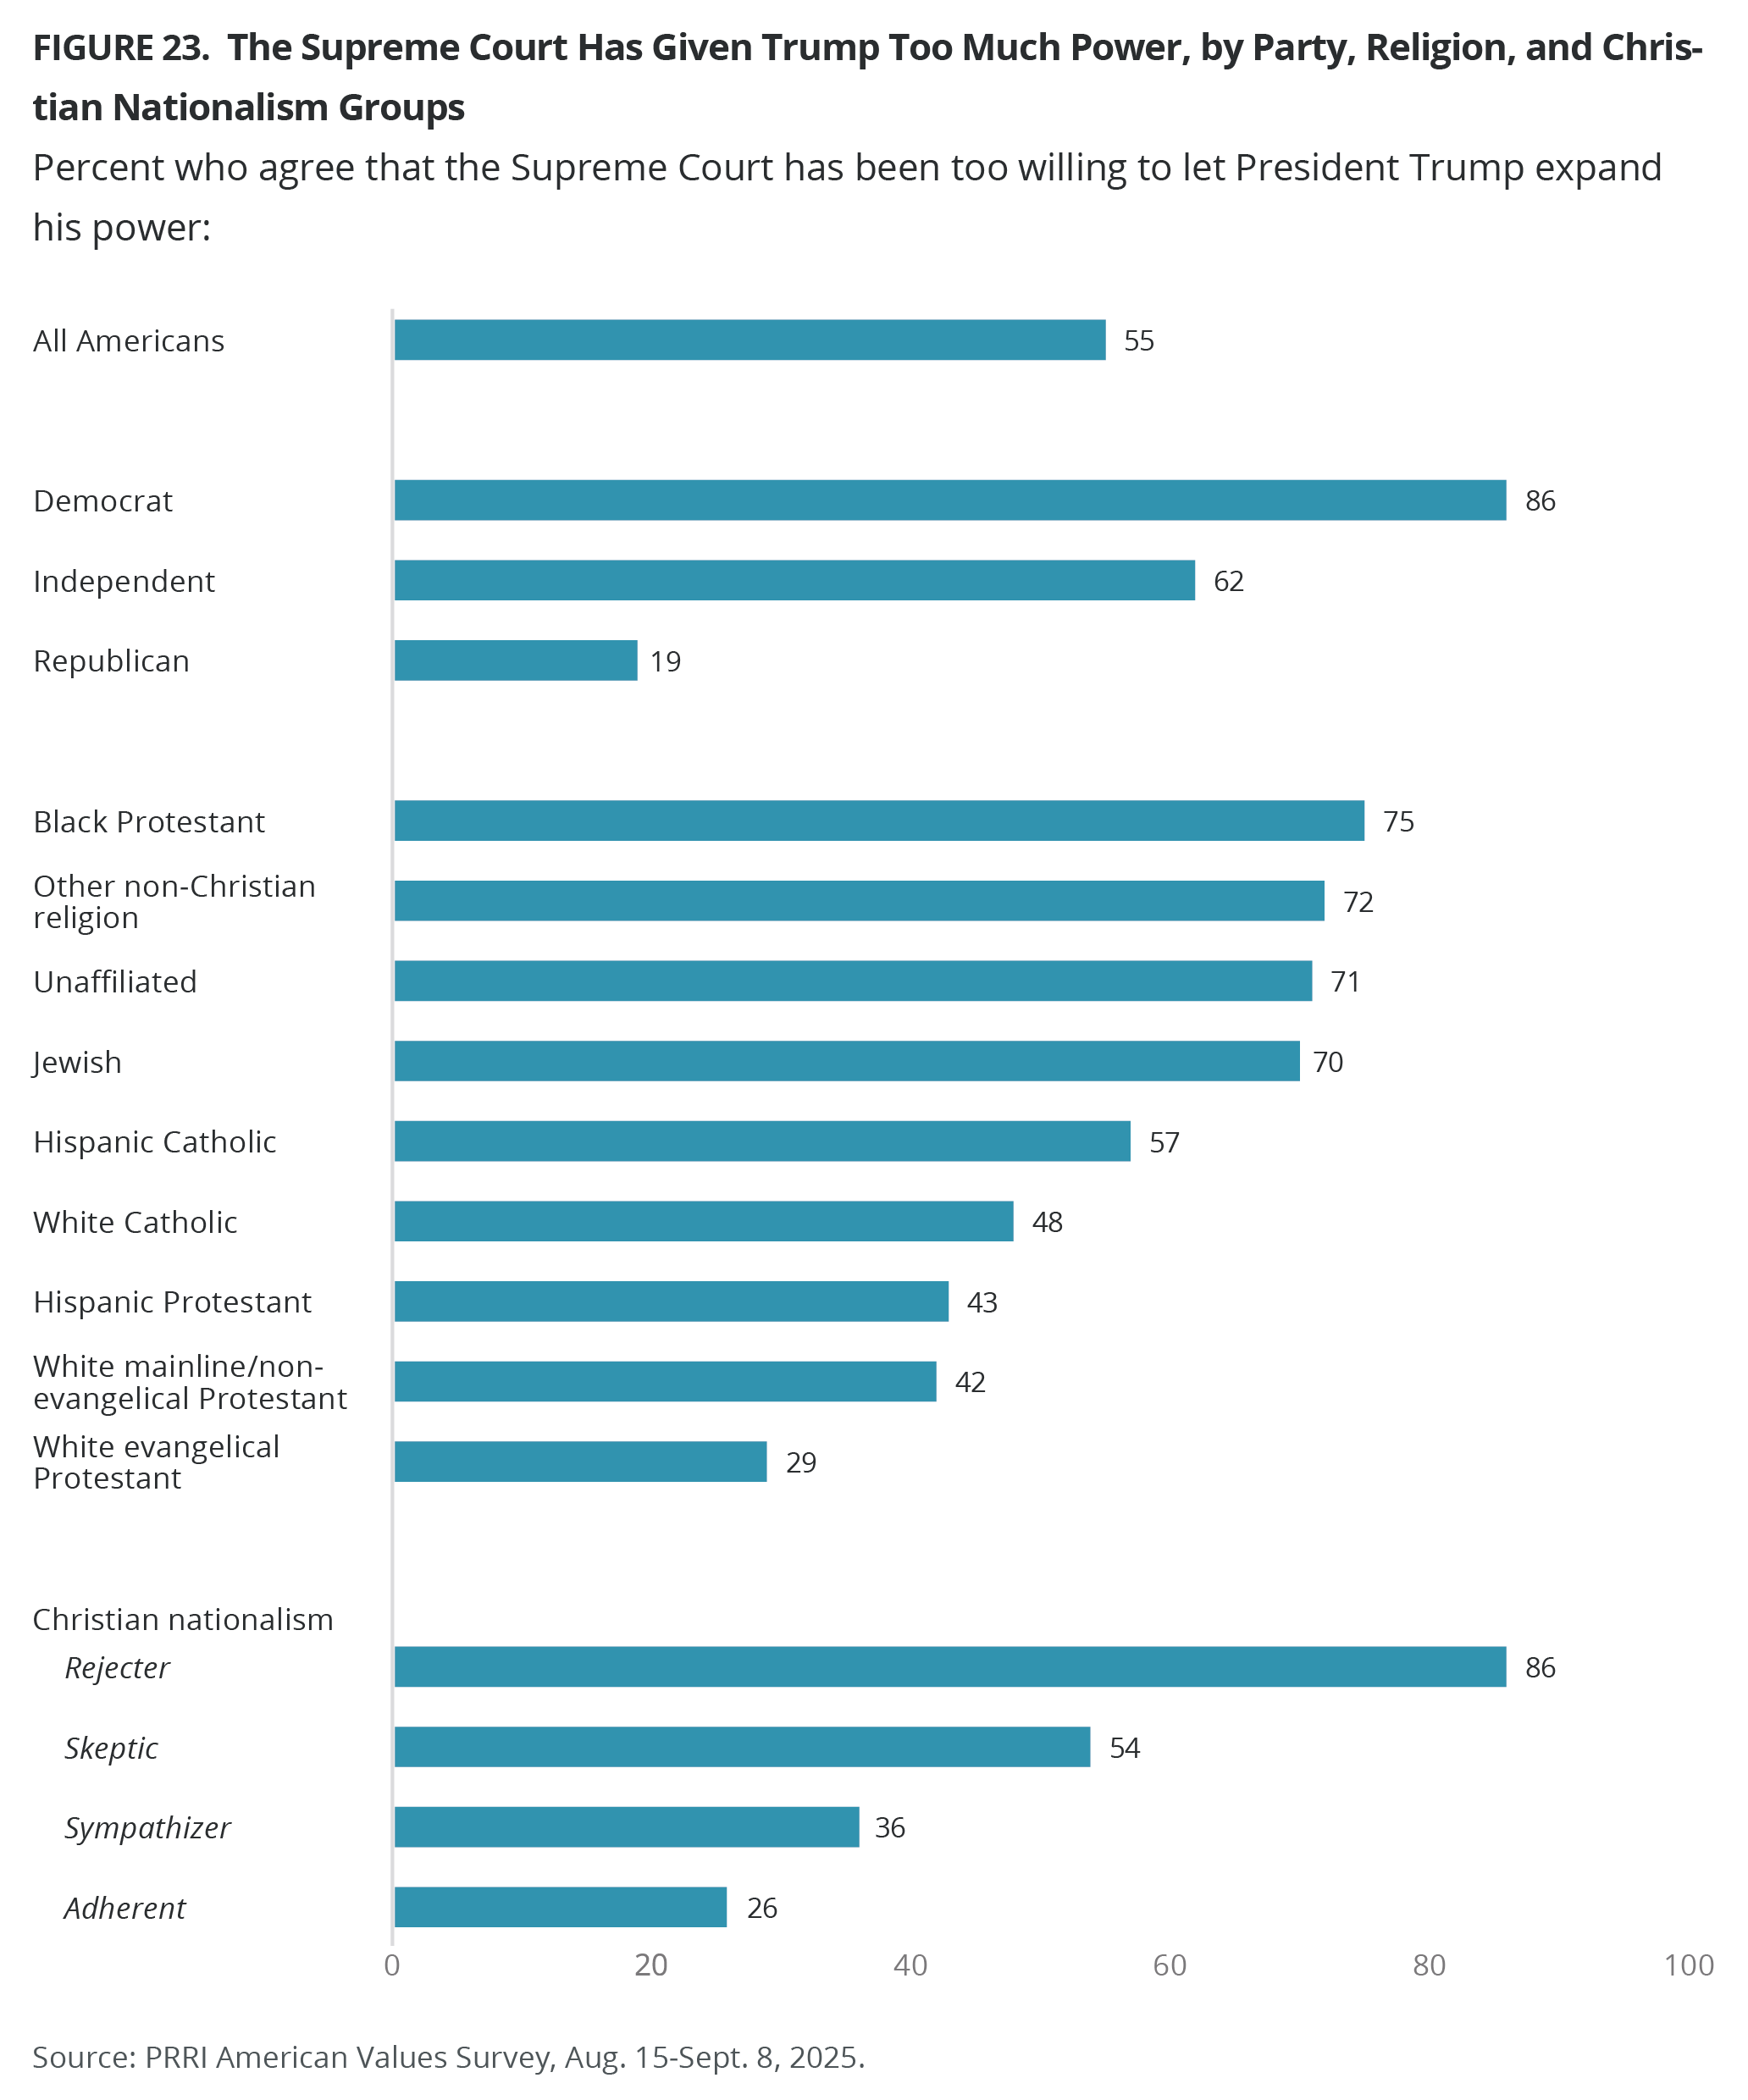
A majority of Americans (55%) agree that “the Supreme Court has been too willing to let President Trump expand his power,” compared with 41% of those who disagree. Most Democrats (86%) and independents (62%) agree with this statement, compared with only 19% of Republicans.
At least seven in ten Black Protestants (75%), members of other non-Christian religions (72%), unaffiliated (71%), and Jewish Americans (70%), as well as the majority of Hispanic Catholics (57%), agree the Supreme Court has allowed Trump to gain too much power. Nearly half of white Catholics (48%), over four in ten Hispanic Protestants (43%) and white mainline/non-evangelical Protestants (42%), and 29% of white evangelical Protestants also agree.
Nearly nine in ten Americans who qualify as Christian nationalism Rejecters (86%) agree the Supreme Court has allowed Trump to expand his power, followed by 54% of Skeptics, 36% of Sympathizers, and 26% of Adherents.
Authoritarianism and Political Violence
Right-Wing Authoritarianism
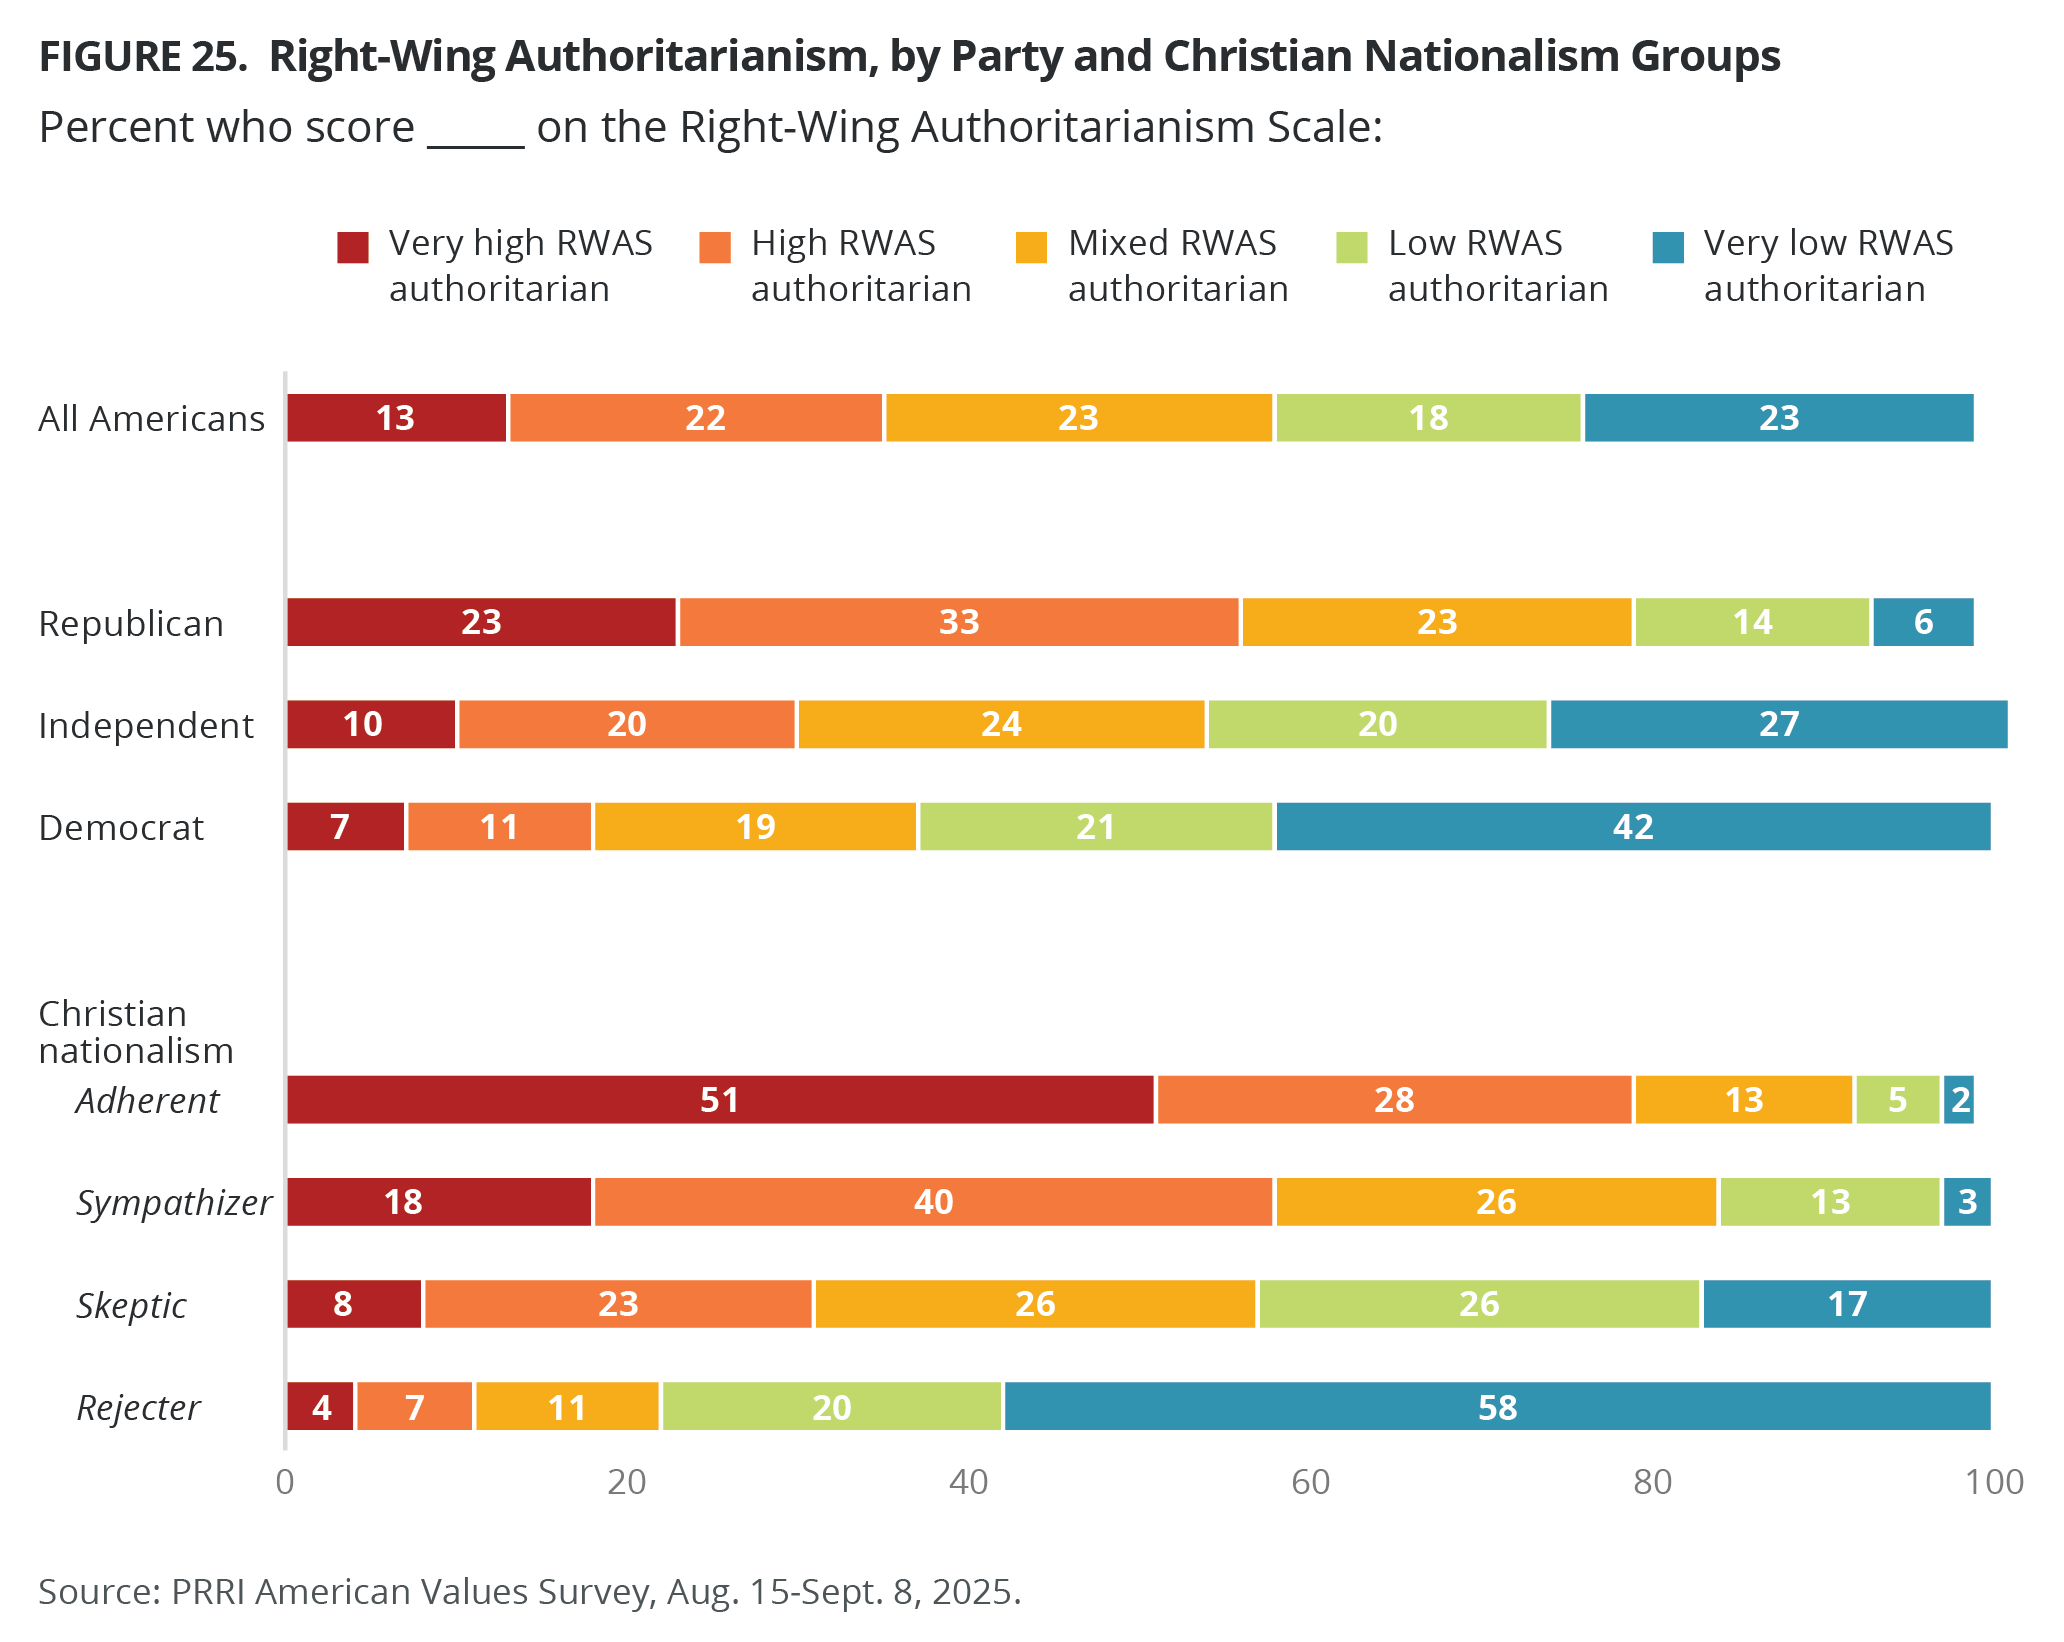
PRRI finds that most Americans do not hold highly authoritarian views. Over one-third of Americans (35%) score very high or high on the Right-Wing Authoritarian Scale, compared with 41% who score low or very low; nearly one in four Americans qualify as having mixed opinions (23%). The proportion of Americans who score very high on the authoritarian scale has dropped significantly since June 2024 (from 21% to 13%), while the proportion who score very low has increased (from 18% to 23%).[2]

Partisanship is closely linked to right-wing authoritarian views. Nearly six in ten Republicans score high or very high on the RWAS (56%), compared with 30% of independents and 18% of Democrats. These percentages have decreased significantly since June 2024, when 67% of Republicans, 35% of independents, and 28% of Democrats held these views.
Right-wing authoritarianism views are significantly more prevalent among Americans who qualify as Christian nationalism Adherents and Sympathizers, 79% and 58% of whom score very high or high on the RWAS, respectively. While 31% of Skeptics score high on the RWAS, the prevalence of these views among Rejecters (11%) is much smaller. While Christian nationalism Adherents have not shifted in their views since June 2024, Sympathizers, Skeptics, and Rejecters have fallen from 69%, 42%, and 15%, respectively.
Strong Leader to Break Some Rules
One-third of Americans (34%) agree with the statement “Because things have gotten so far off track in this country, we need a leader who is willing to break some rules if that’s what it takes to set things right,” compared with 62% who disagree. When the question was first asked in April 2016, prior to Trump’s election to his first term as president, nearly half of Americans (45%) agreed with the statement. More than four in ten Republicans (44%) agree the country needs a leader who is willing to break some rules, compared with 33% of independents and 25% of Democrats. Each partisan group has seen significant decreases in agreement since 2016, when 49% of Republicans, 47% of independents, and 41% of Democrats agreed with the statement.
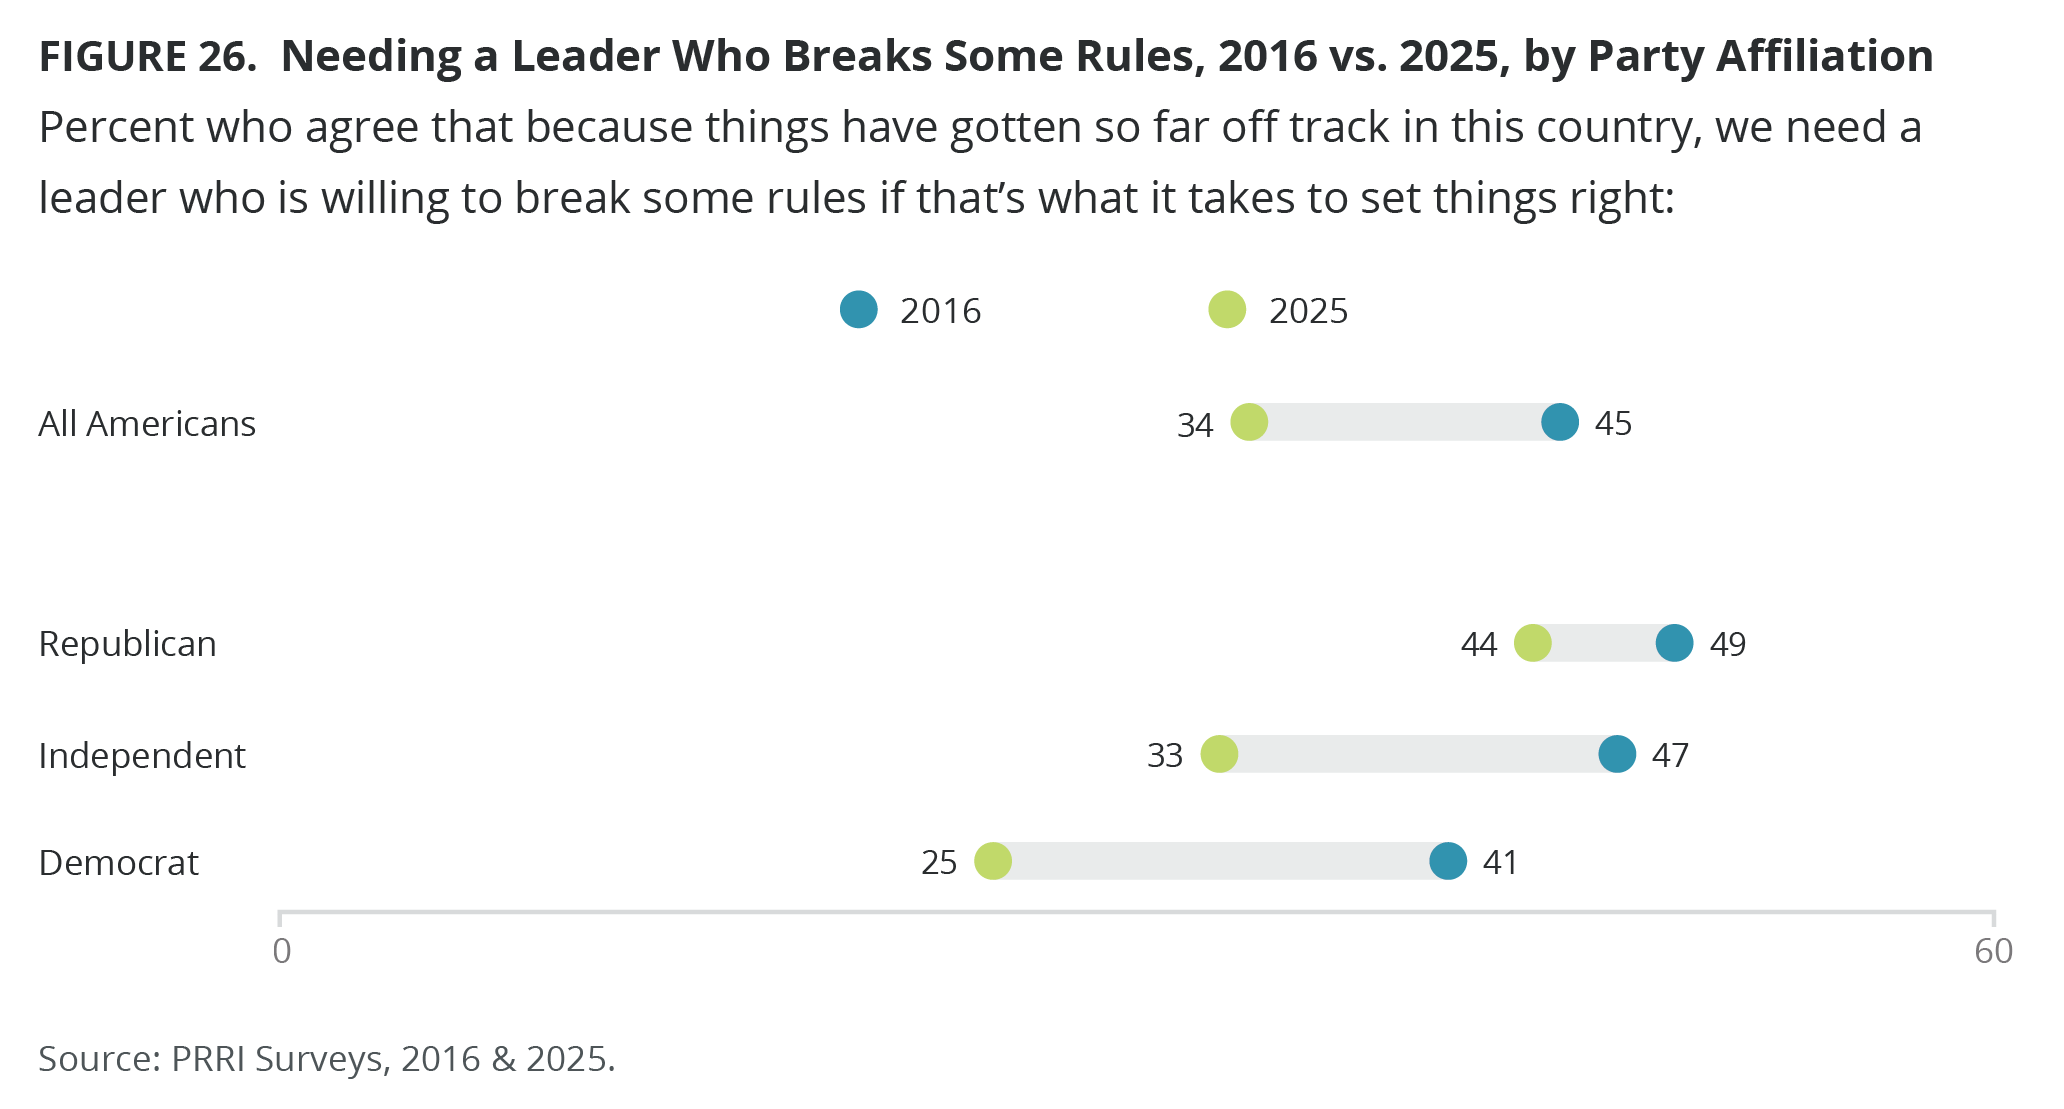
Roughly four in ten Hispanic Catholics (45%) and Hispanic Protestants (40%) agree the country needs a leader who is willing to break some rules if that is what it takes to set things right. Around one-third of Black Protestants (36%), white evangelical Protestants (35%), white Catholics (35%), members of other non-Christian religions (35%), white mainline/non-evangelical Protestants (33%), and unaffiliated Americans (31%), as well as two in ten Jewish Americans (22%), also agree.
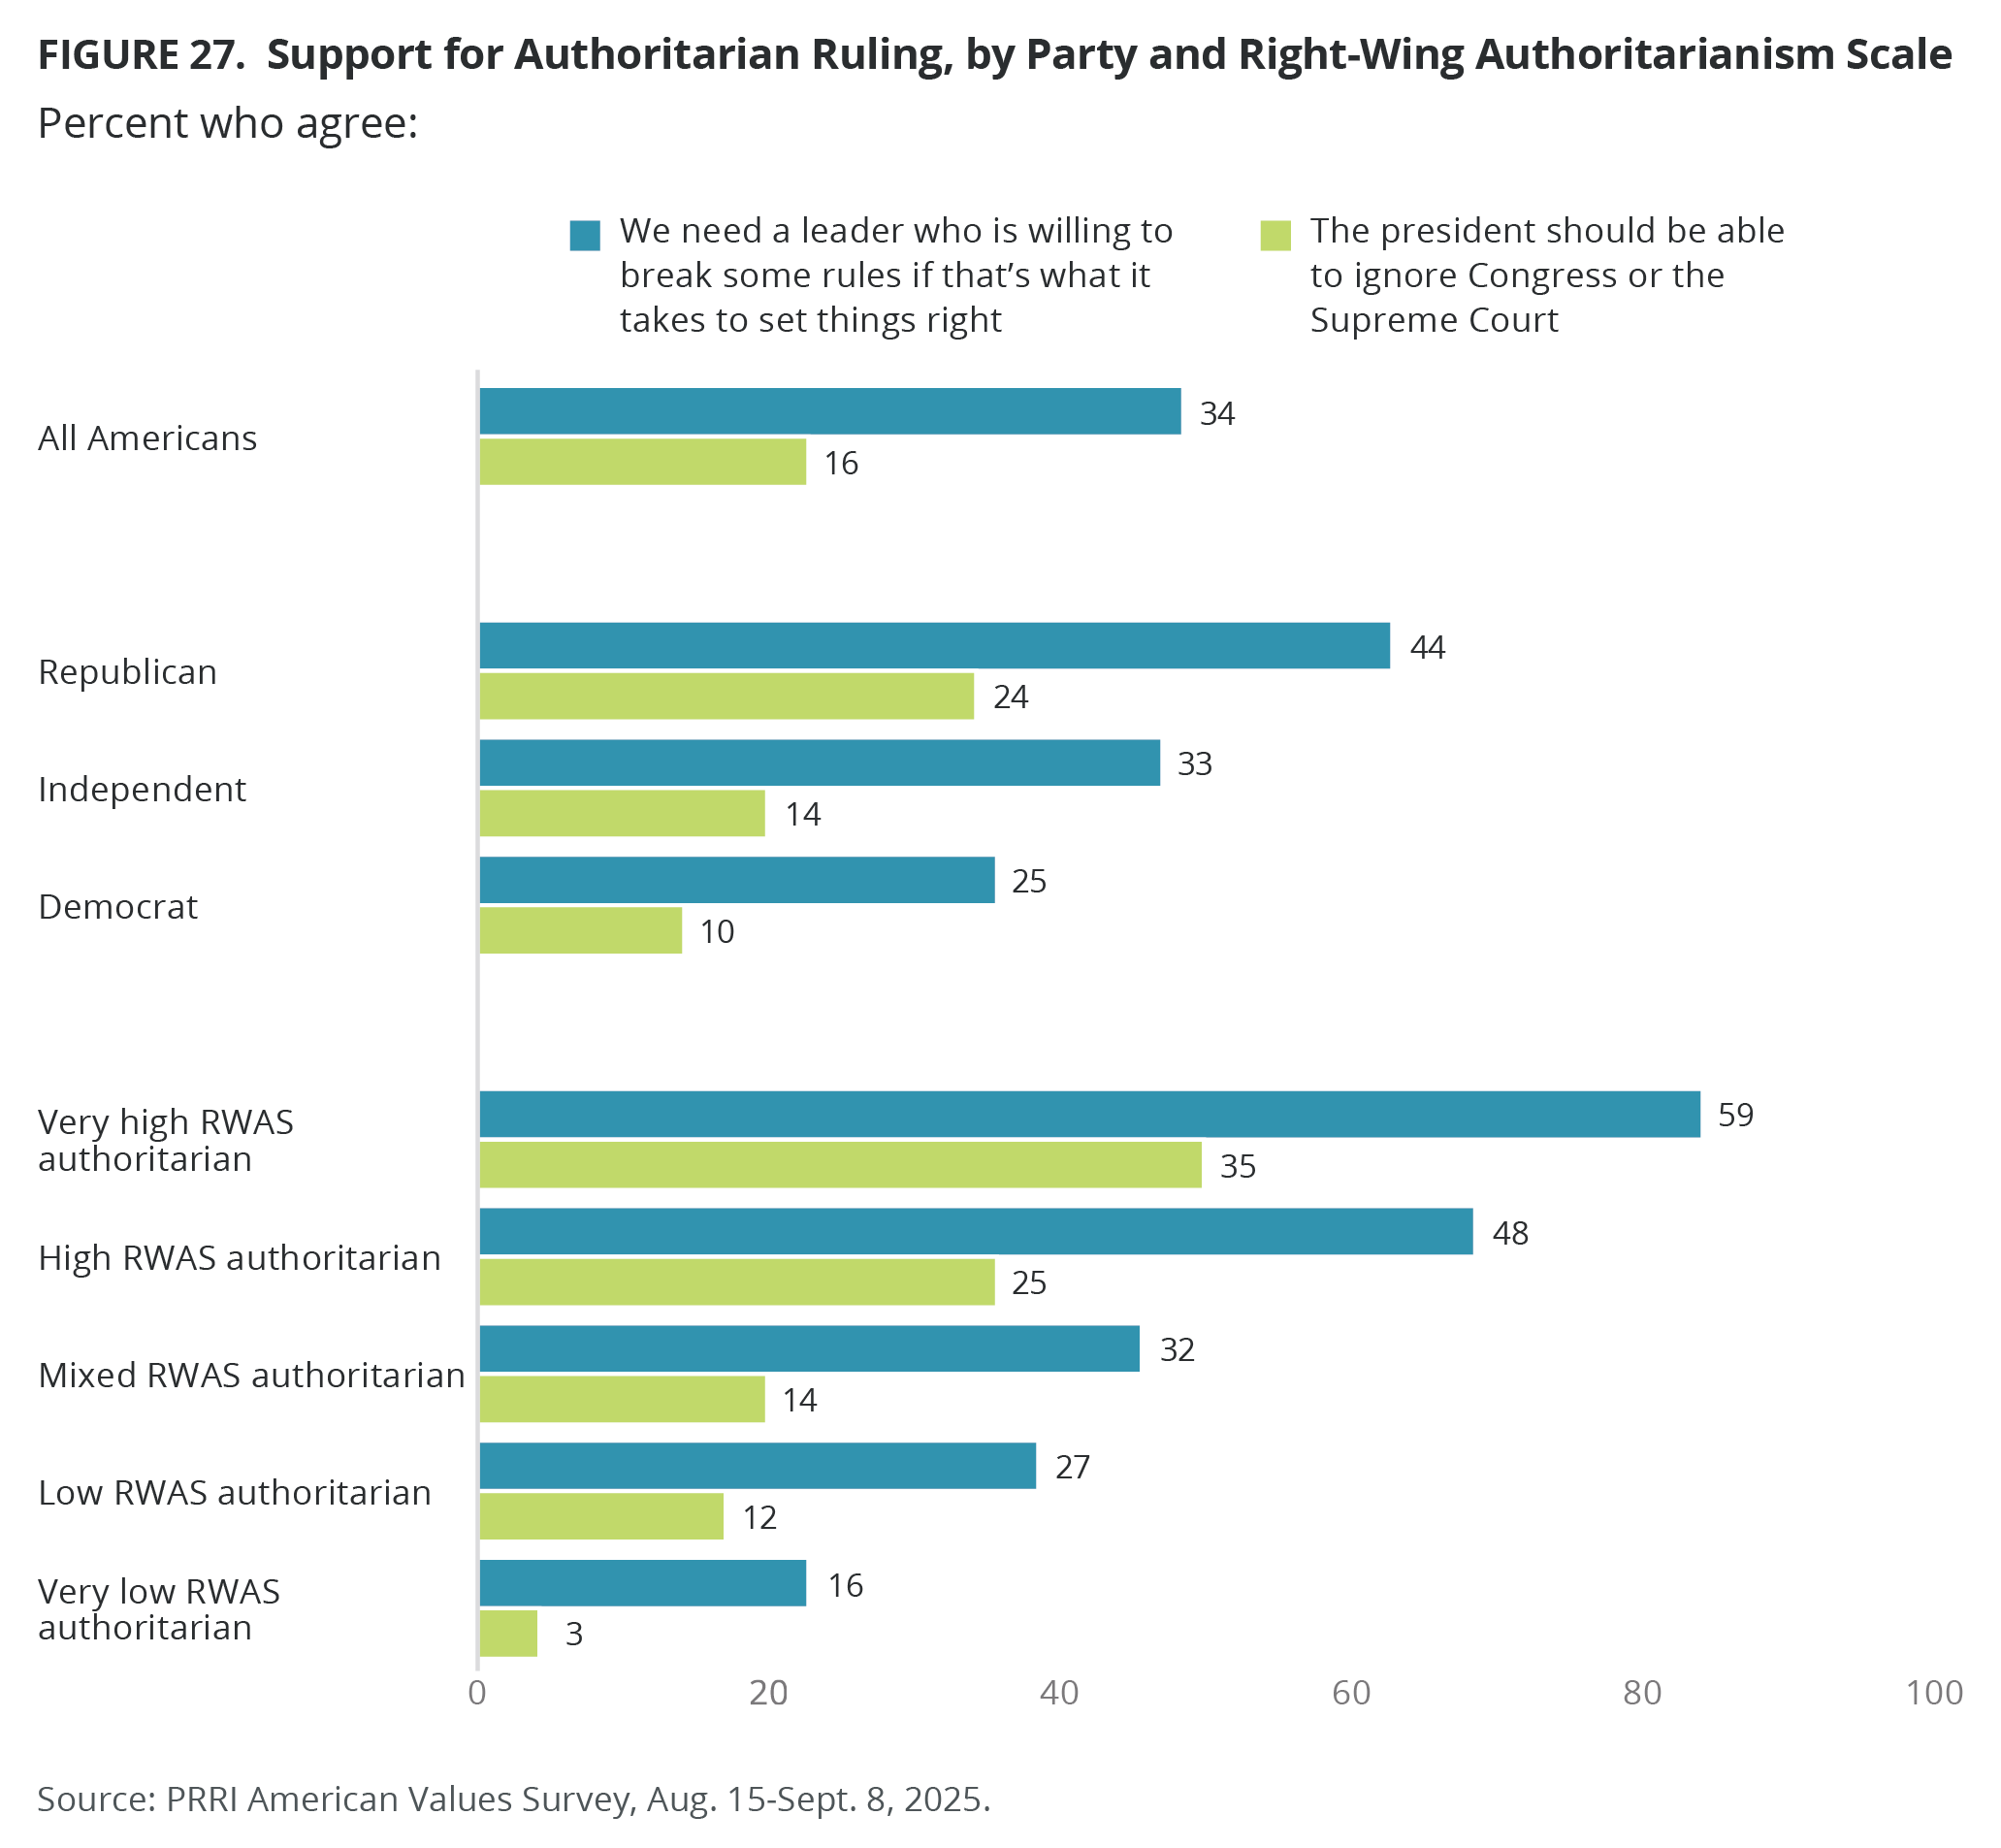
Americans who score very high (59%) or high (48%) on the RWAS are significantly more likely than those who have mixed opinions (32%), score low (27%), or very low (16%) to agree with the idea that the country needs a leader who is willing to break some rules if that is what it takes to set things right.
About half of Christian nationalism Adherents (49%) and Sympathizers (45%) agree, followed by 36% of Skeptics and 22% of Rejecters.
Younger generations, especially Gen Zers (39%) and millennials (37%), are more likely than Gen Xers (30%) and members of the Silent Generation (28%) to agree that the country needs a leader who is willing to break some rules, but do not differ from baby boomers (34%).
The President Should Be Able to Ignore Congress or the Supreme Court
Only 16% of Americans agree with the statement “When decisions by Congress or the Supreme Court hold our country back, the president should be able to ignore them,” while more than three-quarters of Americans (78%) disagree. Nearly one-quarter of Republicans (24%) agree that the president should ignore Congress or the Supreme Court if those decisions hold our country back, compared with 14% of independents and 10% of Democrats. Since 2024, agreement with this statement has increased among Republicans (from 20%) but decreased among independents (from 18%) and Democrats (from 19%).
Among religious subgroups, Hispanic Protestants (35%) are most likely to agree with the president ignoring Congress or the Supreme Court if their decisions hold the country back. Around two in ten members of other non-Christian religions (21%), white evangelical Protestants (20%), Black Protestants (20%, down from 30% in 2024), Hispanic Catholics (19%, down from 29% in 2024), and white mainline/non-evangelical Protestants (17%) agree. Fifteen percent of white Catholics, and around one in ten unaffiliated (12%, down from 18% in 2024) and Jewish Americans (10%) also agree with the statement.
Americans who score very high (35%) or high (25%) on the RWAS are significantly more likely to agree with the president ignoring Congress or the Supreme Court than those who have mixed opinions (14%), score low (12%), or very low (3%).
Americans who qualify as Christian nationalism Adherents (32%) or Sympathizers (28%) are more likely to agree than Skeptics 16% or Rejecters (5%, down from 14% in 2024).
Political Violence
PRRI finds that most Americans (78%) disagree that “because things have gotten so far off track, true American patriots may have to resort to violence in order to save our country,” including 49% who completely disagree, compared with 17% of those who agree. Except for 8-percentage, when support for political violence peaked at 23%, these percentages have remained stable since the question was first asked in March 2021.
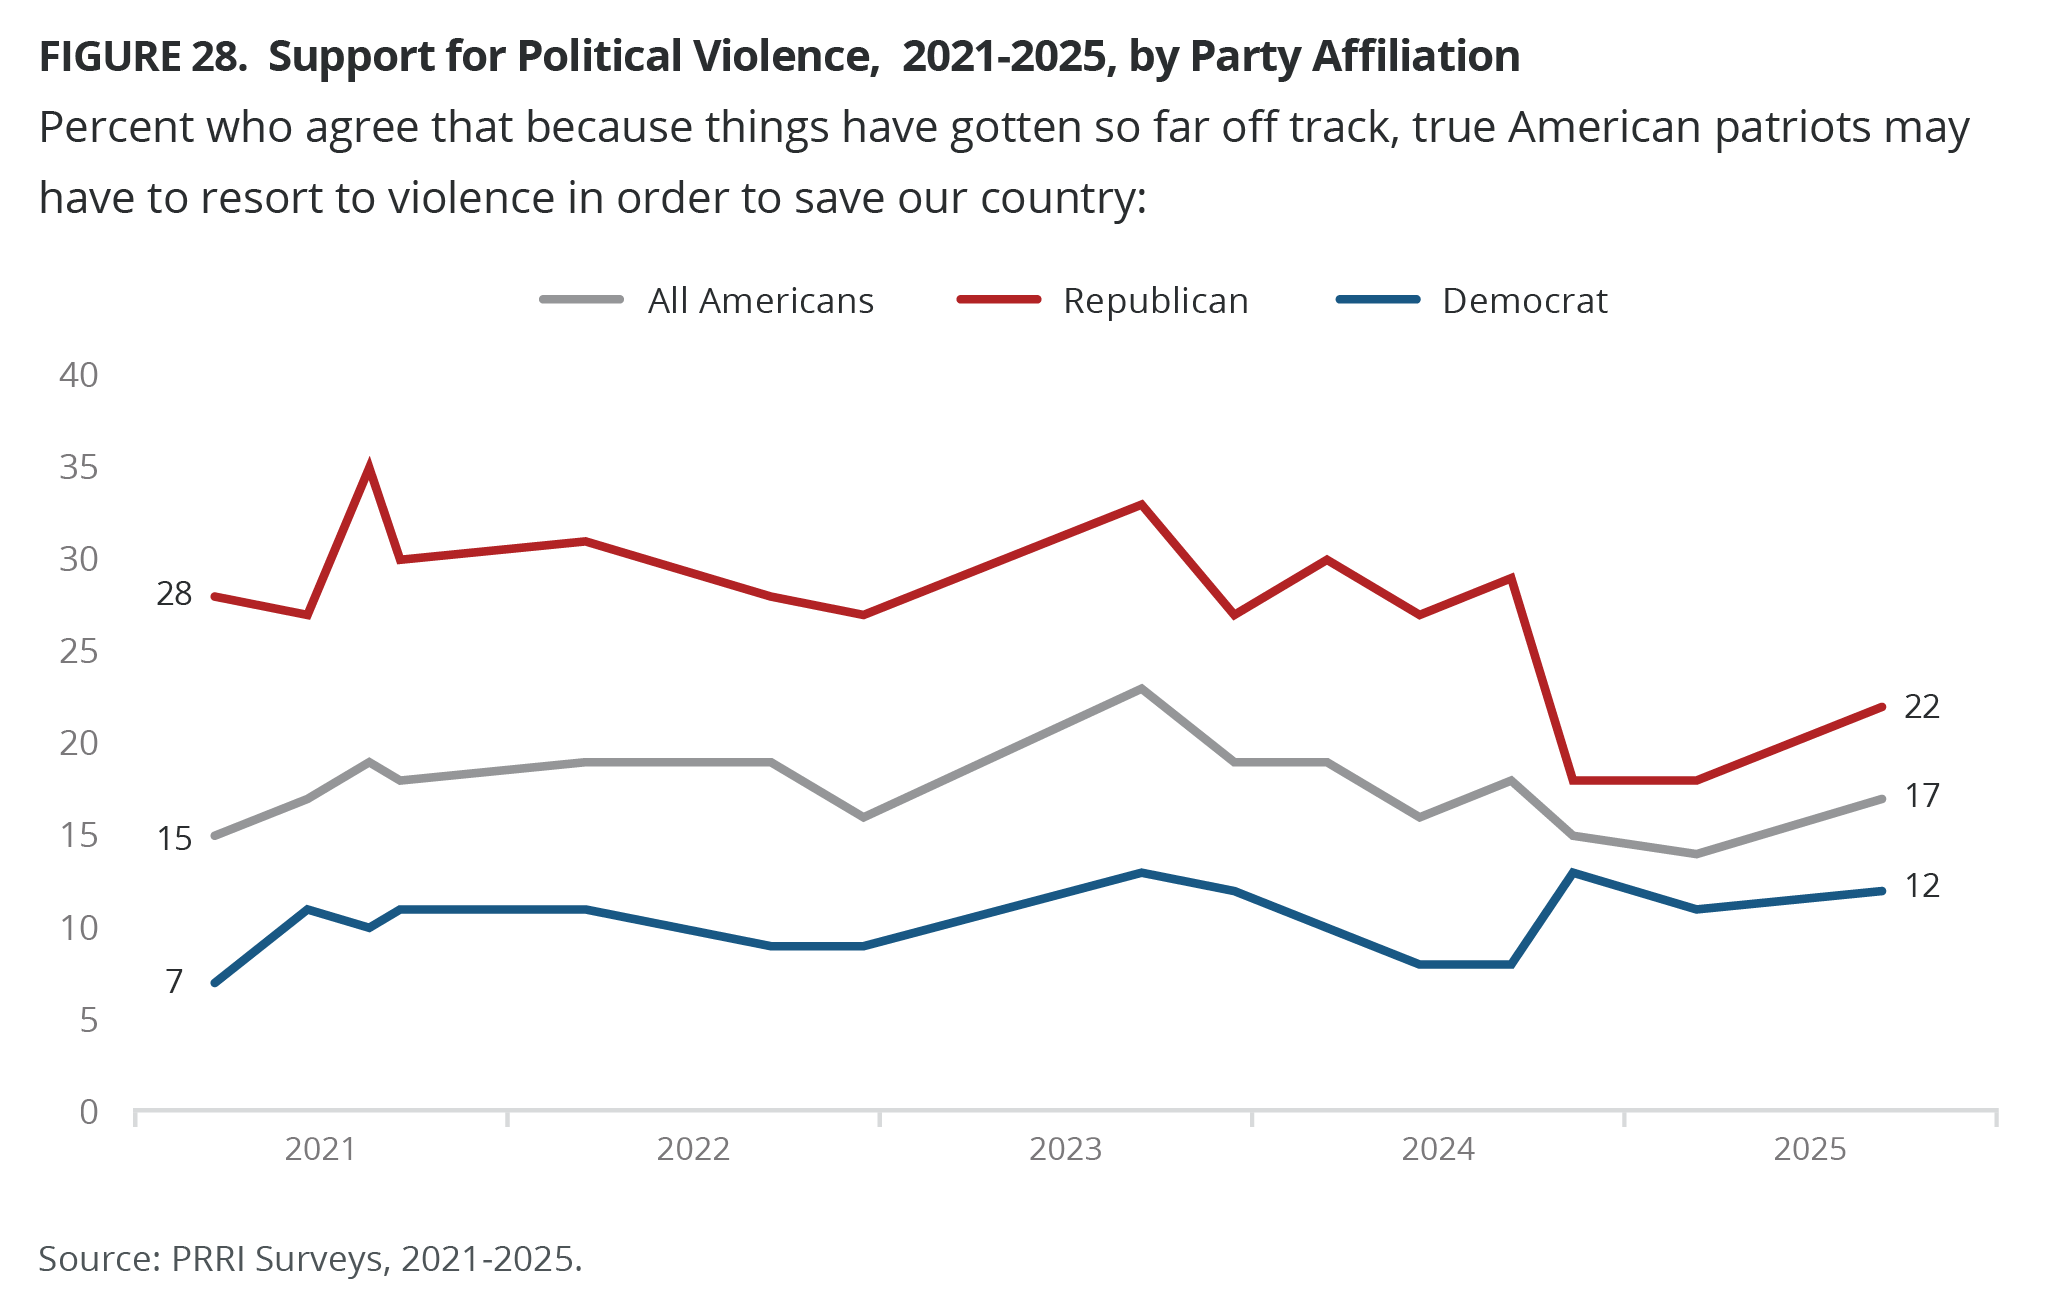
Republicans (22%) are more likely to agree that political violence may be necessary to save our country than independents (16%) and Democrats (12%). Independents’ views on this measure have been consistent since March 2021. Support for political violence among Republicans during Biden’s presidency was significantly higher than today, although marked by some volatility, ranging from a low of 27% at multiple points to a high of 35% in August 2021. Republicans’ support for political violence following Trump’s installation as president dropped to 18% but increased most recently. Democrats’ support for political violence has remained consistently low during this period, ranging from a low of 7% to a high of 13%.
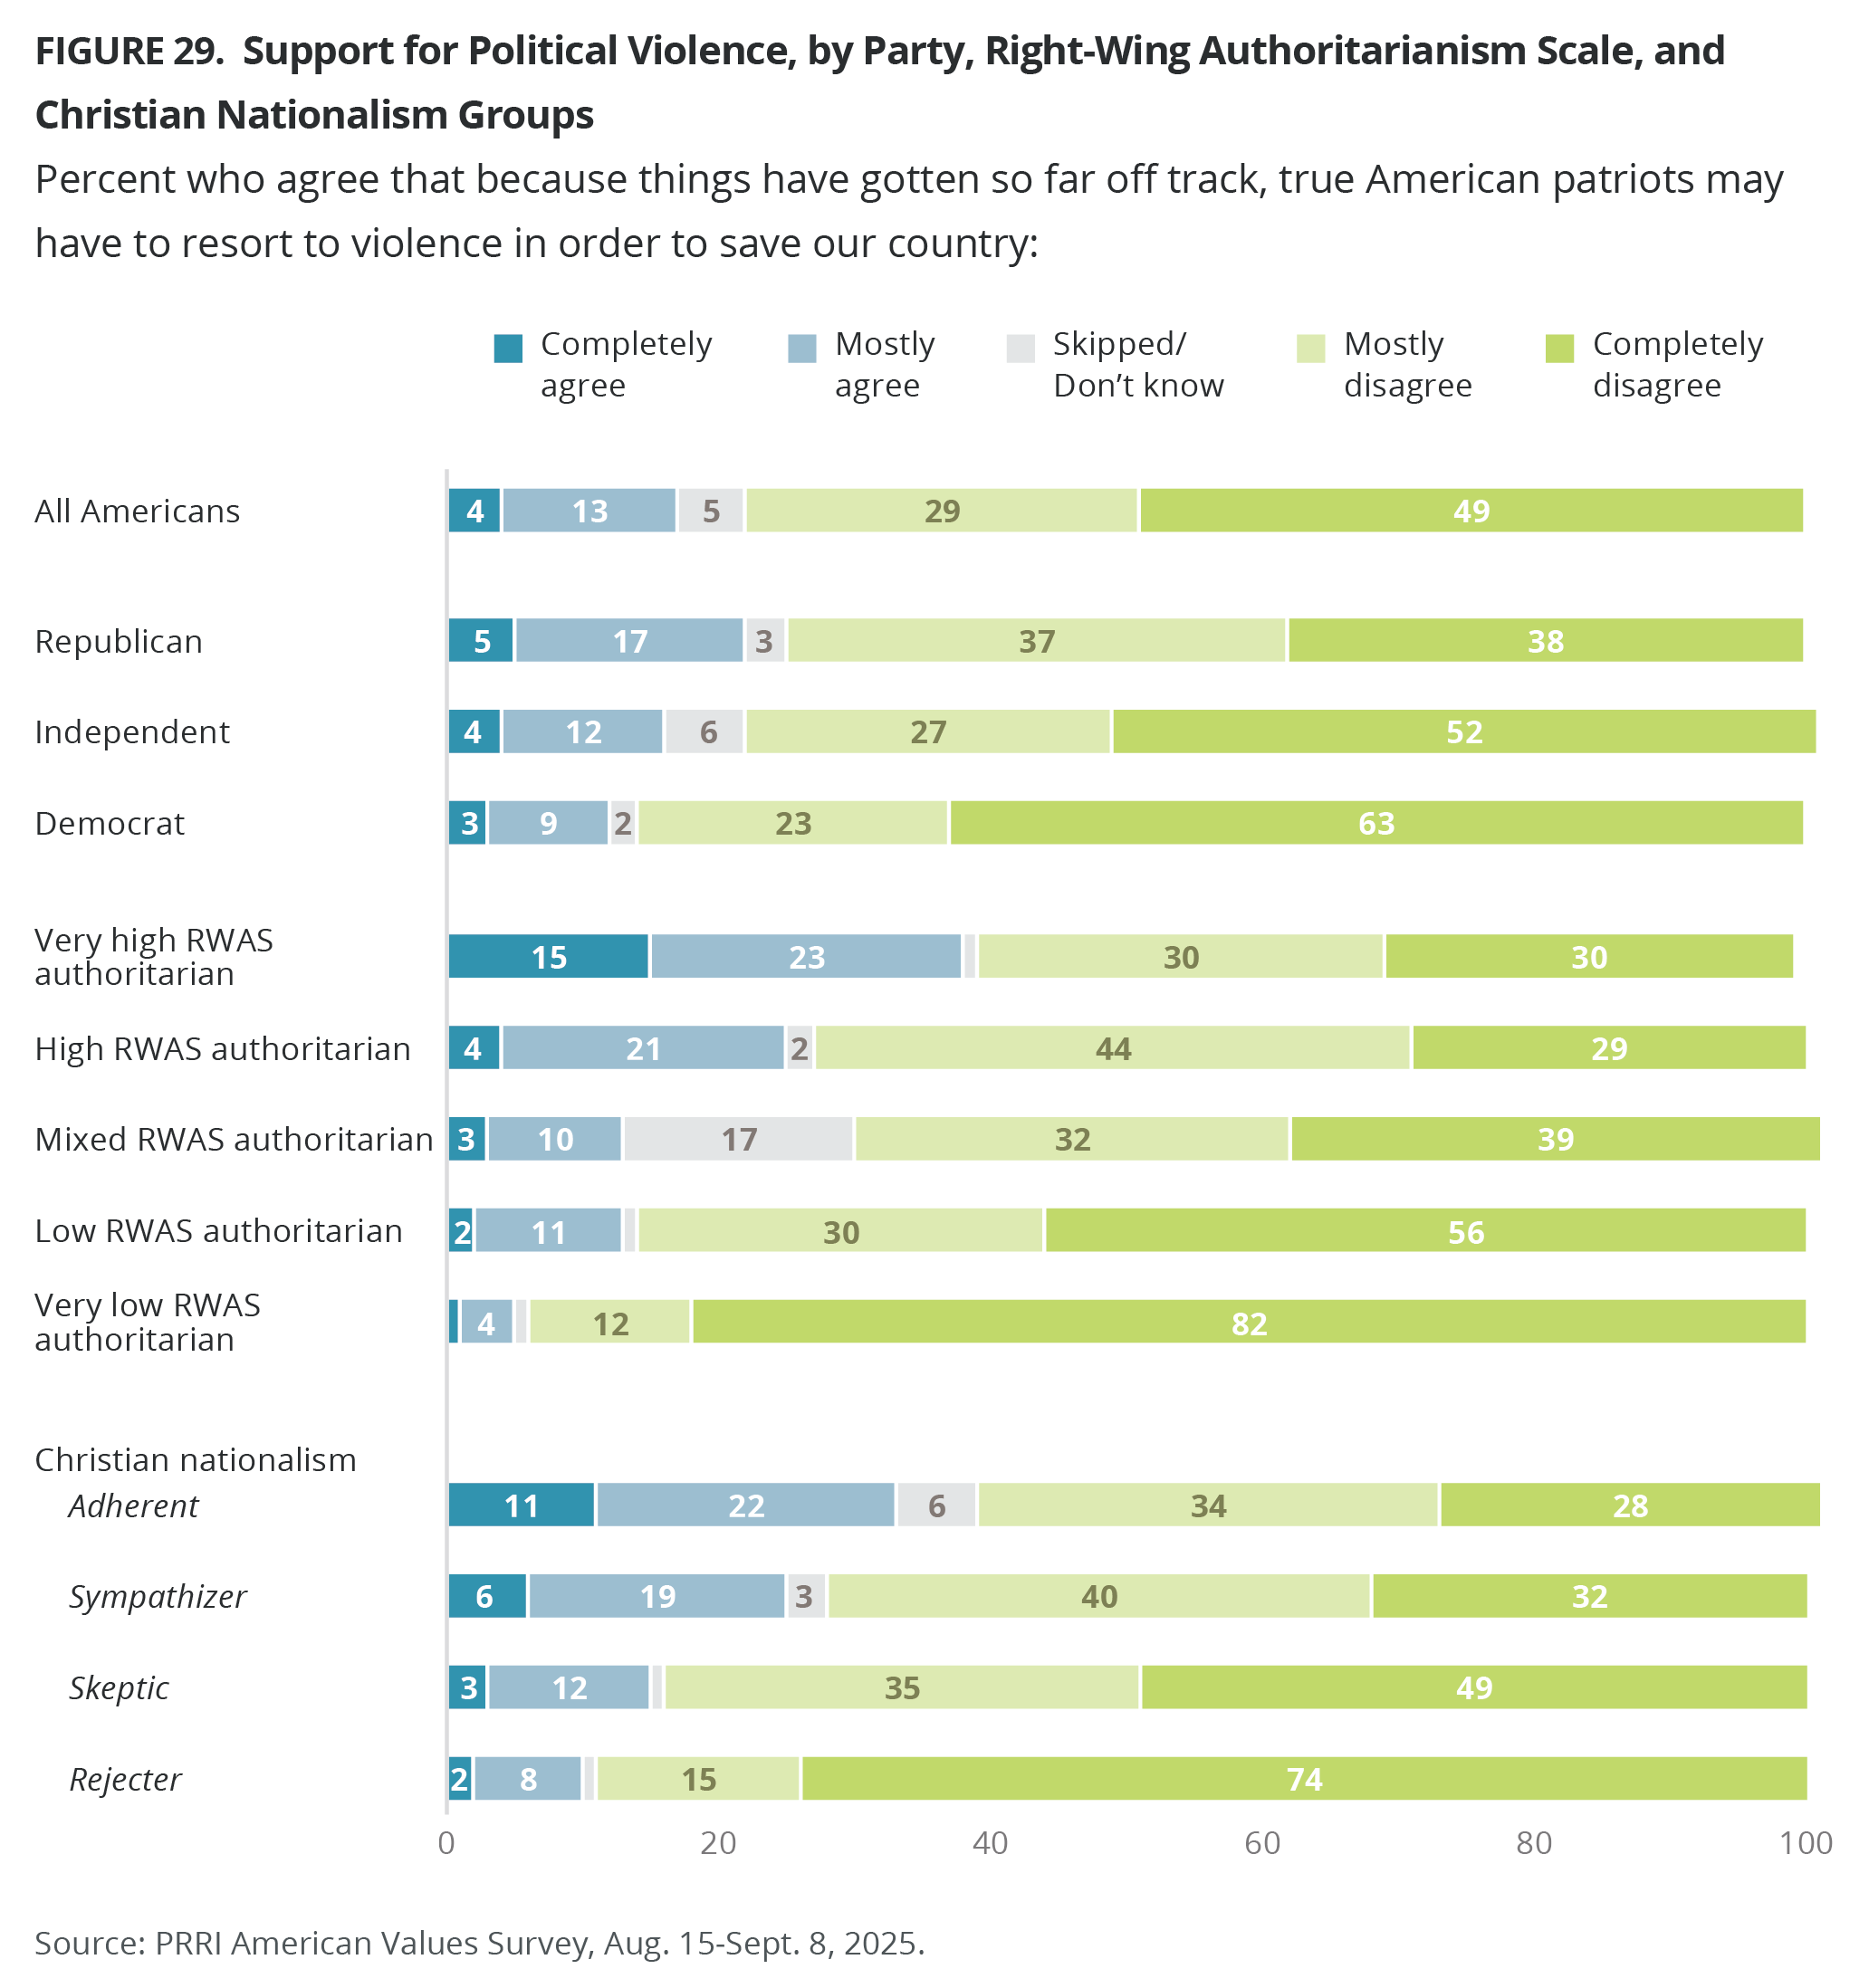
Notably, Americans who score very high (38%) or high (25%) on the RWAS are significantly more likely to agree that political violence may be necessary to save the country than those who have mixed opinions (13%), score low (13%), or very low (5%).
Support for Christian nationalism is also associated with increased support for political violence. One-third of Americans (33%) who qualify as Adherents agree that true American patriots may have to resort to violence to save the country, followed closely by 25% of Sympathizers. Christian nationalism Skeptics (15%) and Rejecters (10%) are less likely to support political violence.
U.S. National Identity
American Pride
Pride in Being an American
Americans are evenly split in their national pride: Half say they are extremely or very proud of being an American (50%), while half say they are either moderately (21%), a little (15%), or not at all proud (12%). American pride has declined sharply since 2013, when 82% said they were extremely or very proud. Most Republicans (80%) are proud of being an American, compared with 46% of independents, and 31% of Democrats.
Majorities of white Christian groups and Black Protestants say they are proud of being an American, including 74% of white evangelical Protestants, 70% of white Catholics, 64% of white mainline/non-evangelical Protestants, and 54% of Black Protestants. Under half of Hispanic Protestants (46%) and Hispanic Catholics (46%) say they are proud of being an American, while far fewer other non-Christians (38%), Jewish Americans (37%), and 29% of unaffiliated Americans say the same.
Most Americans who score very high (74%) or high (66%) on the RWAS say they are proud of being an American, compared with 43% of those who score low or 25% who score very low. A slim majority of those who have mixed views are proud of being an American (54%).
Most Americans who qualify as Christian nationalism Adherents (81%) and Sympathizers (71%), as well as half of Skeptics (51%), say they are proud of being an American, compared with 24% of Rejecters.
Younger generations, especially Gen Zers (37%) and millennials (42%), are less likely than Gen Xers (54%), baby boomers (64%), and members of the Silent Generation (65%) to be proud of being an American.
Pride in America’s 250-Year History
Americans are evenly split in their pride of America’s 250-year history, which we will celebrate on July 4, 2026: Half say they are extremely or very proud (48%), while half say they are either moderately (22%), a little (14%), or not at all proud (13%). Most Republicans (77%) are very proud of America’s 250-year history, compared with 47% of independents and 28% of Democrats. In 1976, America’s bicentennial, the American National Election Studies (ANES) asked how proud Americans felt about the country’s 200-year history.[3] While the response options differed slightly from our current question, in 1976 roughly half of Americans (48%) said they were very proud of the nation’s 200-year history. Republicans (61%) were more likely than Democrats (46%) and independents (43%) to say they were very proud in 1976.
Majorities of white Christian groups and Jewish Americans say they are very proud of America’s 250-year history, including 72% of white evangelical Protestants, 68% of white Catholics, 62% of white mainline/non-evangelical Protestants, and 52% of Jewish Americans. Roughly four in ten Hispanic Catholics (44%), Hispanic Protestants (40%), and other non-Christians (38%) say they are very proud of America’s 250-year history, as are three in ten Black Protestants (31%) and unaffiliated Americans (29%).
Most Americans who score very high (67%), high (60%), or have mixed views (51%) on the RWAS say they are very proud of America’s 250-year history, compared with 40% of those who score low and 28% who score very low.
Most Americans who qualify as Christian nationalism Adherents (74%) and Sympathizers (64%), as well as half of Skeptics (49%), say they are proud of America’s 250-year history, compared with 26% of Rejecters.
Younger generations, including Gen Zers (36%) and millennials (40%), are less likely than Gen Xers (51%), baby boomers (60%), and members of the Silent Generation (62%) to be very proud of America’s 250-year history.
America’s Economic Achievements
One-third of Americans (32%) say they are extremely or very proud of America’s economic achievements, compared with 38% who are only a little or not at all proud. Over one-quarter say they are moderately proud (27%). Most Republicans (60%) are very proud of America’s economic achievements, compared with 30% of independents and 16% of Democrats.
There is no religious group in which a majority say that they are very proud of America’s economic achievements. White evangelical Protestants (50%) are the most likely to say they are very proud, followed by white Catholics (45%) and white mainline/non-evangelical Protestants (44%). Far fewer Jewish Americans (36%), Hispanic Protestants (30%), other non-Christians (29%), Hispanic Catholics (28%), Black Protestants (22%), and unaffiliated Americans (20%) are very proud.
Half of Americans who score very high (50%) and 41% of those who score high on the RWAS say they are very proud of America’s economic achievements, compared with 30% of those who score low or 19% who score very low. One-third of those who have mixed views are very proud (33%).
Younger generations, including Gen Zers (26%), millennials (26%), and Gen Xers (34%), are less likely than baby boomers (43%) and members of the Silent Generation (42%) to be very proud of America’s economic achievements.
America’s Good Moral Example for the World
One-quarter of Americans (23%) say they are extremely or very proud of America’s good moral example for the world, compared with 52% who are only a little or not at all proud. Over two in ten say they are moderately proud (22%). Just 45% of Republicans say they are very proud of America’s good moral example for the world, compared with far fewer independents (18%) and Democrats (9%).
There is no religious group in which a majority say that they are very proud of America’s good moral example for the world. Around one-third of white evangelical Protestants (34%), white mainline/non-evangelical Protestants (32%), and white Catholics (36%) say they are very proud, followed by 27% of Hispanic Protestants, 25% of Jewish Americans, 23% of Hispanic Catholics, 18% of other non-Christians, 12% of Black Protestants, and 11% of unaffiliated Americans.
Four in ten Americans who score very high (43%) and 32% of those who score high on the RWAS say they are very proud of America’s good moral example for the world, compared with 16% of those who score low or 7% who score very low. One-quarter of those who have mixed views are very proud (24%).
Baby boomers (29%) are the most likely to say they are very proud of America’s good moral example for the world, followed by members of the Silent Generation and Gen X (both 24%), millennials (20%), and Gen Zers (19%).
The Way Democracy Is Working in America Today
Two in ten Americans (19%) say they are extremely or very proud of the way democracy is working in America today, compared with 54% who are only a little or not at all proud. One-quarter say they are moderately proud (24%). Republicans (41%) are more likely than independents (15%) and Democrats (7%) to say they are very proud of the way democracy is working in America today.
Though a minority, white Christian groups are more likely than all other religious groups to say that they are very proud of the way democracy is working in America, including 31% of white evangelical Protestants, 28% of white mainline/non-evangelical Protestants, and 27% of white Catholics. Hispanic Protestants (19%), Jewish Americans (17%), other non-Christians (16%), Black Protestants (15%), Hispanic Catholics (15%), and the religiously unaffiliated (9%) are far less likely to say that they are very proud of the way democracy is working in America.
Around three in ten Americans who score very high (34%) or high (28%) on the RWAS say they are very proud of the way democracy is working in America, compared with 13% of those who score low or 5% who score very low. Two in ten of those who have mixed views are very proud (20%).
Younger generations, including Gen Zers (17%), millennials (15%), and Gen Xers (18%), are less likely than baby boomers (27%) and members of the Silent Generation (23%) to be very proud of how democracy is working.

America Has Always Been a Force for Good
Most Americans agree with the statement that America has always been a force for good (74%), compared with 23% who disagree. Opinions on this question have varied from a high of 79% in 2013 to a low of 68% in 2022. Solid majorities of all partisans agree, including 90% of Republicans, 73% of independents, and 67% of Democrats.
What It Means to Be “Truly American”
When asked about how important the following traits are to being “truly American,” most Americans say that believing in individual freedoms, such as freedom of speech (93%), believing in the Constitution (91%), accepting people of diverse racial and religious backgrounds (89%), believing in the Declaration of Independence (88%), respecting American political institutions and laws (88%), and being able to speak English (75%) are very or somewhat important.
Americans are more divided over whether believing in God (57%) and being born in America (54%) are very or somewhat important to being truly American. Americans are less likely to say that being a Christian (43%) or having ancestors who served in the military in previous wars, such as the World Wars and the Civil War (42%) are important. Just 23% of Americans say that being of Western European heritage is important to being truly American.
With the exception of Western European heritage, where only one-third say this trait is important (33%), majorities of Republicans believe every other trait is important to being truly American. Conversely, fewer than half of Democrats say that being born in America (42%), believing in God (41%), having ancestors who served in the military in previous wars, such as the World Wars and the Civil War (34%), and being a Christian (29%) are important to being truly American. Majorities of Democrats say all other traits are important. Though independents mirror all Americans very closely, they are 8 percentage points less likely to say believing in God (49% vs. 57%) or being Christian (35% vs. 43%) are very important to being truly American.

There are also differences between Christian groups and non-Christian groups on key aspects of being truly American. Most notably, white Christians and Christians of color are also more likely than non-Christians and unaffiliated Americans to say that believing in God, being born in America, being a Christian, and having ancestors who served in the military in previous wars are important to being truly American.

Unsurprisingly, most Christian nationalism Adherents (94%) and Sympathizers (80%) say being a Christian is somewhat or very important to being truly American, followed by 37% of Skeptics, and only 5% of Rejecters. A similar trend among Christian nationalism groups emerges when they refer to believing in God, being born in America, having ancestors who served in the military in previous wars, and being of Western European heritage as important to being truly American.

Support for Racial Diversity and Pluralism in America
Religious Pluralism or Christian Faith?
Nearly two-thirds of Americans (64%) would prefer “the U.S. to be a nation made up of people belonging to a wide variety of religions,” compared with 32% who prefer “the U.S. to be a nation primarily made up of people who follow the Christian faith.” Preference for a nation made up of people belonging to a wide variety of religions has declined from 73% in 2022 when the question was first asked.
A majority of Republicans (55%) prefer the U.S. to be primarily made up of Christians (slightly up from 52% in 2022), while 43% prefer the country to have a diverse religious makeup (down from 49%). By contrast, most Democrats (85%) and independents (70%, down from 79%) prefer a nation made up of a wide variety of religions, compared with just 14% and 26%, respectively, who prefer the U.S. to be mostly Christian.
Along religious lines, most white evangelical Protestants (67%) and Hispanic Protestants (58%) prefer the United States to be composed of people who are primarily Christian. By contrast, solid majorities of all other religious groups prefer the U.S. to be made up of people belonging to a wide variety of religions, mirroring results from 2022 when the question was first asked. Interestingly, Hispanic Protestants have grown nearly 20 percentage points more likely to prefer the U.S. to be made up of Christians since 2022 (up from 39%).
Not surprisingly, most Christian nationalism Adherents (82%) and Sympathizers (59%) prefer the United States to be composed of people who are primarily Christians, while most Rejecters (93%) and Skeptics (74%) prefer the U.S. to be made up of people belonging to a wide variety of religions.
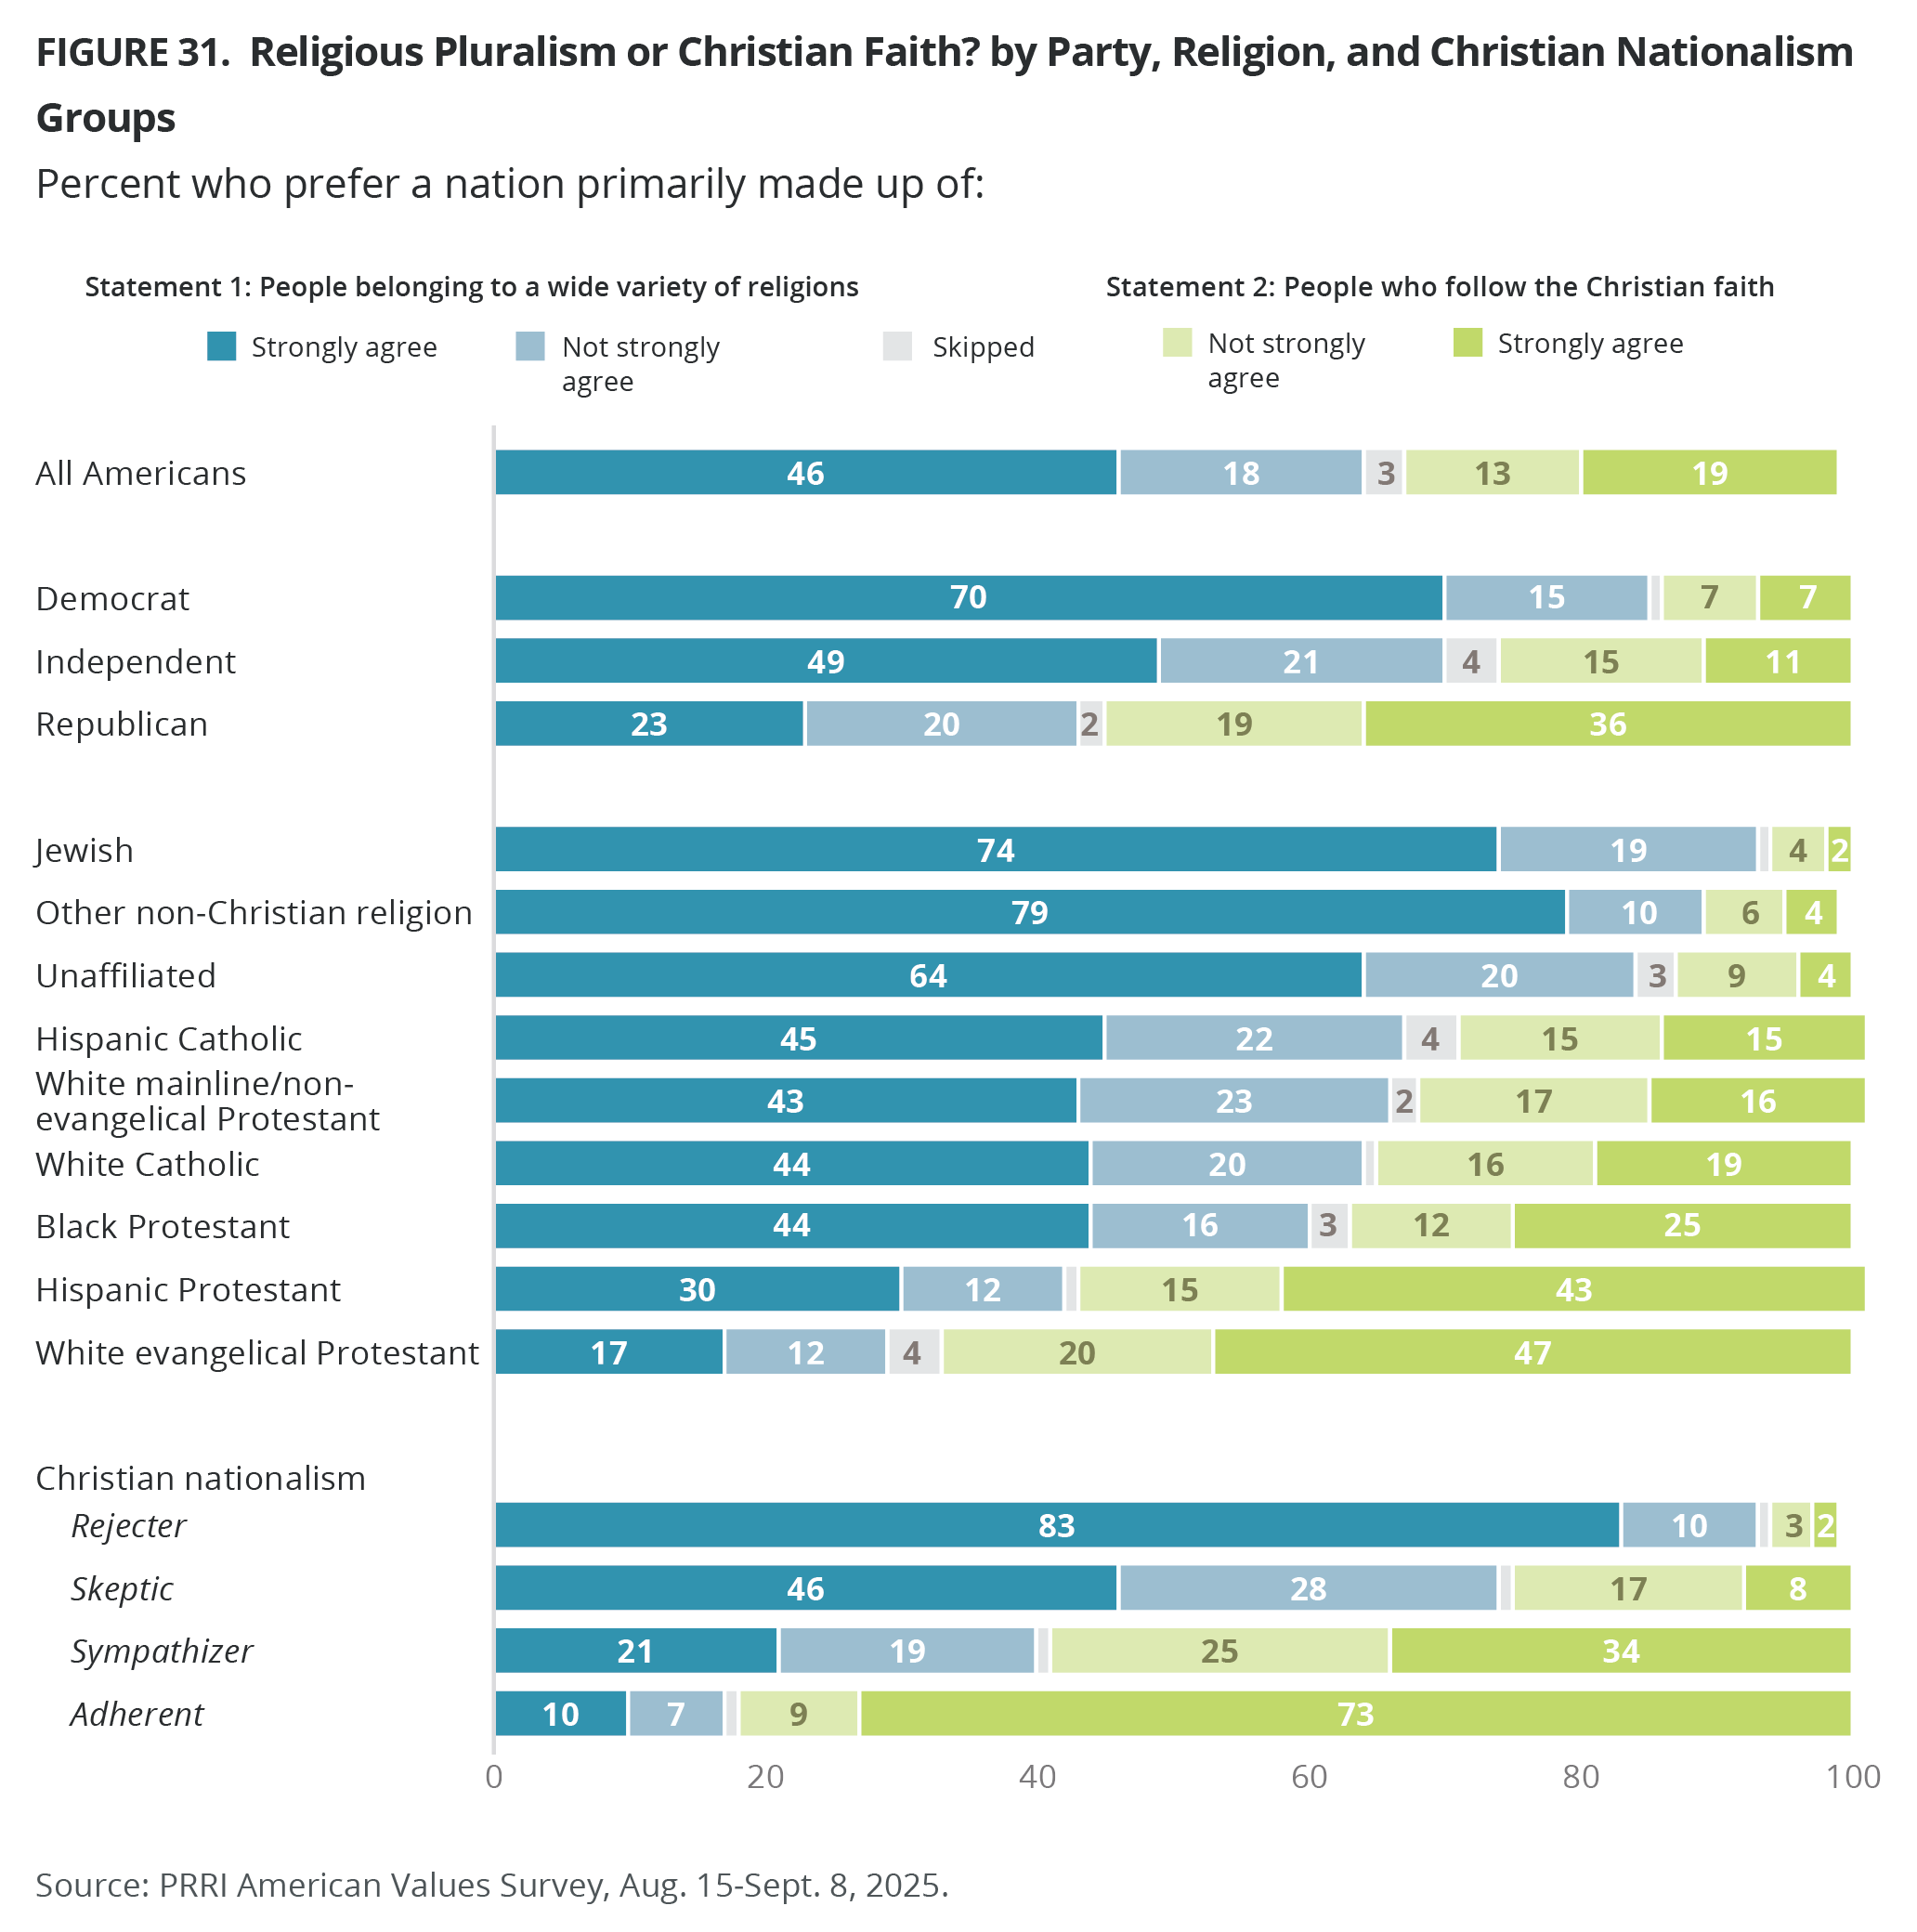
America Built on Equal Rights or Shared Heritage?
Most Americans (78%) believe that “America is best understood as a nation built around the idea that all people, regardless of the circumstances of their birth or station in life, have equal rights and freedoms,” while 19% believe that “America is best understood as a nation comprised of people with a shared heritage and homeland.” Majorities of Democrats (88%), independents (79%), and Republicans (70%) agree with the first statement, while far fewer agree with second statement (11%, 18%, 27%, respectively).
Majorities across religious groups and Christian nationalism groups agree that America is best understood as a nation built around the idea that all people have equal rights and freedoms.
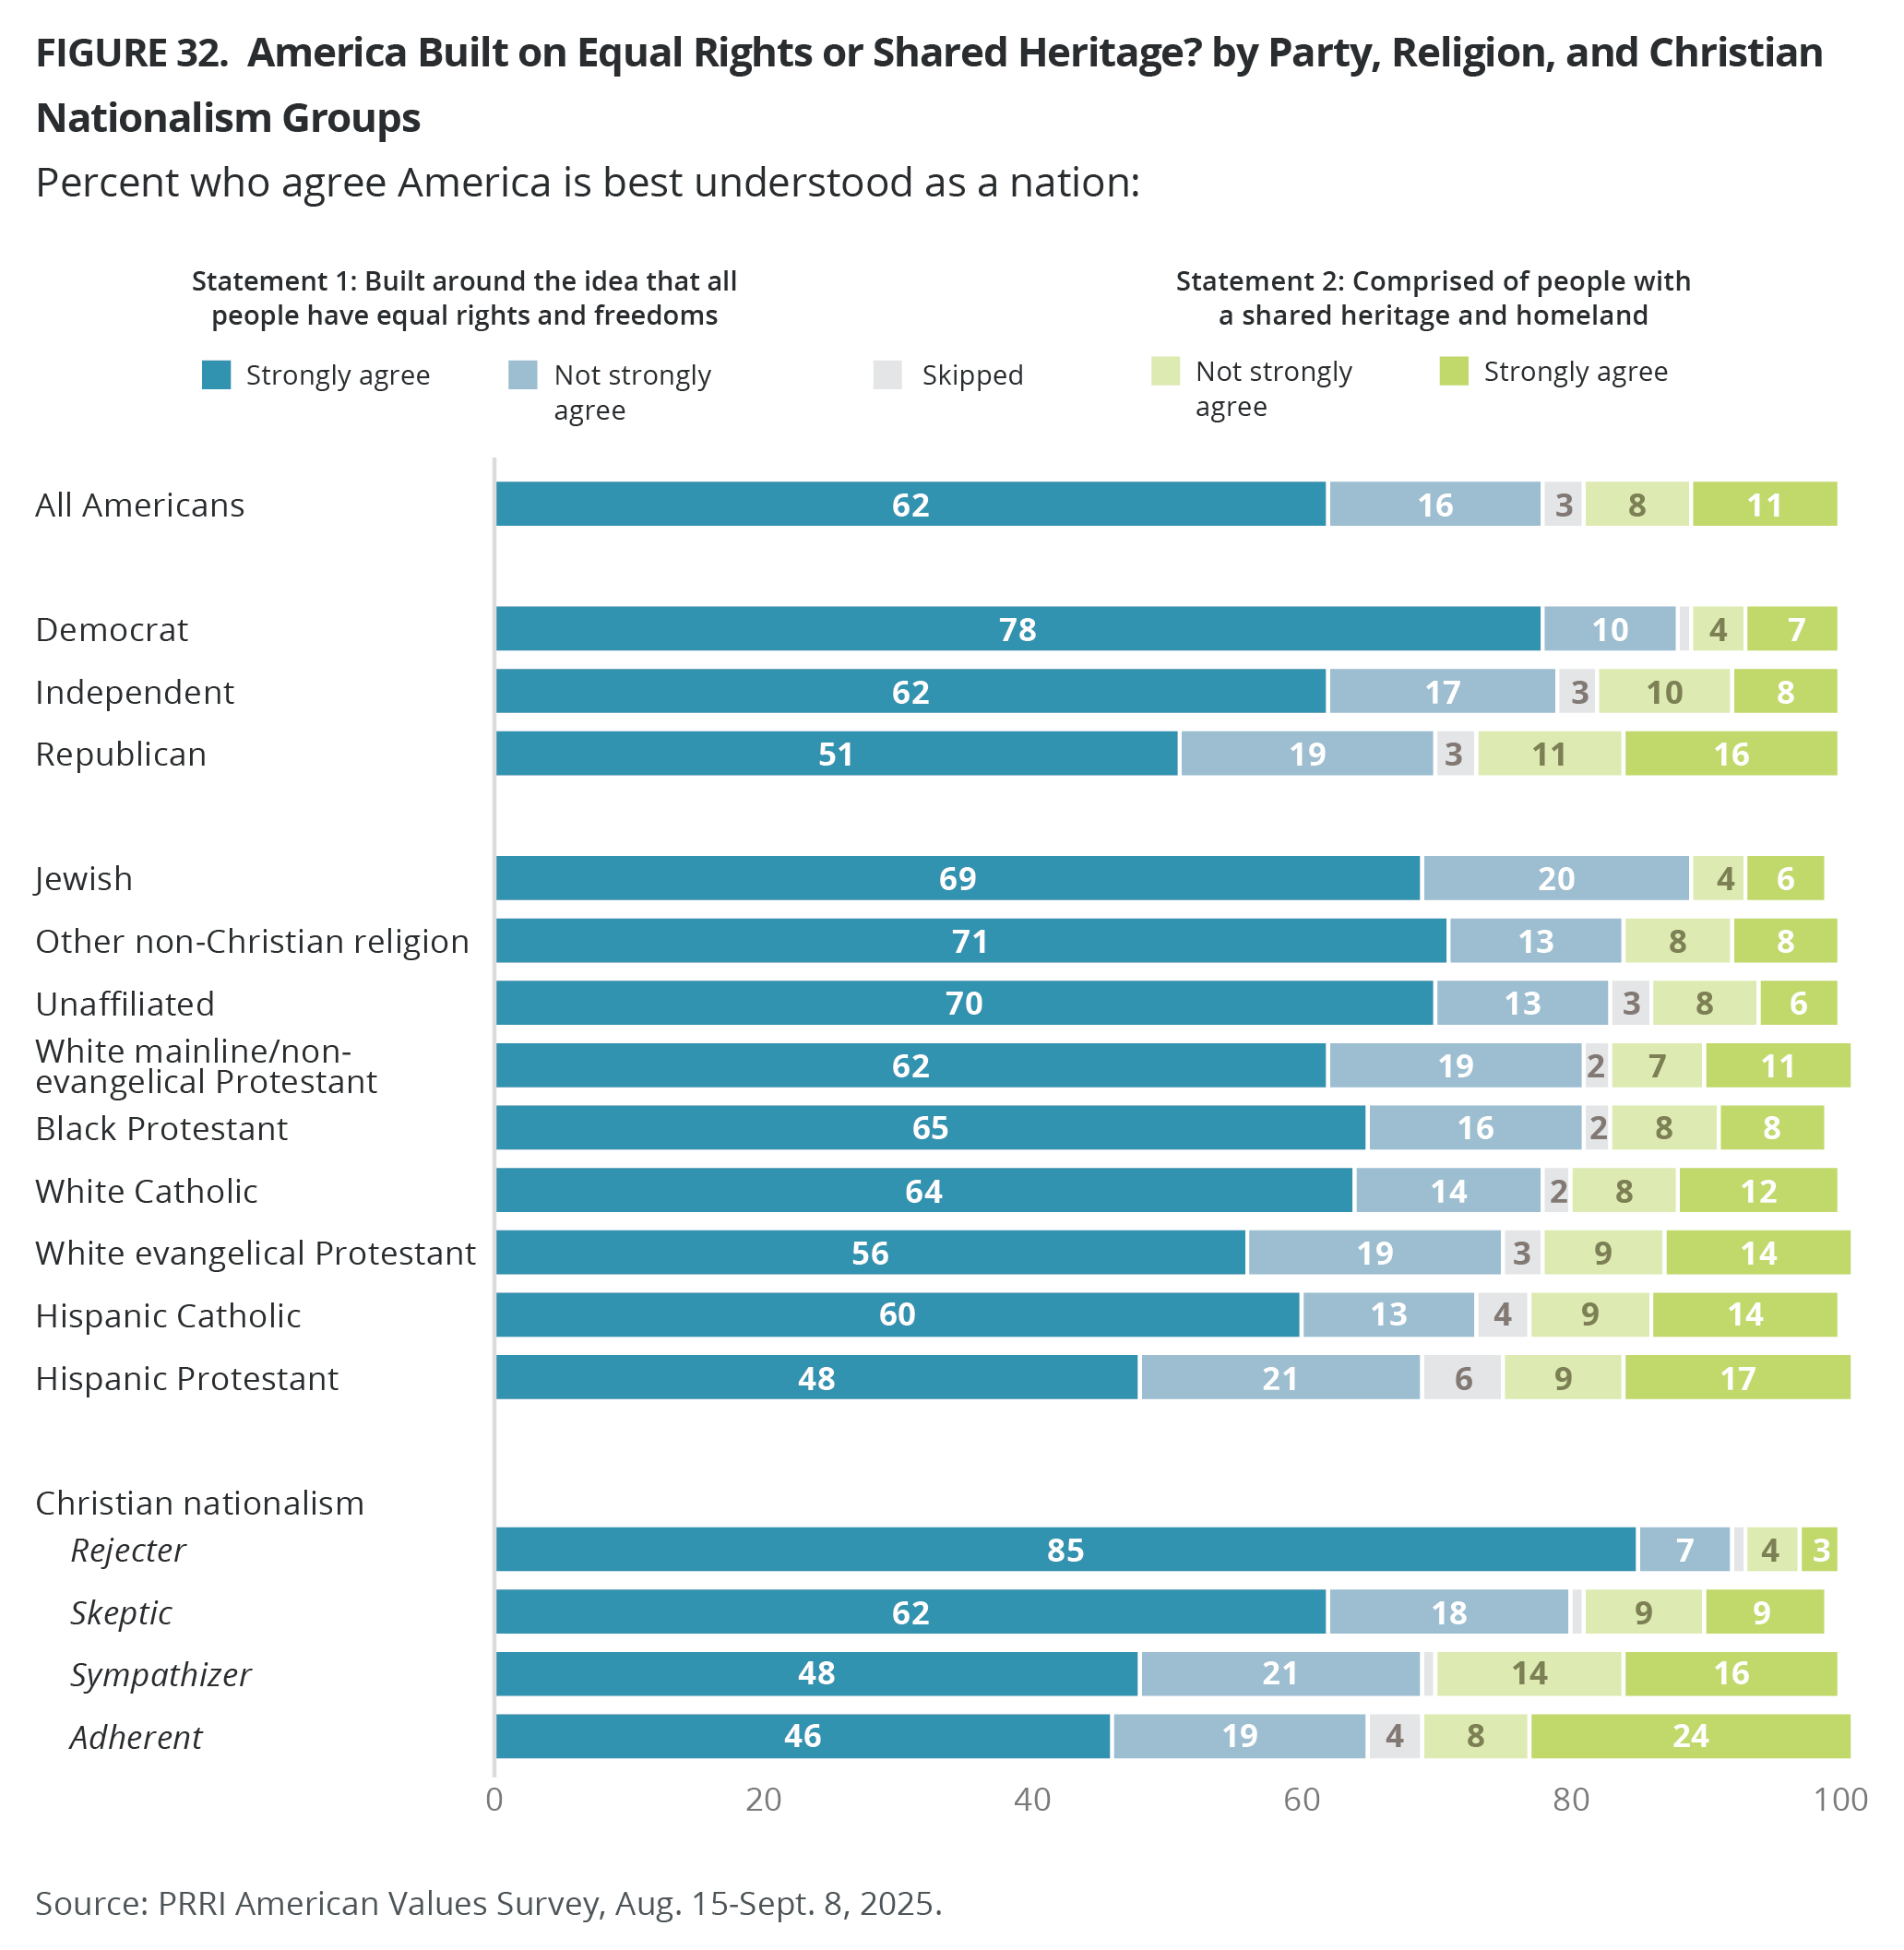
Social Connections: Belonging, Empathy, and Alienation
Connections With People in Your Neighborhood
A majority of Americans (58%) agree they have a strong connection with people in their neighborhood, while 39% disagree. Except for Black (48%) and multiracial Americans (43%), at least half of Americans by partisanship, media trust, religion, Christian nationalism groups, race, education, gender, generation, and region agree they have a strong connection with people in their neighborhood.
Considering Oneself as a Citizen of the World
Nearly six in ten Americans (58%) say they consider themselves a “citizen of the world;” 37% of Americans disagree with this idea. Most Democrats (71%) and independents (58%) would consider themselves a citizen of the world, compared with 47% of Republicans.
White evangelical Protestants (44%) are the only religious group where less than half would consider themselves a citizen of the world. Around seven in ten members of other non-Christian religions (71%), more than six in ten Black Protestants (64%), Hispanic Catholics (64%), unaffiliated (64%), Jewish Americans (64%), and Hispanic Protestants (61%), and more than half of white Catholics (56%) and white mainline/non-evangelical Protestants (53%) consider themselves citizens of the world.
Views on Empathy
Most Americans agree with the statement “Empathy is a moral value that is the foundation of a healthy society” (80%), compared with 16% who agree with the statement “Empathy is a dangerous emotion that undermines our ability to set up society that is guided by God’s truth.” Nine in ten Democrats (90%) agree with the first statement, followed by 83% of independents and 72% of Republicans. By contrast, Republicans (25%) are more likely to agree with the second statement than independents (14%) and Democrats (8%).
Around nine in ten Jewish Americans (92%), members of other non-Christian religions (91%), and unaffiliated Americans (87%) agree with the statement that empathy is the foundation of a healthy society. This is followed by around eight in ten Black Protestants (83%), white mainline/non-evangelical Protestants (81%), white Catholics (80%), and Hispanic Catholics (79%), seven in ten white evangelical Protestants (70%), and less than two-thirds of Hispanic Protestants (64%). Hispanic Protestants (31%) and white evangelical Protestants (26%) are the most likely to agree with the statement that empathy is a dangerous emotion that undermines our ability to set up society that is guided by God’s truth.
Most Americans who score very high (66%), high (77%), low (85%), or very low (93%) on the RWAS agree with first statement, as do 71% of those who hold mixed views. However, one-third of those who score very high (32%) on the RWAS say empathy is a dangerous emotion that undermines the proper setup of society.
Most Americans who qualify as Christian nationalism Rejecters (95%), Skeptics (84%), Sympathizers (71%), and Adherents (59%) agree with first statement. Notably, however, nearly four in ten (37%) Christian nationalism Adherents say empathy is a dangerous emotion that undermines the proper setup of society.
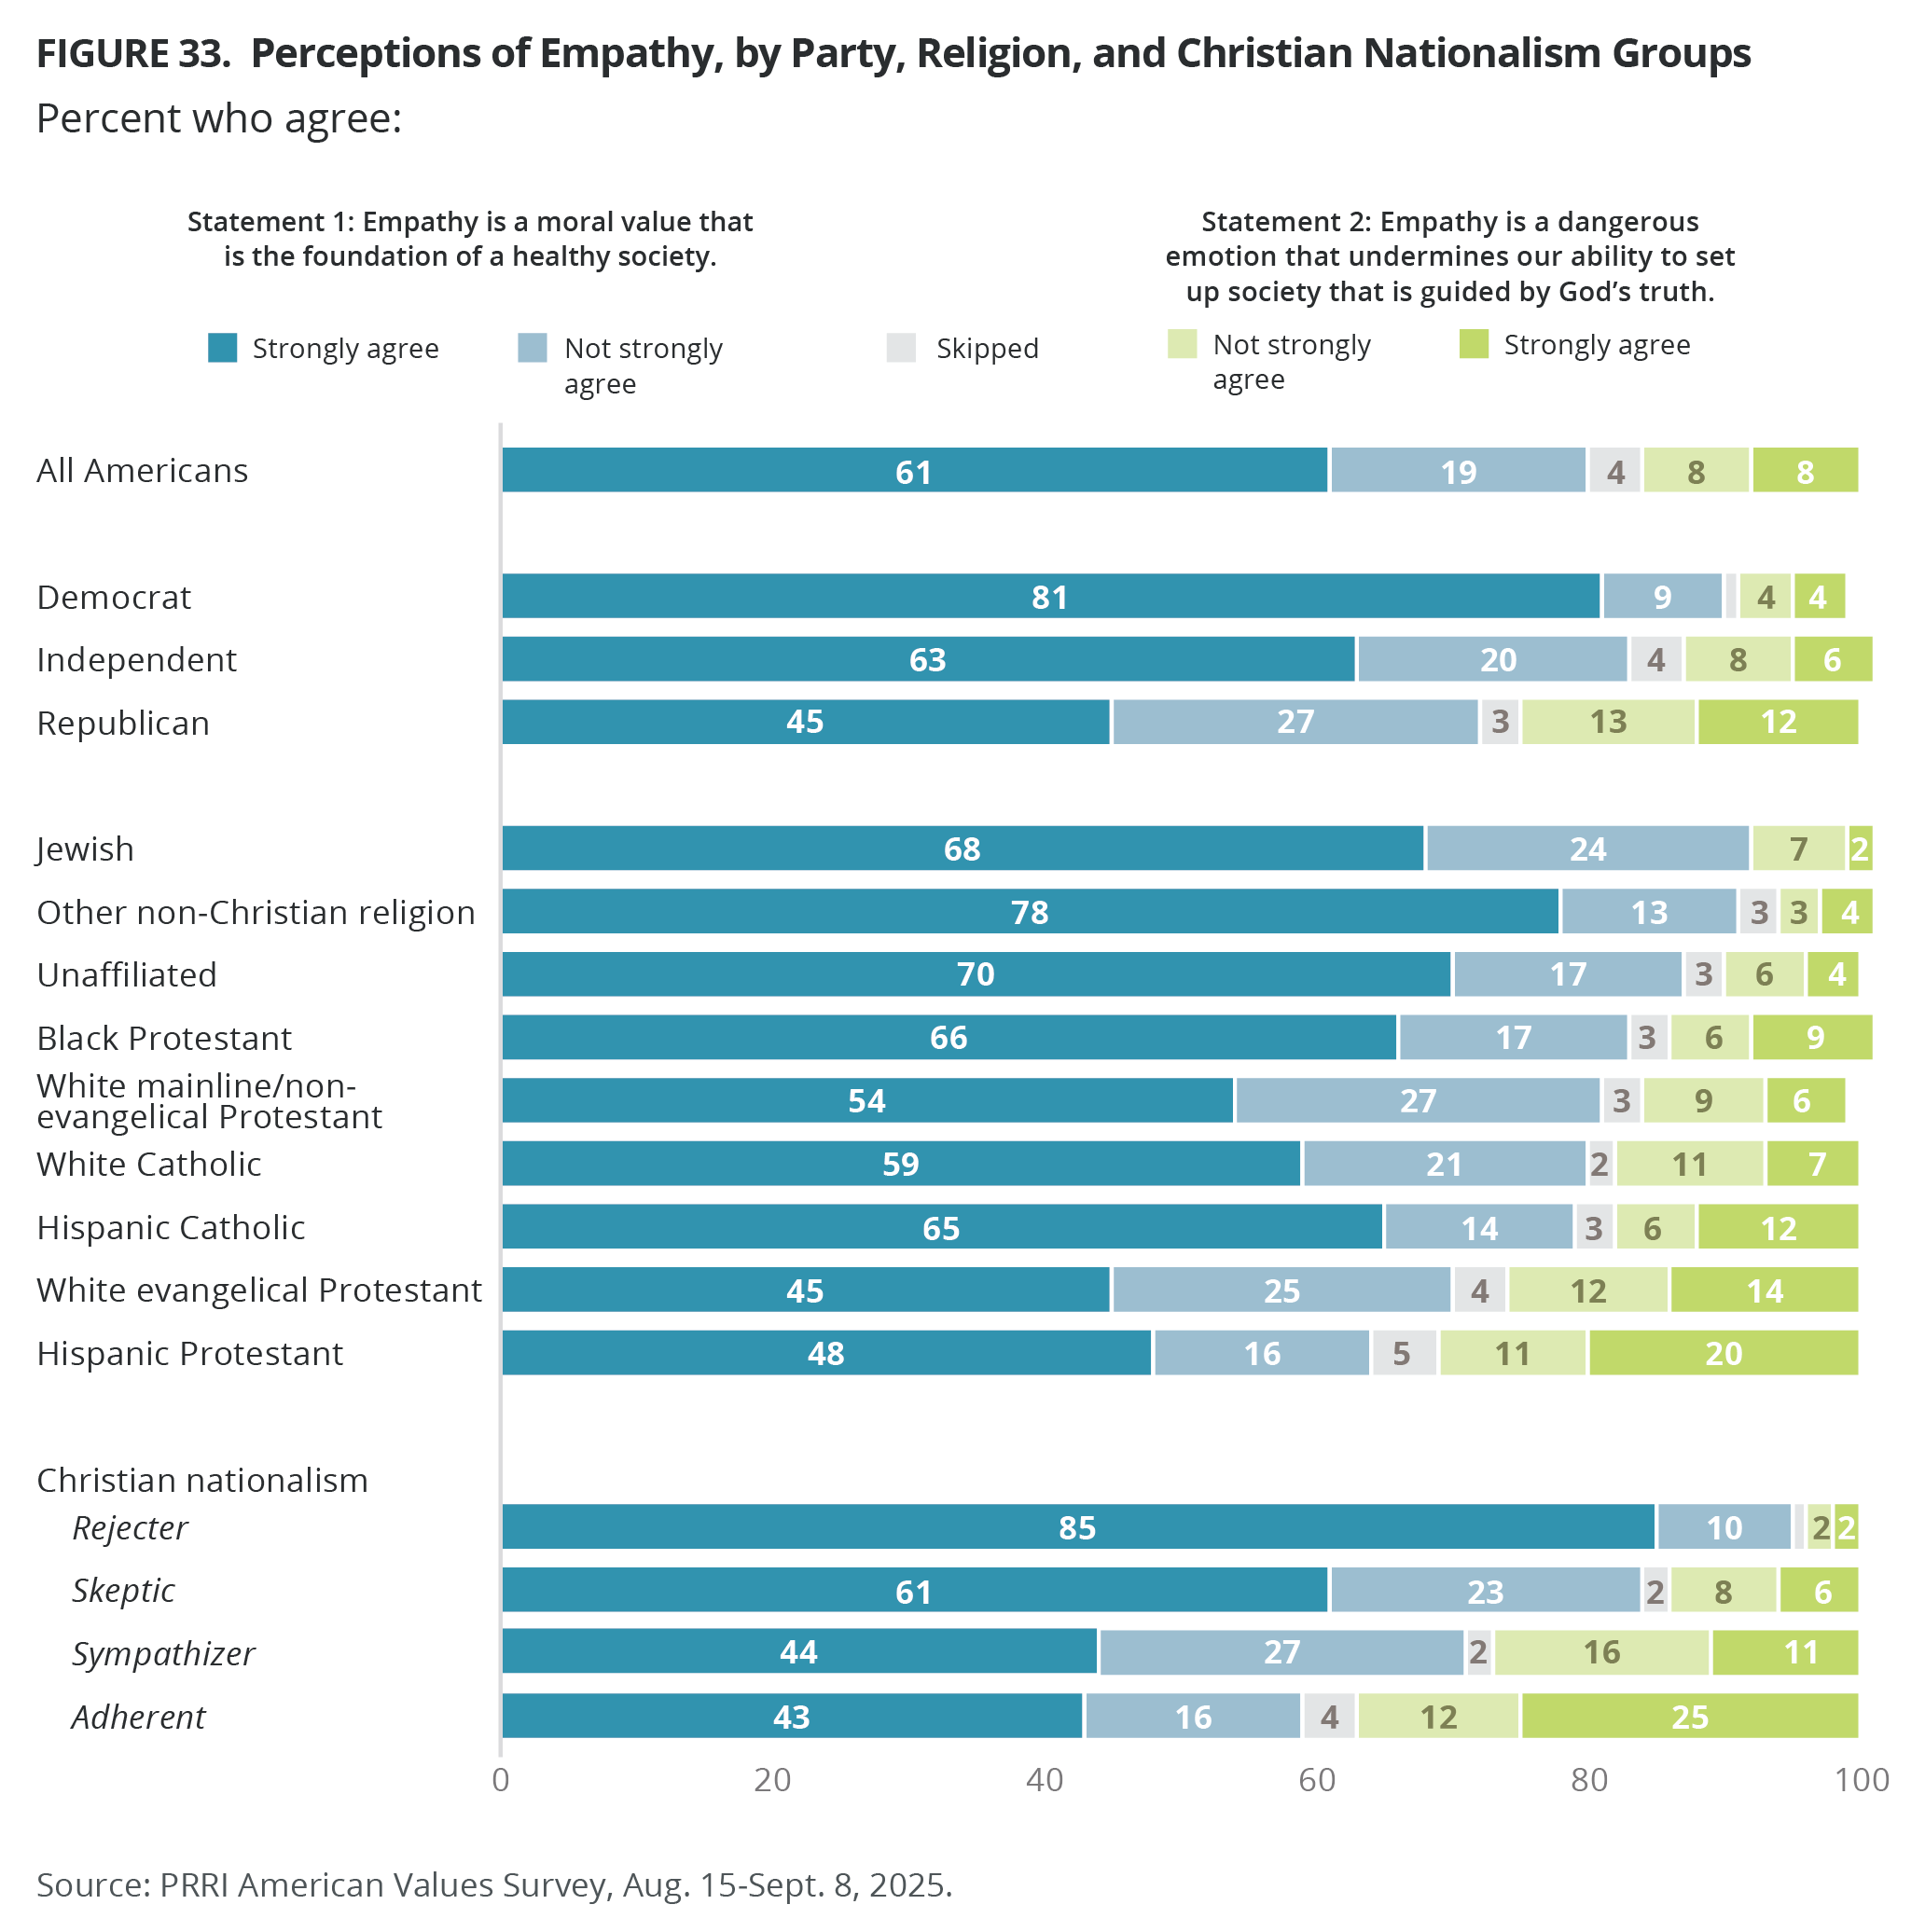
Alienation and Cultural Resentment
Feeling Like a Stranger in One’s Own Country
Nearly half of Americans (46%) agree with the statement “Things have changed so much that I often feel like a stranger in my own country,” while 51% disagree. Agreement is up slightly from 41% when PRRI first asked the question in 2016, but the subgroups agreeing with this sense of cultural alienation have shifted dramatically over time. From 2016-2022, Republicans were consistently the most likely to agree with the statement than disagree (peaking at 65% in 2022). By 2025, Democrats (59%, up from 33% in 2016) are significantly more likely than Republicans (30%, down from 49%) to agree. Independents in 2025 have grown more likely to agree with the statement compared with 2016 (47% vs. 42%).

More than half of members of other non-Christian religions (58%), Black Protestants (54%), and unaffiliated Americans (53%) say things have changed so much that they feel like a stranger in their own country. About half of Hispanic Protestants (49%) and Jewish Americans (48%), around four in ten white Catholics (42%) and white mainline/non-evangelical Protestants (37%), and three in ten white evangelical Protestants (30%) agree they feel like a stranger in their own country.
Most Christian nationalism Rejecters (61%) agree with the statement, compared with around four in ten Skeptics (43%), Sympathizers (40%), and Adherents (39%).
The majority of Hispanic (56%) and Black Americans (53%) and around half of AAPI (50%) and multiracial (49%) Americans say they feel like a stranger in their own country, compared with only 41% of white Americans. Compared with 2016, Hispanic Americans today report much higher levels of cultural alienation (41% to 56%). Interestingly, in 2016, white Americans without a college degree (47%) were more likely than white Americans with a college degree (26%) to say they felt like a stranger in their own country. Today, the educational gap disappears. Four in ten of both white Americans with and without a college degree feel the same way (40% vs. 41%).
Discrimination Against Christians and White Americans
About four in ten Americans (37%) agree with the statement “Today, discrimination against Christians has become as big a problem as discrimination against other groups,” while the majority of Americans disagree (59%). Agreement has declined since the question was first asked in 2016 (49%). Similarly, about four in ten Americans (39%) agree with the statement “Today, discrimination against white Americans has become as big a problem as discrimination against Black Americans and other minorities;” less than six in ten Americans (57%) disagree. Agreement has declined since the question was first asked in 2012 (47% to 39%).
Around six in ten Republicans (62%) agree discrimination against Christians has become as big a problem as discrimination against other groups, compared with 32% of independents and 20% of Democrats. Agreement among all partisan groups has declined since 2016. Similarly, two-thirds of Republicans (66%) agree that discrimination against white people has become as big a problem as discrimination against Black Americans and other minorities. Compared with 2012, fewer independents (46% to 32%) and Democrats (33% to 18%) agree with the statement.

About two-thirds of white evangelical Protestants agree that discrimination against Christians (65%) and white Americans (63%) has become as big a problem as discrimination against other groups. Most Hispanic Protestants also agree that discrimination against Christians (53%) has become as big a problem as discrimination against other groups, but far fewer think the same about white Americans (36%). Similarly, Black Protestants (44% vs. 23%) and Hispanic Catholics (37% vs. 35%) express the same sentiment. By contrast, white Catholics (53% vs. 44%), mainline/non-evangelical Protestants (53% vs. 44%), other non-Christians (30% vs. 14%), Jewish Americans (29% vs. 19%), and unaffiliated Americans (24% vs. 16%) are more likely to agree that discrimination against white Americans has become as big a problem as discrimination against other groups than discrimination against Christians.
Most Americans who qualify as Christian nationalism Adherents (82% vs. 68%) and Sympathizers (64% vs. 60%) agree that discrimination against Christians and white Americans has become as big a problem as discrimination against other groups, while far fewer Skeptics (33% vs. 39%), and Rejecters (6% vs. 14%) express the same sentiment.
White (39%), Black (37%), and Hispanic Americans (36%) similarly agree that discrimination against Christians has become as big a problem as discrimination against other groups; however, when it relates to white people, white Americans (47%) are more likely than Hispanic (32%) and Black Americans (19%) to agree.
Perceptions of Immigrants and Immigration Policy
Perceptions of Immigrants
Immigrants Strengthen American Society
Most Americans (57%) agree with the statement that the growing number of newcomers from other countries strengthens American society, while 41% disagree. Agreement has fallen from 63% at the end of 2022, when PRRI first asked this question. The decline is driven mainly by Republicans, from 35% to 30%, and independents, from 67% to 63%, while Democrats have remained essentially unchanged (81% to 82%).
White Christian groups are among the least likely to say immigrants strengthen American society. White mainline/non-evangelical Protestants (49% agree vs. 49% disagree) and white Catholics (47% agree vs. 51% disagree) are roughly split, while only one-third of white evangelical Protestants (35%) agree. By contrast, majorities agree among non-Christians (78%), Hispanic Catholics (69%), religiously unaffiliated Americans (68%), Jewish Americans (66%), Black Protestants (63%), and Hispanic Protestants agree (53%).
Most Christian nationalism Rejecters (84%) and Skeptics (55%) agree that immigrants strengthen American society, compared with 41% of Sympathizers and 31% of Adherents.
The “Great Replacement Theory”
Around one-third of Americans (32%) agree with the statement “Immigrants are invading our country and replacing our cultural and ethnic background,” compared with 65% who disagree. Agreement with this statement has slightly decreased from the first time PRRI asked this question in 2019 (36%). While Democrats (10%) and independents (26%) have become less likely to agree with this idea — which is promoted in conservative circles as the “Great Replacement Theory” — than they were in 2019 (20% and 31%, respectively), Republicans (62%) have remained largely consistent in their views.
Except for white evangelical Protestants, no religious tradition shows majority agreement with the “Great Replacement Theory.” Around four in ten white Catholics (46%) and white mainline/non-evangelical Protestants (46%) agree, as well as roughly one in four Hispanic Protestants (27%), Jewish Americans (26%), Black Protestants (24%), members of other non-Christian religions (22%) and unaffiliated Americans (21%). Hispanic Catholics are the least likely to agree with this statement (14%). By contrast, most white evangelical Protestants (55%) agree, but have become less likely to do so since PRRI first asked in 2019 (62%).
Two in three Christian nationalism Adherents (67%) agree that immigrants are invading the country and replacing our cultural and ethnic background, compared with half of Christian nationalism Sympathizers (51%). By contrast, far fewer Christian nationalism Skeptics (32%) and Rejecters (8%) agree with this theory.
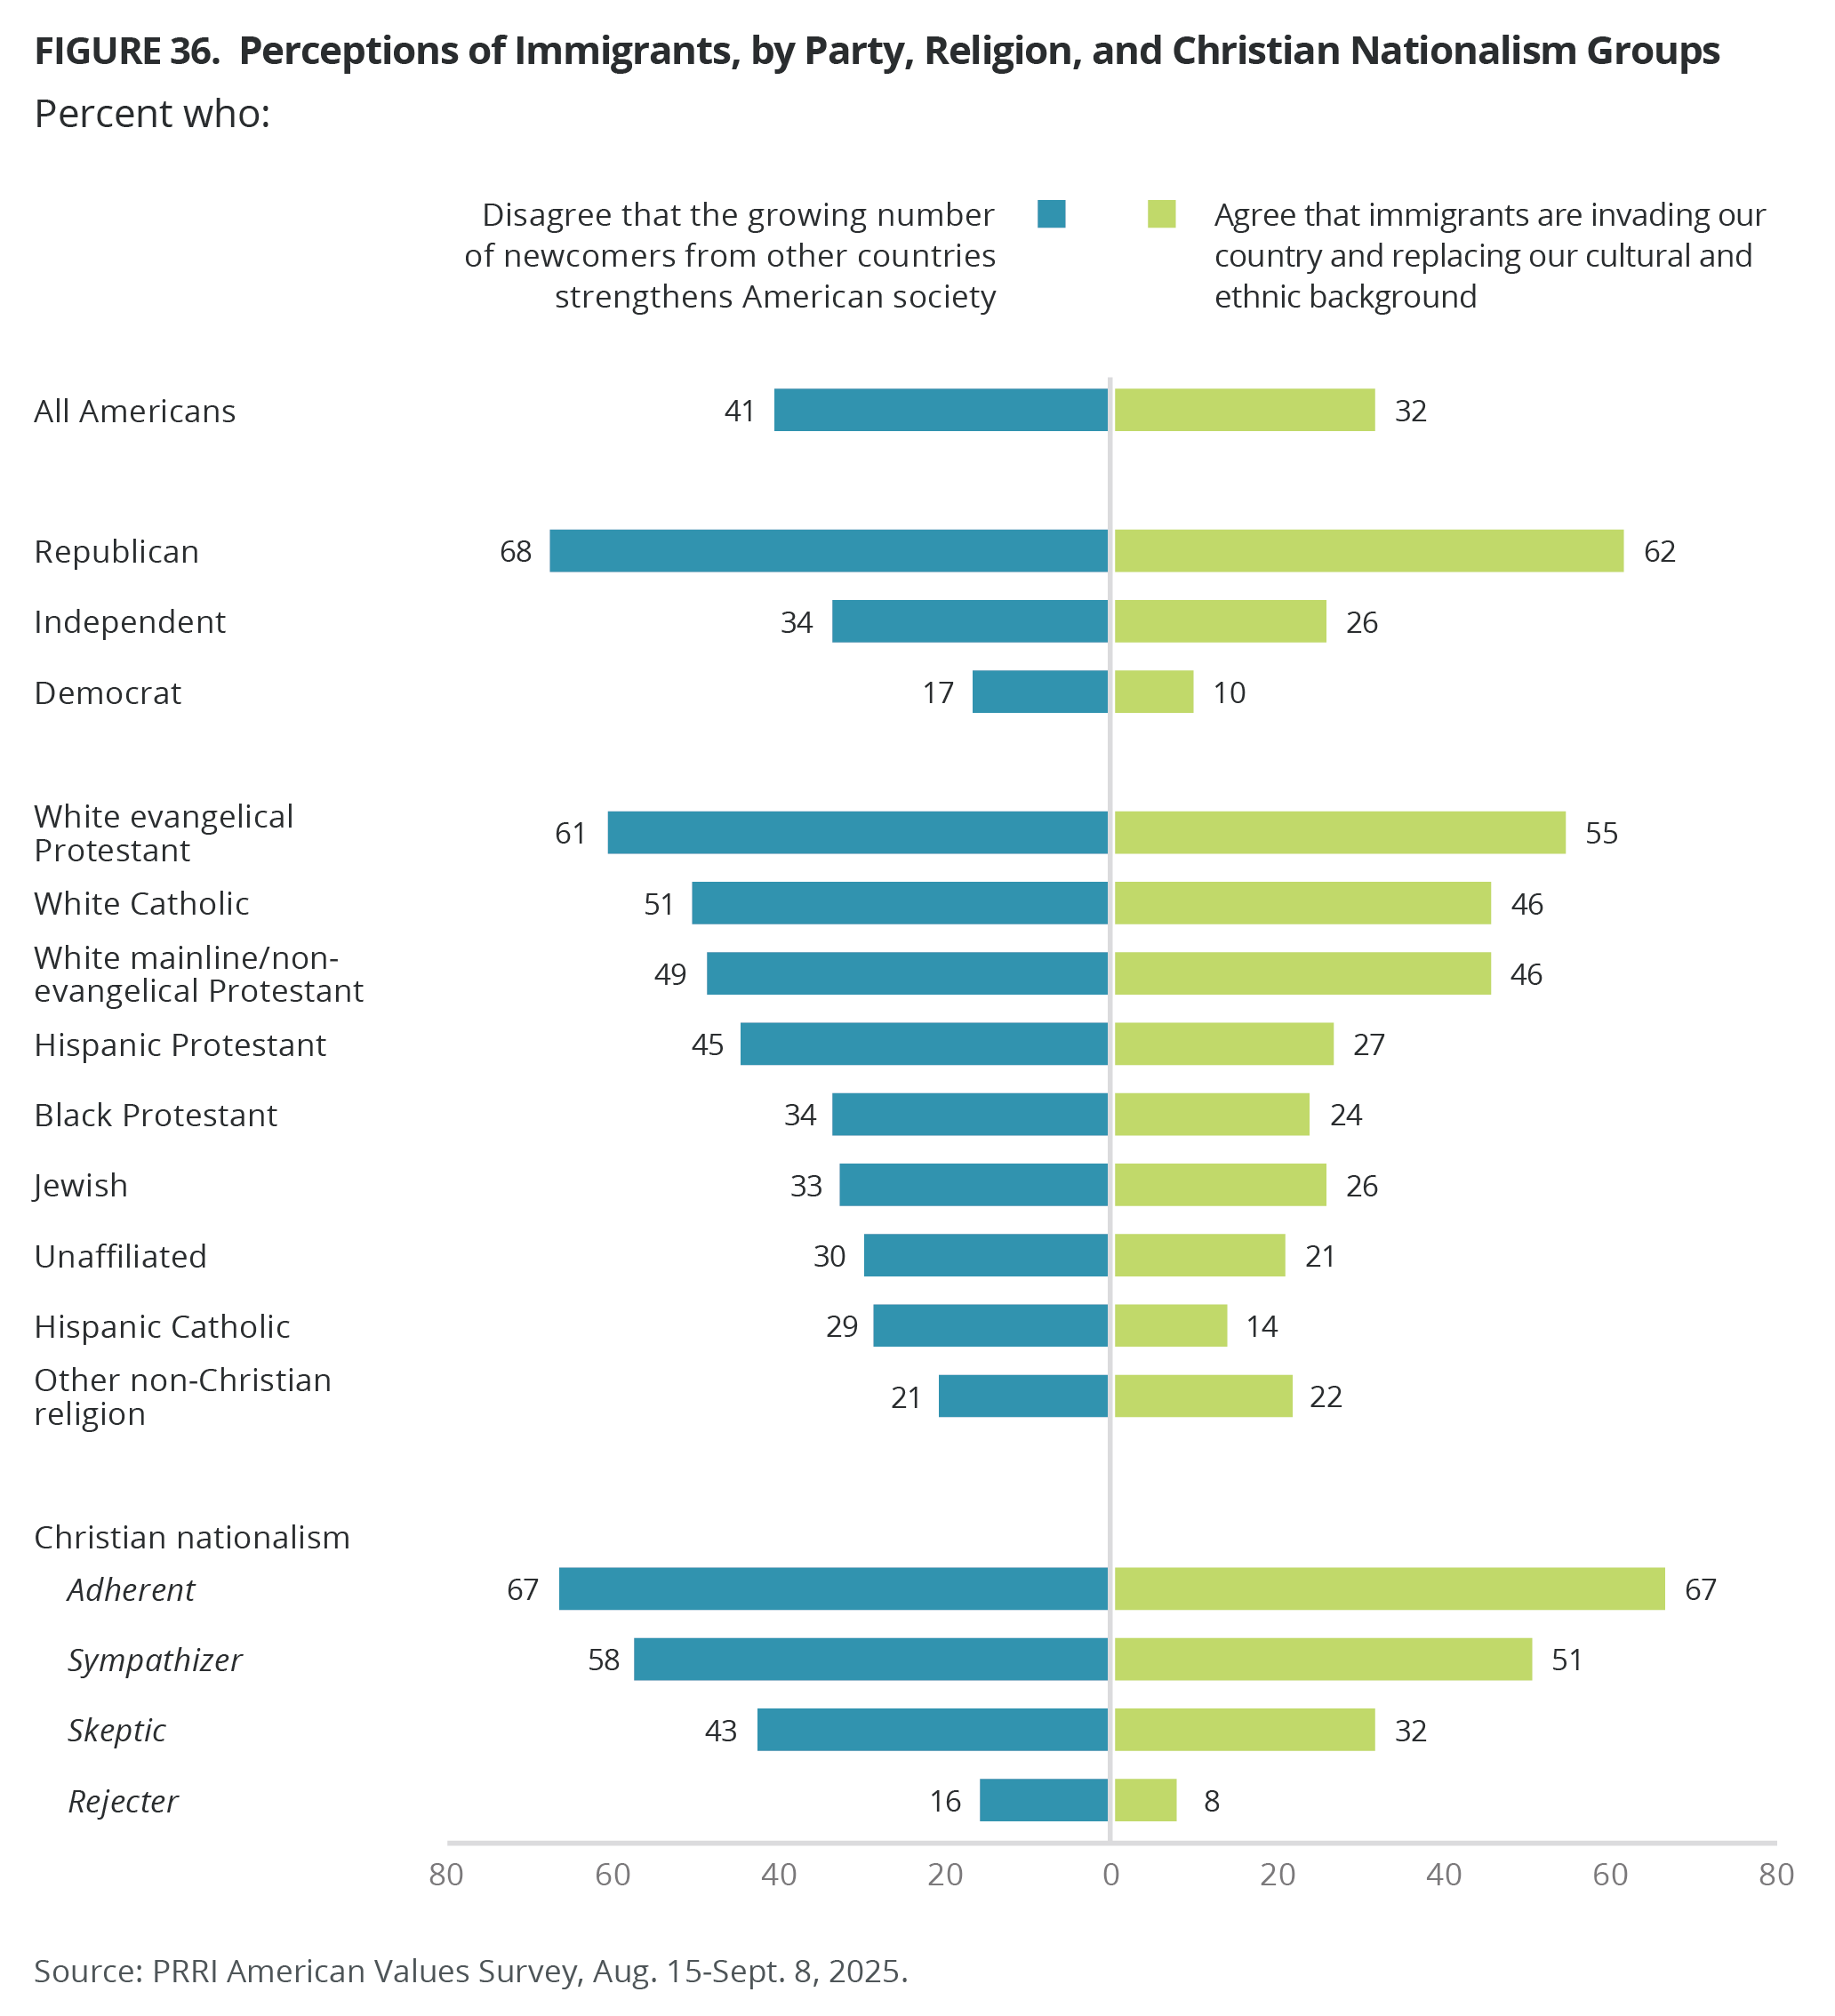
Immigration Rights and Protections
A Pathway to Citizenship for Undocumented Immigrants
Most Americans (60%) say that immigrants living in the United States illegally should be given a way to become citizens, provided they meet certain requirements. More than one in ten say they would prefer undocumented immigrants to be eligible for permanent residency status but not citizenship (12%), and one in four say all immigrants living in the country illegally should be identified and deported (24%). Majority support for a pathway to citizenship for undocumented immigrants has remained remarkably consistent since 2013, with a high of 67% in 2019 and a low of 56% in 2024.
Democrats (82%) have grown more supportive of a path to citizenship for undocumented immigrants, with support increasing from 71% in 2013 when the question was first asked. By contrast, Republicans (40%) have become less supportive than they were in 2013 (53%). Notably, support among Republicans for identifying and deporting undocumented immigrants has risen 16 percentage points since 2013, from 32% to 48% today. Independents (61%) have remained mostly consistent (64% in 2013). Notably, the partisan gap on this question has more than doubled over the last decade, from 18 percentage points in 2013 to 42 percentage points in 2025.
Around seven in ten Hispanic Catholics (72%), Black Protestants (69%), and unaffiliated Americans (67%) support allowing undocumented immigrants to become citizens, followed by around six in ten Hispanic Protestants (63%), other non-Christians (61%), and Jewish Americans (59%). A majority of white mainline/non-evangelical Protestants (56%) and white Catholics (54%) also support a pathway to citizenship. White evangelical Protestants (46%) is the only religious group without majority support. Support among white evangelical Protestants for identifying and deporting undocumented immigrants has trended upward over the past decade, from 30% in 2013, to a peak at 53% in 2024, and to 44% in 2025.
Eight in ten Christian nationalism Rejecters (79%) and six in ten Skeptics (61%) support allowing undocumented immigrants to become citizens, compared with 49% of Christian nationalism Adherents and 41% of Sympathizers.
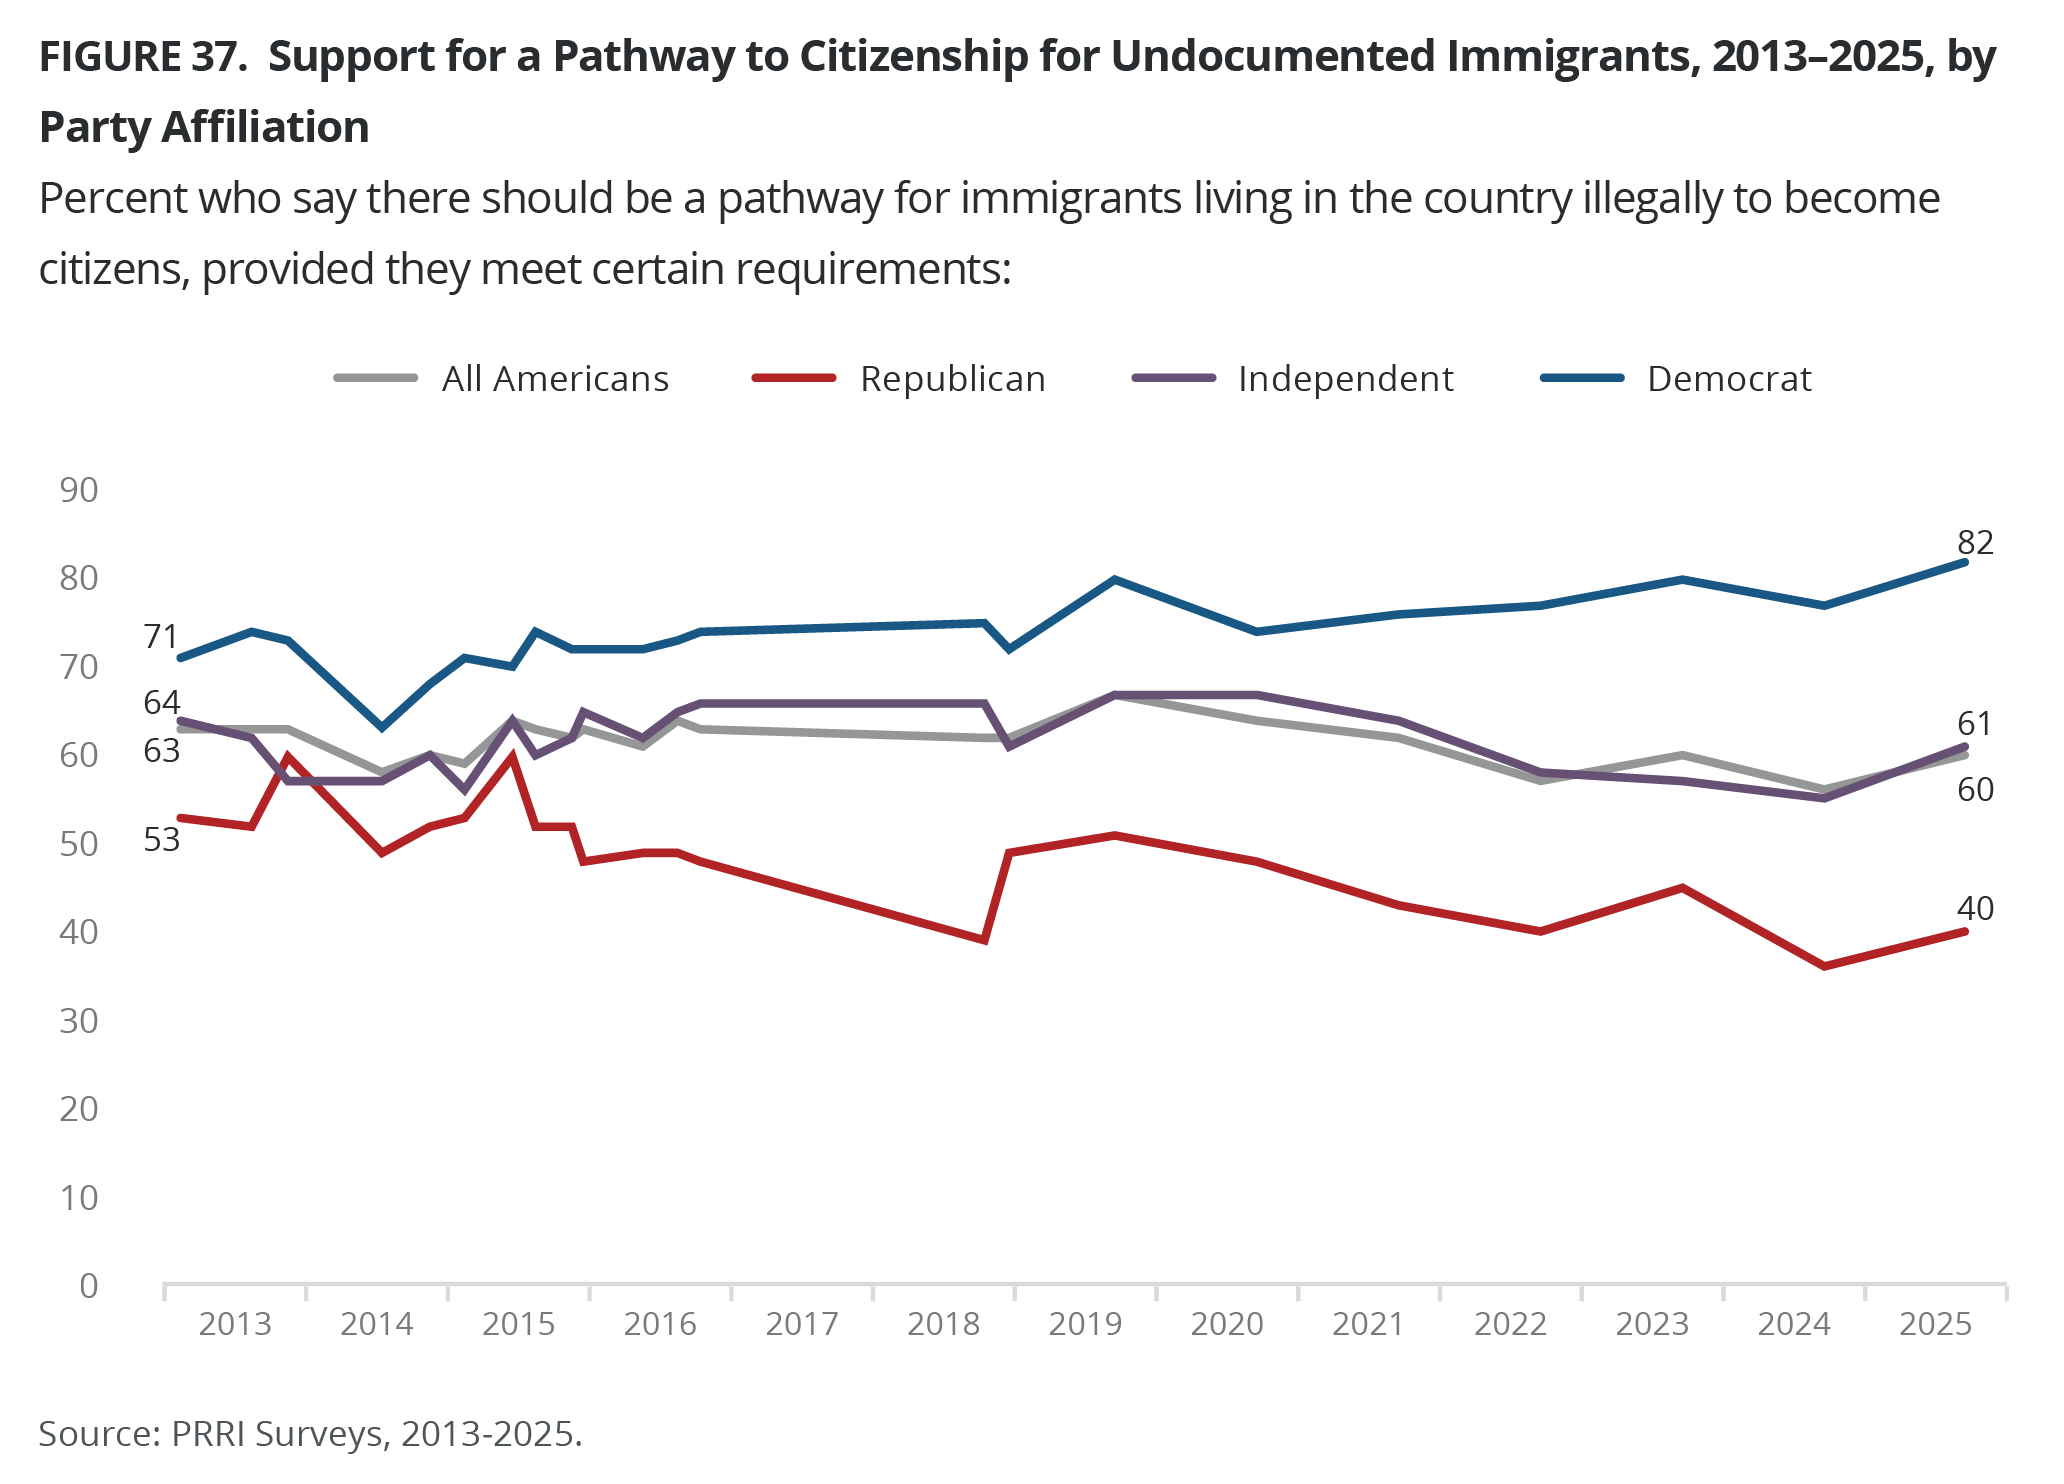
Allowing Children Brought to the U.S. Illegally to Become Citizens
Six in ten Americans (60%) favor allowing immigrants brought illegally to the U.S. as children to gain legal resident status, while 36% oppose. Support for this policy, which stood at 62% in 2018, decreased to 52% last year but has since rebounded. Partisan gaps remain wide: More than eight in ten Democrats support this policy (84%, up from 78% in 2018), compared with 64% of independents and 38% of Republicans (slightly down from 41% in 2018).
Solid majorities of Hispanic Catholics (78%), Jewish Americans (72%), unaffiliated Americans (71%), Black Protestants (67%), and other non-Christians (63%) favor allowing children brought to the country illegally to gain resident status. Smaller majorities of white Catholics (56%), Hispanic Protestants (55%), and white mainline/non-evangelical Protestants (53%) also support this policy. Among religious groups, only white evangelical Protestants do not reach majority support (44% vs. 51% oppose).
Most Christian nationalism Rejecters (84%) and Skeptics (61%) favor allowing immigrants brought to the U.S. illegally as children to gain legal resident status, compared with 47% of Sympathizers and 40% of Adherents.

Birthright Citizenship
Two-thirds of Americans (67%) favor the “U.S. Constitution’s existing guarantee that all children who are born in the United States are automatically granted U.S. citizenship, regardless of their parents’ citizenship status,” while 29% oppose. Most Democrats (88%) and independents (71%) favor the birthright citizenship provision in the Constitution, compared with 47% of Republicans.
Strong majorities of most religious groups support birthright citizenship, including 83% of Black Protestants, 82% of Hispanic Catholics, 78% of Jewish Americans, 76% of unaffiliated Americans, 71% of other non-Christians, 70% of Hispanic Protestants, and 59% of white mainline/non-evangelical Protestants and white Catholics. A slim majority of white evangelical Protestants also support birthright citizenship (52%).
Most Christian nationalism Rejecters (88%), Skeptics (69%), and Sympathizers (55%) favor birthright citizenship. Christian nationalism Adherents are divided (49%).
Immigrants Should Have Due Process Regardless of Legal Status
About six in ten Americans (61%) agree with the idea that “immigrants, regardless of legal status, should have basic rights and protections such as the ability to challenge their deportation before a judge in court,” while 36% disagree. Most Democrats (88%) and independents (67%) agree, compared with just one-third of Republicans (34%).
Except for white Christian groups, solid majorities across all other religions agree that immigrants should have basic rights — including due process — regardless of legal status: 78% of Jewish Americans and other non-Christians, 76% of Hispanic Catholics, 74% of unaffiliated Americans, 71% of Black Protestants, and 58% of Hispanic Protestants. By contrast, agreement is lower among white Christians: 52% of white mainline/non-evangelical Protestants, half of white Catholics (50%), and just 39% of white evangelical Protestants agree; instead, a majority disagree (57%) that immigrants should have access to basic rights — including due process.
Most Christian nationalism Rejecters (87%) and Skeptics (62%) favor immigrants’ basic rights regardless of legal status, compared with 45% of Sympathizers and 37% of Adherents.
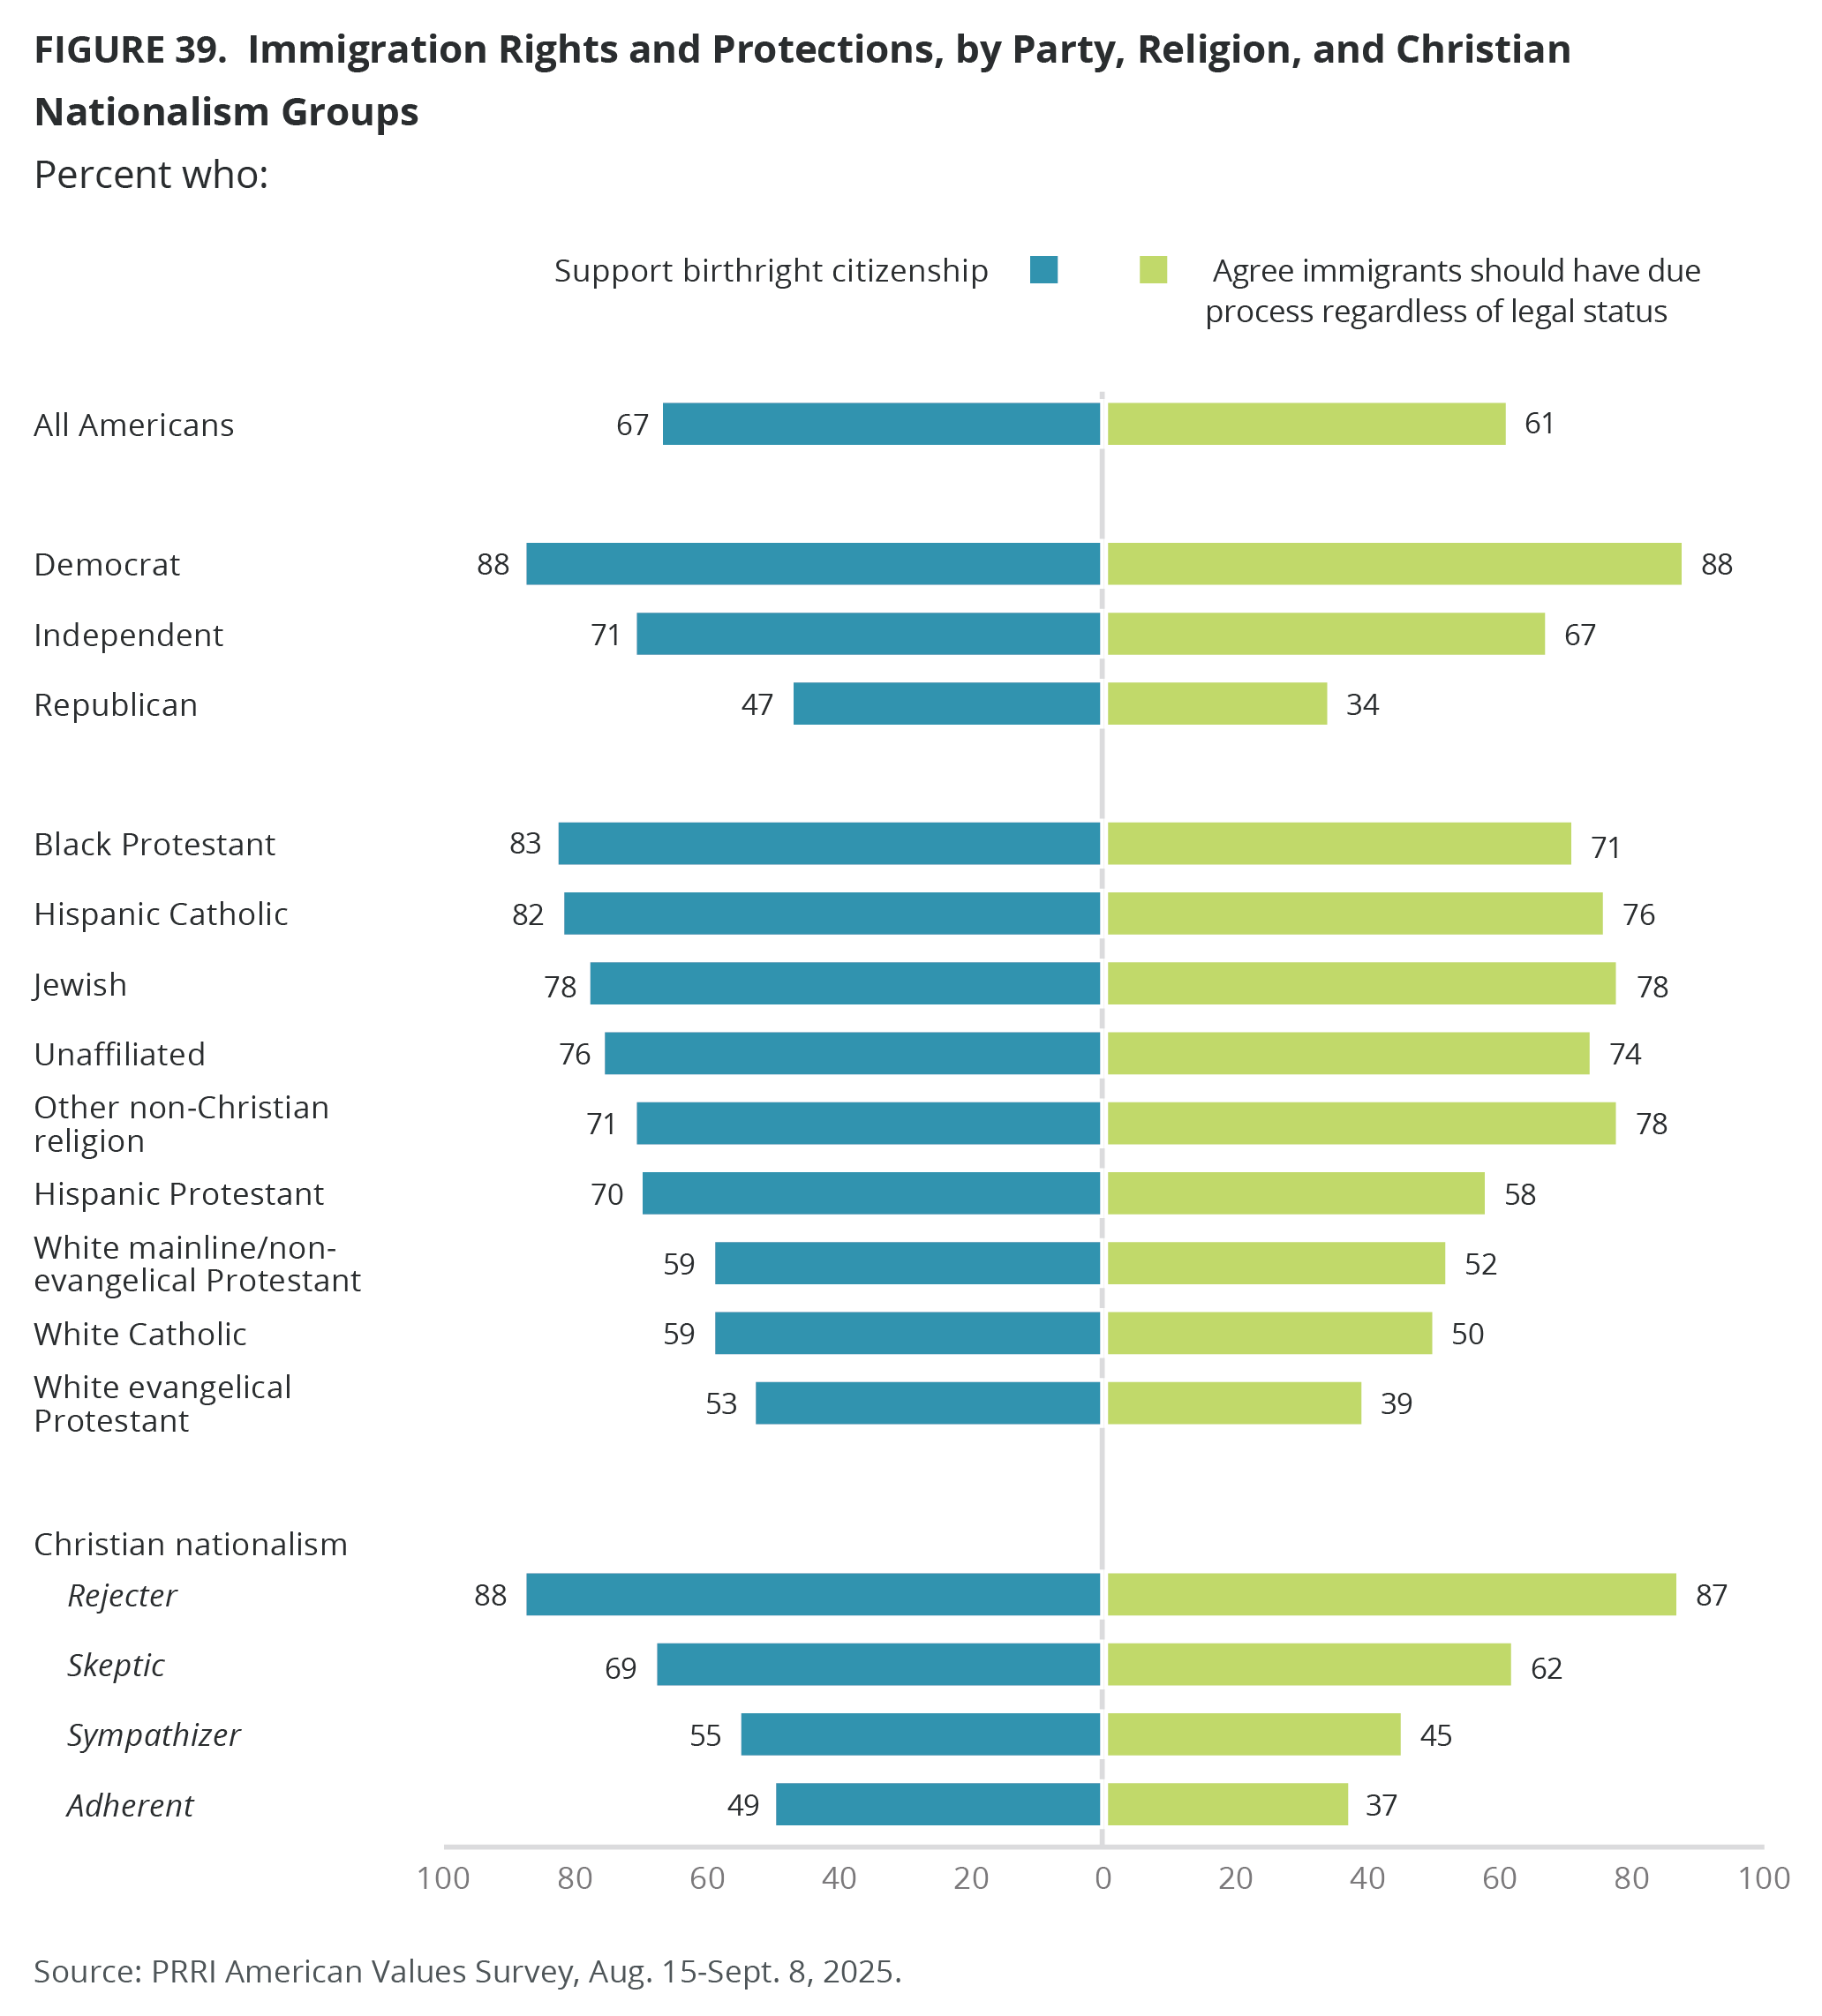
Immigration and Law Enforcement
Prohibiting ICE Officers From Concealing Their Identities
Nearly six in ten Americans (58%) agree that “Immigration and Customs Enforcement (ICE) officers should not be allowed to conceal their identity with masks or use unmarked vehicles when arresting people,” including 40% who strongly agree. Most Democrats (84%) and independents (64%) agree, compared with just three in ten Republicans (31%).
Except for white Christian groups, majorities agree that ICE officers should not be allowed to conceal their identity with masks or use unmarked vehicles during arrests, including 80% of other non-Christians, 74% of Hispanic Catholics, 72% of Black Protestants, 71% of Jewish Americans and unaffiliated Americans, and 67% of Hispanic Protestants. White Christians are the least likely to agree: 48% of white Catholics, 46% of white mainline/non-evangelical Protestants, and 34% of white evangelical Protestants. White evangelical Protestants mostly disagree (62%).
Most Christian nationalism Rejecters (84%) and Skeptics (59%) agree that ICE should not be allowed to conceal their identity, compared with 42% of Sympathizers and 36% of Adherents.

Arresting and Detaining Undocumented Immigrants Without Criminal Record
One-third of Americans (33%) favor arresting and detaining undocumented immigrants who have resided in the United States with no criminal record, compared with 63% who oppose, including one-third who strongly oppose (32%). Most Republicans (61%) favor this policy, compared with just 26% of independents, and one in ten Democrats (12%).
Except for white evangelical Protestants, support for this policy is roughly 40% or less across all other religious groups, including 44% of white Catholics, 43% of white mainline/non-evangelical Protestants, 30% of Black Protestants, and 22% of Jewish Americans, unaffiliated Americans, and Hispanic Protestants. Only 19% of both non-Christians and Hispanic Catholics support this policy, compared with nearly six in ten white evangelical Protestants (57%).
Christian nationalism Adherents (57%) are the most likely to favor arresting and detaining undocumented immigrants without criminal records, followed by 50% of Sympathizers, 37% of Skeptics, and only 9% of Rejecters.
Internment Camps for Undocumented Immigrants
Six in ten Americans (58%) disagree that the federal government should detain immigrants who are in the country illegally in internment camps until they can be deported, while over just one-third agree (37%). Republicans (69%) are far more likely to agree with this policy, compared with either independents (32%) or Democrats (13%). These views have remained stable since March.
Nearly six in ten white evangelical Protestants (59%) agree that undocumented immigrants should be placed in internment camps until they can be deported, compared with half of white Catholics (52%) and white mainline/non-evangelical Protestants (50%). Agreement with this policy drops to roughly one-third among non-Christians (35%), Jewish Americans (35%), and Hispanic Protestants (32%), and roughly one in four Black Protestants (27%), religiously unaffiliated Americans (24%), and 22% of Hispanic Catholics.
Among white Christians, support for detaining undocumented immigrants in internment camps until they can be deported is slightly higher among those who attend religious services weekly (55%) or monthly (58%) than those who attend seldom or never (52%).
Most Christian nationalism Adherents (69%) and Sympathizers (57%) agree that undocumented immigrants should be placed in internment camps, compared with 38% of Skeptics and just 13% of Rejecters.
Deportation to Foreign Prisons Without Due Process
About two-thirds of Americans (65%) oppose the U.S. government deporting undocumented immigrants to foreign prisons in El Salvador, Rwanda, or Libya without allowing them to challenge their deportation in court, including 39% who strongly oppose. One-third of Americans favor this policy (32%). Partisan views differ: 62% of Republicans favor this policy, but have become less likely to do so since the question was first asked in last May (from 78%). Support among independents has also declined, from 35% to 25%, while Democrats’ support remains unchanged (10%).
While more than half of white evangelical Protestants (52%) support deporting undocumented immigrants to foreign prisons without due process, support is much lower among white Catholics (44%), white mainline/non-evangelical Protestants (41%), Hispanic Protestants (29%), Jewish Americans (26%), non-Christians (23%), Hispanic Catholics (22%), religiously unaffiliated Americans (21%), and Black Protestants (20%).
Among white Christians, support for deporting undocumented immigrants to foreign prisons without due process is slightly higher among those who attend religious services weekly (46%) or monthly (53%) than those who attend seldom or never (43%).
Nearly six in ten Americans who qualify as Christian nationalism Adherents (57%) and half of Sympathizers (50%) favor deporting undocumented immigrants to foreign prisons without due process, compared with one-third of Skeptics (33%) and just 10% of Rejecters.
Stripping Citizenship and Deporting If Deemed a Threat to the Country
Most Americans (57%) oppose stripping U.S. citizens of their citizenship and deporting them if they are determined to be a threat to the country, including 31% who strongly oppose; 39% favor this policy. Republicans (55%) are more likely than independents (33%) and Democrats (28%) to favor this policy.
Half of Hispanic Catholics (50%) and white evangelical Protestants (48%) favor stripping citizenship and deporting those deemed a threat to the country, followed by 45% of white Catholics, 43% of white mainline/non-evangelical Protestants, 38% of Hispanic Protestants, 36% of Black Protestants, 35% of Jewish American, 31% of other non-Christians, and 30% of religiously unaffiliated Americans.
About six in ten Americans who qualify as Christian nationalism Adherents (63%) and 54% of Sympathizers favor stripping citizenship and deporting those deemed a threat to the country, compared with 40% of Skeptics and just 19% of Rejecters.
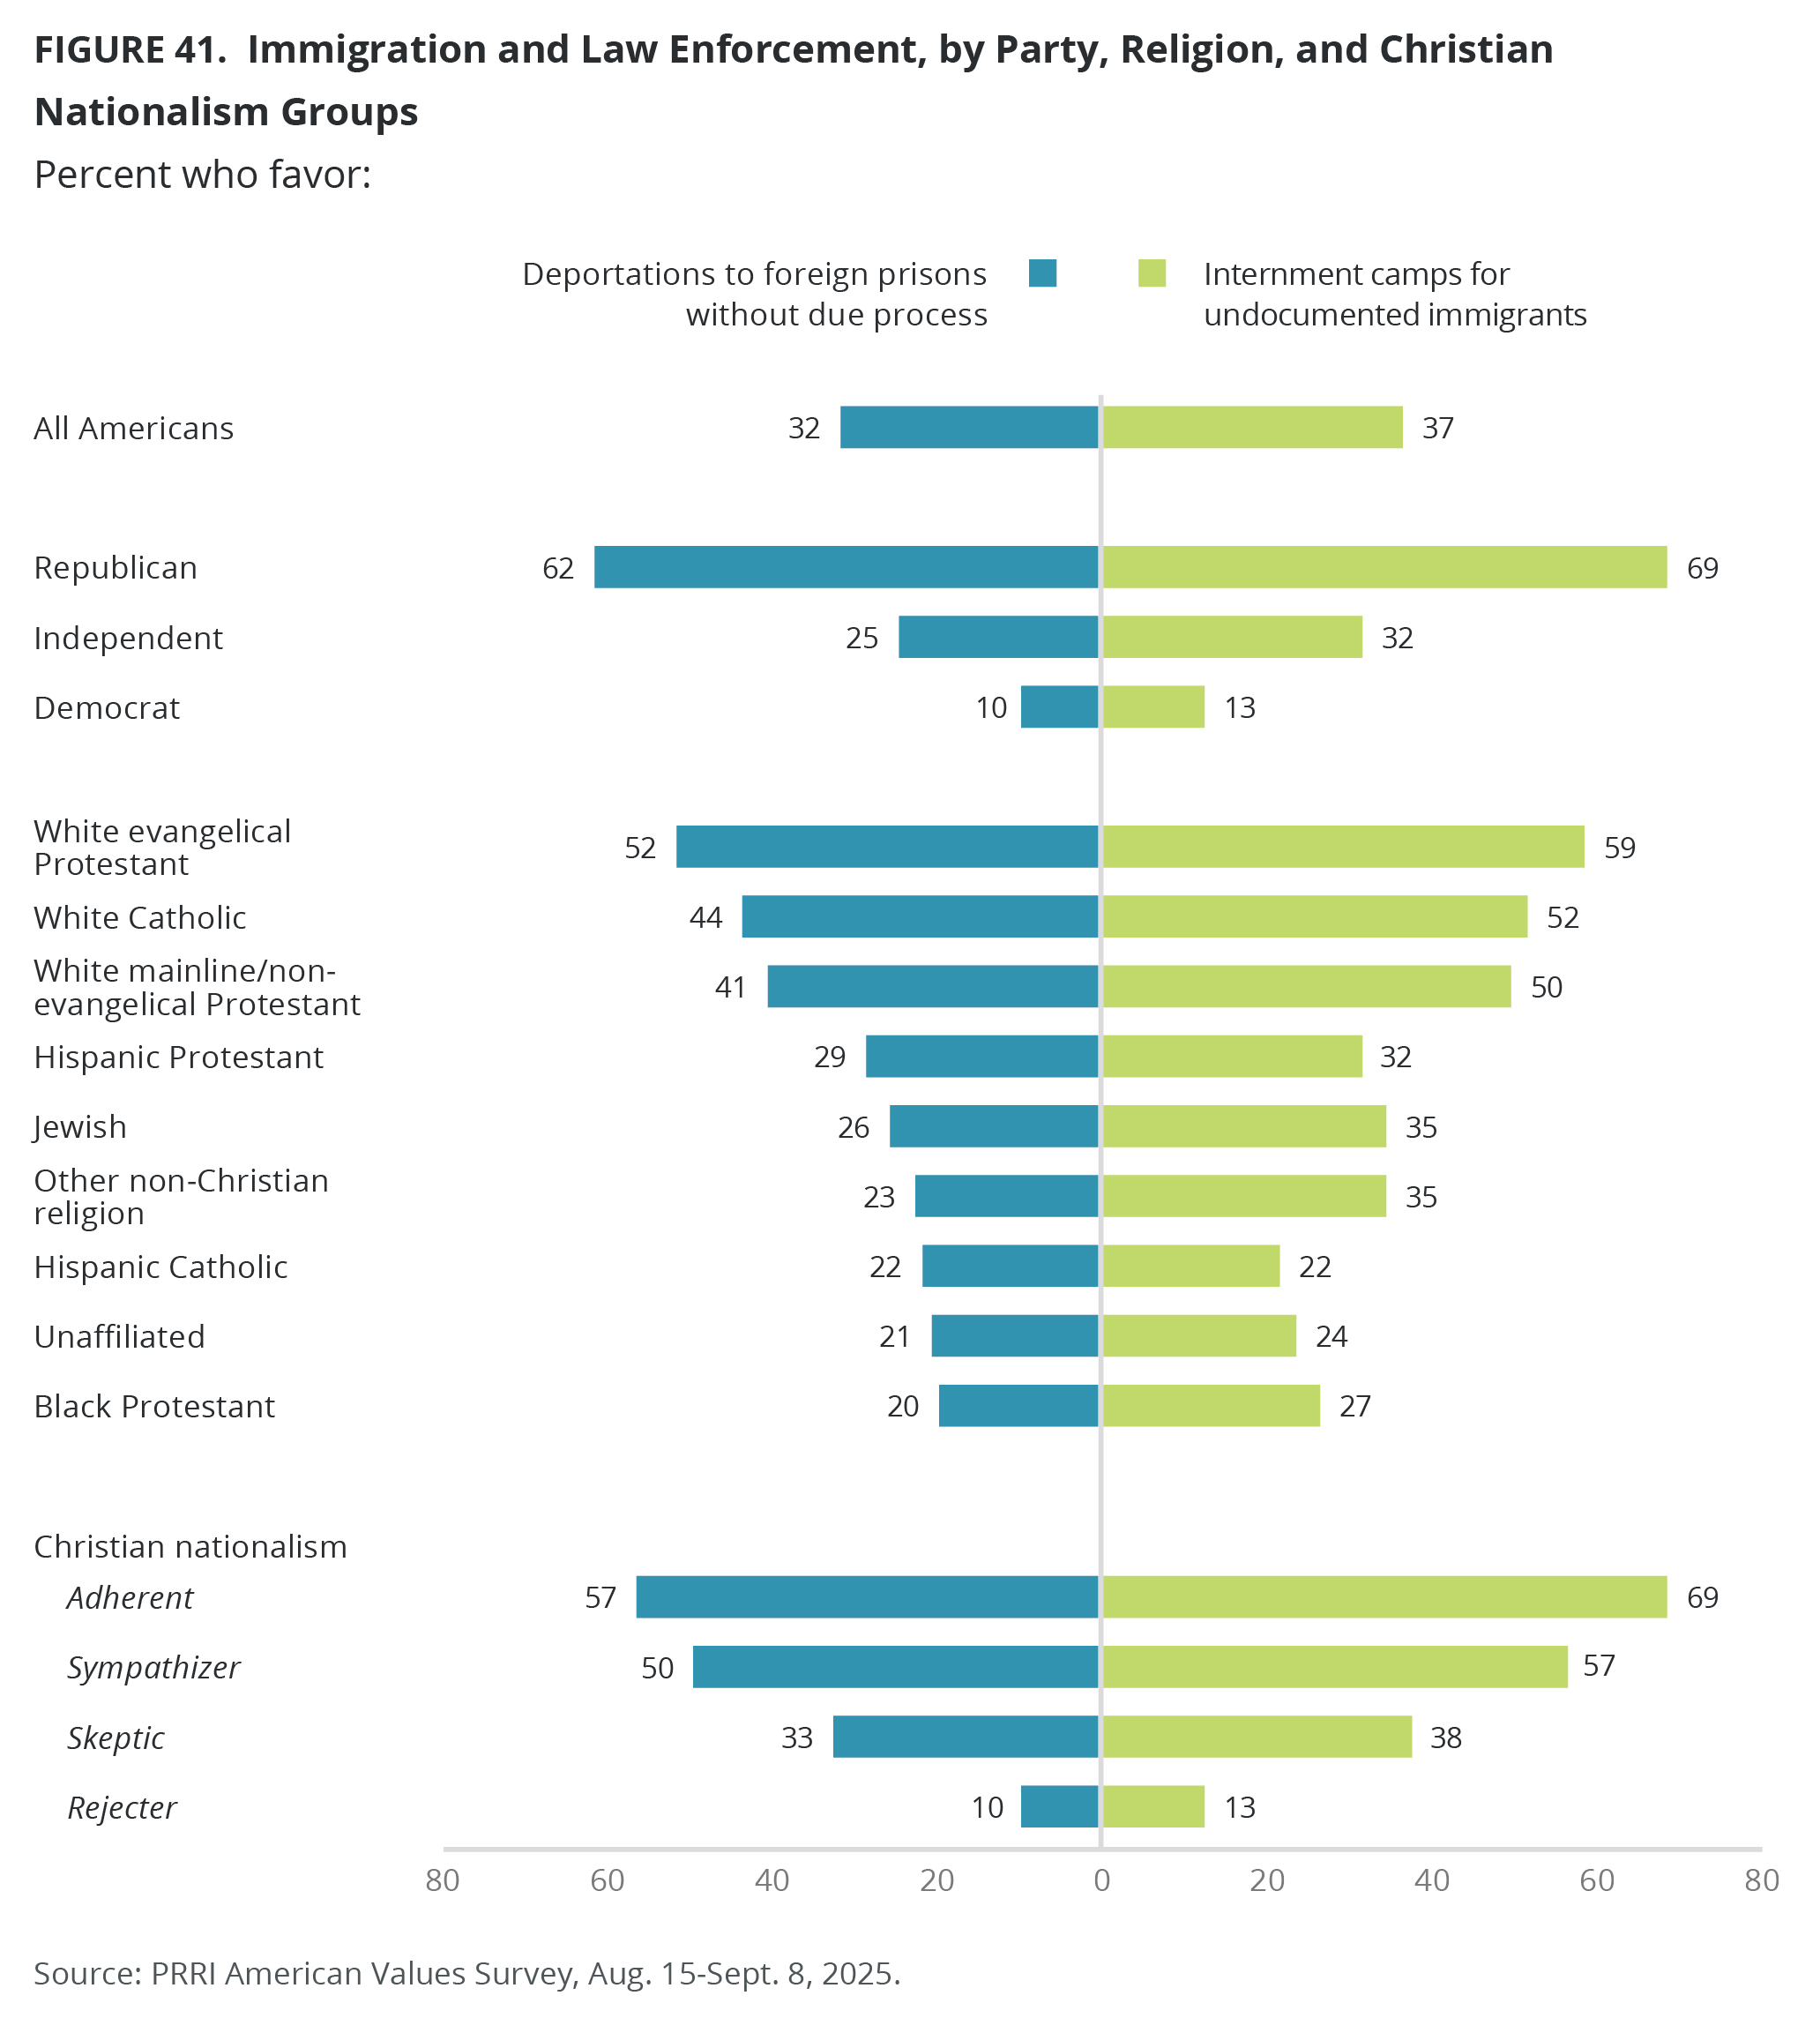
Gender and Pronatalism
Gender Dynamics
Society Is Too Soft and Feminine
More than four in ten Americans (42%) agree that society as a whole has become too soft and feminine, while a majority disagree (54%). Agreement has slightly increased from 38% in 2011, when the question was first asked. The partisan divide has widened sharply, increasing from 23 points in 2011 to 47 points today. About two-thirds of Republicans (67%) now agree that society has become too soft and feminine, up from 53% in 2011; today, just 20% of Democrats agree, down from 30% in 2011. Independents have remained constant over time (37% in 2011 vs. 39% today).
Men (48%) are more likely than women (37%) to agree. White men without a college degree are more likely than white women without a college degree to agree (56% vs. 45%). The same pattern holds among college graduates (42% vs. 28%).
Six in ten white evangelical Protestants (60%) agree that society has become too soft and feminine, compared with roughly half of white Catholics (51%) and Hispanic Protestants (50%). Fewer than half of other religious groups agree that society has become too soft and feminine, including 46% of white mainline/non-evangelical Protestants, 42% of Hispanic Catholics, 38% of Black Protestants, 33% of other non-Christians, 30% of Jewish Americans, and 29% of unaffiliated Americans.
Nearly three in four Christian nationalism Adherents (73%) and 61% of Sympathizers agree that society as a whole has become too soft and feminine, compared with 44% of Christian nationalism Skeptics, and just 17% of Rejecters.
Young Men Are Struggling More Than Young Women to Find Their Place in Society
More than four in ten Americans (42%) agree that “Today, young men are struggling more than young women to find their place in society,” while 53% disagree. Republicans (48%) are more likely than independents (44%) and Democrats (37%) to agree with this statement.
Men (50%) are 15 percentage points more likely than women (35%) to agree that young men are struggling more than young women to find their place in society. White men with a college degree are more likely than white men without a college degree to agree (54% vs. 49%), while there are no differences among white women by education (35% vs. 33%).
The gender divide among Generation Z, those Americans born after 1996, is even wider: 53% of Gen Z men agree that young men are struggling more than young women, compared with 32% of Gen Z women.
Women’s Gains at the Expense of Men
Around two in ten Americans (21%) agree that the gains women have made in recent years have come at the expense of men, while 75% disagree. This number has increased slightly from 17% in 2024. Nearly three in ten Republicans (28%), 21% of independents, and 12% of Democrats agree.
Men (25%) are more likely than women (16%) to agree. White men without a college degree are more likely than white women without a college degree to agree (26% vs. 19%). The same pattern holds among college graduates (22% vs. 11%).

Pronatalism
Policies That Encourage More Americans to Have Children
A majority of Americans oppose policies that encourage more Americans to have children (54%), compared with 41% who favor them. PRRI conducted a question-wording experiment on this item, asking half of the sample about these policies as described above and asking the other half the same question but specifying “policies that encourage only certain Americans to have children to help preserve the country’s current demographic makeup.” An overwhelming majority of Americans oppose this policy (86%), with just 10% in favor. Very small percentages across party, religion, race, gender, education, generation, and Christian nationalism views favor policies that encourage only certain Americans to have children, while opinions on the broader version of this question are more mixed.
About half of Republicans (49%) and independents (45%), as well as 31% of Democrats, favor policies that encourage more Americans to have children.
Men are about 20 percentage points more likely than women to agree with policies that encourage more Americans to have children (50% vs. 31%). Across partisan groups, men are more likely than women to agree: Republicans (59% men vs. 39% women), independents (52% vs. 36%), and Democrats (38% vs. 25%).
The gender divide among Generation Z is the most pronounced across generations: 51% of Gen Z men, compared with 28% of Gen Z women, support pronatalist policies.
[1] All other institutions were not asked in 2015.
[2] For more information on how the Right-Wing Authoritarianism Scale was created, see our September 2024 report “One Leader Under God: The Connection Between Authoritarianism and Christian Nationalism in America.”
[3] The ANES survey question and response options are as follows: “During this year the United States has been celebrating its 200th birthday. Does the thought of America’s 200-year history make you feel very proud, somewhat proud, not very proud, or doesn’t really make much difference to you.”
APPENDIX A. Survey Methodology
The survey was designed and conducted by PRRI. The survey was made possible through the generous support of the Carnegie Corporation of New York, with additional support from the Ford Foundation, and the Unitarian Universalist Veatch Program at Shelter Rock. The survey was conducted among a representative sample of 5,543 adults (age 18 and up) living in all 50 states in the United States, who are part of Ipsos’s KnowledgePanel, and an additional 412 who were recruited by Ipsos using opt-in survey panels to increase the sample sizes in smaller states. Interviews were conducted online between August 15-September 8, 2025.
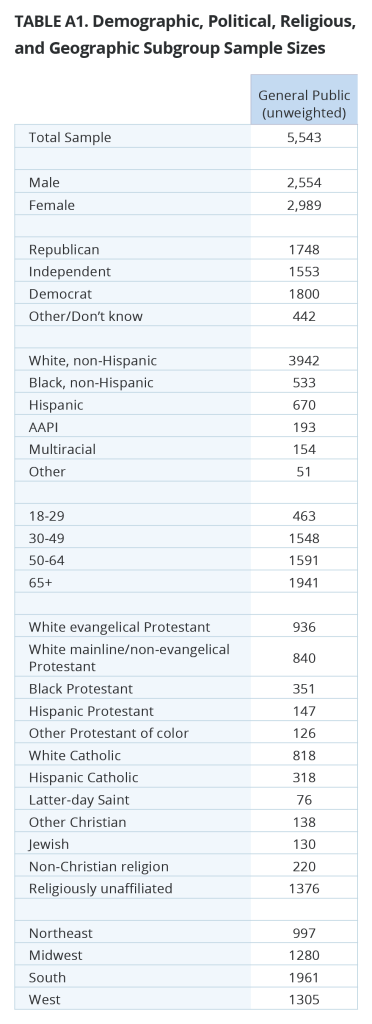
Respondents are recruited to the KnowledgePanel using an address-based sampling methodology from the Delivery Sequence File of the USPS – a database with full coverage of all delivery addresses in the U.S. As such, it covers all households regardless of their phone status, providing a representative online sample. Unlike opt-in panels, households are not permitted to “self-select” into the panel, and are generally limited to how many surveys they can take within a given time period.
The initial sample drawn from the KnowledgePanel was adjusted using pre-stratification weights so that it approximates the adult U.S. population. Next, a probability proportional to size (PPS) sampling scheme was used to select a representative sample.
To reduce the effects of any non-response bias, a post-stratification adjustment was applied. The needed benchmarks were obtained from the latest March 2024 supplement of the Current Population Survey (CPS), except language proficiency, which is not available from CPS, and was obtained from the 2023 American Community Survey (ACS). Additionally, the 2024 vote choice benchmark was obtained from the Associated Press Tabulation of Certified Results. The post-stratification weight rebalanced the sample based on the following benchmarks: gender by age, race/ethnicity, education, income, language proficiency, Census region by metropolitan status, and 2024 presidential vote choice. Additionally, we included individual states (50 states plus D.C.) to account for the oversampling of some states.
The margin of error for the national survey is +/- 1.79 percentage points at the 95% level of confidence, including the design effect for the survey of 1.84. In addition to sampling error, surveys may also be subject to error or bias due to question wording, context, and order effects. Additional details about the KnowledgePanel can be found on the Ipsos website: https://www.ipsos.com/en-us/solution/knowledgepanel.


