Executive Summary
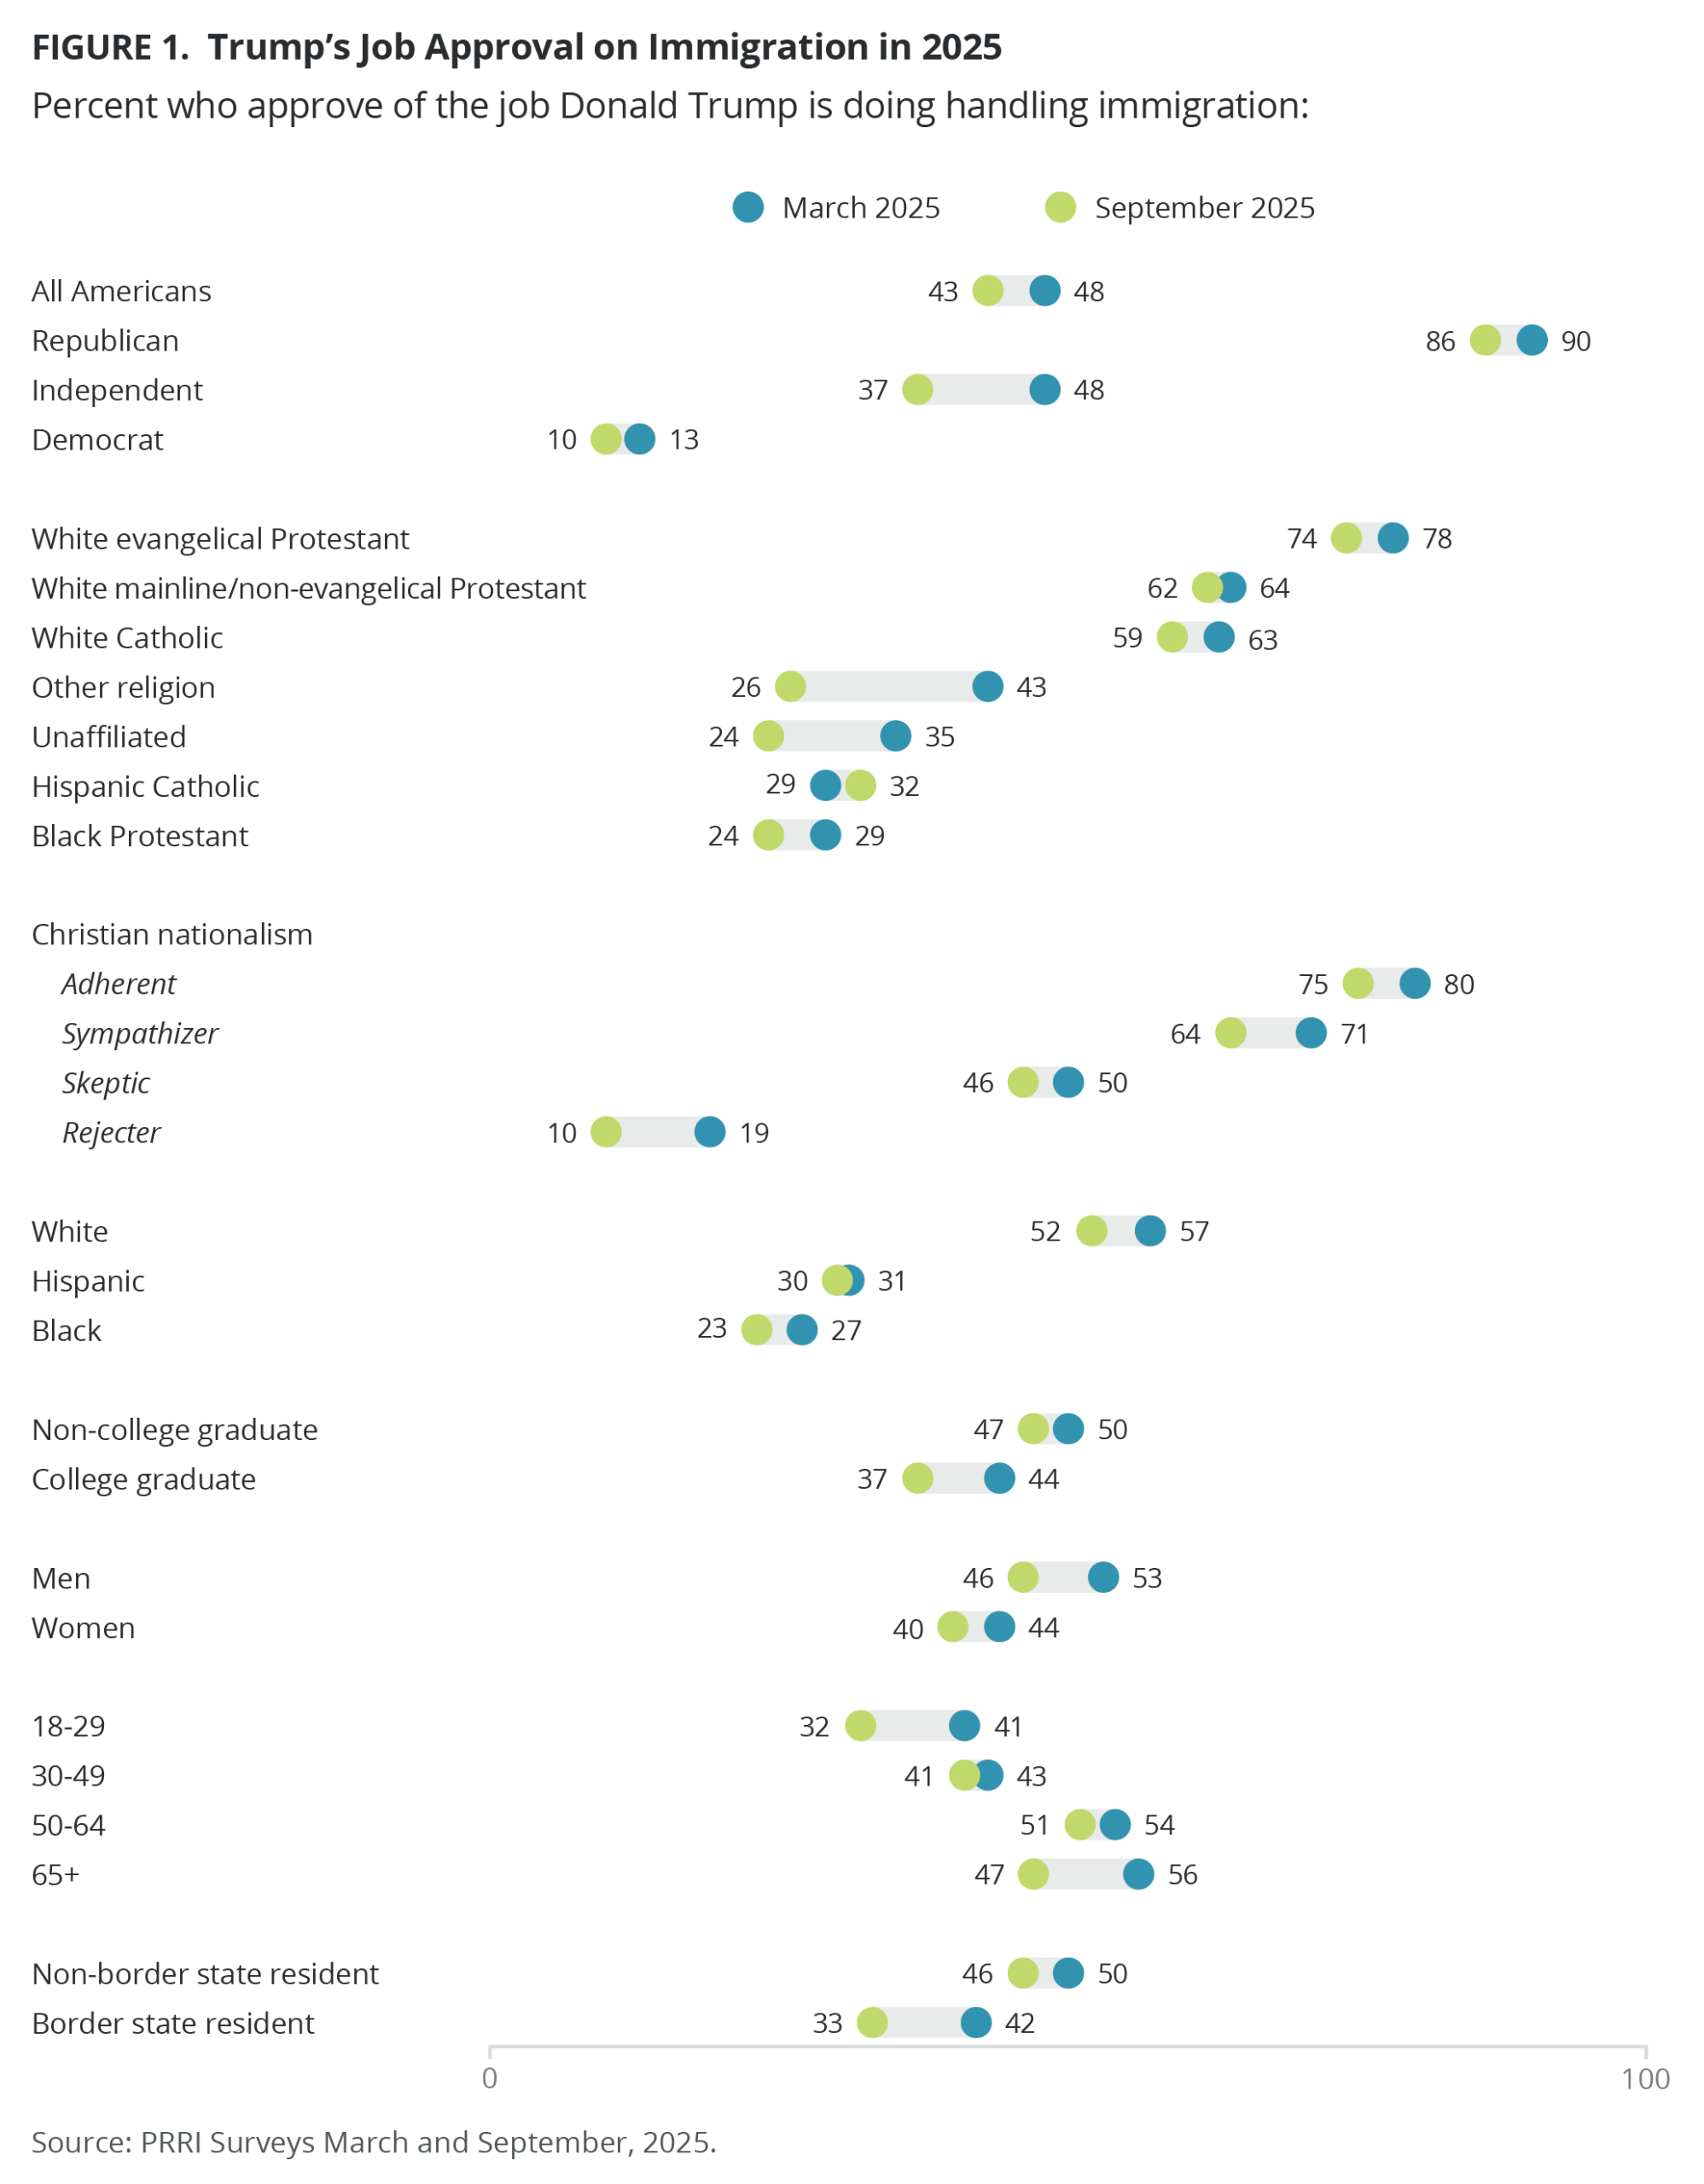
Support for President Donald Trump’s handling of immigration has dropped 5 points among Americans since March 2025.
- Over four in ten Americans support Trump’s handling of immigration (43%), a decrease of 5 percentage points since March 2025. Support among Republicans has dipped from 90% to 86%. The steepest decline in support for Trump’s immigration agenda in the past few months — 11 points — comes from independents.
- Support has also declined by nearly 10 points among the youngest American adults (aged 18-29, from 41% to 32%) and seniors (65+, from 56% to 47%).
- Among Americans living in border states, approval of Trump’s handling of immigration has dropped from 42% to 33% since March.
Increasing numbers of Americans in the past year support both a pathway to citizenship and allowing “Dreamers” to stay and gain legal status.
- Most Americans (60%) say that immigrants living in the United States illegally should be given a way to become citizens, provided they meet certain requirements, up from 56% last October.
- Among Republicans, support for a pathway to citizenship increased from 36% in 2024 to 40%; among Democrats, 77% to 82%. The increase in support for a path to citizenship was larger for independents, from 55% in 2024 to 61% this year.
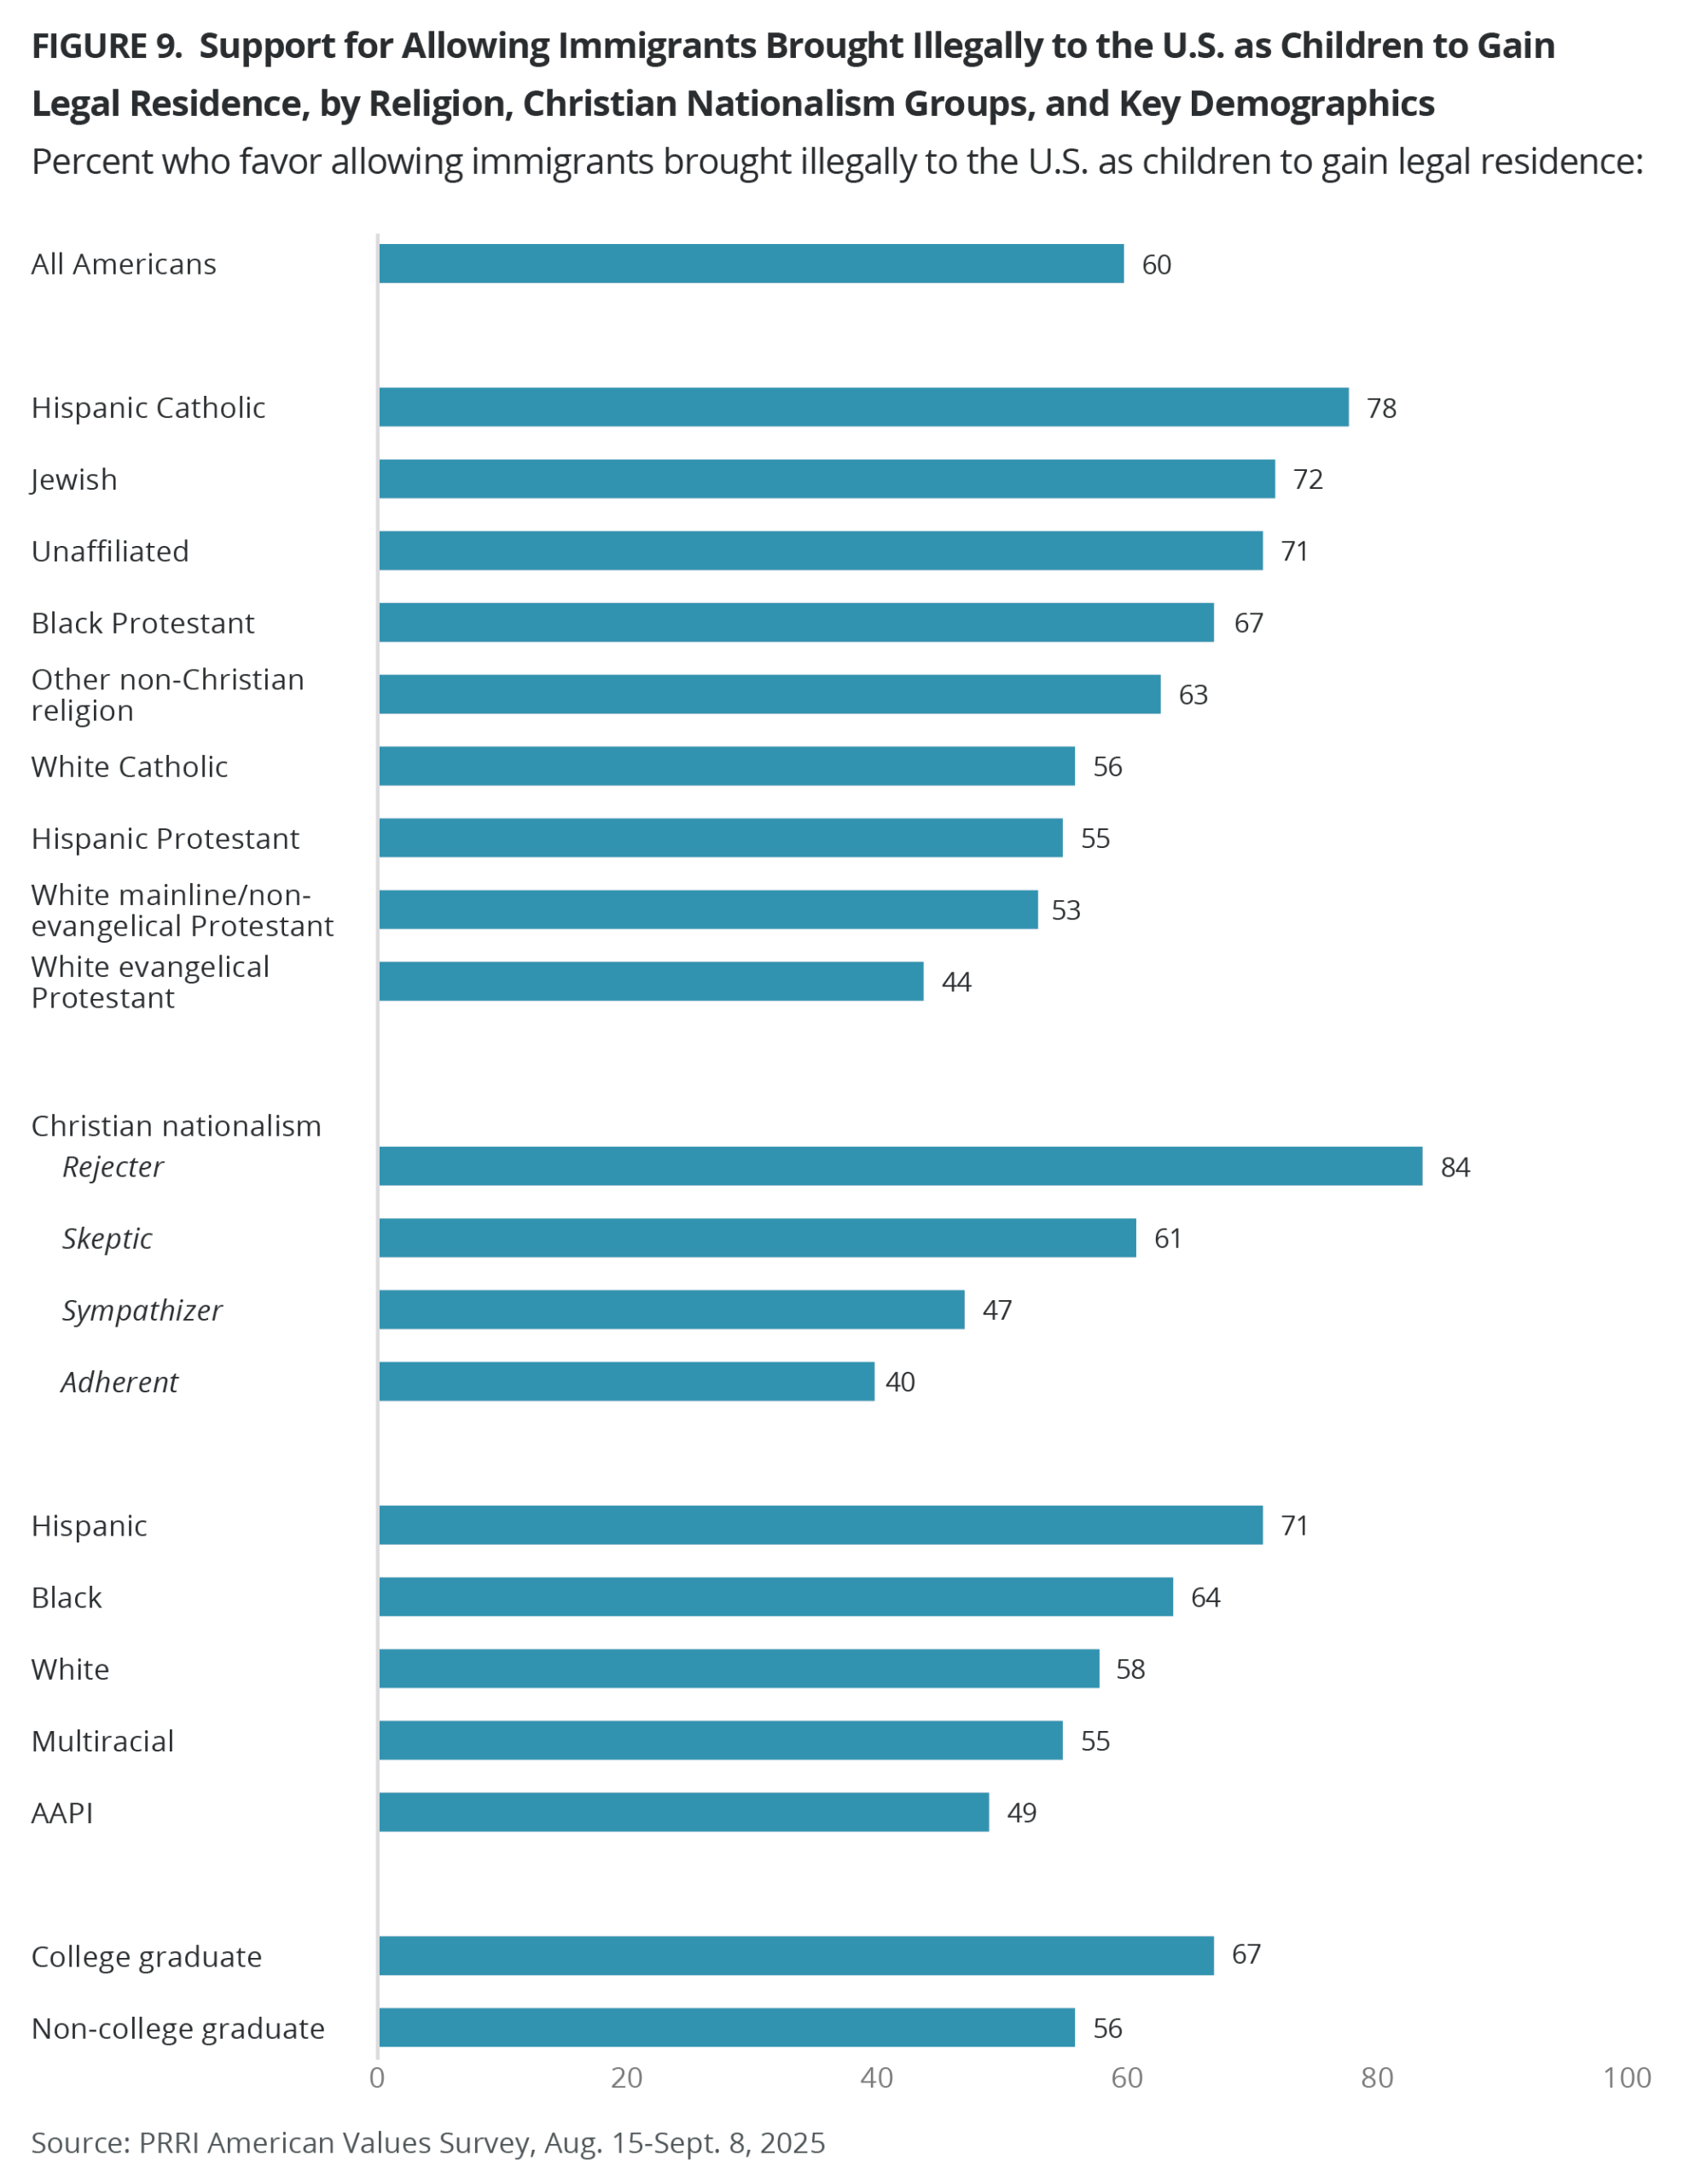
- Support for allowing children brought illegally to the U.S. to gain legal resident status (known as DACA) increased from 52% in 2024 to 60% in 2025; support increased among Republicans, independents, and Democrats.
Partisan divides remain stark on most of Trump’s immigration policies; yet such polarization is asymmetric, as independents’ views are more closely aligned with Democrats.
- Republicans and Democrats differ widely in their support for Trump’s immigration policies, ranging from whether undocumented immigrants should be arrested and detained if they have no criminal record, be detained in internment camps or deported to foreign prisons without due process, or whether U.S. Immigration and Customs Enforcement (ICE) officers should be allowed to conceal their identities with masks or use unmarked vehicles.
- Independents, while not as strongly opposed to many of these policies undertaken or proposed by the Trump administration as Democrats, are still broadly opposed to such measures.
Religion shapes views on immigration policies, with white Christians being more supportive of most of Trump’s immigration agenda than Christians of color, members of minority faith traditions, and the religiously unaffiliated.
- White evangelical Protestants hold the most consistently conservative positions on immigration policies: just 39% agree that immigrants, regardless of legal status, should have basic rights and protections, and 34% agree that ICE officers should not be allowed to conceal their identities; 57% agree that undocumented immigrants who have resided in the U.S. with no criminal record should be arrested and detained.
- While not as supportive of Trump’s immigration agenda as white evangelical Protestants, white Catholics and mainline/non-evangelical Protestants are consistently more supportive than other religious Americans and the religiously unaffiliated.
- Hispanic Protestants’ views on Trump’s more restrictive immigration policies are far more aligned with Hispanic Catholics than white Christians.
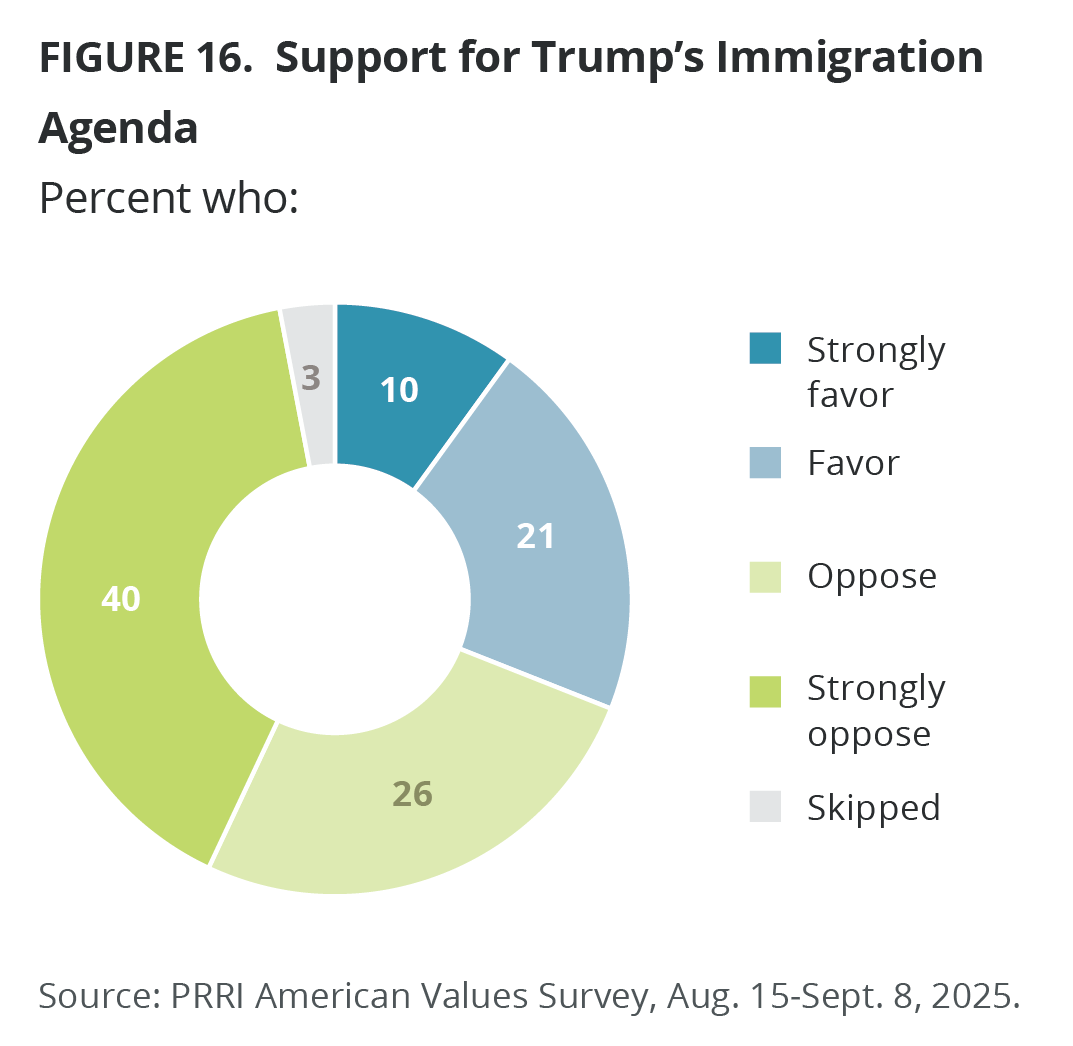
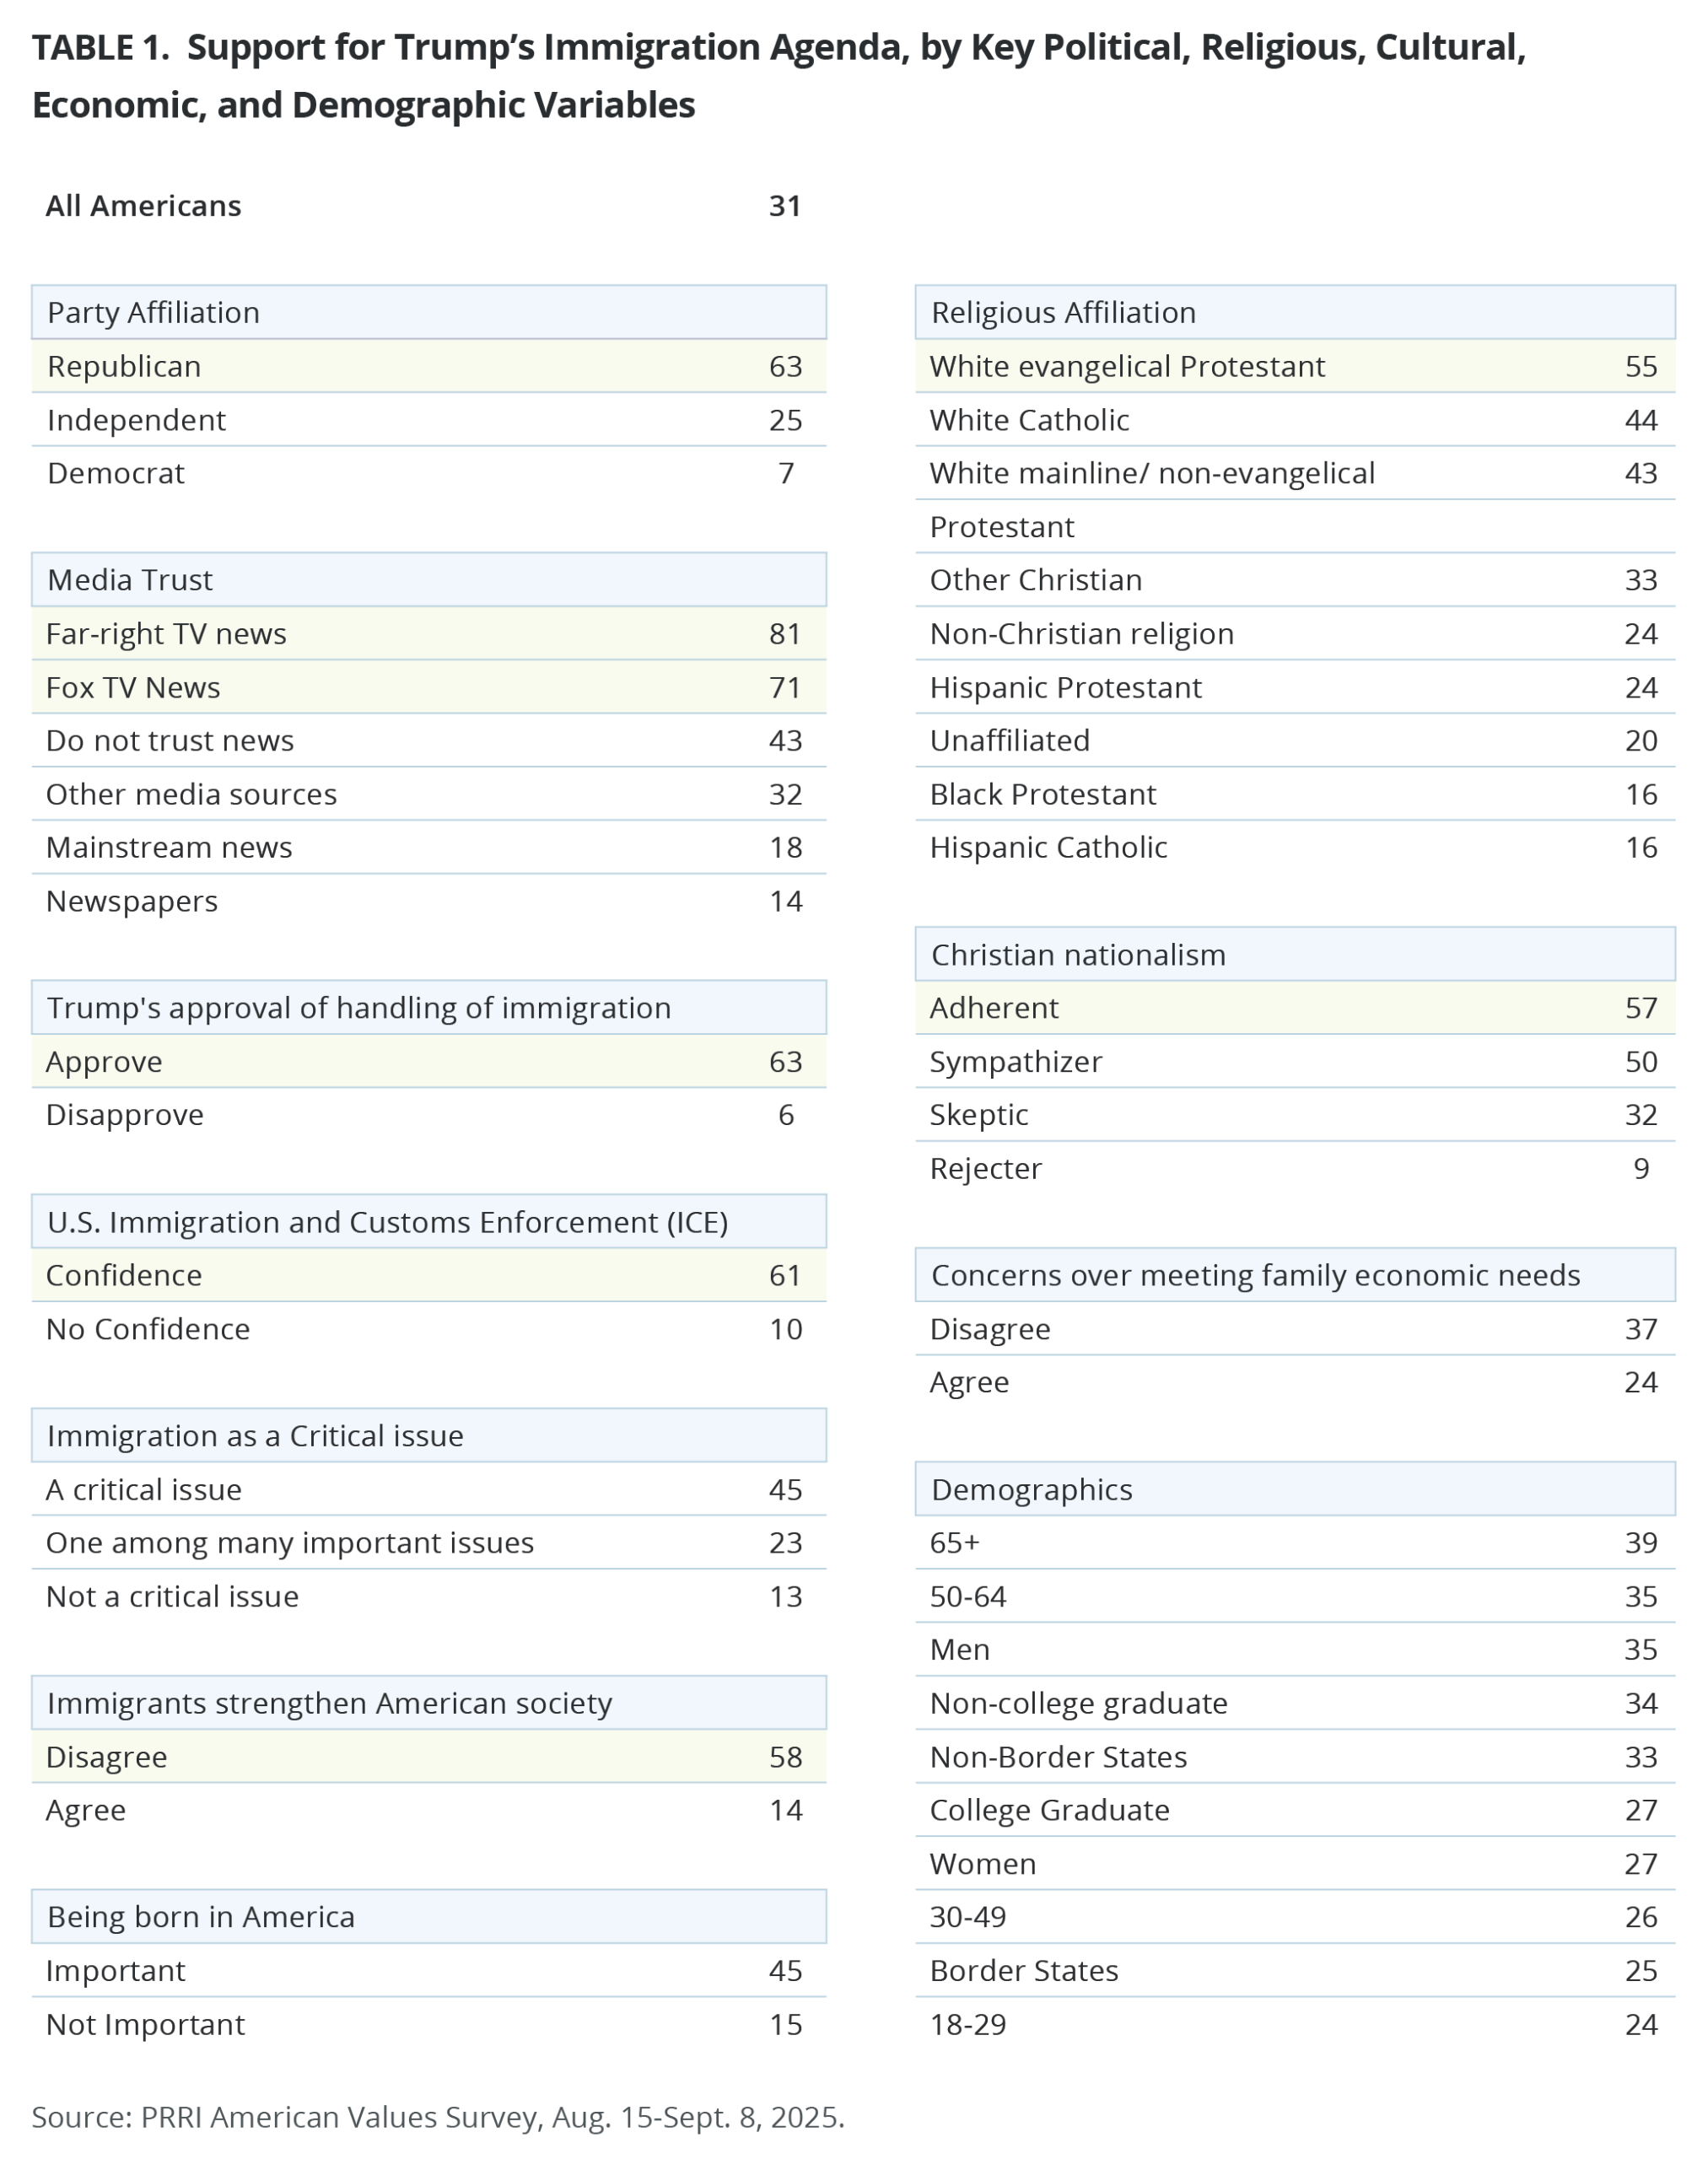
Just three in ten Americans support Trump’s immigration agenda, according to PRRI’s newly developed immigration policy scale.
- PRRI developed a comprehensive scale combining responses to eight questions measuring support for eight of Trump’s immigration measures.
- Among those, three in ten favor Trump’s agenda, including one in ten Americans who strongly favor it. Two-thirds of Americans oppose Trump’s immigration agenda, including four in ten Americans who strongly oppose it.
- Americans who most trust far-right news (81%) and Fox News (71%), Republicans (63%), Christian nationalism Adherents (57%), and white evangelical Protestants (55%) are the most likely to strongly favor or favor Trump’s immigration agenda.
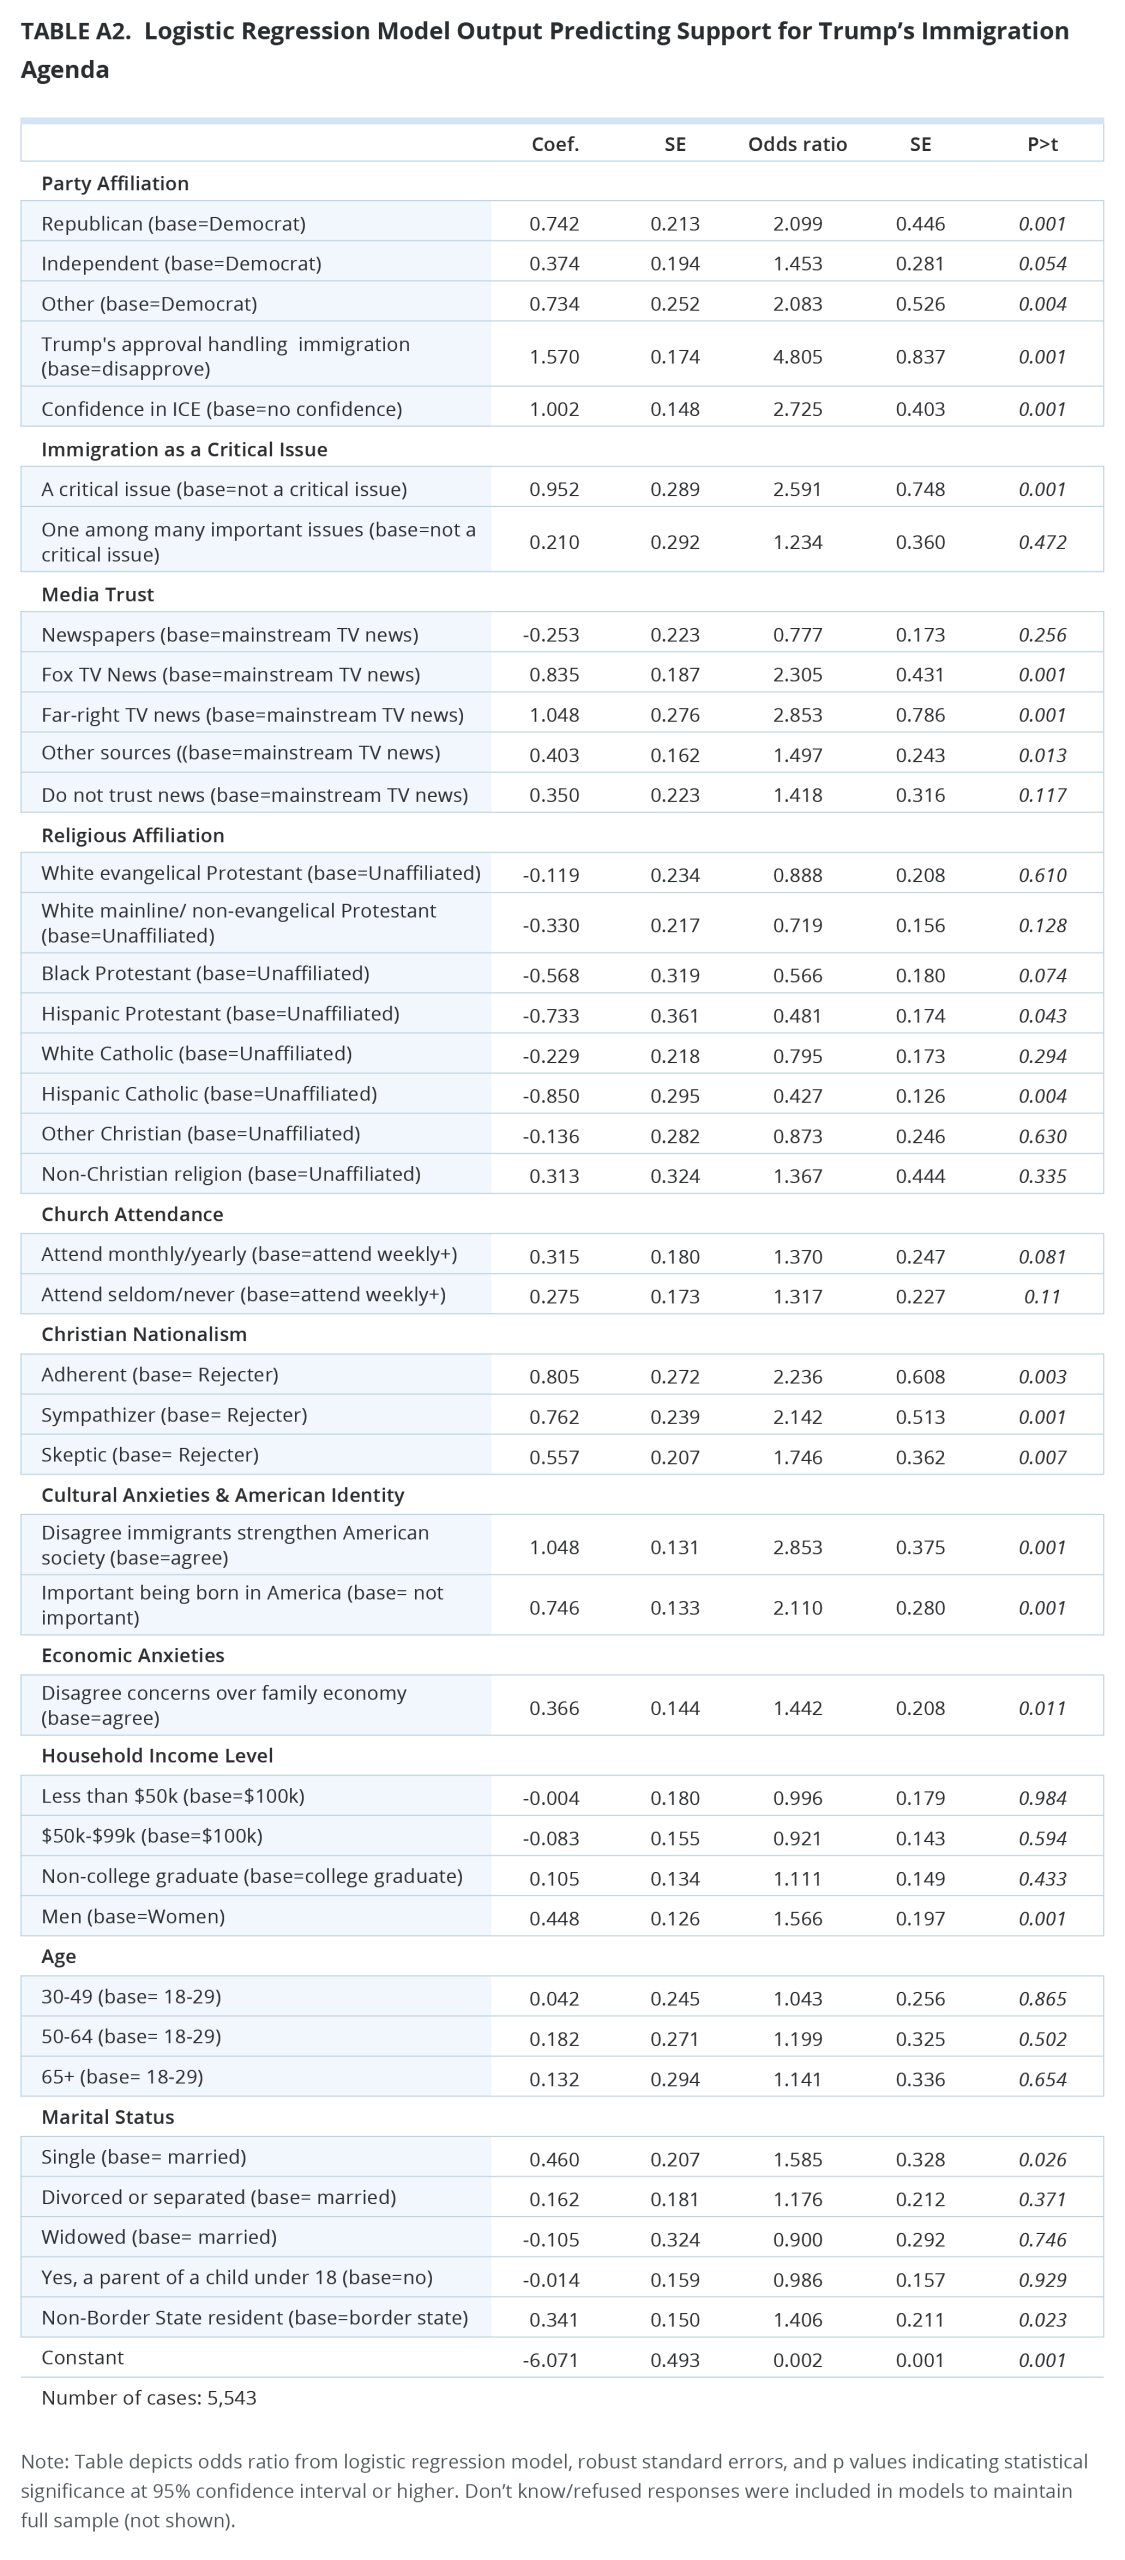
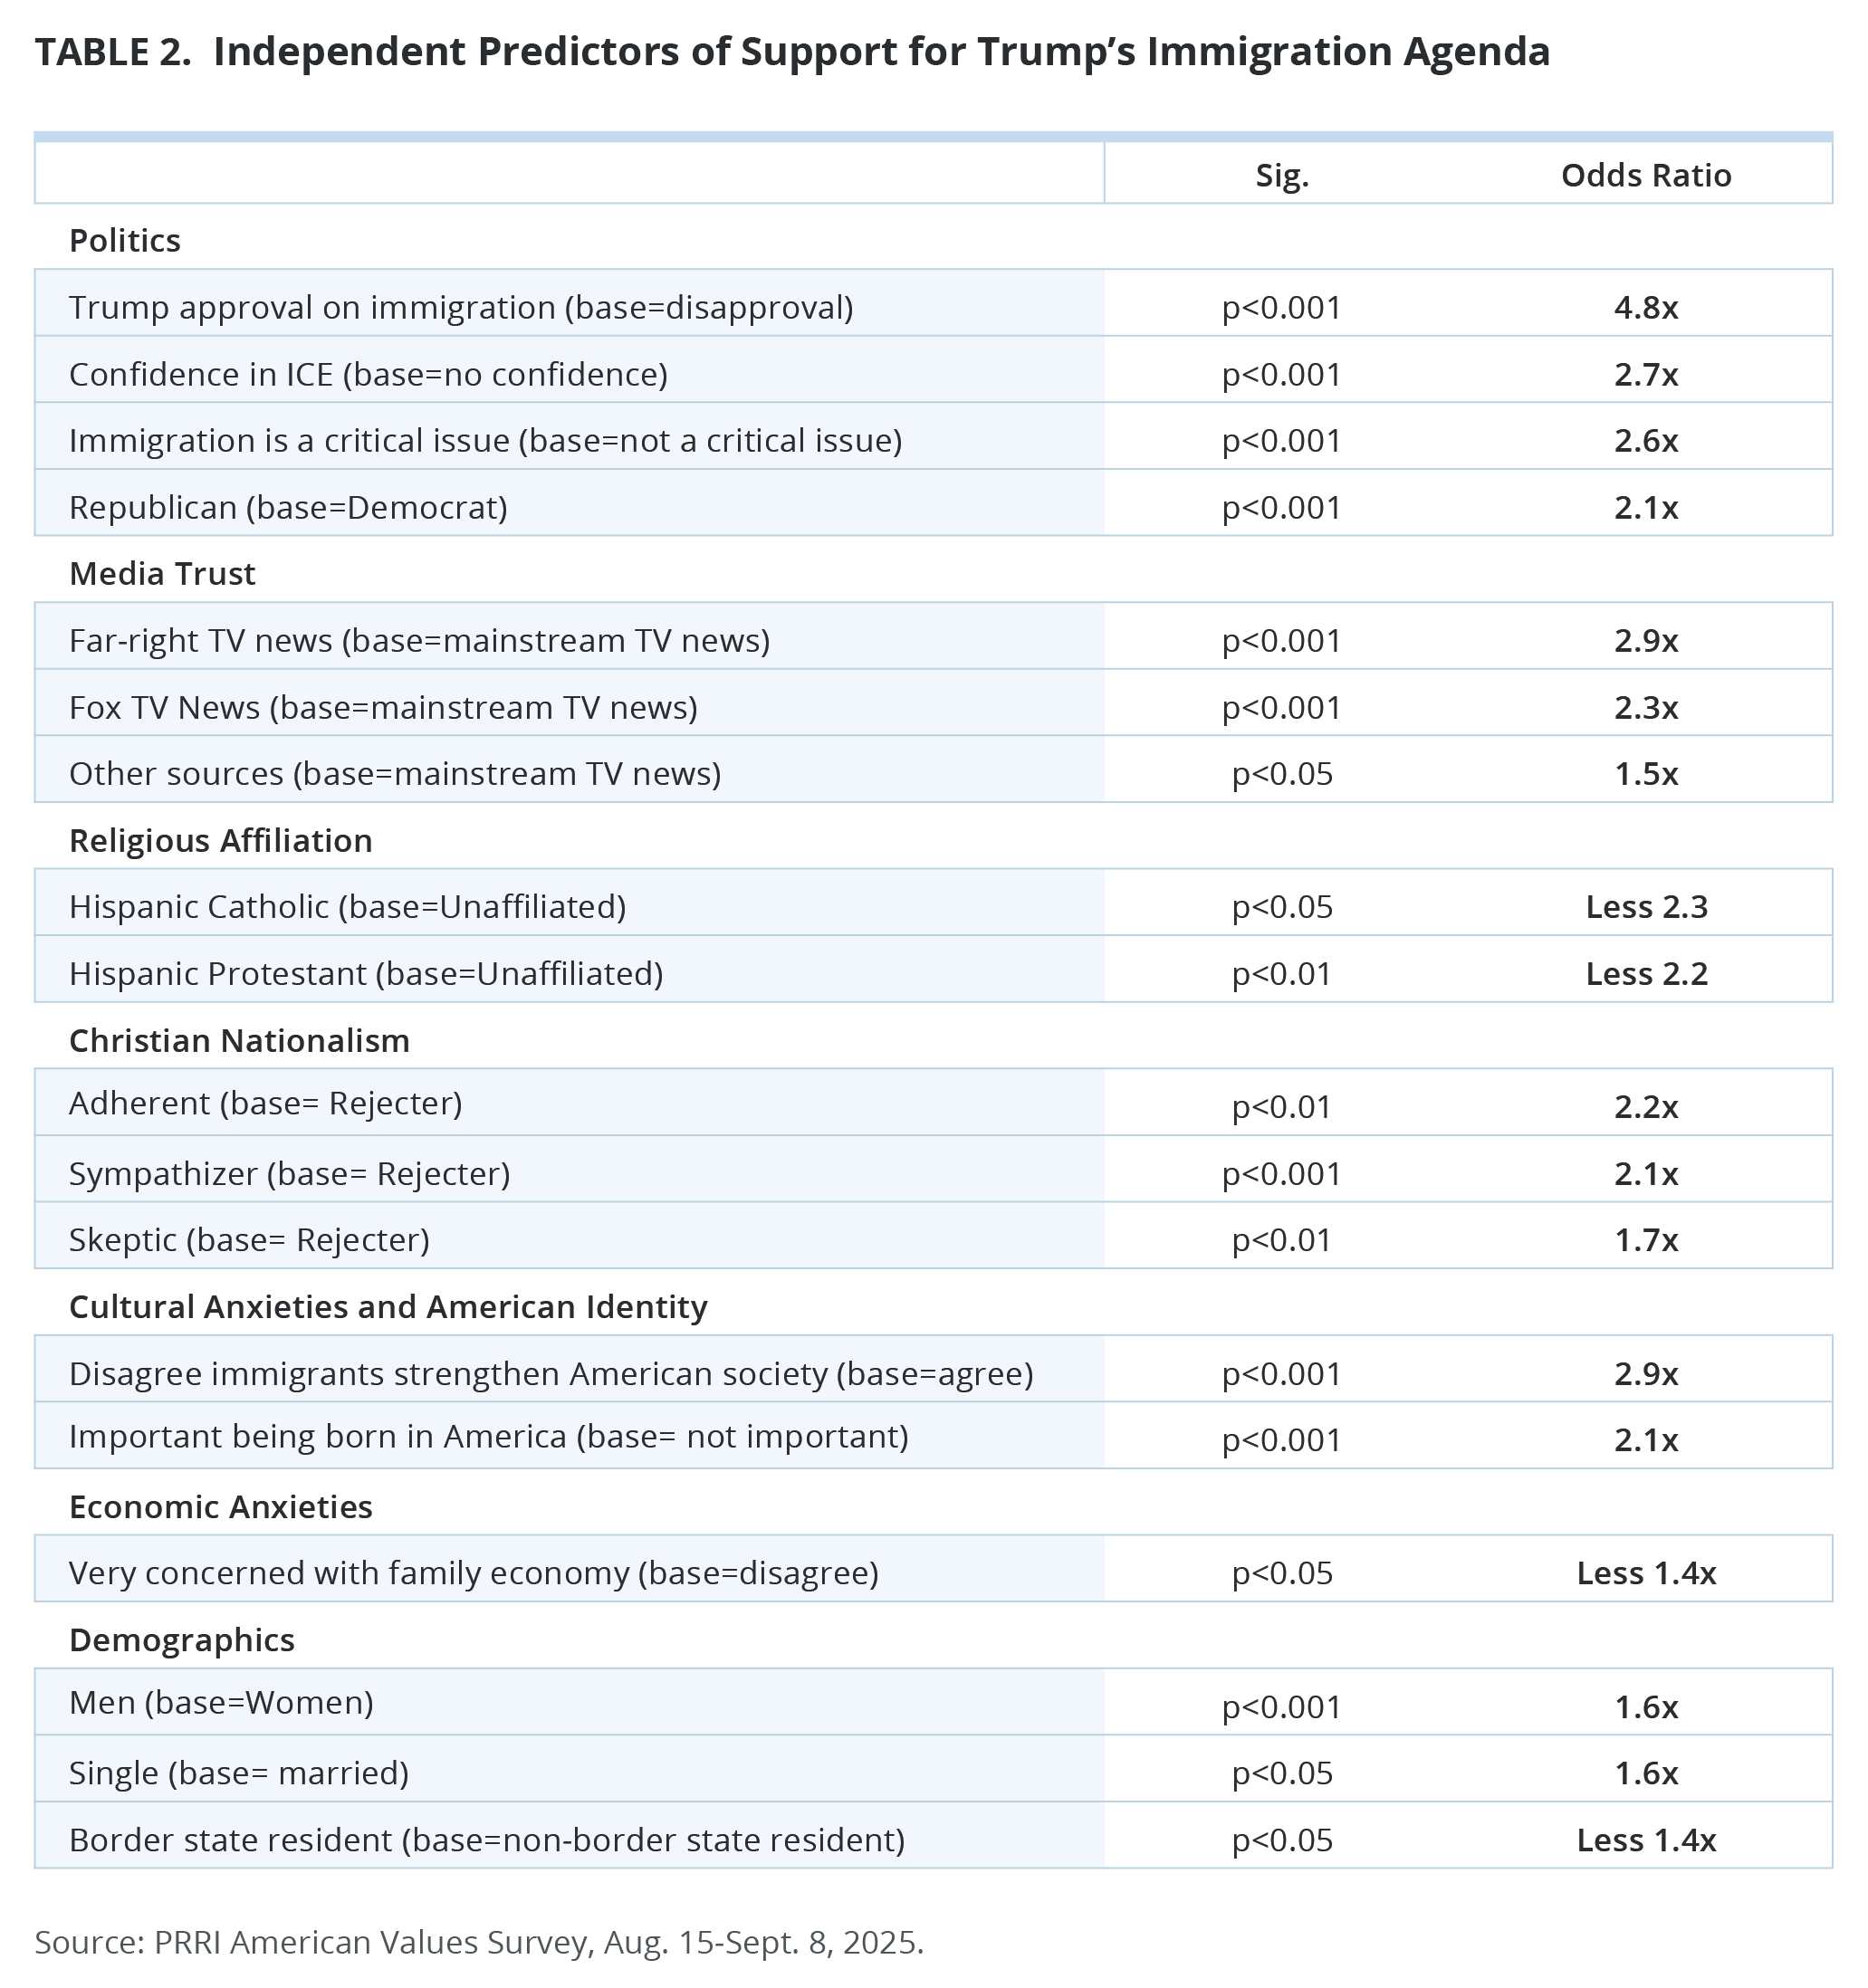
Multivariate analysis shows which factors are best able to predict support for, or opposition to, Trump’s immigration agenda.
- Republicans, those with confidence in ICE, and those who view immigration as a critical issue are each at least twice as likely as their counterparts (Democrats, those without confidence in ICE, and those who do not see immigration as critical) to support Trump’s immigration agenda.
- Compared with religiously unaffiliated Americans, Hispanic Catholics and Hispanic Protestants are less likely to support Trump’s immigration policies once controlling for other factors.
- Christian nationalism Adherents, Sympathizers, and Skeptics are each twice as likely as Rejecters to support Trump’s immigration agenda.
- Americans who disagree that immigrants strengthen American society are about three times as likely to support Trump’s immigration policies as those who agree that immigrants strengthen American society. Similarly, believing that being born in America is important to being truly American is a strong predictor of support for Trump’s immigration agenda.
- Americans who are very concerned that their families will not be able to pay for housing and basic living expenses over the next year are less likely to support Trump’s immigration agenda.
Introduction
In his first term, President Donald Trump’s administration put in place a series of measures to curb immigration, including a travel ban, deep cuts to refugee admissions, and the 2018 “zero-tolerance” policy that forced family separations. Even though courts pushed back on parts of this agenda, the second Trump administration has intensified its efforts to crack down on immigration, including a push to greatly expand the detention and deportation of undocumented immigrants currently living in the United States. Spending on immigration enforcement has nearly tripled from last year’s budget and involves the unprecedented use of federal deployments to cities, such as the National Guard, despite U.S. laws that broadly restrict military involvement in domestic policing. Moreover, the Trump administration is seeking to curtail legal immigration rates. Trump also issued an executive order on his first day in office that seeks to end the constitutionally guaranteed right to birthright citizenship.
This report considers how receptive Americans are to the second Trump administration’s handling of immigration and their support for numerous immigration-related policies, including arresting and detaining undocumented immigrants with no criminal record; detaining immigrants in internment camps; deporting undocumented immigrants to foreign prisons without due process; allowing ICE officers to conceal their identities; opposing birthright citizenship and a pathway to citizenship for undocumented immigrants; and opposing legal status for those brought to the U.S. as children or the right to challenge deportations before a judge.
Views on How the U.S. is Handling Immigration
Trump’s Job Approval on Immigration
Today, 43% of Americans approve of the job Trump is doing handling immigration, a decrease of 5 percentage points since March 2025. Partisanship strongly influences approval of Trump’s job in handling immigration, although Republican approval has dropped 4 points since March, from 90% to 86%. The steepest decline in approval in the past few months — 11 points — comes from independents. Few Democrats approve of Trump’s handling of immigration.
White Christian groups are the most likely to approve of the job Trump is doing handling immigration, including nearly three in four white evangelical Protestants. A majority of white mainline/non-evangelical Protestants (62%) and white Catholics (59%) also approve of Trump’s job on immigration. Few other religious groups, including Christians of color, non-Christians, and the religiously unaffiliated, approve of Trump’s performance in this area. Unaffiliated Americans are 11 percentage points less likely to approve of Trump’s handling of immigration today, compared with March 2025.[1]
Most Christian nationalism Adherents (75%) and Sympathizers (64%) are more likely to approve of Trump’s handling of immigration, compared with far fewer Skeptics (46%) and Rejecters (10%). Approval of Trump’s handling of immigration decreased since March 2025 among all these groups, with the biggest decline among Rejecters (down 9 points) and Sympathizers (down 7 points).[2]
A slim majority of white Americans agree with Trump’s handling of immigration, compared with roughly three in ten Hispanic Americans and about one in four Black Americans. Approval of Trump’s handling of immigration has declined among white Americans since March 2025, while the views of Americans of color have remained stable.
Education and gender also shape views on Trump’s handling of immigration, as Americans without a college degree and men show more support for Trump’s handling of immigration than college-educated Americans and women, respectively. Older Americans are also far more likely to support Trump’s job performance on immigration, although approval has dropped by 9 percentage points among young Americans ages 18-29 and Americans 65 and over since March 2025.
Trump’s performance among citizens in the border states, specifically Americans living in Arizona, California, New Mexico, and Texas, is significantly lower than those living elsewhere; these levels have decreased significantly since March 2025.
Views on the Federal Government’s Handling of Undocumented Immigrants
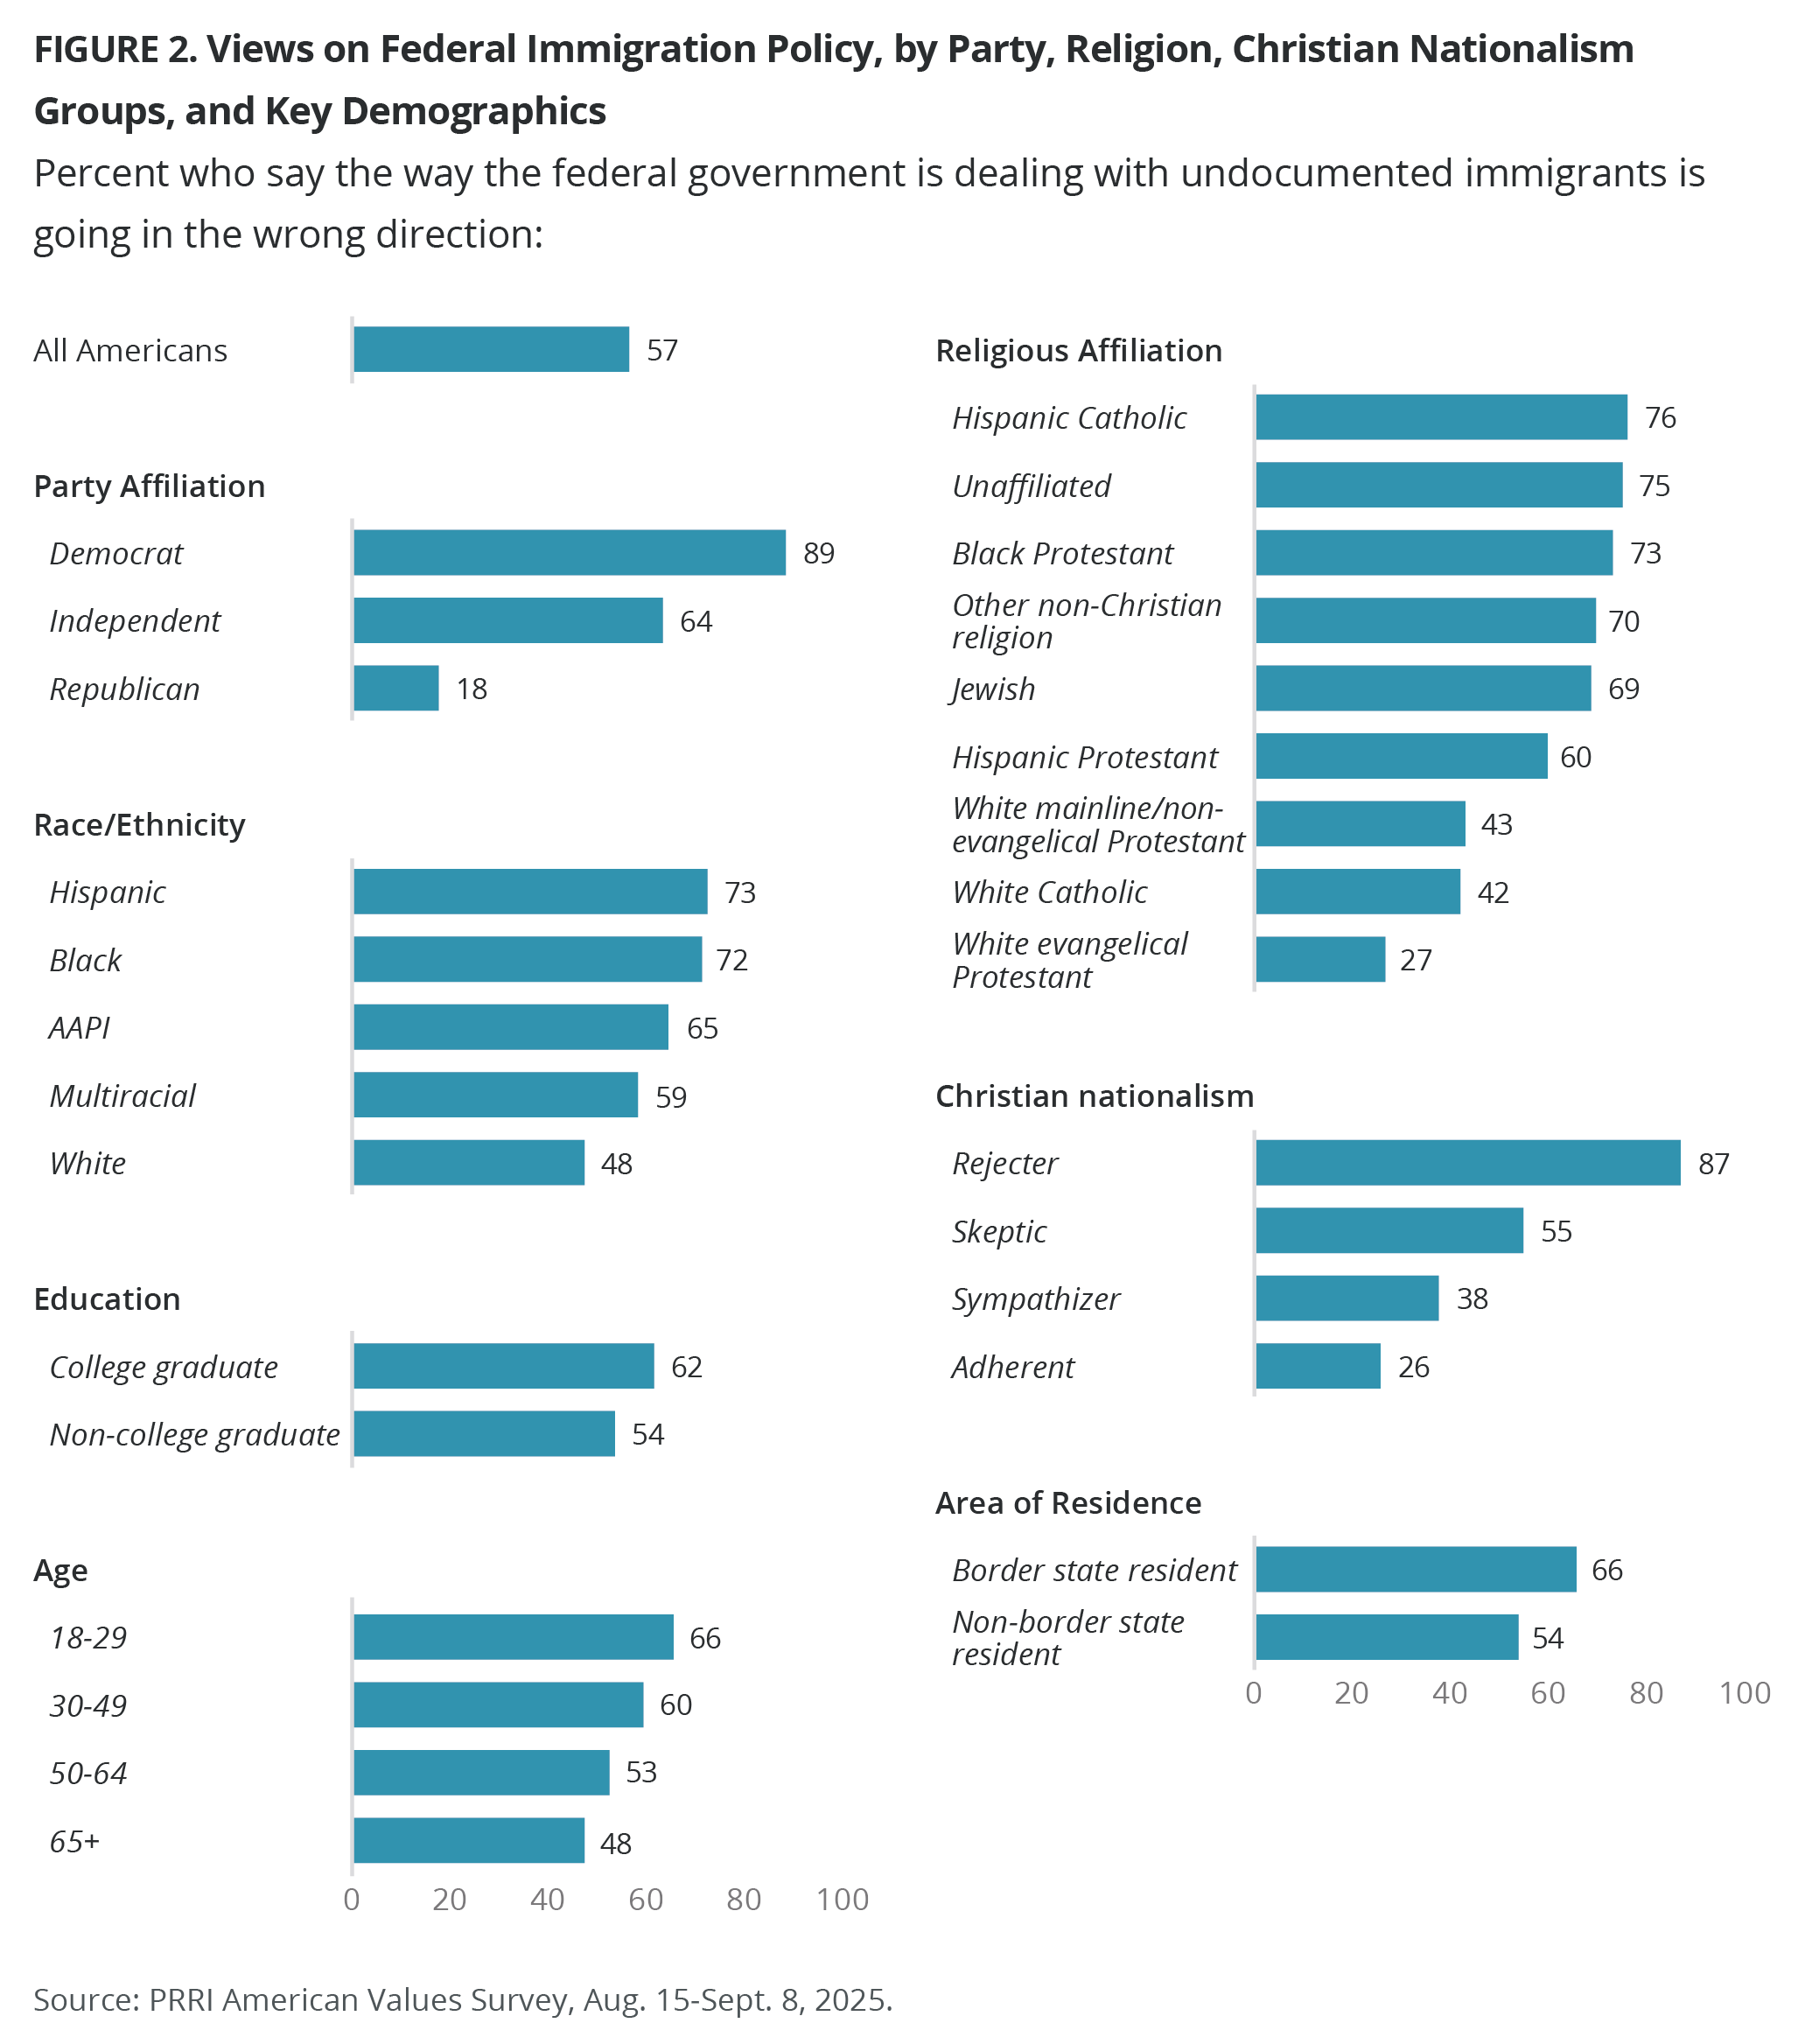
Most Americans say that the way the federal government is dealing with undocumented immigrants is going in the wrong direction (57%), including majorities of Democrats (89%) and independents (64%). Just 18% of Republicans agree.
With the exception of white Christian groups, majorities of all other religious groups say that the way the federal government is dealing with undocumented immigrants is going in the wrong direction. Roughly four in ten white mainline/non-evangelical Protestants (43%) and white Catholics (42%) also say that the way the federal government is dealing with undocumented immigrants is going in the wrong direction, compared with only 27% of white evangelical Protestants who say the same.
Most Christian nationalism Rejecters (87%) and Skeptics (55%) say that the way the federal government is dealing with undocumented immigrants is going in the wrong direction, compared with far fewer Sympathizers (38%) and Adherents (26%).
Non-white Americans are far more likely to say that the way the federal government is dealing with undocumented immigrants is headed in the wrong direction than white Americans. Education and age also impact views on this measure, with more college-educated and younger Americans believing that the government’s handling of undocumented immigrants is headed in the wrong direction. Americans who live in border states are more likely to say that the way the federal government is dealing with undocumented immigrants is going in the wrong direction than those who live elsewhere (66% vs. 54%).
Increase in ICE Funding to Speed Up Immigration Enforcement Has Gone Too Far
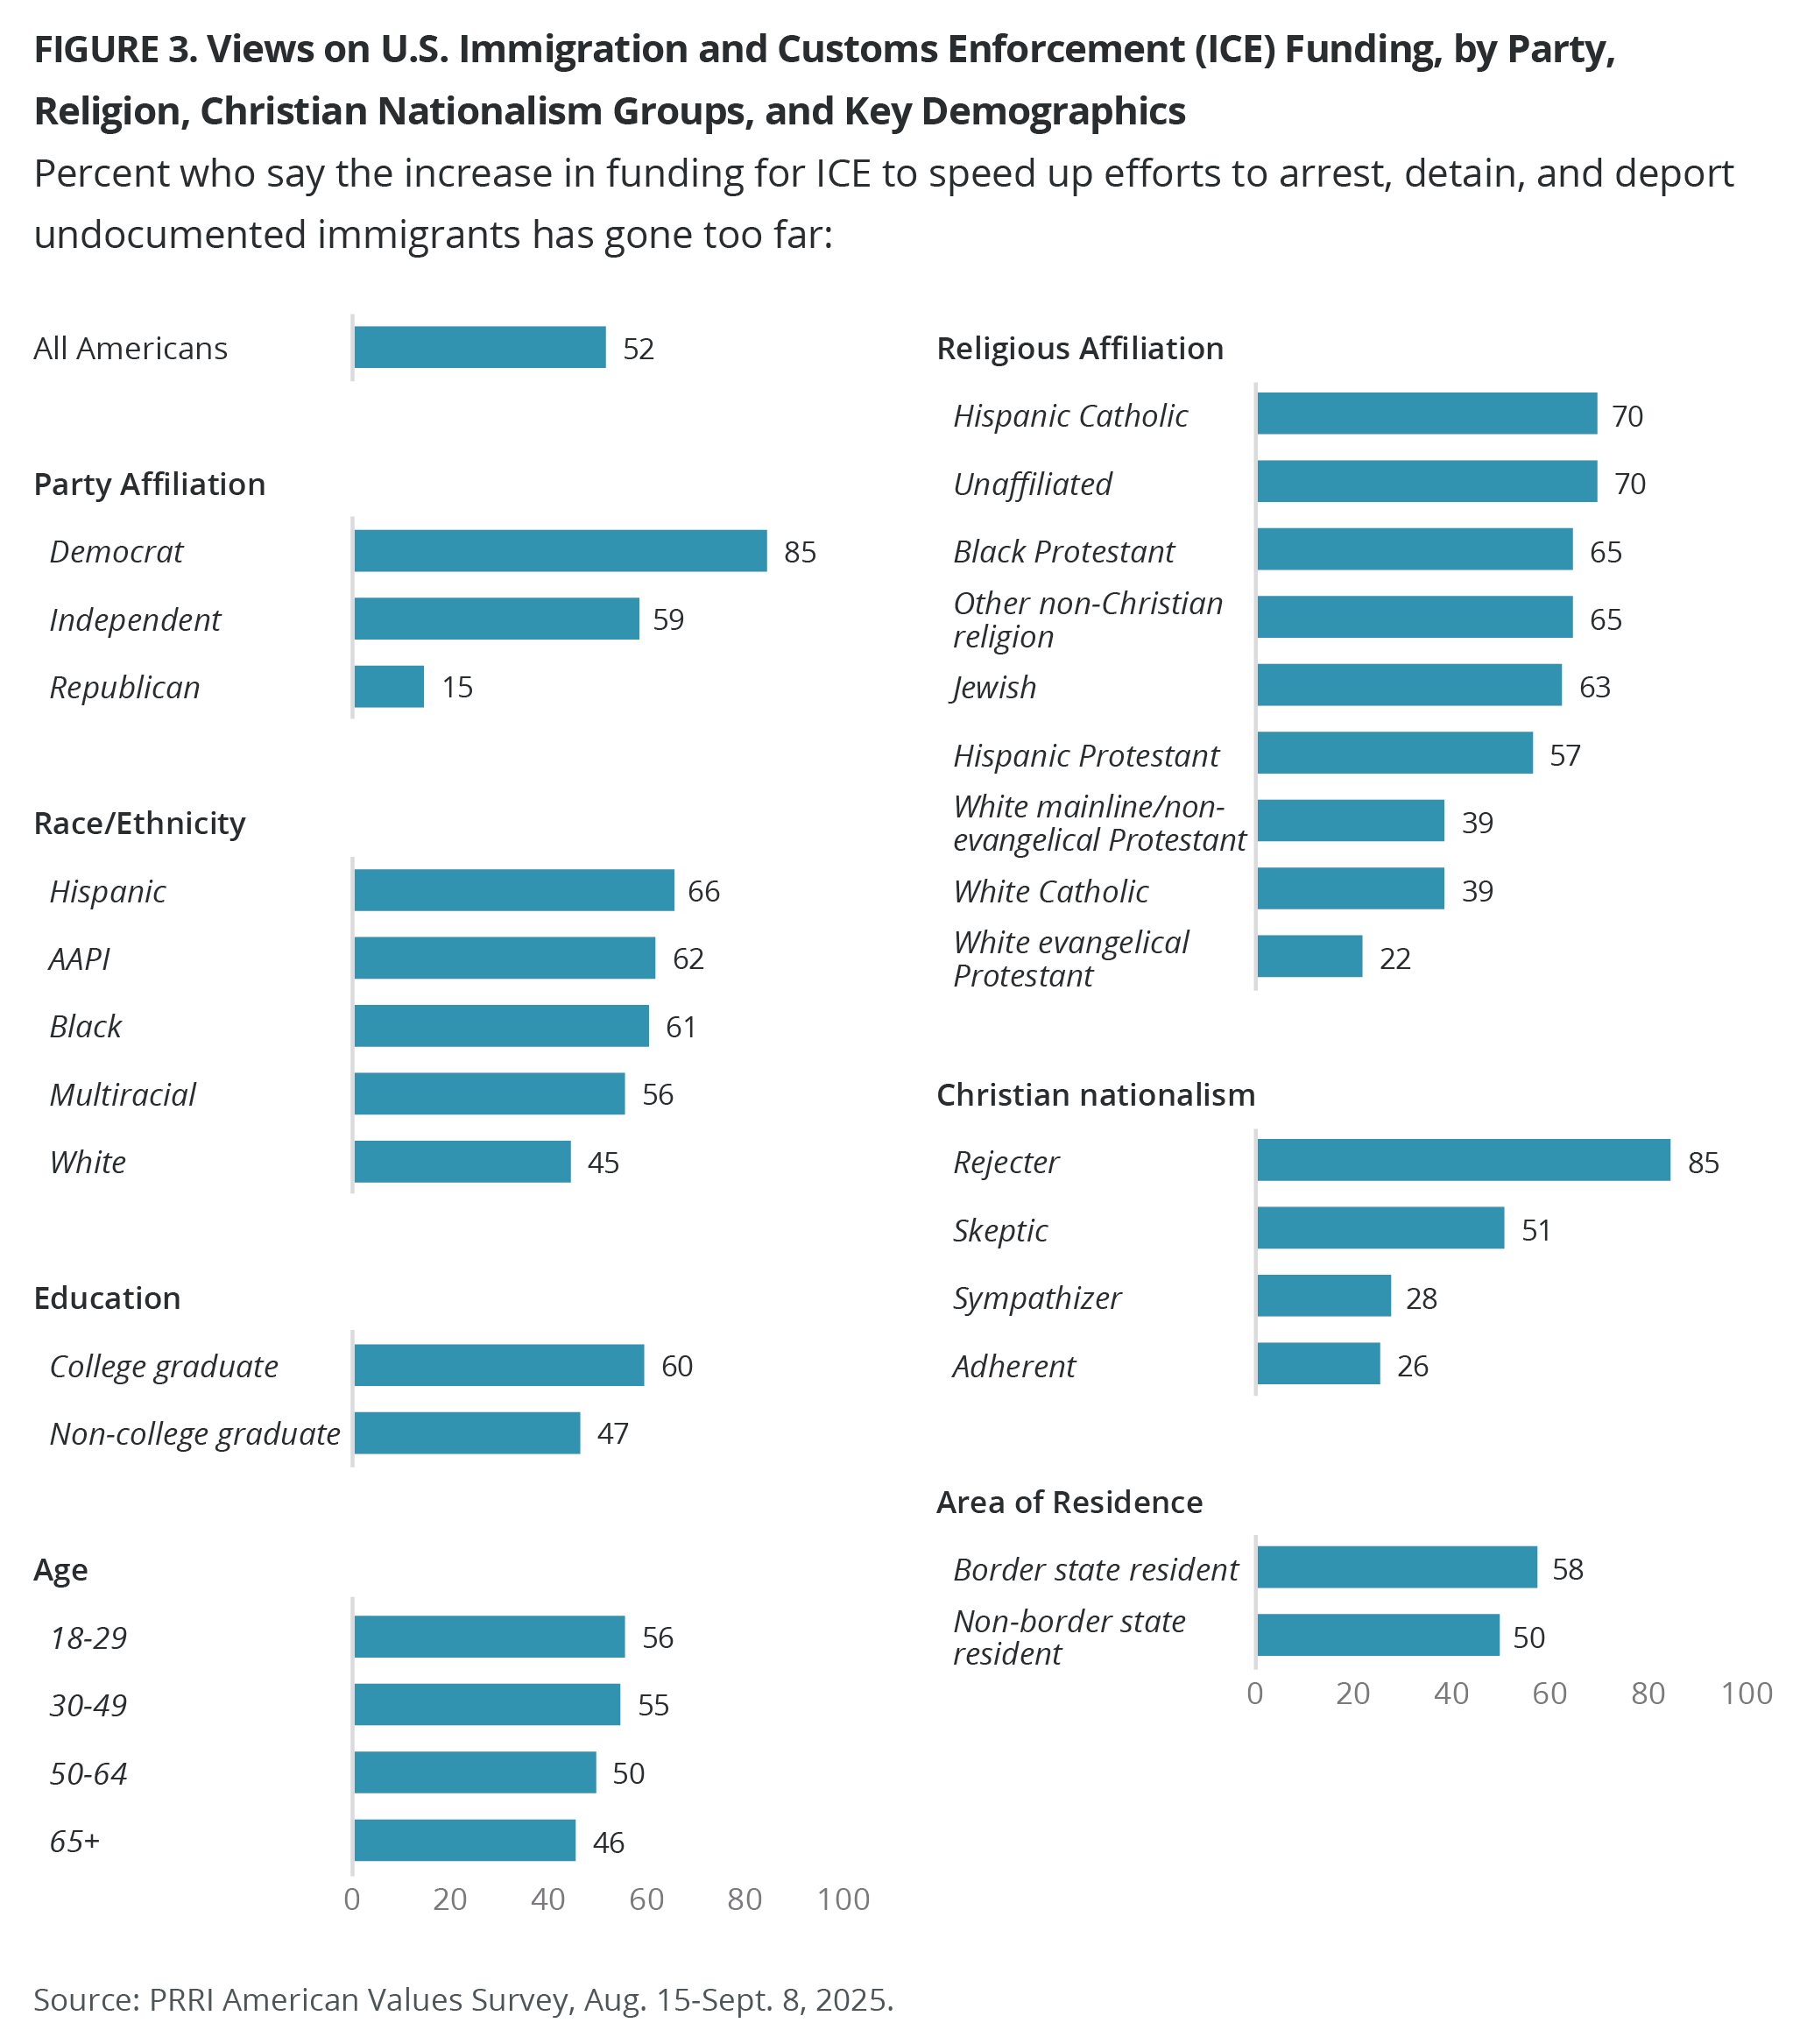
A slim majority of Americans (52%) say that the increase in funding for U.S. Immigration and Customs Enforcement (ICE) to speed up efforts to arrest, detain, and deport undocumented immigrants has gone too far, compared with one-third who say this change seems about right (33%), and only 12% who say it has not gone far enough. There is a 70-percentage-point gap between Democrats (85%) and Republicans (15%) who say that this change has gone too far. The majority of independents (59%) also say this change has gone too far.
With the exception of white Christian groups, majorities of all other religious groups say that the increase in ICE funding to speed up immigration enforcement has gone too far, including seven in ten unaffiliated Americans and Hispanic Catholics, and about two-thirds of other non-Christians, Black Protestants, and Jewish Americans. Hispanic Protestants (57%) are 18 percentage points more likely than white mainline/non-evangelical Protestants (39%) and 35 percentage points more than white evangelical Protestants (22%) to say that the increase in funding for ICE has gone too far.
Most Christian nationalism Rejecters (85%) and half of Skeptics (51%) say immigration enforcement has gone too far, compared with roughly one in four Sympathizers (28%) and Adherents (26%).
While majorities of Americans of color say that the increase in funding for ICE to speed up efforts to arrest, detain, and deport undocumented immigrants has gone too far, only 45% of white Americans say the same. Americans with a college degree and younger Americans, including 56% of those ages 18-29 and 55% of those ages 30-49, are also more likely than those without a college degree and older Americans, including 50% of those ages 50-64 and 46% of senior Americans, to agree. Americans who live in border states are 8 percentage points more likely than those who live elsewhere to say this change has gone too far.
Views on U.S. Immigration and Customs Enforcement (ICE)
Confidence in ICE
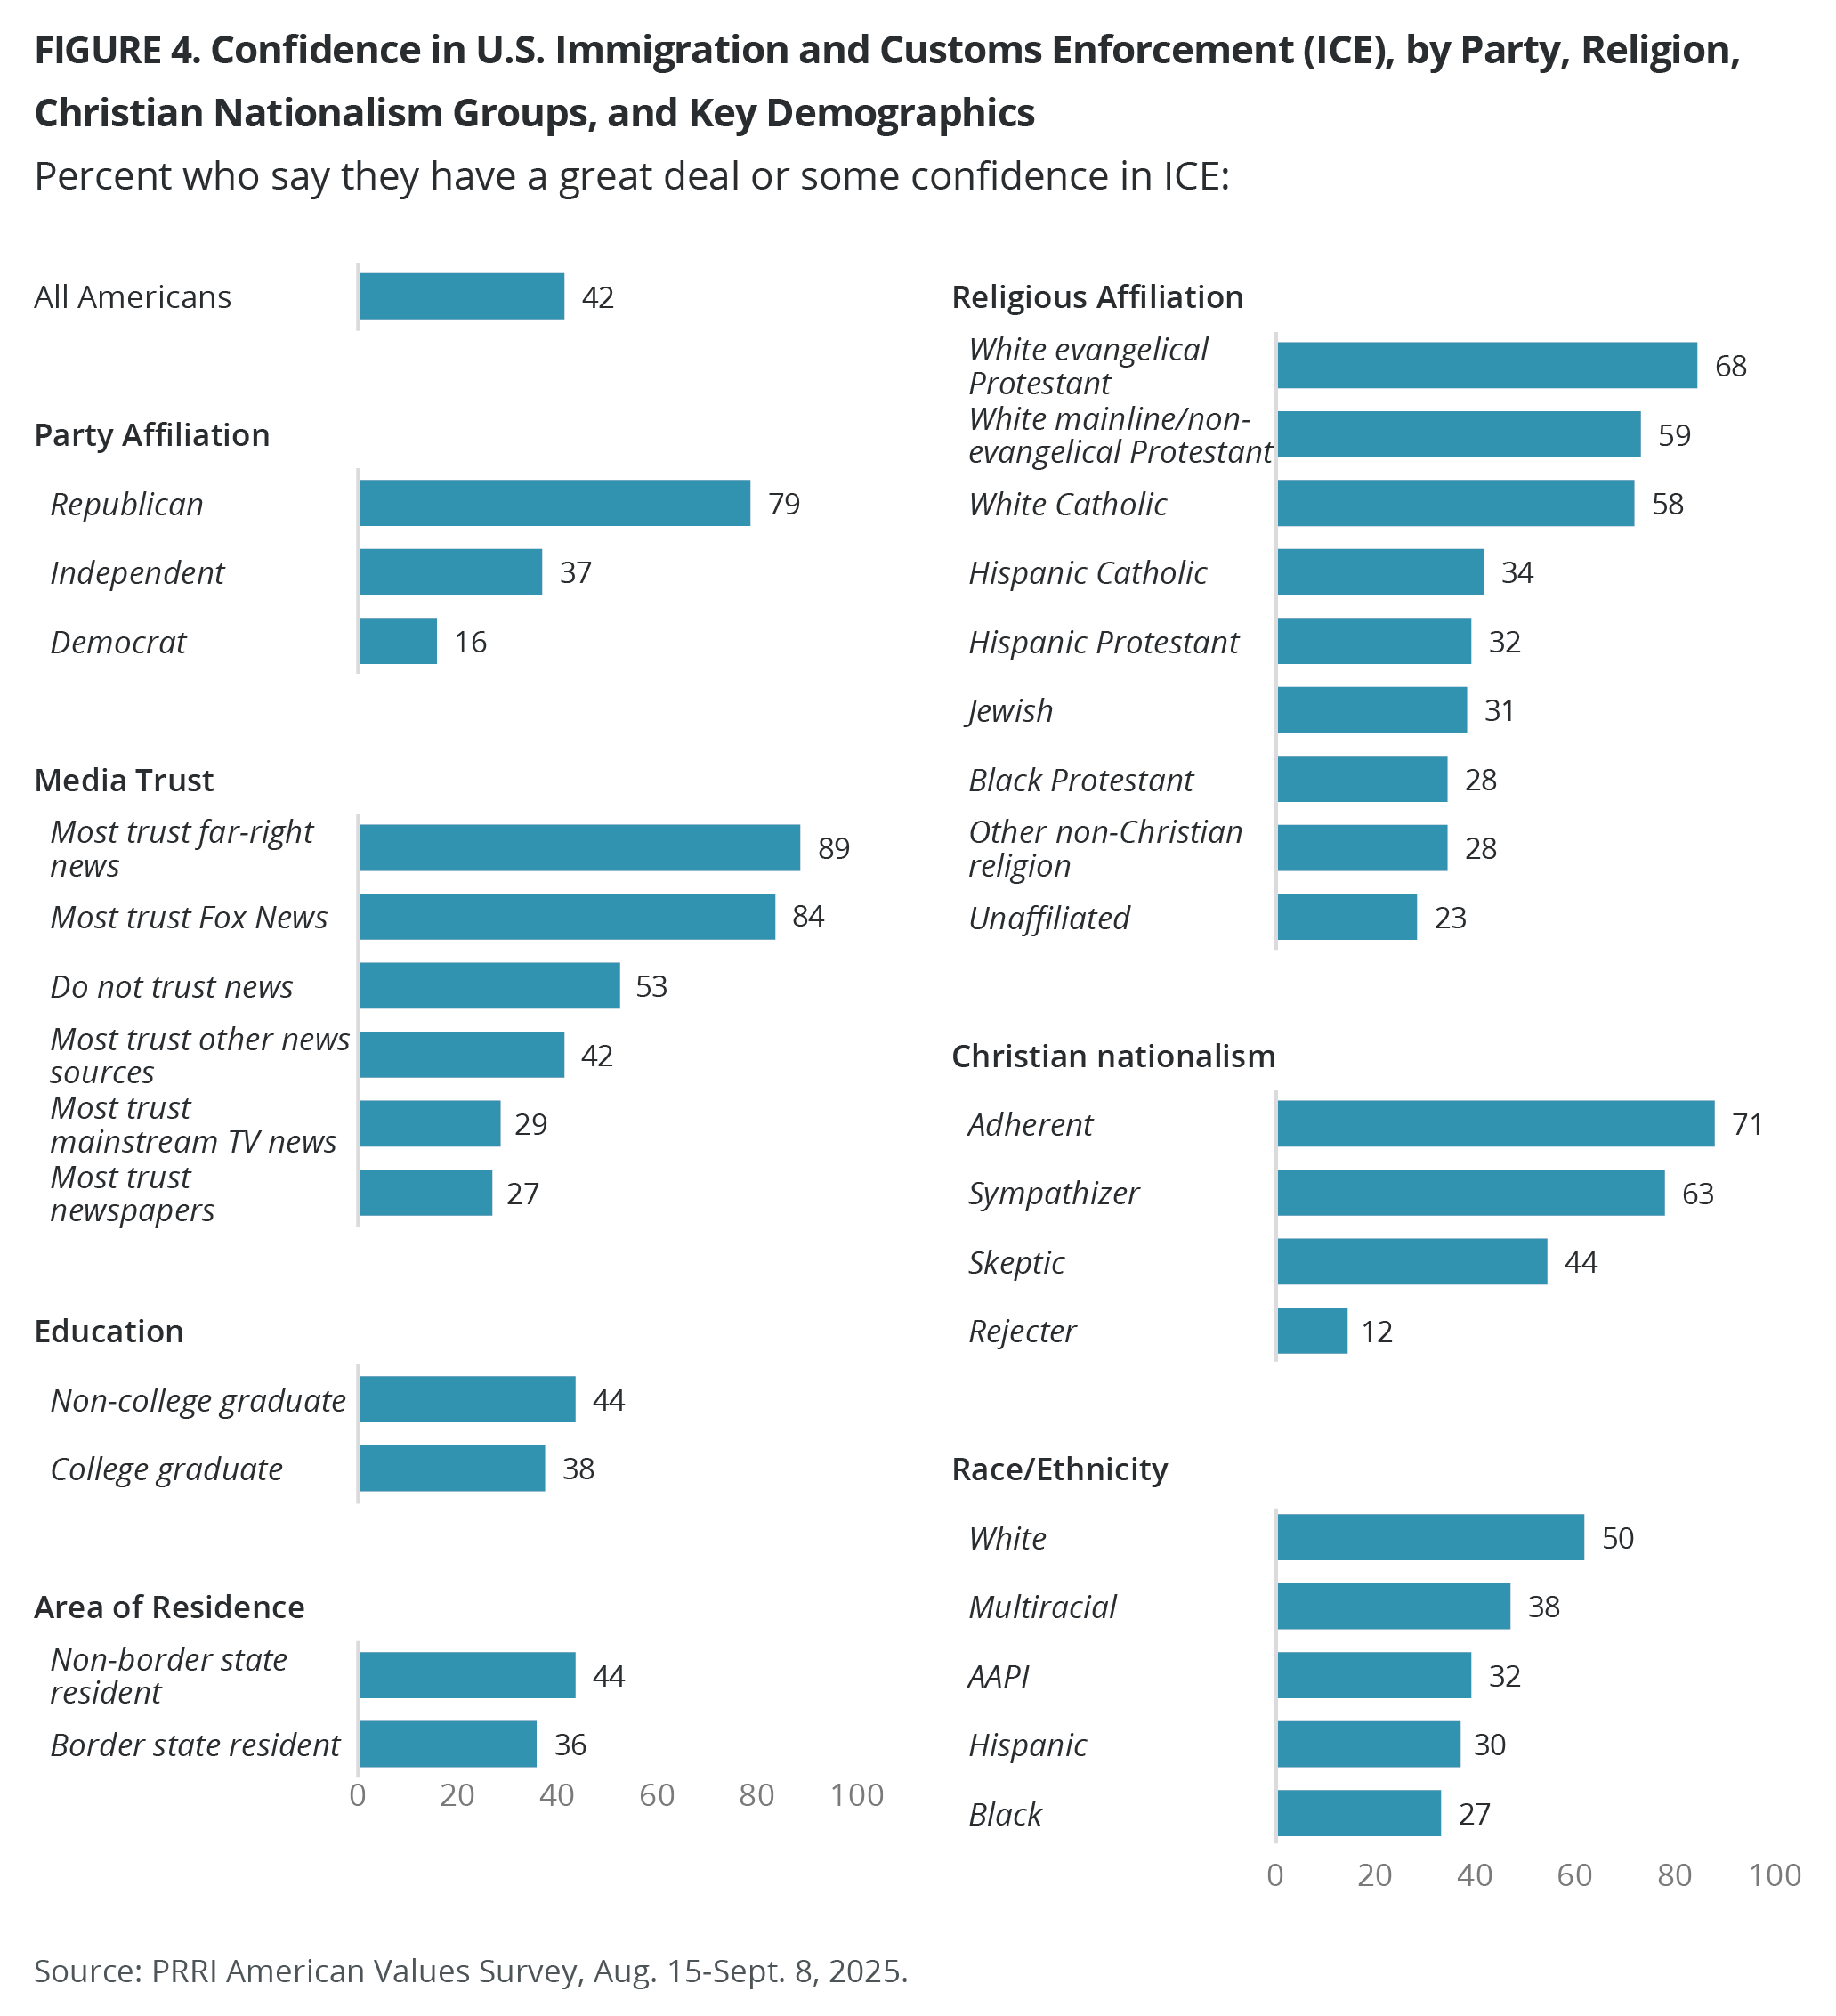
Around four in ten Americans say they have a great deal or some confidence in US Immigration and Customs Enforcement known as ICE (42%), compared with the majority (56%) who have little or no confidence. Republicans express far more confidence in ICE (79%) than independents (37%) or Democrats (16%).
Significant majorities of Americans who most trust far-right TV news (89%) and Fox News (84%) have confidence in ICE. Those who do not trust any news sources are divided (53%), while far fewer Americans who most trust mainstream TV news (29%) and newspapers (27%) have confidence in ICE.[3]
Most white Christian groups have confidence in ICE, including white evangelical Protestants (68%), white mainline/non-evangelical Protestants (59%), and white Catholics (58%), compared with around three in ten or fewer Jewish Americans (31%), Hispanic Catholics (34%%), Black Protestants (28%), and unaffiliated Americans (23%).
Christian nationalism Adherents (71%) and Sympathizers (63%) have far more confidence in ICE, compared with far fewer Skeptics (44%) and Adherents (12%).
While just one in three Americans of color express confidence in ICE, that number rises to half of white Americans. Americans with a college degree are notably less likely than those without a college degree to have confidence in ICE; confidence in ICE also increases with age.
Those who live in border states (36%) are significantly less likely than those who live elsewhere (44%) to have confidence in ICE.
Immigration as a Critical Issue
Over four in ten Americans say immigration (43%) is a critical issue, another 45% say it is one among many important issues, and just 11% say it is not that important of an issue. The salience of immigration in political discussions has fluctuated over the past decade with nearly half of Americans saying immigration is a critical issue in 2019 (49%), followed by a sharp decline to 33% in 2020 during the pandemic. That percentage has since hovered in the low 40s.
During the past decade, Republicans have consistently been the most likely to say immigration is a critical issue, compared with independents and Democrats, with 56% today indicating immigration is critical, down from a peak of 71% in 2024. Today, 36% of Democrats say immigration is a critical issue, up from 24% in 2024.

Immigration Policy Views
After examining Trump’s approval on immigration, views on how the federal government is handling immigration, confidence in ICE, and views on immigration as a critical issue, in the following sections, PRRI evaluates opinions on specific immigration policies — who supports them, who does not, and what is driving those differences.
Immigration Rights and Protections
A Pathway to Citizenship for Undocumented Immigrants
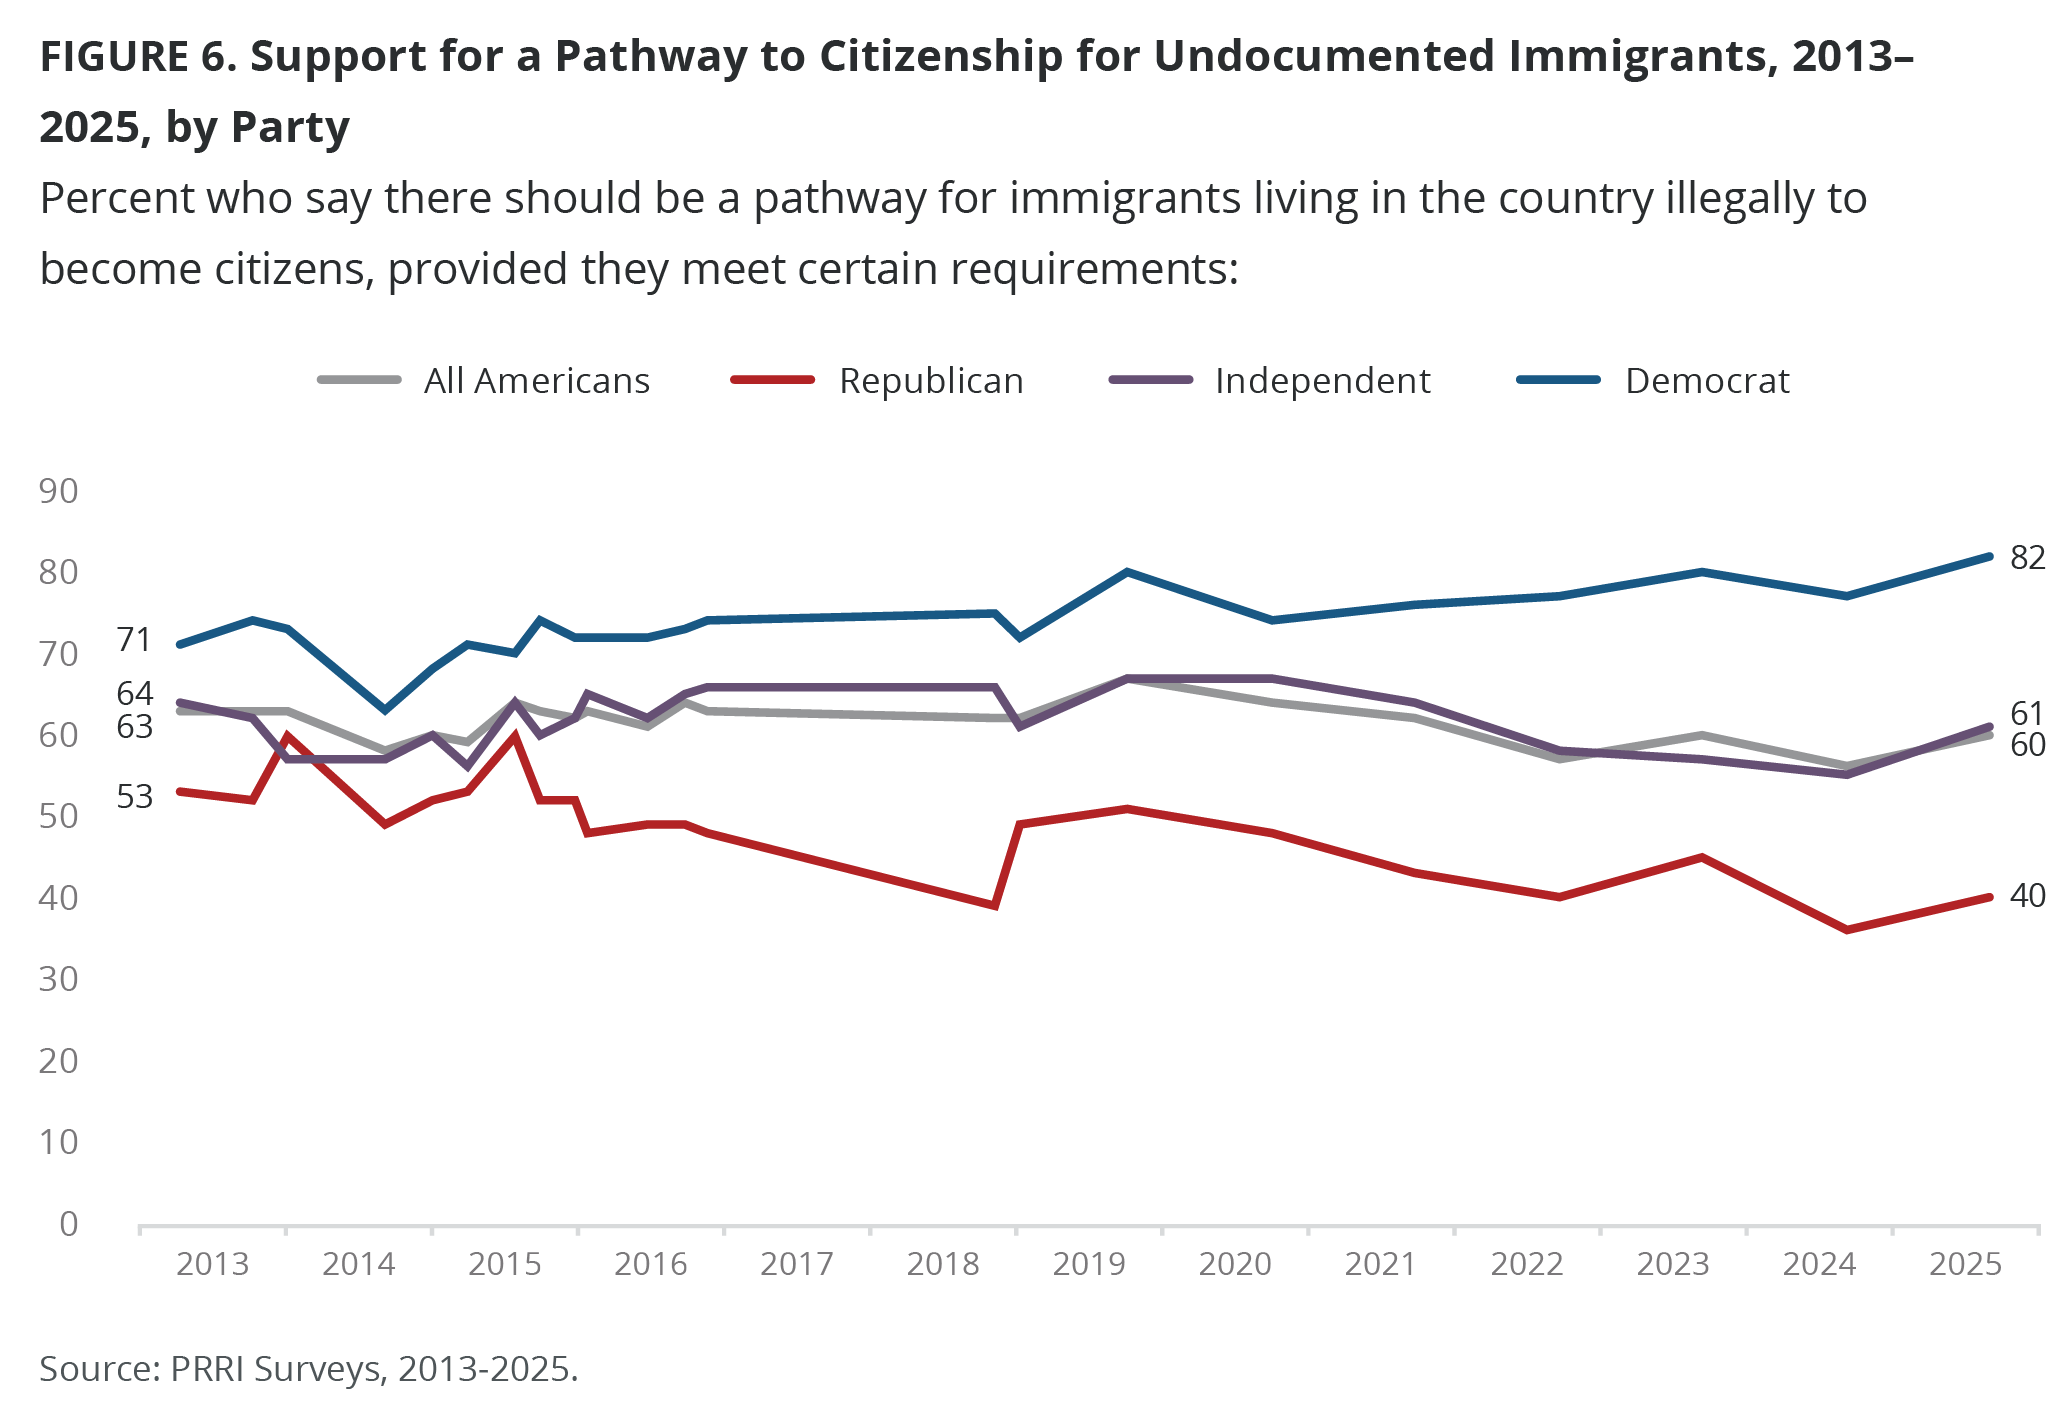
Most Americans (60%) say that immigrants living in the United States illegally should be given a way to become citizens, provided they meet certain requirements. More than one in ten say they would prefer undocumented immigrants to be eligible for permanent residency status but not citizenship (12%), and one in four say all immigrants living in the country illegally should be identified and deported (24%). Majority support for a pathway to citizenship for undocumented immigrants has remained remarkably consistent since 2013, with a high of 67% in 2019 and a low of 56% in 2024.
Party polarization between Democrats and Republicans has widened on the pathway to citizenship since PRRI first began asking this question in 2013. In 2013, about seven in ten Democrats (71%) supported a pathway to citizenship, compared with 53% of Republicans — a difference of 18 percentage points. By 2025, however, that gap had increased to more than 40 points.
At the same time, support for a pathway to citizenship increased among all Americans in the past year, with Republican support gaining 4 points (36% to 40%) and Democratic support up 5 points (77% to 82%). The increase in support for a path to citizenship was larger for independents, from 55% to 61%.
Majorities of Americans who most trust newspapers, mainstream news, and those who don’t trust the news support allowing undocumented immigrants to become citizens, compared with far fewer Americans who most trust Fox News (35%) and far-right outlets (28%).
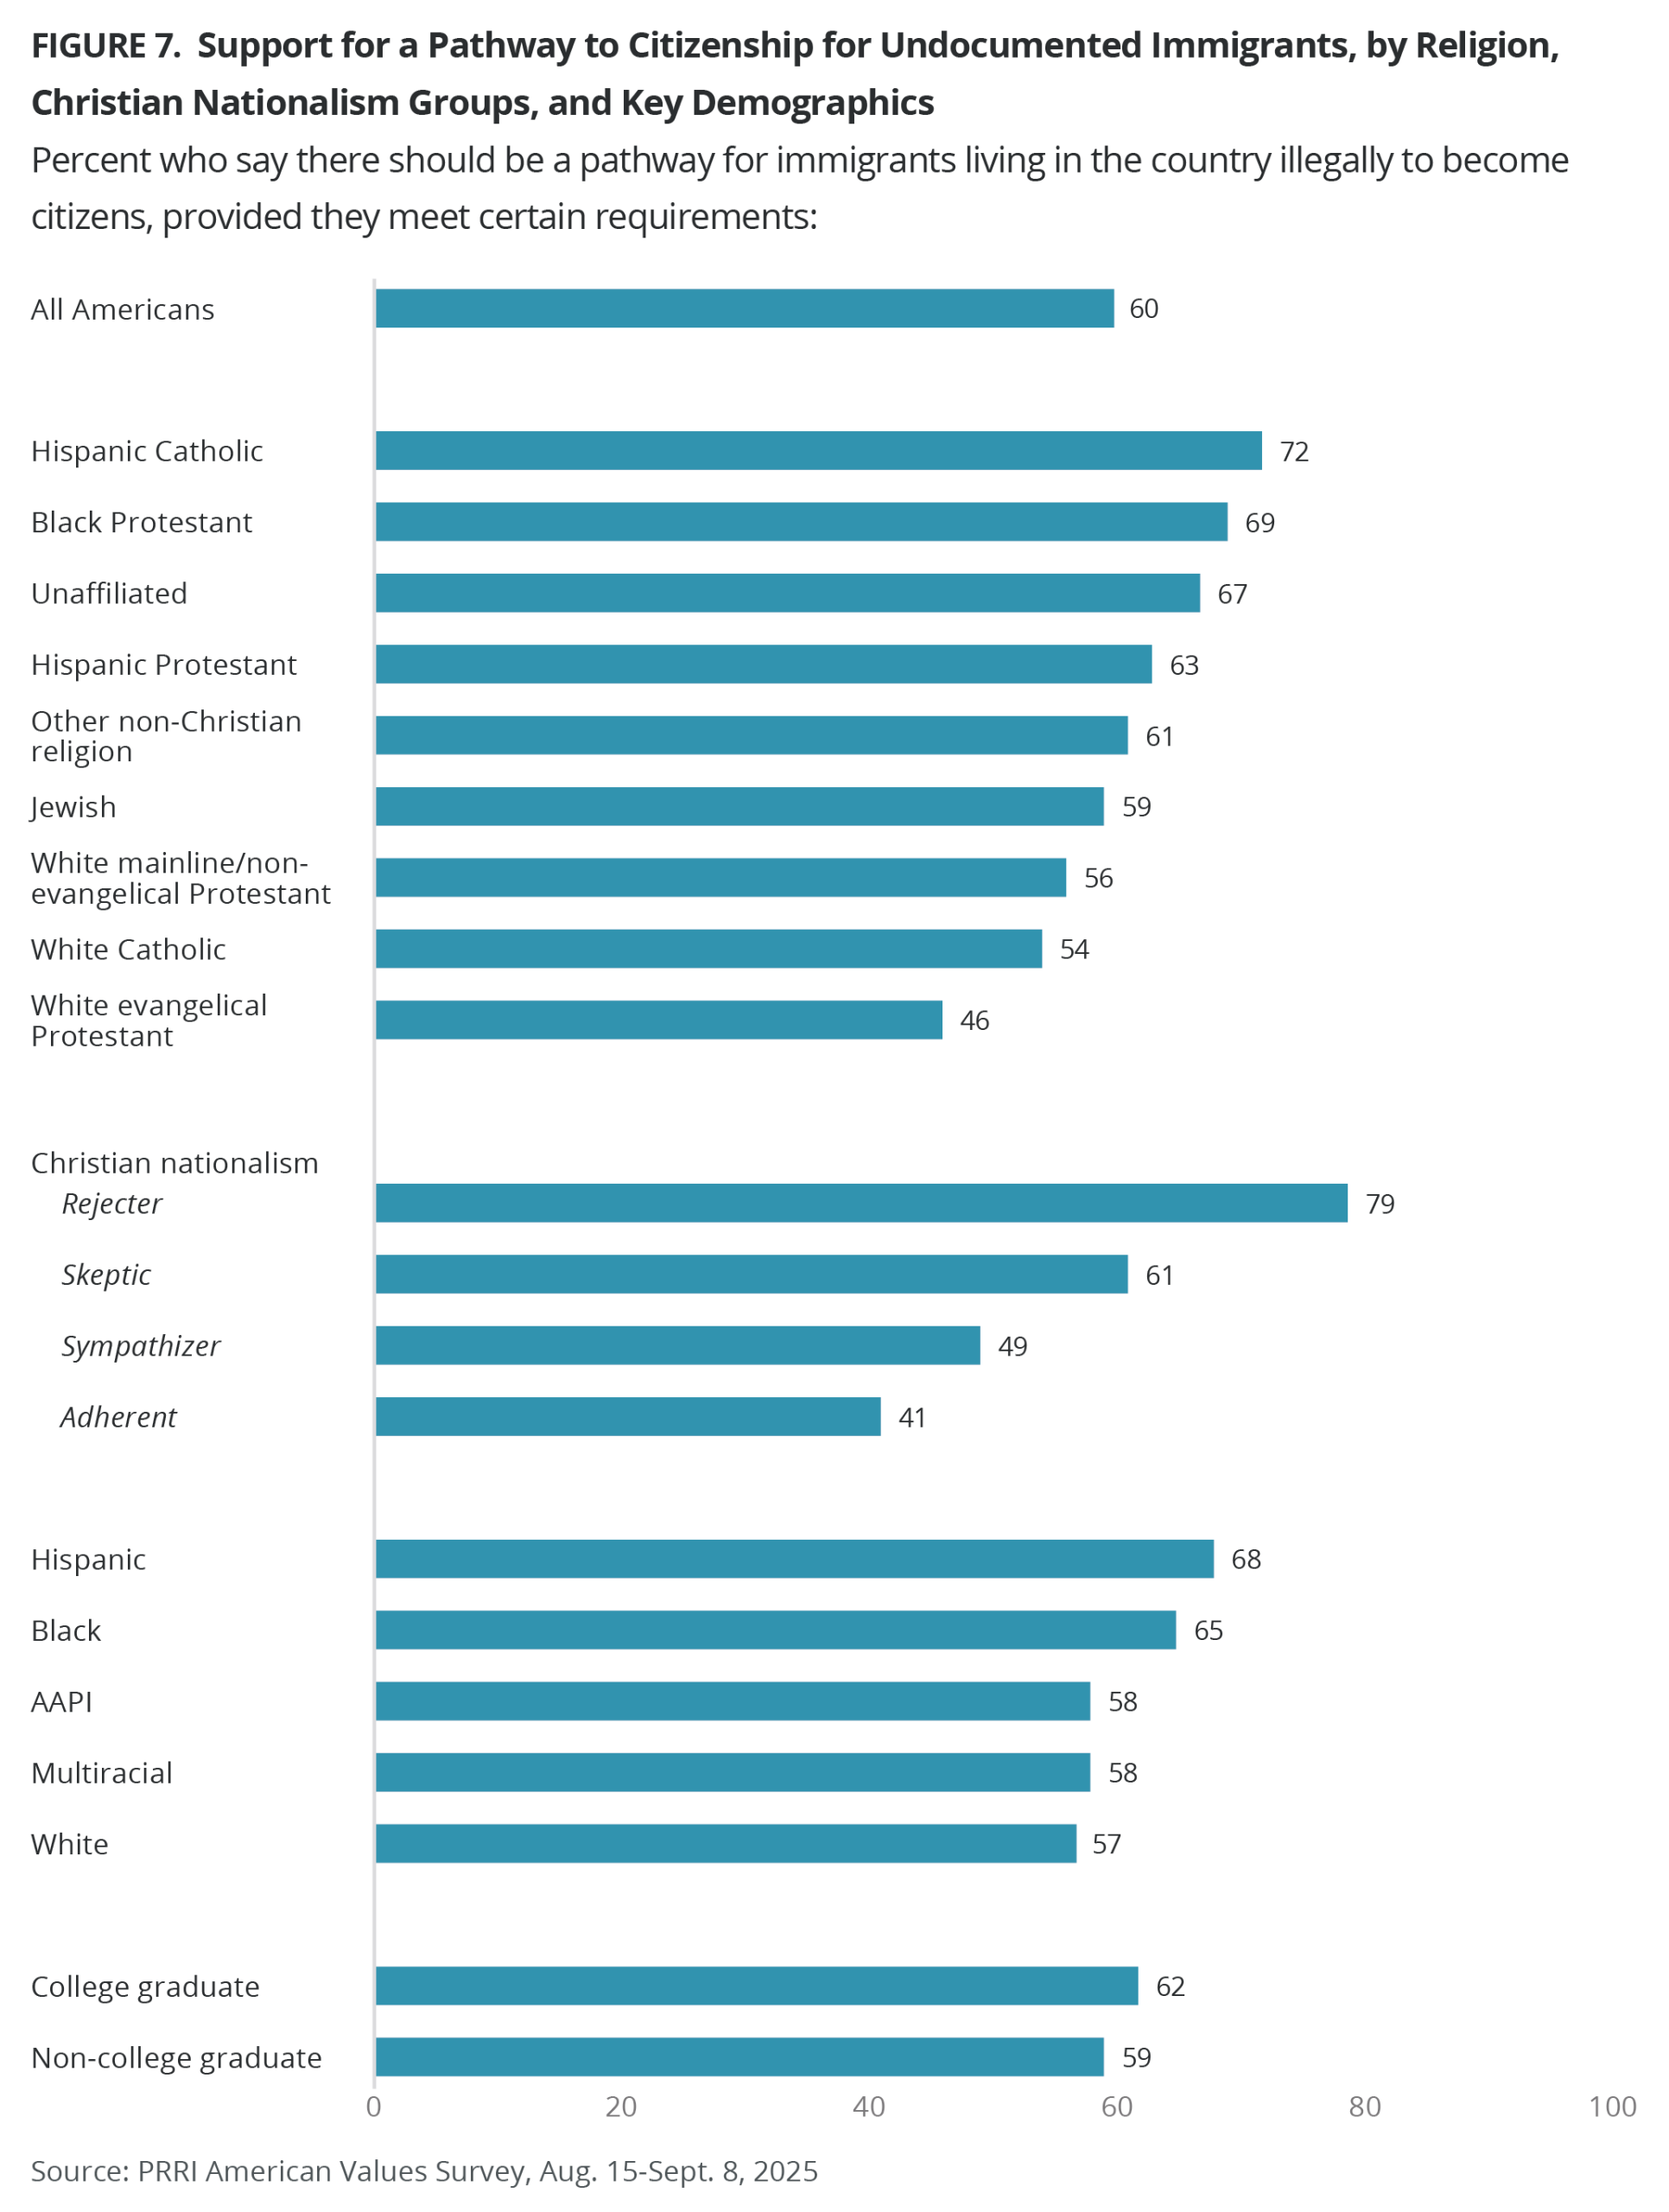
Most religious groups, including strong majorities of Hispanic Catholics and Black Protestants, as well as the religiously unaffiliated, support allowing undocumented immigrants to become citizens. White evangelical Protestants (46%) are the only religious group without majority support for this issue. In fact, support among white evangelical Protestants for identifying and deporting undocumented immigrants has trended upward over the past decade, from 30% in 2013, to a peak at 53% in 2024, and down to 44% in 2025.
Eight in ten Christian nationalism Rejecters (79%) and six in ten Skeptics (61%) support allowing undocumented immigrants to become citizens, compared with 49% of Christian nationalism Adherents and 41% of Sympathizers.
Majorities of every racial and ethnic group support a pathway to citizenship for undocumented immigrants, including 57% of white Americans, 58% of multiracial and AAPI Americans, 64% of Black Americans, and 68% of Hispanic Americans.
Allowing Children Brought to the U.S. Illegally to Gain Legal Residence
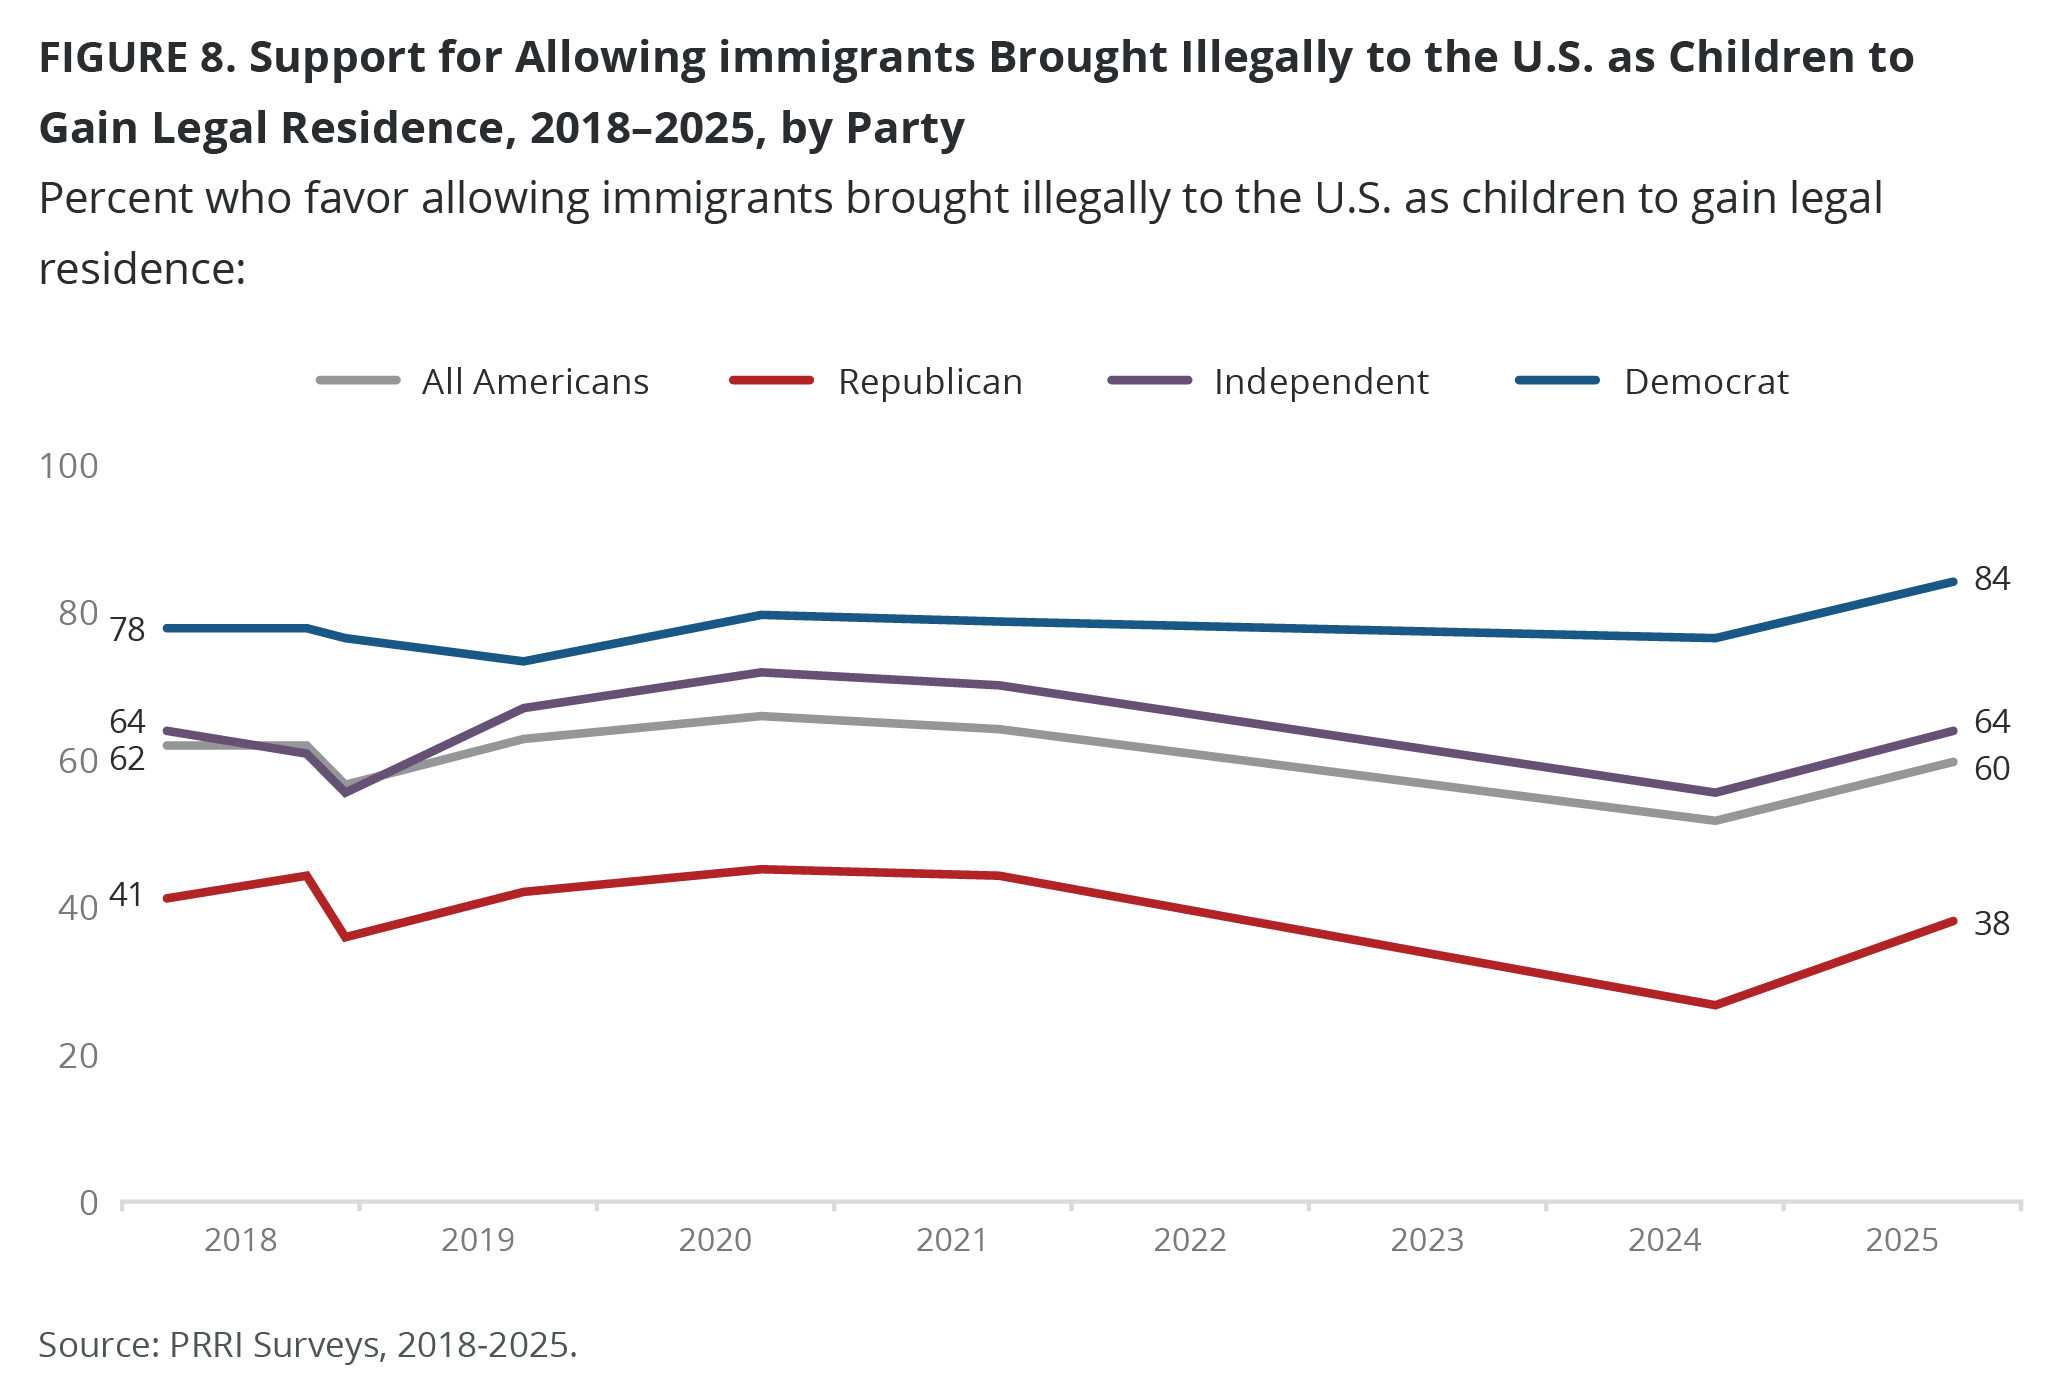
Compared with last year, Americans are increasingly supportive of allowing immigrants brought illegally to the U.S. as children to gain legal resident status, known as DACA. Today, six in ten Americans (60%) favor this policy, compared with 52% in 2024. Majorities of Democrats (84%) and independents (64%) are in favor of DACA, compared with only 38% of Republicans. This is an increase from 2024, where 77% of Democrats, 56% of independents, and 27% of Republicans were in favor of the policy.
Majorities of Americans who most trust newspapers and mainstream TV news support DACA, compared with only 36% and 28% of those who most trust Fox News and far-right outlets, respectively.
Except for white evangelical Protestants (44%), today most religious groups are in favor of allowing children brought to the country illegally to gain resident status. Most Christian nationalism Rejecters (84%) and Skeptics (61%) favor allowing immigrants brought to the U.S. illegally as children to gain legal resident status, compared with 47% of Sympathizers and 40% of Adherents.
Hispanic Americans (71%) are the most likely to favor allowing children brought to the U.S. illegally to gain legal status, followed by 64% of Black Americans and 58% of white Americans. AAPI and multiracial Americans are more split on the issue, with only 49% and 55% in favor.
While there are no differences by gender, age, or area of residence, there is an education gap: College-educated Americans (67%) are more likely than those without a college education (56%) to support allowing children brought to the U.S. illegally to gain legal status.
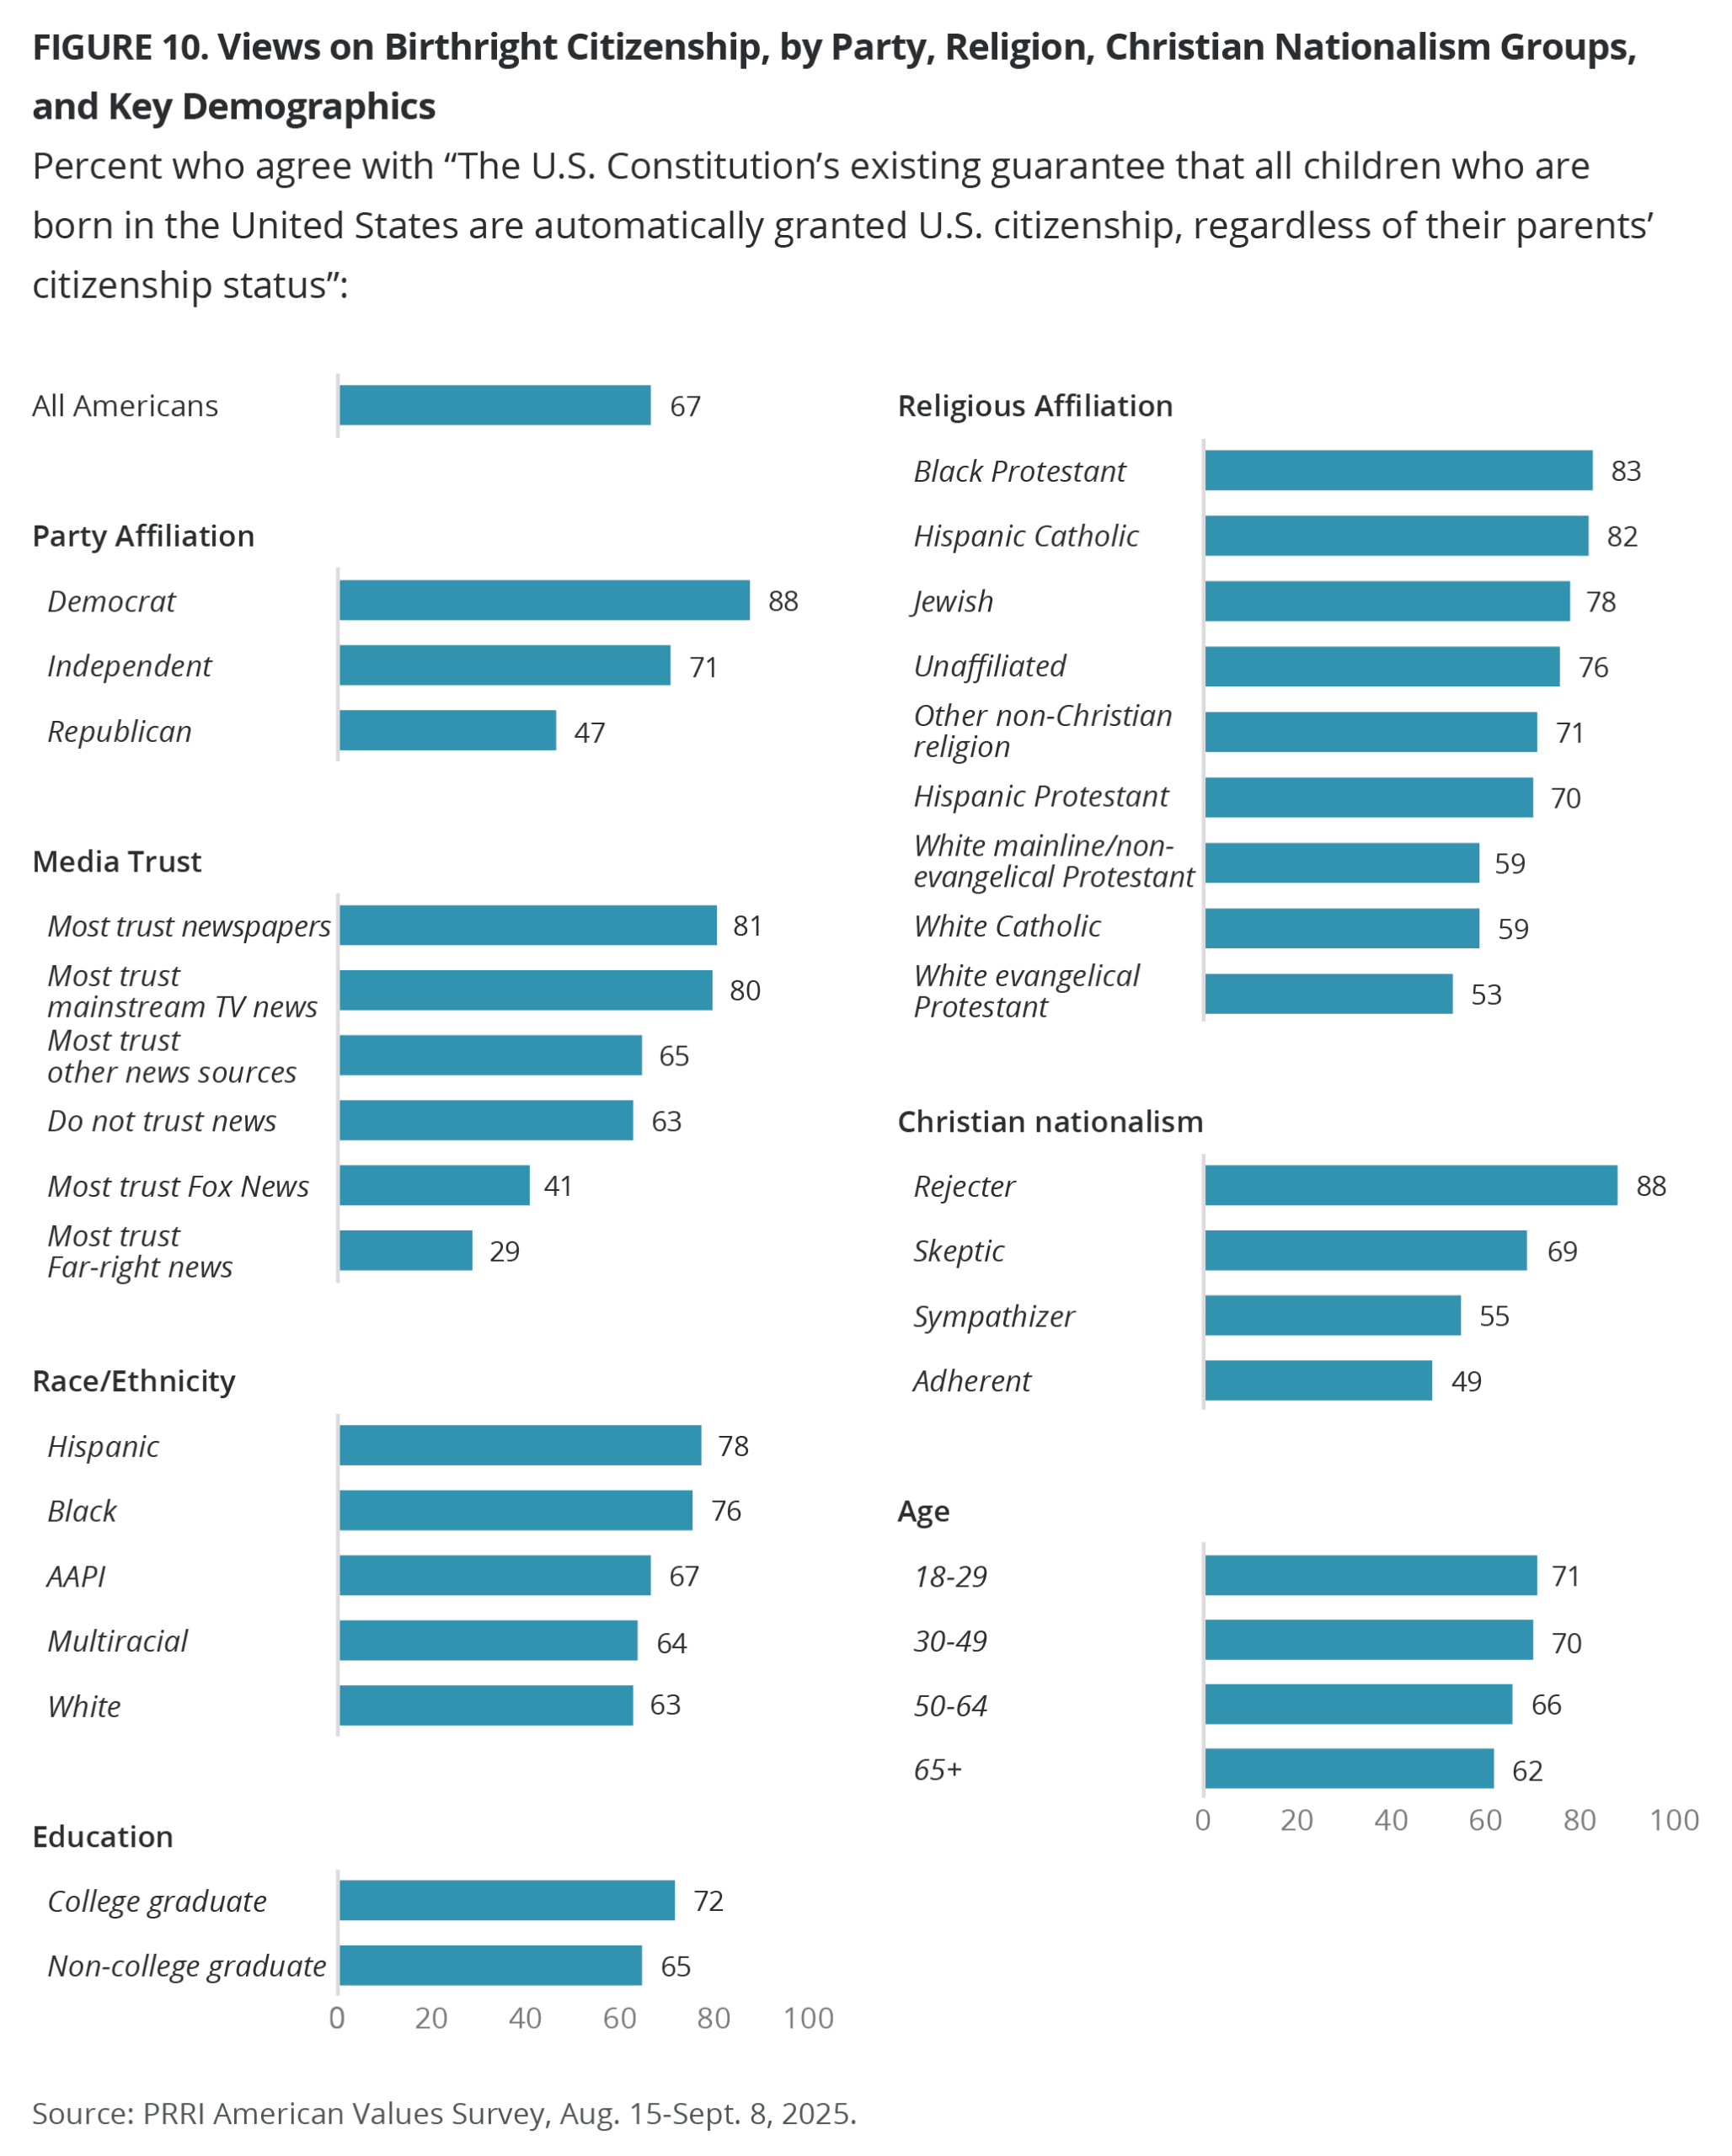
Birthright Citizenship
Two-thirds of Americans (67%) favor the “U.S. Constitution’s existing guarantee that all children who are born in the United States are automatically granted U.S. citizenship, regardless of their parents’ citizenship status,” while 29% oppose. Most Democrats (88%) and independents (71%) favor the birthright citizenship provision in the Constitution, compared with 47% of Republicans.
While majorities of Americans who most trust newspapers and mainstream TV news support birthright citizenship, only 41% of those who must trust Fox News do. Just 29% of those who most trust far-right outlets support birthright citizenship.
A majority of Americans from all religious groups support birthright citizenship, though white Christians are less likely to do so than others. Most Christian nationalism Rejecters (88%), Skeptics (69%), and Sympathizers (55%) favor birthright citizenship. Christian nationalism Adherents are divided, with 49% in favor. Majorities of Americans regardless of education levels, gender, race, area of residence, or age support birthright citizenship.
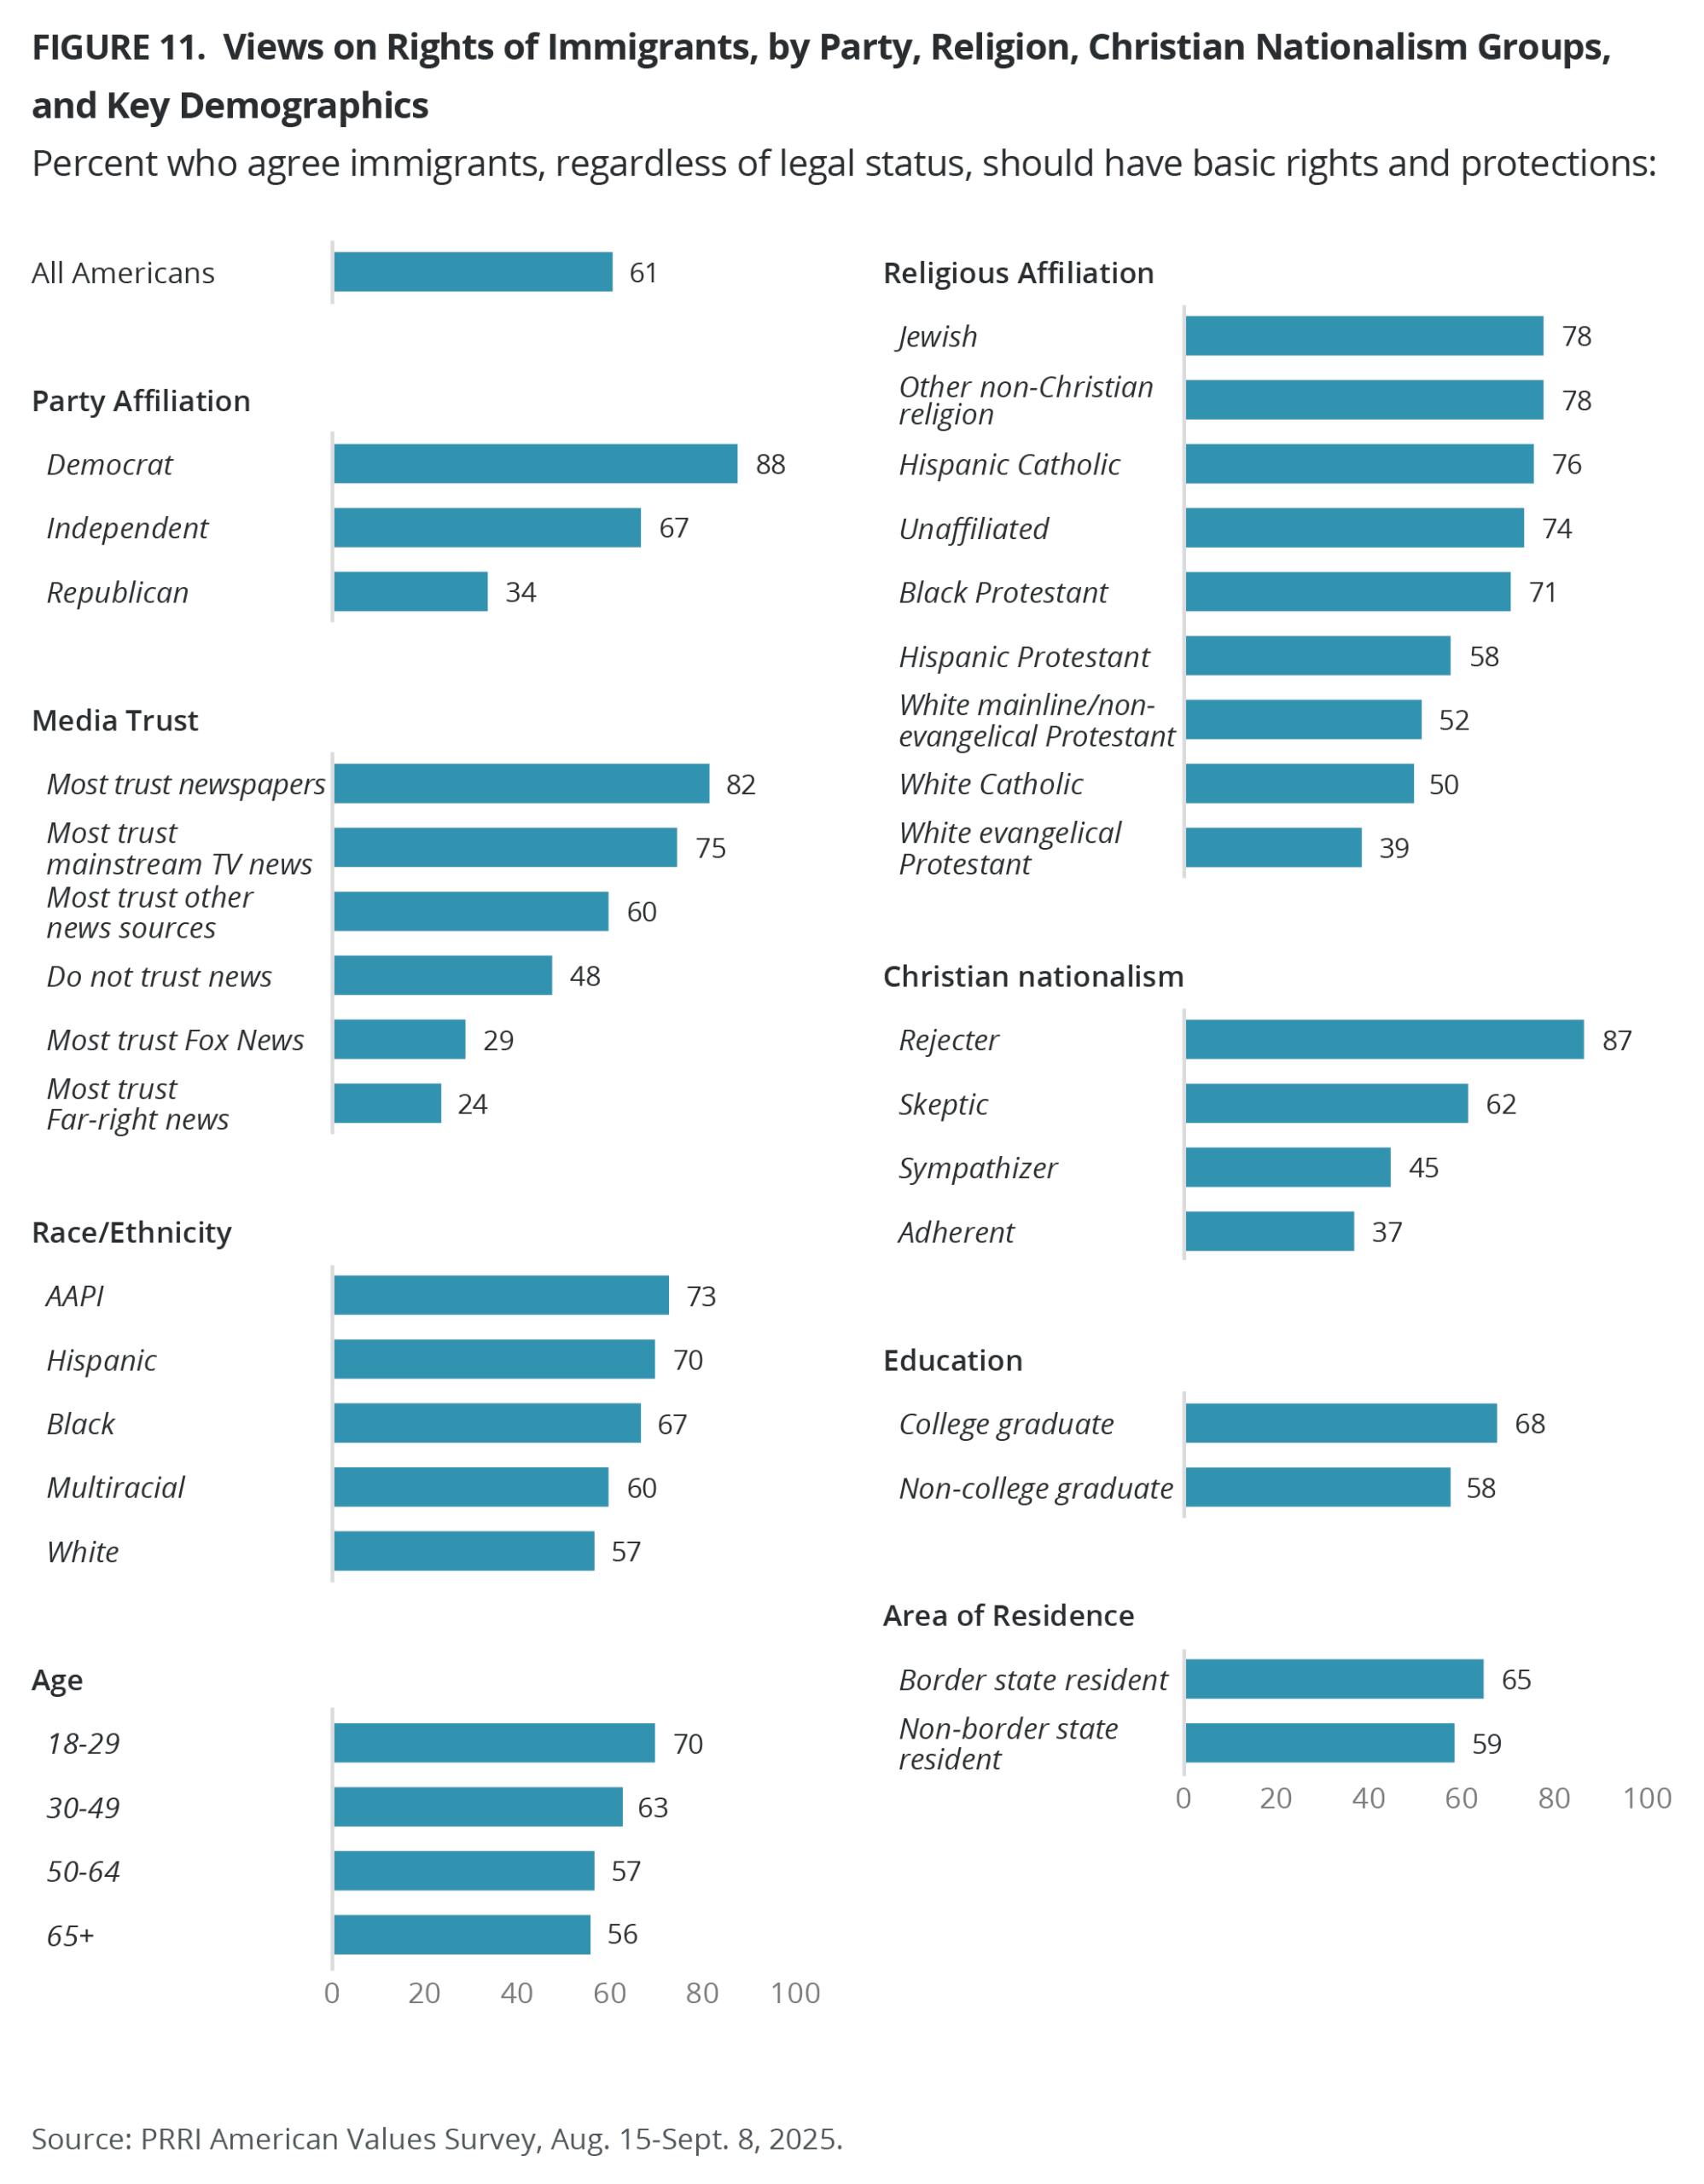
Immigrants Should Have Due Process Regardless of Legal Status
About six in ten Americans (61%) agree with the idea that “immigrants, regardless of legal status, should have basic rights and protections such as the ability to challenge their deportation before a judge in court,” while 36% disagree. Most Democrats (88%) and independents (67%) agree, compared with just one-third of Republicans (34%).
Majorities of Americans who trust newspapers, mainstream TV news, and social media believe that immigrants should be granted basic rights and protections regardless of legal status, compared with only 29% and 24% of those who trust Fox News and far-right outlets, respectively.
Except for white Christian groups, solid majorities across all other religions agree that immigrants should have basic rights — including due process — regardless of legal status. By contrast, agreement is lower among white Christians: 52% of white mainline/non-evangelical Protestants, half of white Catholics (50%), and just 39% of white evangelical Protestants agree.
Most Christian nationalism Rejecters (87%) and Skeptics (62%) favor immigrants’ basic rights regardless of legal status, compared with 45% of Sympathizers and 37% of Adherents.
Solid majorities of all racial and age groups agree that immigrants should have basic rights and protections regardless of legal status. However, white Americans (57%) are less likely than Americans of color to agree, as are older than younger Americans. Americans with a four-year college degree or higher (68%) are more likely than those without a four-year degree (58%) to agree.
Americans in border states are also more likely than Americans who live elsewhere to agree (65% vs. 59%, respectively).
Immigration and Law Enforcement
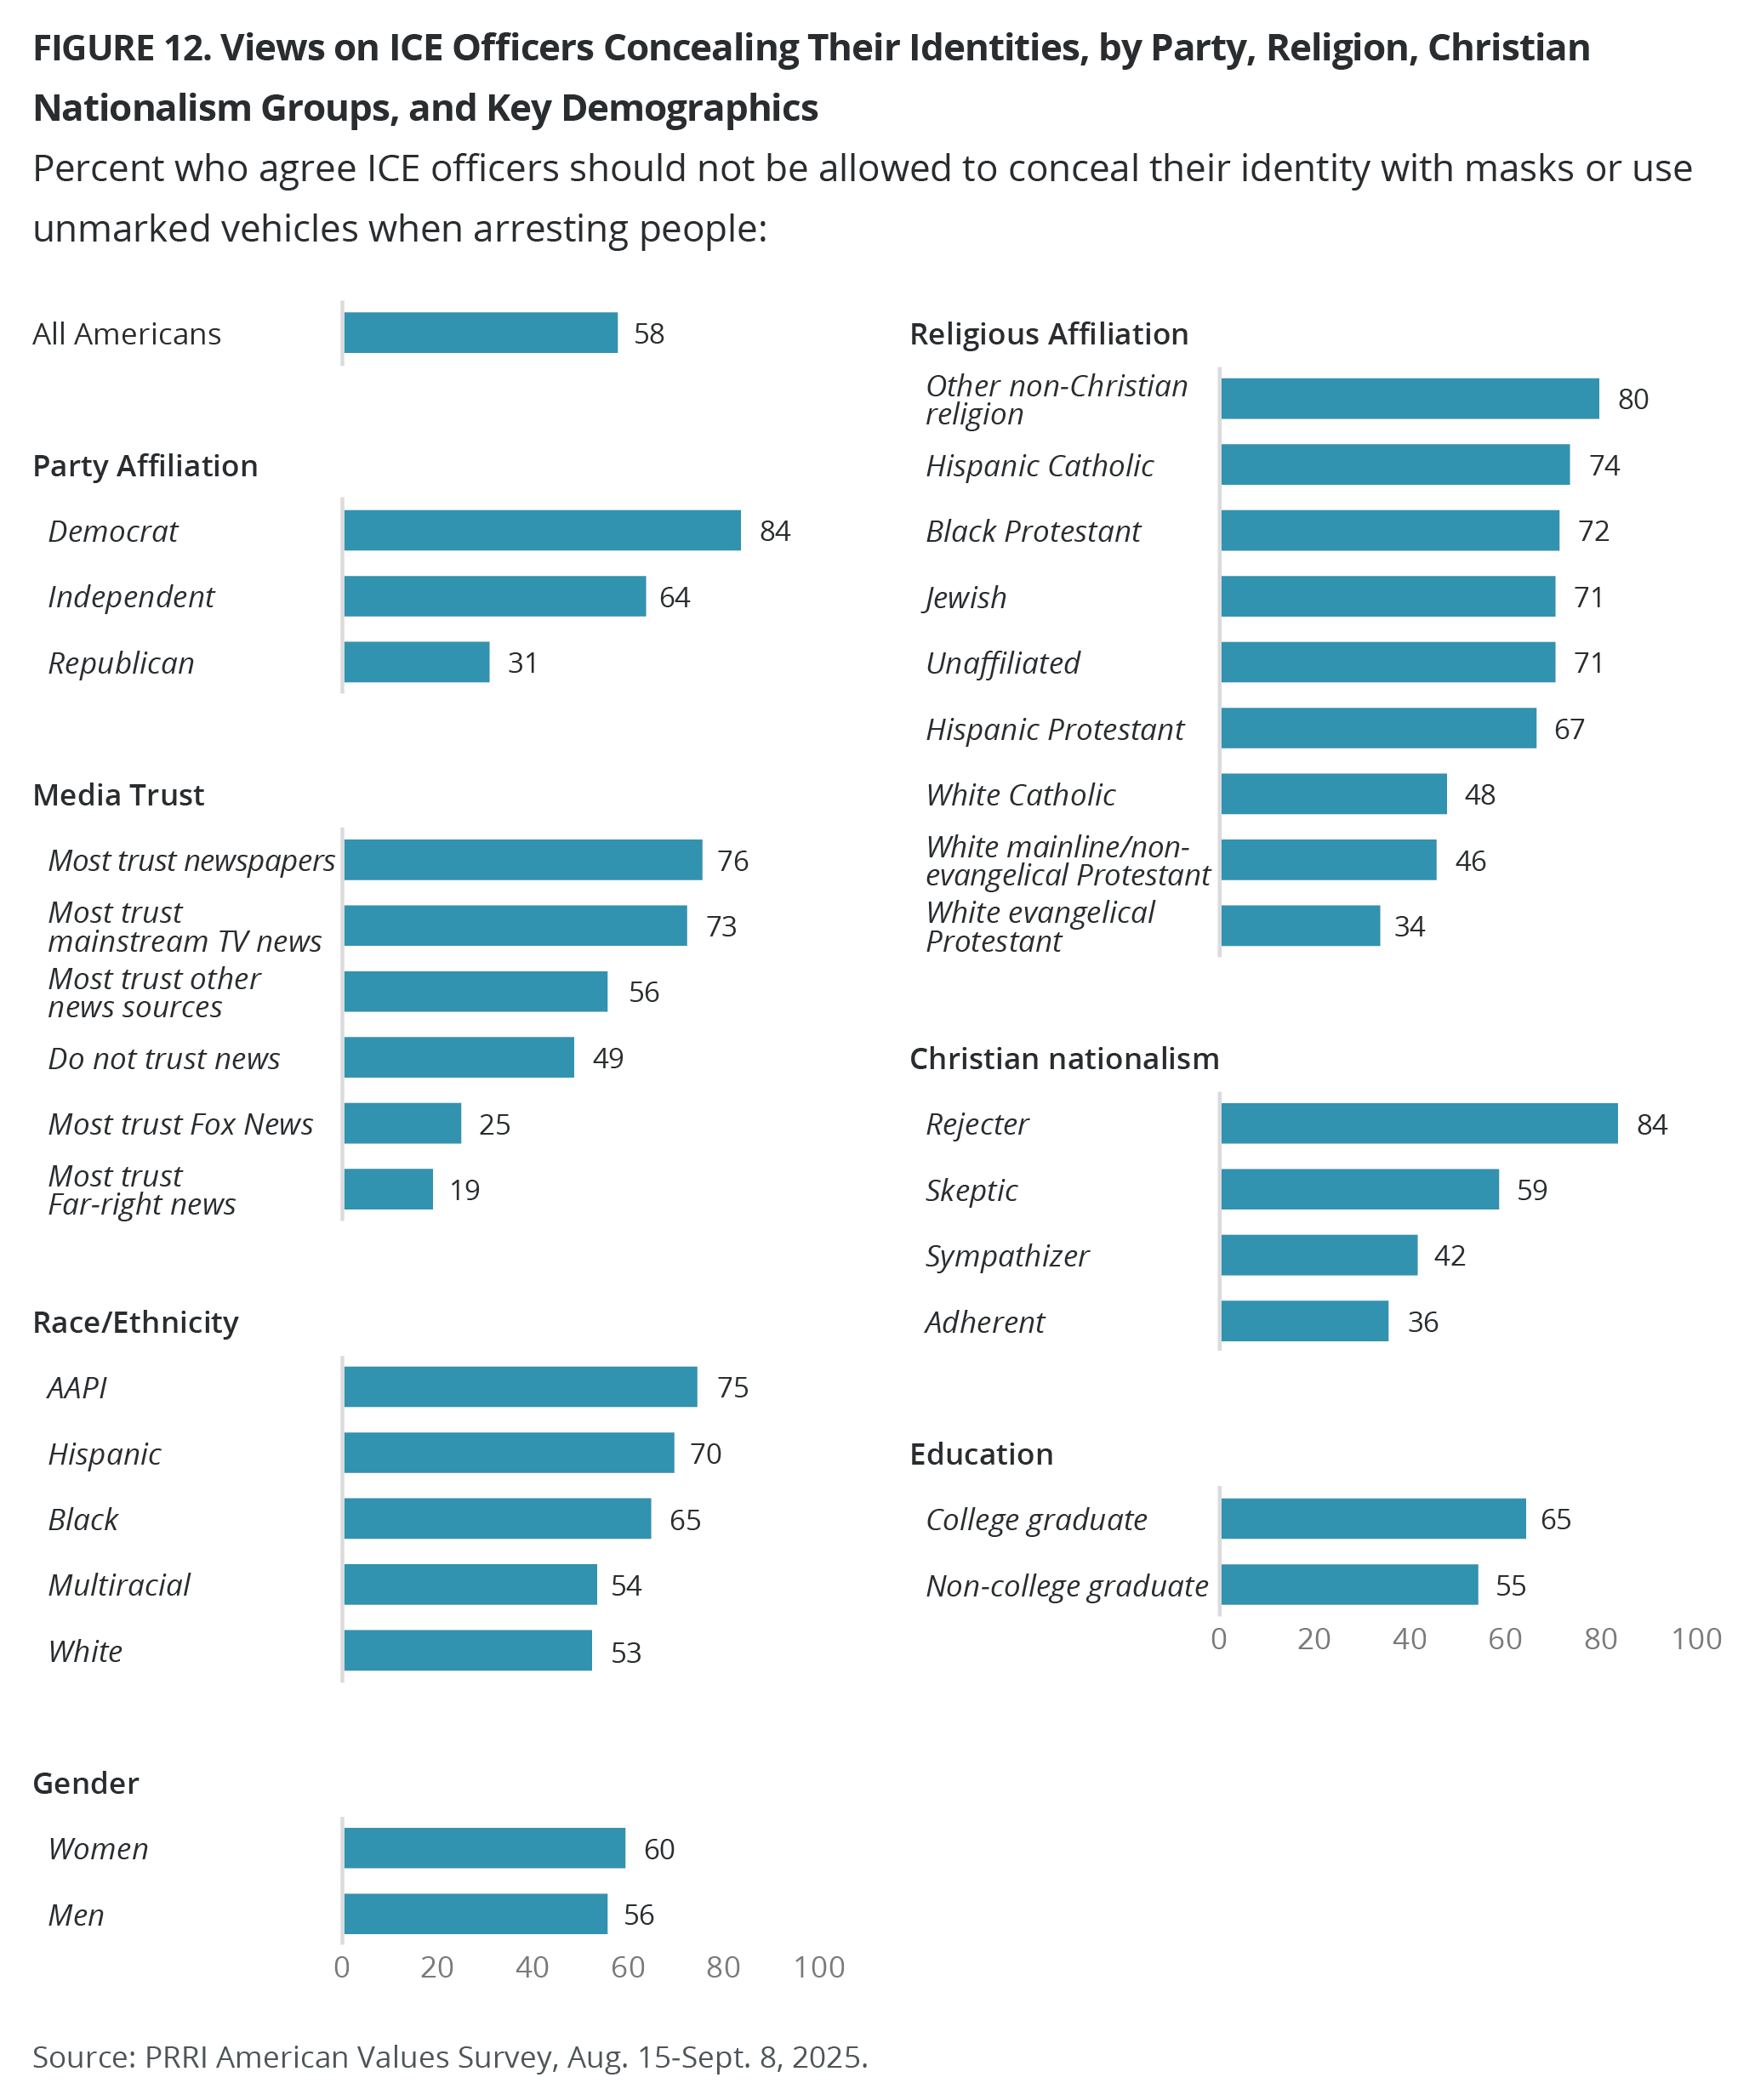
Prohibiting ICE Officers From Concealing Their Identities
Nearly six in ten Americans (58%) agree that “Immigration and Customs Enforcement (ICE) officers should not be allowed to conceal their identity with masks or use unmarked vehicles when arresting people,” including most Democrats (84%) and independents (64%), compared with just three in ten Republicans.
Around 75% of Americans who most trust newspapers and mainstream TV news agree that ICE officers should not be allowed to conceal their identity with masks or use unmarked vehicles when arresting people. However, far fewer Americans who most trust Fox News (35%) and far-right news outlets (19%) agree. Those who do not trust the news at all are split.
Except for white Christian groups, majorities of other religious Americans and the religiously unaffiliated agree that ICE officers should not be allowed to conceal their identity with masks or use unmarked vehicles during arrests, including eight in ten non-Christians and roughly seven in ten Hispanic Catholics, Black Protestants, Jewish Americans, and unaffiliated Americans, and 67% of Hispanic Protestants. Around half of white Catholics (48%) and white mainline/ non-evangelical Protestants (46%); just 34% of white evangelical Protestants agree.
Most Christian nationalism Rejecters (84%) and Skeptics (59%) agree that ICE should not be allowed to conceal their identity, compared with 42% of Sympathizers and 36% of Adherents.
Americans of color, college graduates, and women are more likely than white Americans and multiracial Americans, as well as non-college graduates and men, to agree that ICE officers should not be allowed to conceal their identities.
Arresting and Detaining Undocumented Immigrants Without Criminal Record
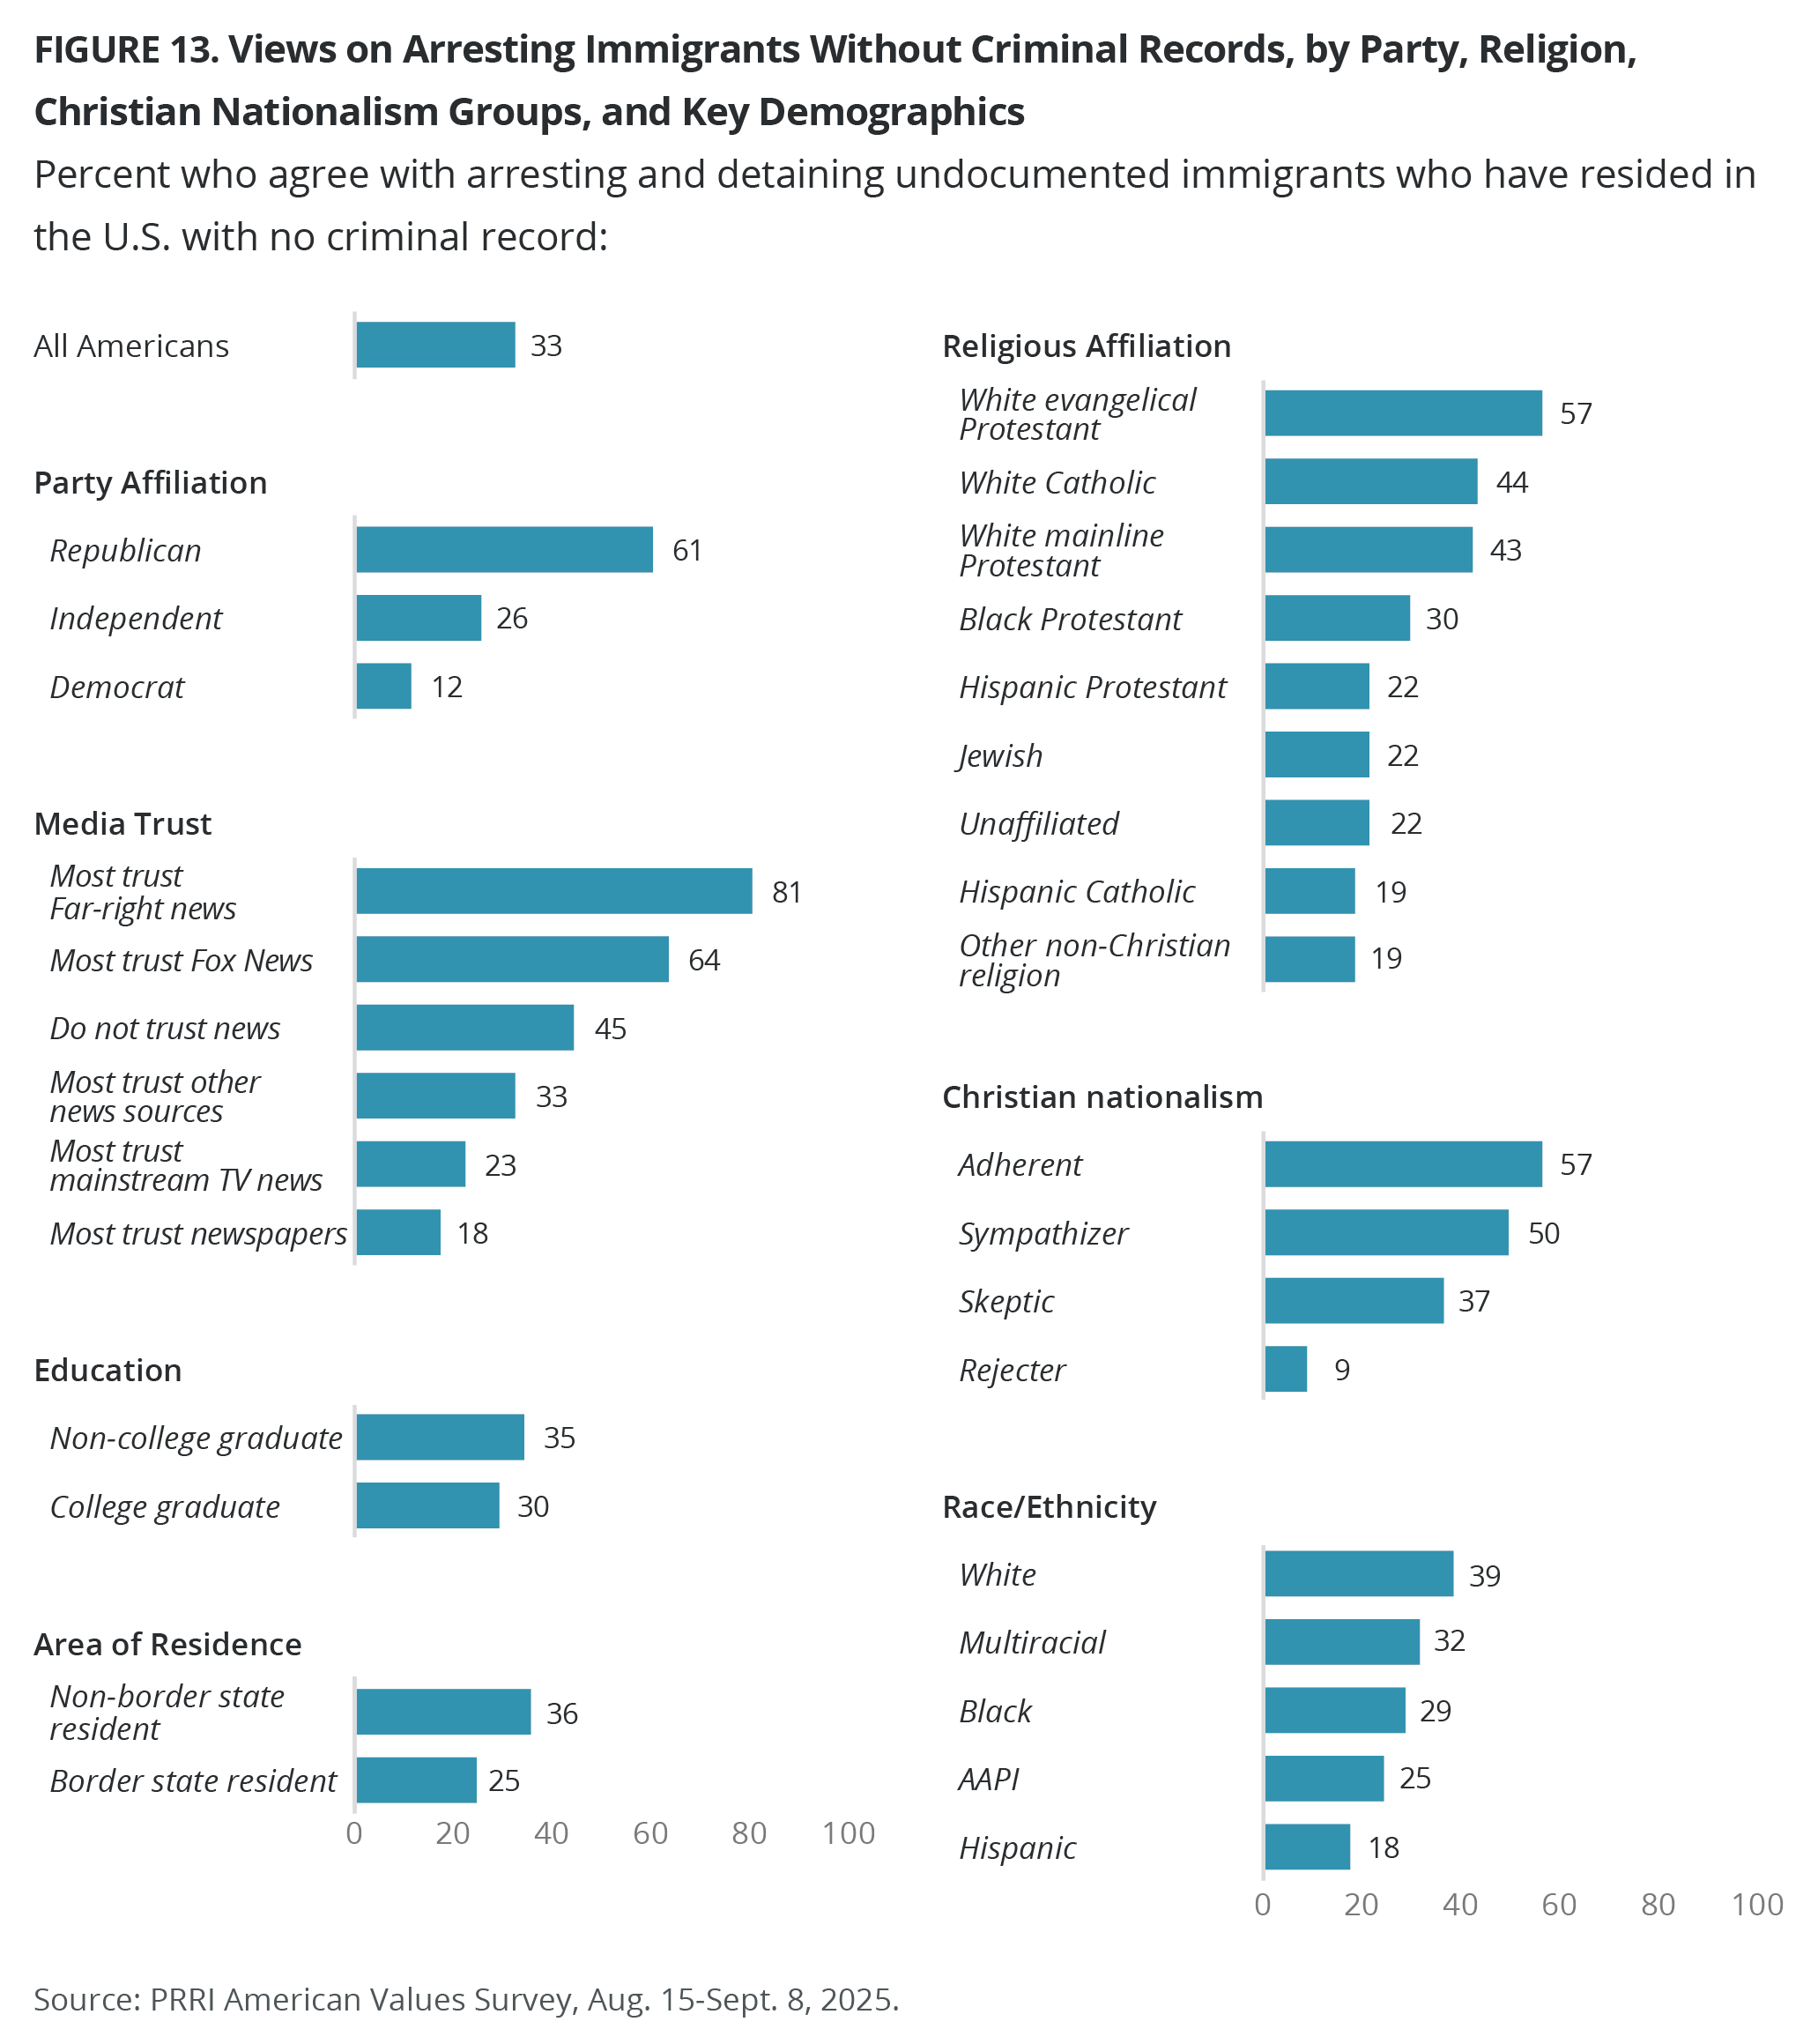
One-third of Americans (33%) favor arresting and detaining undocumented immigrants who have resided in the United States with no criminal record, compared with 63% who oppose. Most Republicans (61%) favor this policy, compared with 26% of independents and 12% of Democrats.
A solid majority of those who most trust far-right news (81%) support arresting and detaining undocumented immigrants with no criminal record, followed by those who most trust Fox News (64%). Far fewer Americans who most trust other sources support it.
Except for white evangelical Protestants (57%), around four in ten or fewer of all other religious groups support this policy. Most Christian nationalism Adherents (57%) and half of Sympathizers (50%) support arresting and detaining undocumented immigrants with no criminal record, compared with 37% of Skeptics and just 9% of Rejecters.
While few Americans across all racial groups, education, and gender support arresting and detaining undocumented immigrants who are residing in the United States with no criminal record, white Americans, Americans without a college education, and men are more likely to do so than Americans of color, Americans with a college education, and women.
Americans in border states are also less likely than Americans who live elsewhere to agree (25% vs. 36%, respectively).
Internment Camps for Undocumented Immigrants
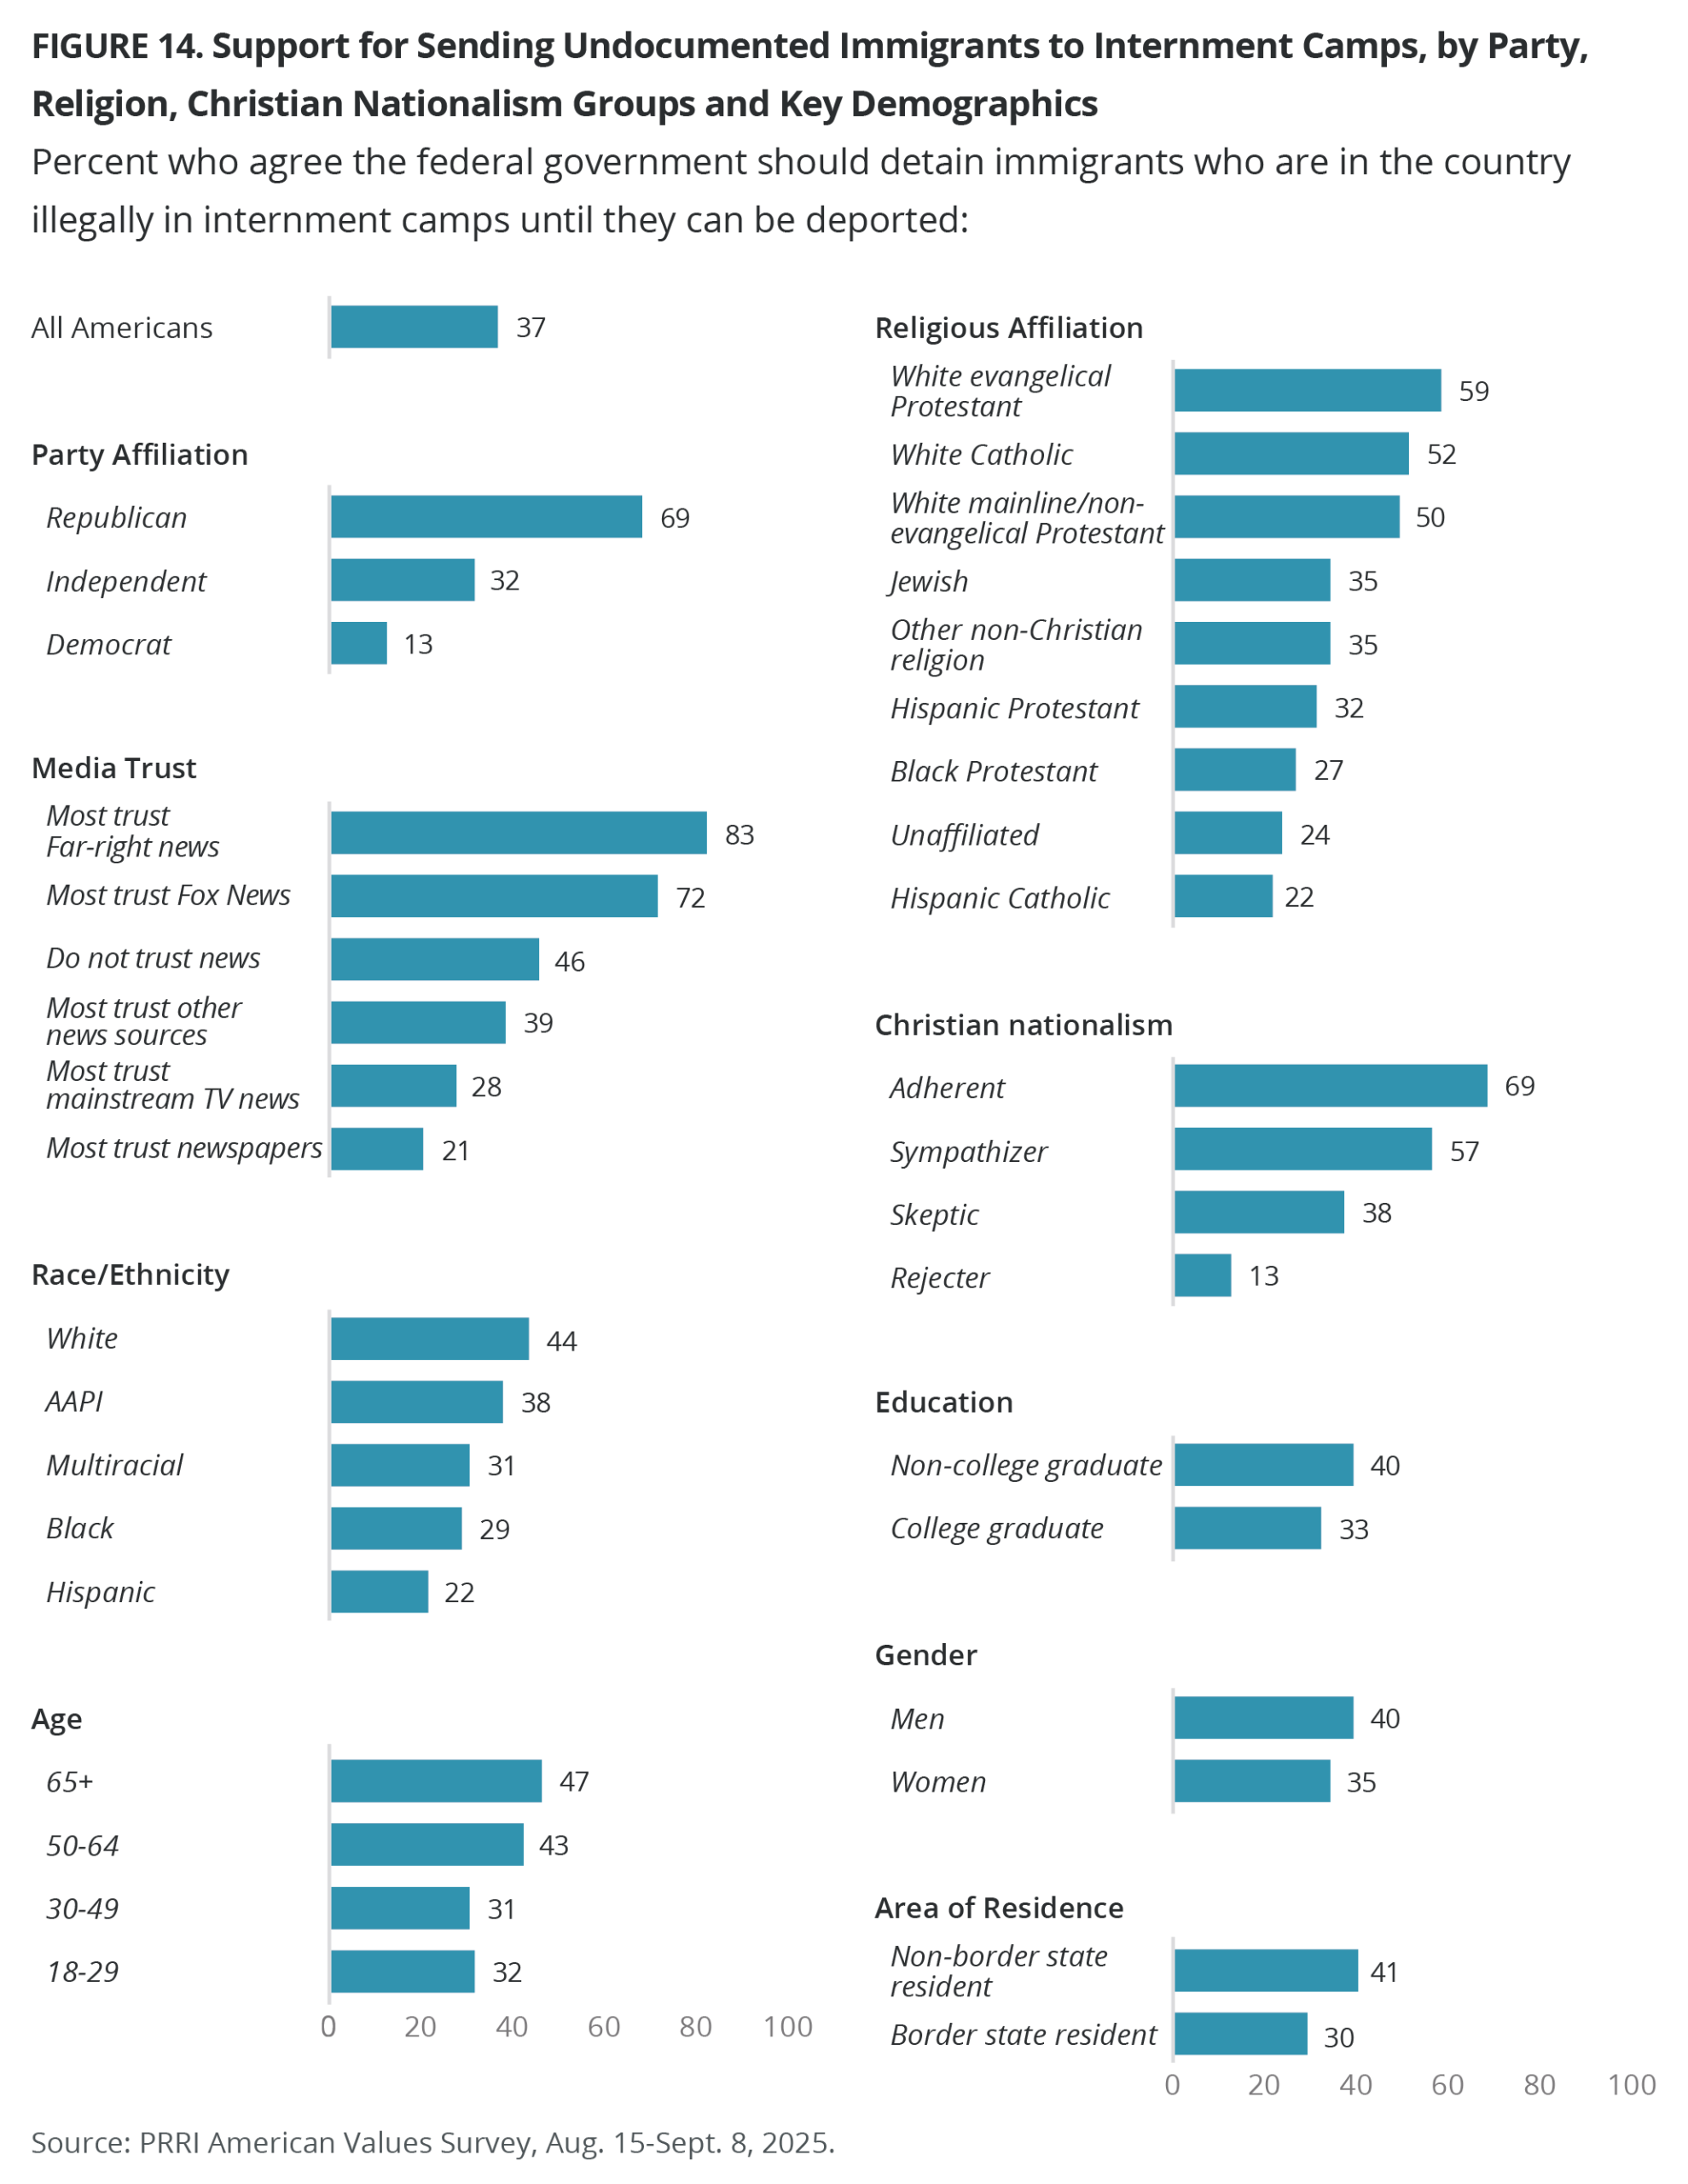
Over one-third of Americans (37%) agree that the federal government should detain immigrants who are in the country illegally in internment camps until they can be deported (58% disagree), though Republicans (69%) are more than five times as likely as Democrats (13%) to agree. Just one-third of independents agree (32%).
Though vast majorities of both who most trust far-right news outlets and those who most trust Fox News support internment camps for immigrants, the former are significantly more likely to do so (83% vs. 72%, respectively). However, those who most trust mainstream news or other sources, and those who do not trust news at all, are much less supportive of this policy.
Nearly six in ten white evangelical Protestants (59%) agree that undocumented immigrants should be placed in internment camps until they can be deported, compared with half of white Catholics (52%) and white mainline/non-evangelical Protestants (50%). Agreement with this policy drops to roughly one-third or fewer members of other religious groups. Most Christian nationalism Adherents (69%) and Sympathizers (57%) agree that undocumented immigrants should be placed in internment camps, compared with 38% of Skeptics and just 13% of Rejecters.
While no racial group reaches majority support for sending undocumented immigrants to internment camps, white Americans report the highest agreement at 44%. College graduates and women are less likely than non-college graduates and men to agree. The widest age gap is between Americans younger than 30 (33%) and Americans aged 65 and older (47%) in terms of support for detaining immigrants in the country illegally in internment camps.
Americans in border states are 11 percentage points less likely than Americans who live elsewhere to favor support for sending undocumented immigrants to internment camps (30% vs. 41%).
Deportation to Foreign Prisons Without Due Process
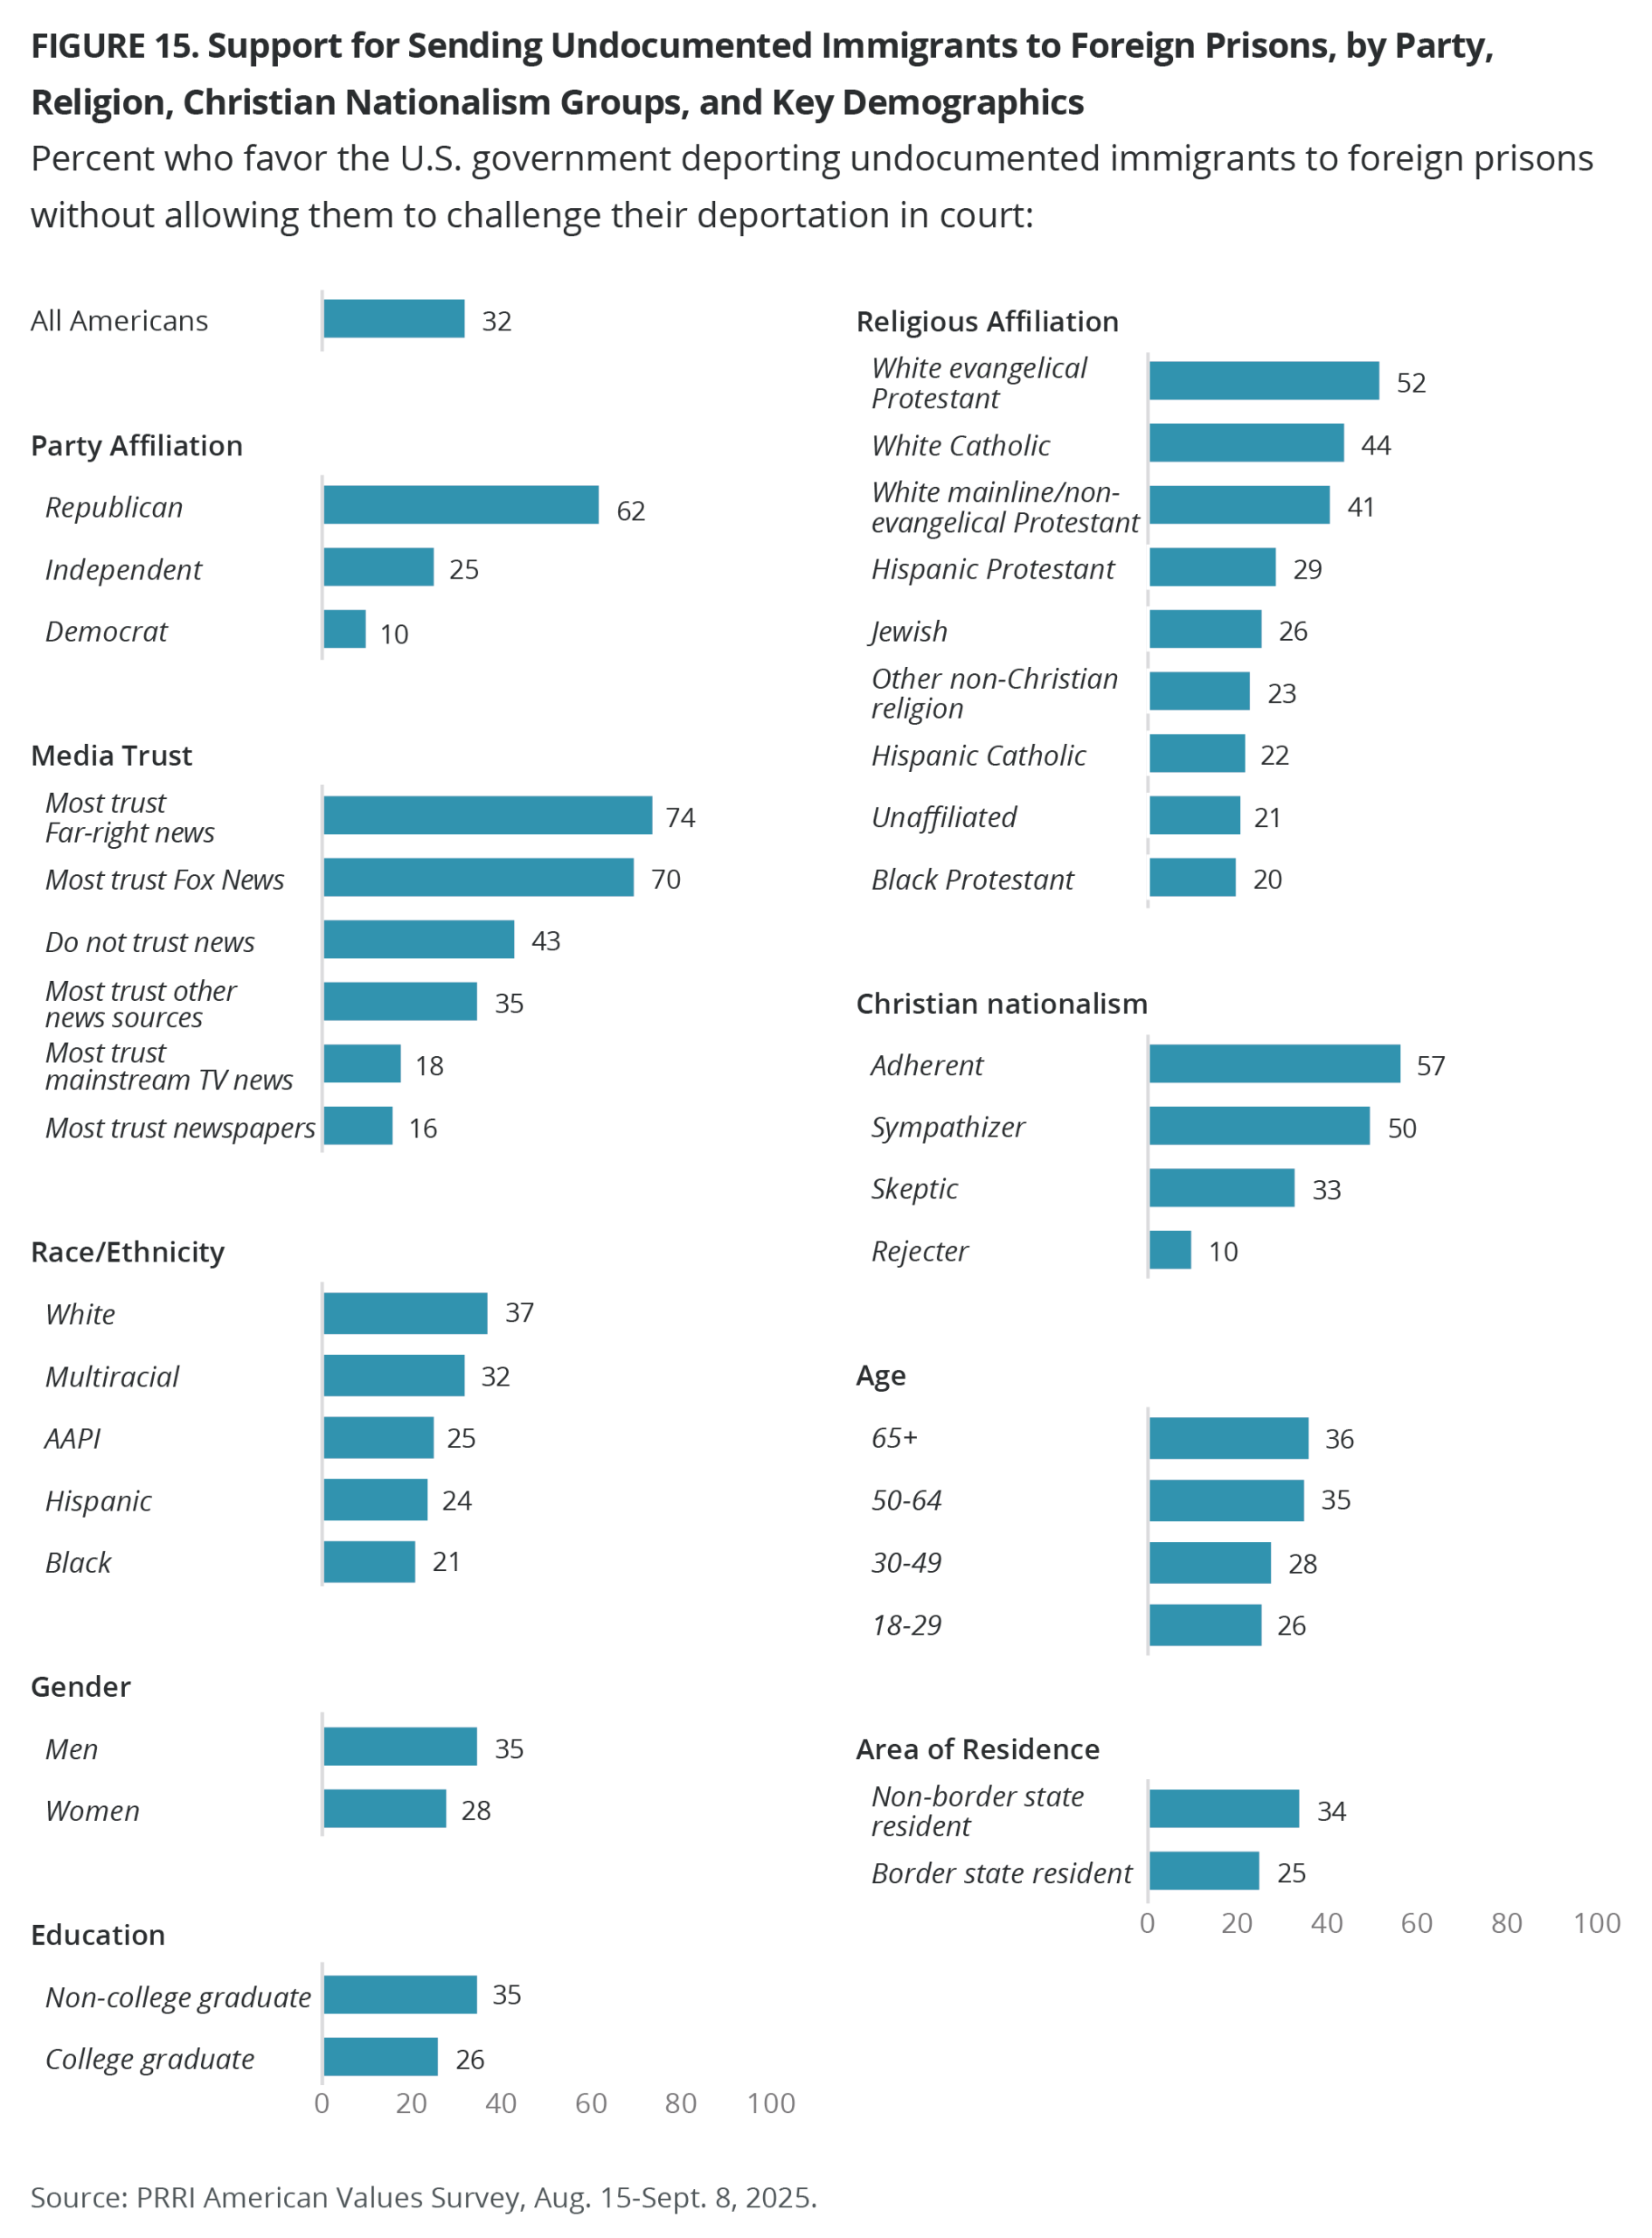
One-third of Americans (32%) favor the U.S. government deporting undocumented immigrants to foreign prisons in El Salvador, Rwanda, or Libya without allowing them to challenge their deportation in court, while 65% oppose. Partisan views differ: 62% of Republicans favor this policy but have become less likely to do so since the question was first asked last May (from 78%). Support among independents has also declined, from 35% to 25%, while Democrats’ support remains unchanged (10%).
Most Americans who most trust far-right news sources (74%) and Fox News (70%) favor deporting undocumented immigrants without due process, compared with far fewer of those who most trust mainstream or other news sources, or do not trust news at all.
White evangelical Protestants (52%) are the only religious group with majority support for deporting undocumented immigrants to foreign prisons without due process. Nearly six in ten Americans who qualify as Christian nationalism Adherents (57%) and half of Sympathizers (50%) also favor deporting undocumented immigrants to foreign prisons without due process, compared with one-third of Skeptics (33%) and just 10% of Rejecters.
White Americans (37%) are the most likely out of any racial group to favor deportation to foreign prisons. This is followed by multiracial Americans (32%). Around one in five members of every other racial group support this policy.
Additionally, college graduates are significantly less likely than non-college graduates to favor this policy, while women are less likely to favor it than men. Support for deporting undocumented immigrants to foreign prisons without due process generally increases with age.
Americans in border states are also less likely than Americans who live elsewhere to favor deportations to foreign prisons (25% vs. 34%, respectively).
Drivers of Americans’ Views on Immigration Policy
To understand the drivers of support for the Trump administration’s restrictive immigration agenda, PRRI developed a comprehensive scale by combining responses to eight questions. Those responses measured support for the following policies:
- Arresting and detaining undocumented immigrants who have resided in the United States with no criminal record.
- Detaining immigrants who are in the country illegally in internment camps until they can be deported.
- Deporting undocumented immigrants to foreign prisons in El Salvador, Rwanda, or Libya, without allowing them to challenge their deportation in court.
- Allowing ICE officers to conceal their identity with masks or use unmarked vehicles when arresting people.
The responses also measured opposition to the following policies or disagreement with the following statements:
- The U.S. Constitution’s existing guarantee that all children who are born in the United States are automatically granted U.S. citizenship, regardless of their parents’ citizenship status.
- Allowing undocumented immigrants a way to become citizens provided they meet certain requirements
- Allowing immigrants brought illegally to the U.S. as children to gain legal resident status.
- Immigrants, regardless of legal status, should have basic rights and protections such as the ability to challenge their deportation before a judge in court.
The answers across all eight questions are highly correlated, with a Cronbach’s alpha of 0.92, indicating high reliability.
The immigration scale combines answers to these questions using an additive scale and recalibrates the scores to values from 0 (low) to 1 (high). Each respondent is given a composite score based on their answer, with higher scores representing stronger support for restrictive immigration policies and lower scores representing stronger opposition. Analysis of this scale reveals that 40% of Americans strongly oppose these policies, 26% oppose these policies, 21% favor these policies, and just 10% strongly favor these policies.
Americans who most trust far-right news (81%) and Fox News (71%), Republicans (63%), Christian nationalism Adherents (57%), and white evangelical Protestants (55%) are the most likely to strongly favor or favor Trump’s immigration agenda. In addition, majorities of those who approve of Trump’s handling of immigration (63%), those who have confidence in ICE (61%), and those who disagree with the idea that immigrants strengthen American society (58%), not surprisingly, also strongly favor or favor Trump’s immigration agenda.
We use multivariate regression analysis to further understand which Americans are the most likely to support Trump’s immigration agenda (see Appendix A for full regression model output) after controlling for a range of political and socioeconomic characteristics, such as partisanship, Trump’s job approval on immigration, confidence in ICE, immigration as a critical issue, media trust, religious affiliation, church attendance, perceptions of family economy, household income, education, gender, age, marital status, whether respondents are parents or not, residents living in border states, and attitudes toward immigrants, previously found to be associated with attitudes toward immigration policy.[4] In addition, we add Christian nationalism groups to the model.[5] For ease of interpretation, we combined those who strongly favor and favor these policies and recoded them as 1 and as 0 for everyone else. As the analysis below demonstrates, the factors predicting support for Trump’s immigration agenda differs significantly across five key dimensions.[6]
Politics and Media Trust
Americans who approve of Trump’s handling of immigration are about five times as likely as those who disapprove to support his immigration agenda. Likewise, Republicans, those with confidence in ICE, and those who view immigration as a critical issue are each at least twice as likely as their counterparts (Democrats, those without confidence in ICE, and those who do not see immigration as critical) to support Trump’s immigration agenda. Media trust also matters: Americans who most trust far-right TV news, Fox News, and other media sources are at least twice as likely as those who most trust mainstream TV news to support anti-immigration policies.
Religious Affiliation, Attendance, and Christian Nationalism
Only Hispanic Catholics and Hispanic Protestants are less likely than unaffiliated Americans to support Trump’s immigration policies. All other religious groups do not differ significantly from unaffiliated Americans, nor do those who attend religious services at least once a week or once a month differ from those who seldom or never attend. However, Christian nationalism Adherents, Sympathizers, and Skeptics are each twice as likely as Rejecters to support Trump’s immigration agenda.
Cultural Anxieties and American Identity
When examining attitudes toward immigrants and how they relate to immigration policy, the pattern is clear: Americans who disagree that immigrants strengthen American society are about three times as likely to support Trump’s immigration policies as those who agree that immigrants strengthen American society. Similarly, believing that being born in America is important to being truly American is a strong predictor of support for Trump’s immigration agenda.
Economic Anxieties
Contrary to prior research that links economic insecurity to anti-immigrant sentiment, we find the opposite pattern: Americans who are very concerned that their families will not be able to pay for housing and basic living expenses over the next year are less likely to support Trump’s immigration agenda, after controlling for partisanship and related attitudes. Additional analyses by partisans show the relationship between economic anxiety and lower support for Trump’s immigration agenda is significant among Republicans but not among Democrats. These findings suggest that people are reading the economy through a partisan lens. In turn, those partisan economic perceptions spill over into how they judge immigration policy.
Demographic Factors
Women, married Americans, and Americans who live in border states are less likely than men, single Americans, and those who do not live in border states to support Trump’s immigration agenda.
[1] The number of cases for AAPI, multiracial Americans, Hispanic Protestants, and Jewish Americans is too small to report on this measure.
[2] To measure Christian nationalism, PRRI used a battery of five questions based on respondents’ answers to (1) The U.S. government should declare America a Christian nation, (2) U.S. laws should be based on Christian values, (3) If the U.S. moves away from our Christian foundations, we will not have a country anymore, (4) Being Christian is an important part of being truly American, and (5) God has called Christians to exercise dominion over all areas of American society. Each respondent receives a composite score on the Christian nationalism scale (with a range of 0 to 1) and is then assigned to one of the four groups. For more information about how measures are constructed and Christian nationalism more generally, please see our previous reports: A Christian Nation? Understanding the Threat of Christian Nationalism to American Democracy, Support for Christian Nationalism in All 50 States: Findings from PRRI’s 2023 American Values Atlas, and Christian Nationalism Across All 50 States: Insights from PRRI’s 2024 American Values Atlas.
[3] Other media sources include those who most trust social media, YouTube and podcasts, radio, and other sources.
[4] Because the immigration and border approval items were asked on split samples, we combined responses to both questions to maximize sample size and estimate overall Americans’ approval of Trump’s job handling immigration.
[5] Adding Christian nationalism categories to the model does not change the overall results; the key findings remain consistent. We also ran robustness checks: “Speaking English as important to American identity” does not yield a significant effect, and substituting support for the Great Replacement Theory — the idea that immigrants are invading our country and replacing our cultural and ethnic background — as an alternative measure of attitudes toward immigrants produces virtually identical results. In short, the findings are stable whether the model includes support for the Great Replacement Theory or disagreement that immigrants strengthen American society.
[6] Because odds ratios can be difficult to interpret, we provide simplified descriptions of their effects to make the results more accessible to readers.
APPENDIX A. Survey Methodology
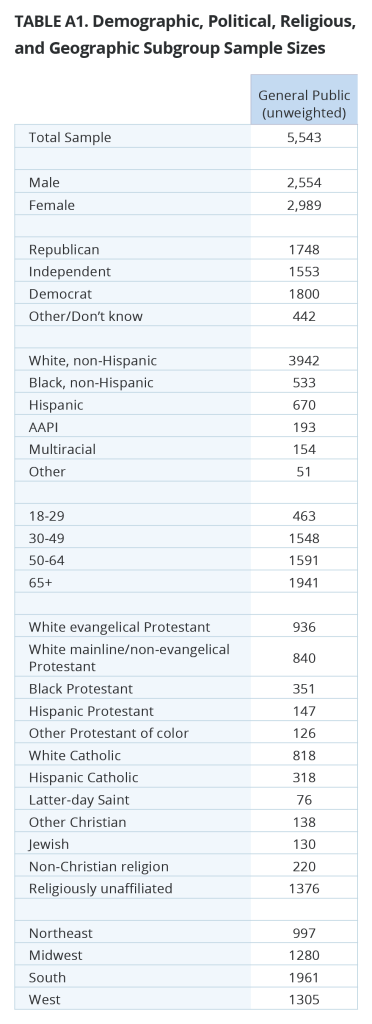
The survey was designed and conducted by PRRI. The survey was made possible through the generous support of the Carnegie Corporation of New York, with additional support from the Ford Foundation, and the Unitarian Universalist Veatch Program at Shelter Rock. The survey was conducted among a representative sample of 5,543 adults (age 18 and up) living in all 50 states in the United States, who are part of Ipsos’s KnowledgePanel, and an additional 412 who were recruited by Ipsos using opt-in survey panels to increase the sample sizes in smaller states. Interviews were conducted online between August 15-September 8, 2025.
Respondents are recruited to the KnowledgePanel using an address-based sampling methodology from the Delivery Sequence File of the USPS – a database with full coverage of all delivery addresses in the U.S. As such, it covers all households regardless of their phone status, providing a representative online sample. Unlike opt-in panels, households are not permitted to “self-select” into the panel, and are generally limited to how many surveys they can take within a given time period.
The initial sample drawn from the KnowledgePanel was adjusted using pre-stratification weights so that it approximates the adult U.S. population. Next, a probability proportional to size (PPS) sampling scheme was used to select a representative sample.
To reduce the effects of any non-response bias, a post-stratification adjustment was applied. The needed benchmarks were obtained from the latest March 2024 supplement of the Current Population Survey (CPS), except language proficiency, which is not available from CPS, and was obtained from the 2023 American Community Survey (ACS). Additionally, the 2024 vote choice benchmark was obtained from the Associated Press Tabulation of Certified Results. The post-stratification weight rebalanced the sample based on the following benchmarks: gender by age, race/ethnicity, education, income, language proficiency, Census region by metropolitan status, and 2024 presidential vote choice. Additionally, we included individual states (50 states plus D.C.) to account for the oversampling of some states.
The margin of error for the national survey is +/- 1.79 percentage points at the 95% level of confidence, including the design effect for the survey of 1.84. In addition to sampling error, surveys may also be subject to error or bias due to question wording, context, and order effects. Additional details about the KnowledgePanel can be found on the Ipsos website: https://www.ipsos.com/en-us/solution/knowledgepanel.