A Renewed Struggle for the American Dream: PRRI 2018 California Workers Survey
Executive Summary
The PRRI 2018 California Workers Survey provides a portrait of the working lives of Californians, via a random probability survey of 3,318 California residents. The survey focuses on how experiences differ by region, race and ethnicity, gender, age, educational status, and other characteristics. Additionally, the survey includes an oversample of those working and struggling with poverty—bringing the total of this group to more than 1,000—and provides insights into their unique experiences, challenges, and aspirations. For the purposes of this study, respondents are classified as “working and struggling with poverty” if they meet two criteria: 1) They are currently employed either full or part-time or are unemployed but still seeking employment; and 2) They live in households that have an adjusted income that is 250% or less than the U.S. Census Bureau’s Supplemental Poverty Measure, adapted for regional location in California.
California Workers and the American Dream
Nearly one-third of all Californians, and nearly half of California workers, are struggling with poverty.
- Among all Californian adults, nearly one-third (31%) are working and struggling with poverty, 36% are working but not struggling with poverty, and 32% are retired, students, or otherwise not working.
- Among California workers, nearly half (47%) are struggling with poverty, while 53% are not.
- A majority (60%) of Californians who are working and struggling with poverty are Hispanic. Compared to all Californians, workers who are struggling with poverty are significantly less likely to be white (42% vs. 21%) or Asian or Pacific Islander (API) (16% vs. 11%), but notably not any more likely to be black (5% vs. 6%).
- More than two-thirds (68%) of the workers in the San Joaquin Valley region are struggling with poverty, as are majorities of workers in the Central Coast (56%) and Sacramento Valley (56%) regions. By contrast, only 27% of the workers in the Bay Area fall into this category.
About one in ten Californians work in the “gig economy.”
About one in ten (11%) Californians report participating in the gig economy in the last year, defined as being paid for performing miscellaneous tasks or providing services for others, such as shopping, delivering household items, assisting with childcare, or driving for a ride-hailing app.
- Workers who are struggling with poverty are about twice as likely as workers who are not struggling to report participating in the gig economy in the last year (17% vs. 9%).
- About half (48%) of those participating in the gig economy are workers struggling with poverty.
Californians are not optimistic about the existence of the American Dream or the California Dream.
- Fewer than half (47%) of Californians believe the American Dream—that if you work hard you will get ahead—still holds true today. A majority believe it once held true but no longer does (43%) or that it never held true (10%).
- Californians are even more pessimistic about the existence of the California Dream, defined as the idea that the American Dream is more attainable in California than in other parts of the country. A majority (55%) of Californians say the American Dream is actually harder to achieve in their state than elsewhere in the United States.
Notably, California workers who are struggling with poverty are less likely than workers who are not struggling to say that the American Dream is harder to achieve in California than in other parts of the U.S. (50% vs. 59%).
- Nearly two-thirds (64%) of Californians say they would advise young people in their communities to leave to find more opportunity elsewhere. Attitudes among the residents of most regions within California are similar to statewide numbers, with two exceptions:
- More than three-quarters (77%) of San Joaquin Valley residents say they would encourage people to leave for better opportunities.
- On the other hand, the Bay Area is the only region in which a majority (54%) of residents say they would encourage young people to stay in the area.
Young Californians less likely to think of a college education as a smart investment in the future.
While more than six in ten (62%) Californians overall believe that a college education is a smart investment in the future, young Californians (ages 18 to 29) are significantly less likely than seniors (ages 65 and older) to believe a college education is a smart investment (51% vs. 66%). Nearly half (46%) of young Californians say that getting a college education is a risky gamble that may not pay off.
Workers who are struggling with poverty are more likely than those who are not to report experiencing a range of economic hardships.
- Putting off seeing a doctor or purchasing medication for financial reasons (42% vs. 16%)
- Having difficulty paying rent or mortgage (37% vs. 16%)
- Being unable to pay a monthly bill (35% vs. 15%)
- Reducing meals or cutting back on food to save money (43% vs. 18%)
Workers who are struggling with poverty are more likely than those who are not to report worrying about affordable housing or say they might not be able to pay for emergency expenses.
- More than half (51%) of Californians are somewhat or very worried that they or someone in their family will be unable to find affordable housing. Workers who are struggling with poverty are substantially more likely than those who are not to say they’re concerned about finding affordable housing (64% vs. 43%).
- A majority (56%) of workers who are struggling with poverty, compared to only 24% of those not struggling, report that it would be at least somewhat difficult to meet a $400 emergency expense.
Contrary to some negative stereotypes, workers struggling with poverty are more likely than those who are not to say they highly value a number of social and economic goals.
Workers who are struggling with poverty are more likely than workers who are not struggling with poverty to say the following are the most important goals in their lives:
- Being a good parent (74% vs. 64%)
- Holding a stable, well-paying job (57% vs. 41%)
- Being involved in a religious community (20% vs. 9%)
The Working Lives of Californians
Californians who are working and struggling with poverty are more likely than workers who are more economically secure to report that they or someone in their household have experienced a variety of negative workplace experiences in the past year.
- Almost six in ten (59%) Californians who are working and struggling with poverty, compared to 46% of workers who are not struggling with poverty, report having at least one negative workplace experience in the past year.
- Californians who are working and struggling with poverty are more likely than those who are not struggling with poverty to report that they or someone in their household has experienced each of these specific negative workplace events in the last year:
- Being injured on the job (24% vs. 11%)
- Experiencing racial discrimination or bias in the workplace (19% vs. 10%)
- Being paid less than the minimum wage (16% vs. 6%)
- Having tips taken by another employee or an employer (12% vs. 5%)
- Experiencing sexual harassment in the workplace (12% vs. 9%)
- Having wages withheld without cause (11% vs. 5%)
- Experiencing sexual assault in the workplace (8% vs. 4%)
- On several wage theft metrics, however, workers who are struggling with poverty report negative experiences at levels that are similar to more economically secure workers.
- More than one-quarter (26%) of both groups report being required to work through their lunch break or receiving no break at all.
- About one in five (17% vs. 18%) respondents in each group report being required to work overtime without being paid for it.
Most California workers feel replaceable.
Two-thirds (67%) of Californians, including 75% of workers who are struggling with poverty, say that employers generally see people like them as replaceable. Hispanic Californians are particularly likely to feel dispensable at work. More than three-quarters (76%) of Hispanic Californians say that employers see people like them as replaceable.
Californians who are working and struggling with poverty tend to believe that the deck is stacked against them economically, but they also see the importance of workers organizing to protect their rights.
- A majority (54%) of Californians, including 65% of workers who are struggling with poverty, believe that hard work and determination are no guarantee of success in life.
- A majority (53%) of those who are working and struggling with poverty agree that there is not much people like them can do to improve their working conditions, compared to about one-third (35%) of workers who are not struggling with poverty.
- Nevertheless, nearly three-quarters (73%) of Californians agree that it is important for workers to organize so that employers do not take advantage of them. Among workers, those who are struggling with poverty are modestly more likely than those who are not struggling with poverty to say that workers organizing is important (80% vs. 70%).
Californians Working and Struggling With Poverty
Definitions
Working and Struggling With Poverty
The PRRI 2018 California Workers Survey provides a portrait of the working lives of California residents, via a random probability survey of 3,318 respondents who live in California, with a focus on how their experiences differ by region, race and ethnicity, gender, age, and educational status among other characteristics. Additionally, the survey includes an oversample of those working and struggling with poverty—bringing the total of this group to more than 1,000—and provides insights into their unique experiences, challenges, and aspirations.
For the purposes of this study, those who said they were currently employed full or part-time, those who are unemployed and on a temporary layoff from a job, or those who are unemployed but still seeking employment are defined as “working.”
In order to define identify those who are “struggling with poverty,” the study uses a poverty threshold for each respondent based on the Census Bureau’s Supplemental Poverty Measure. More specifically, it uses the California Poverty Measure, which adjusts for geographic location within California. Californians living in households with an adjusted income that is 250% or less than their personal poverty threshold are classified as struggling with poverty. For example, if a household has a poverty threshold of $24,000—the threshold of the median respondent in the survey—they would be classified as struggling with poverty if their adjusted income was $60,000 or less. This cutoff is designed to include not only those actively living in poverty at the time of the survey but also those whose economic condition is tenuous.
Respondents meeting these two conditions are classified as working and struggling with poverty. This report also refers to those who are working but not struggling with poverty. These are individuals who are working and whose adjusted household incomes exceeds 250% of their poverty threshold.
Regional Definitions
California contains multitudes. It has the nation’s largest economy, a population of almost 40 million, and occupies more than 160,000 square miles. In order to capture that diversity, the geographic analysis in this report focuses on seven regions within California:1
- Bay Area. Alameda, Contra Costa, Marin, Napa, San Francisco, San Mateo, Santa Clara, Solano, and Sonoma counties.
- Central Coast. Monterey, San Benito, San Luis Obispo, Santa Barbara, Santa Cruz, and Ventura counties.
- Inland Empire. Riverside and San Bernardino counties.
- Los Angeles. Los Angeles county.
- Sacramento Valley. Butte, Colusa, El Dorado, Glenn, Placer, Sacramento, San Joaquin, Shasta, Sutter, Tehama, Yolo, and Yuba counties.
- San Joaquin Valley. Fresno, Kern, Kings, Madera, Merced, Stanislaus, and Tulare counties.
- South Coast and Border. Imperial, Orange, and San Diego counties.
Demographic Profile of Californians Who Are Working and Struggling With Poverty
Among all Californian adults, nearly one-third (31%) are working and struggling with poverty, 36% are working but not struggling with poverty, and 32%2 are not working. Among California workers, nearly half (47%) are struggling with poverty, compared to 53% who are not.
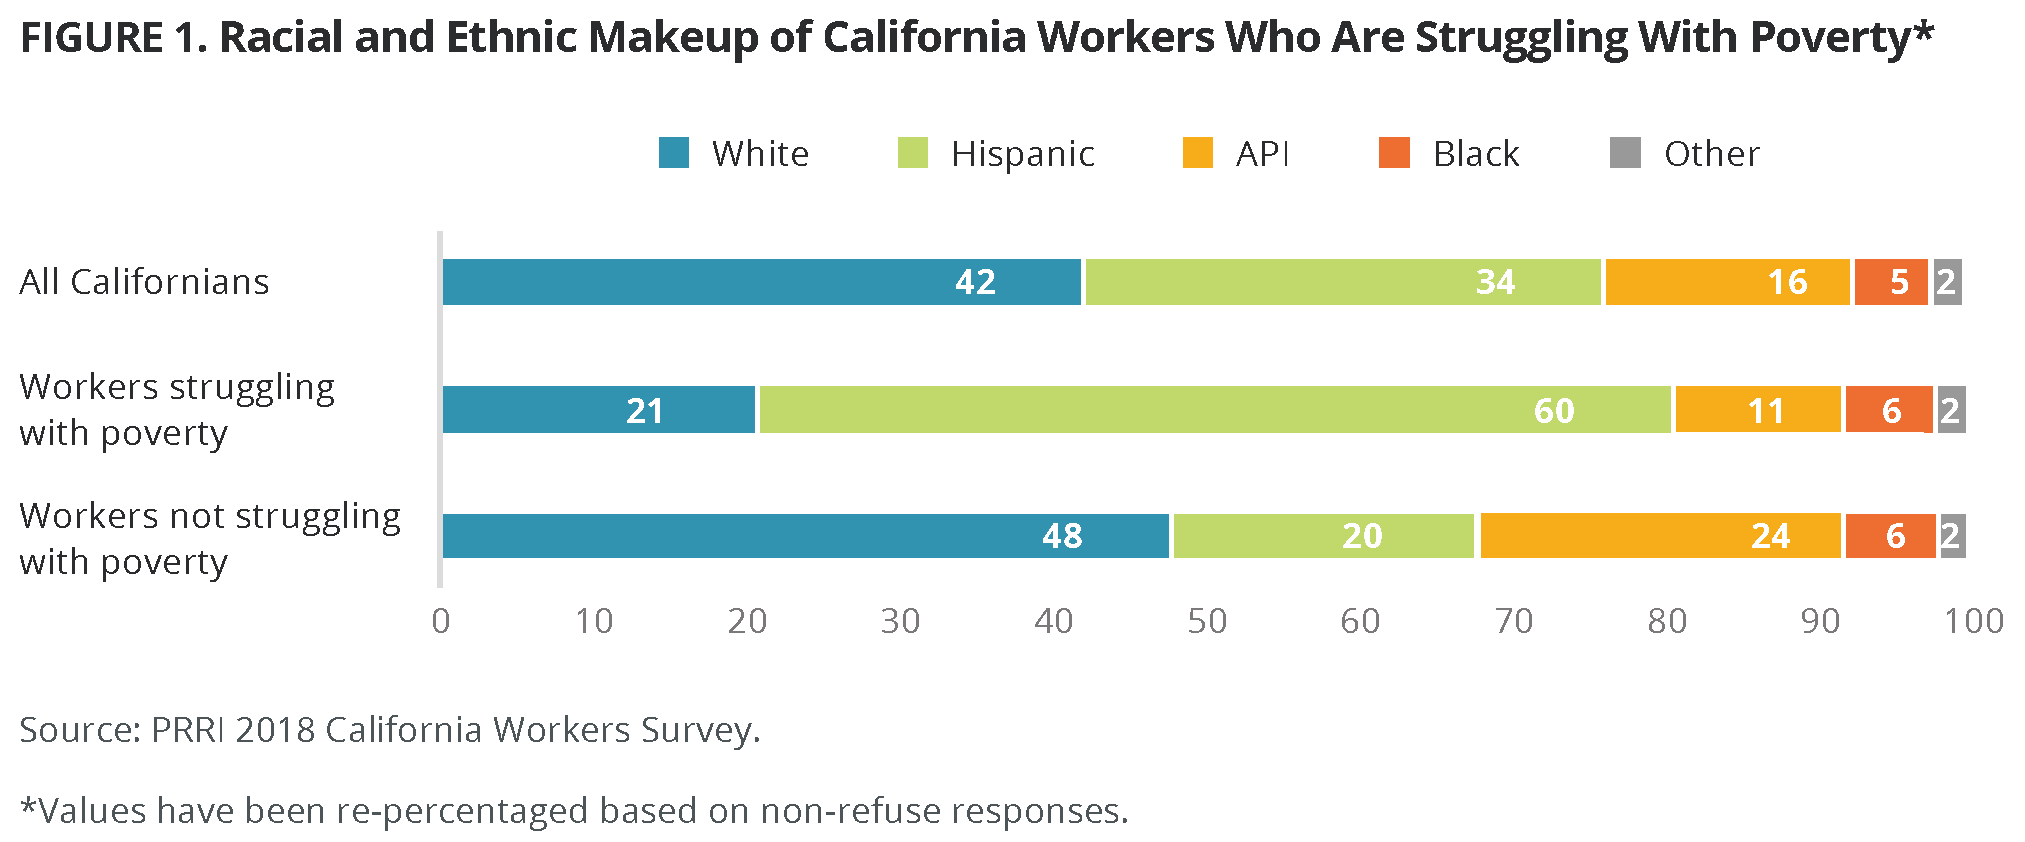
Californians who are working and struggling with poverty are more likely than Californians overall to be Hispanic and less likely to be white3 or Asian or Pacific Islander (API), but notably not more likely to be black. A majority (60%) of Californians who are working and struggling with poverty are Hispanic, compared to about one in three (34%) Californians overall and one in five (20%) of those who are working but not struggling with poverty. Only 21% of workers struggling with poverty are white, but whites make up 42% of Californians overall. Eleven percent of Californians struggling with poverty are API and only six percent are black. Among all Californians, 16% are API and five percent are black.4
California workers struggling with poverty generally have a lower level of education than workers who are not struggling. Nearly nine in ten (88%) workers who are struggling with poverty do not have a four-year college degree, including about six in ten (62%) who have a high school education or less. Statewide, 67% of all residents and 41% of workers who are not struggling with poverty lack a four-year degree. Only about one in ten (12%) economically struggling workers have a four-year college degree, compared to one in three (33%) Californians and almost six in ten (59%) workers who are not economically struggling.
Workers struggling with poverty are also more likely to be young (18 to 29 years old) than Californians overall. One in three (33%) California workers struggling with poverty are young, compared to less than one in five (18%) workers who are not economically struggling.5
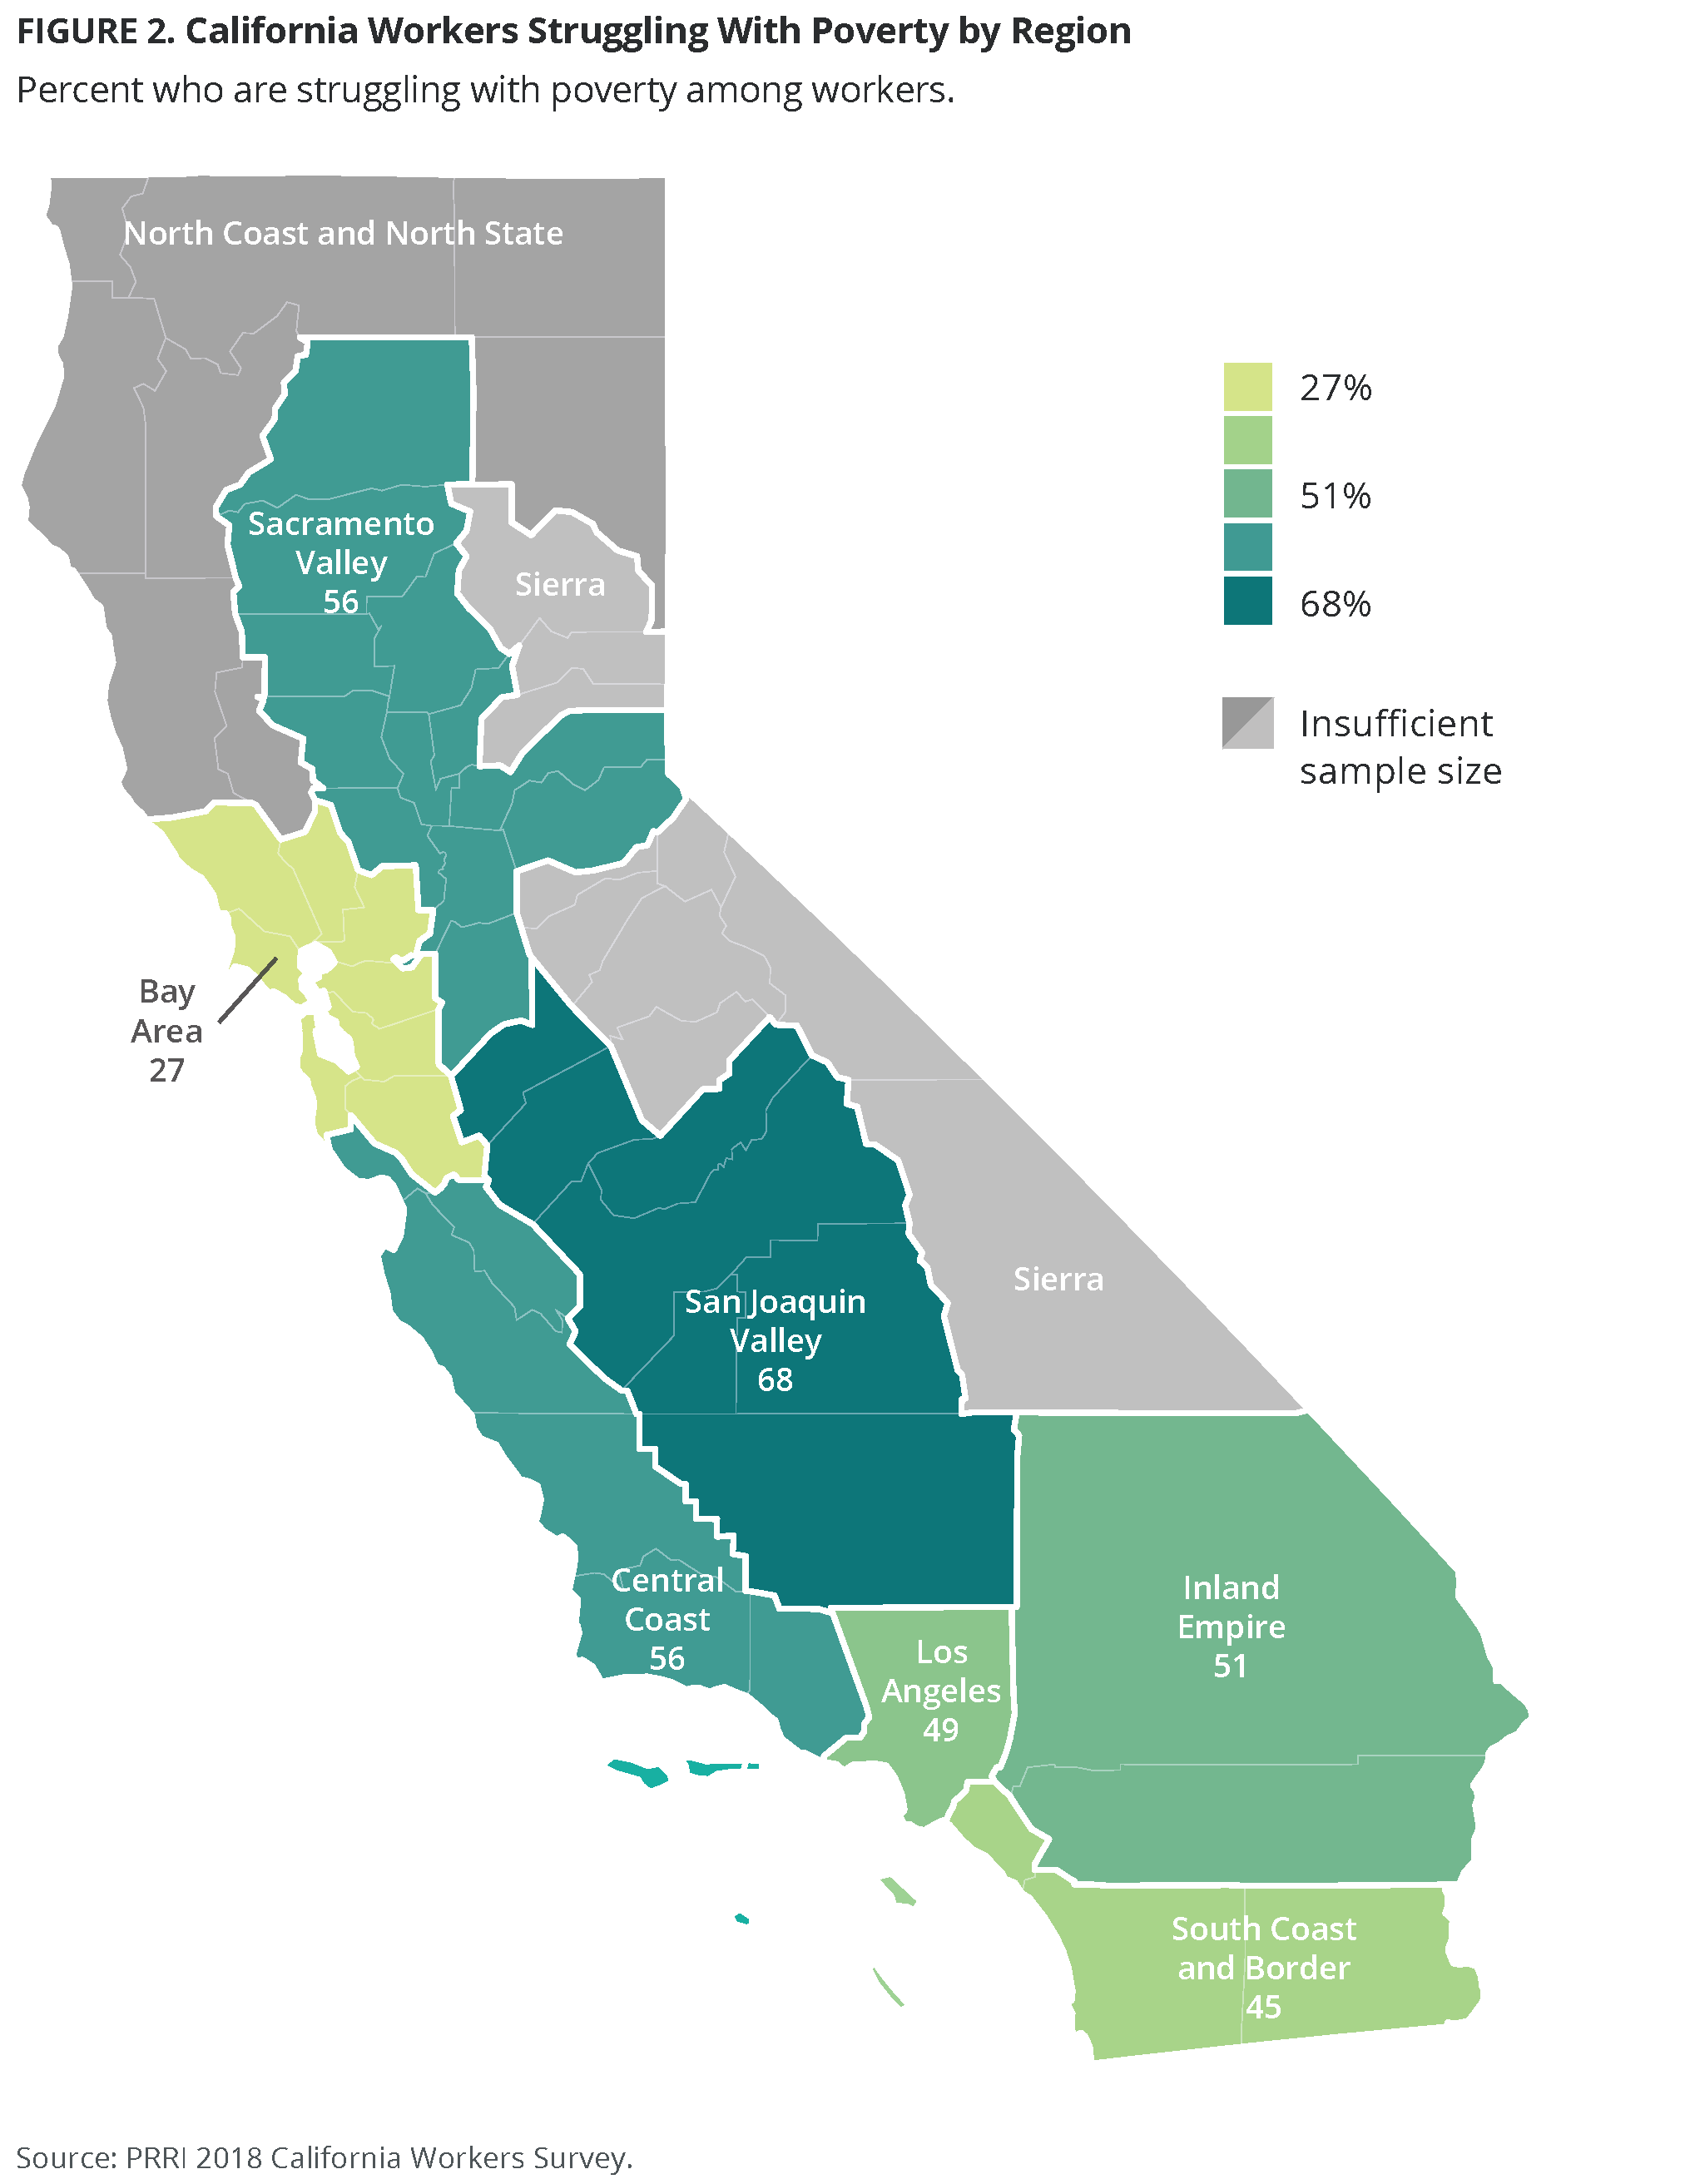
Among California workers, there is also significant regional variation in economic status. More than two-thirds (68%) of the workers in the San Joaquin Valley region are struggling with poverty. In addition, a majority of workers in the Central Coast (56%) and Sacramento Valley (56%) regions and about half of those who live in the Inland Empire (51%), Los Angeles (49%), and South Coast and Border (45%) regions are struggling with poverty. By contrast, only 27% of the workers in the Bay Area region fall into this category.
Views on Economic Opportunity, Efficacy, and Mobility
Belief in the American Dream
Californians, including those who are working but struggling with poverty, are divided over whether the American Dream—the idea that if you work hard, you will get ahead—still holds true today. Nearly half (47%) of California residents say this is still true today, compared to 43% who say that the American Dream once held true but no longer does today, and 10% who say the American Dream <em>never</em> held true. Workers struggling with poverty and workers who are not struggling with poverty are about equally likely to say the American Dream still holds true (45% vs. 49%), that it once held true but does not anymore (43% vs. 41%), or that it never held true (11% vs. 10%).
Men express more confidence than women in the American Dream. A majority (52%) of California men say that the American Dream still holds true, while fewer than four in ten (38%) say that the American Dream once held true but does not anymore. In contrast, only about four in ten (42%) women say that the American Dream still holds true, while nearly half (47%) say it no longer holds true. Ten percent of both Californian men and women say the American Dream never held true.
There is a significant diversity of opinion among Californians from different racial and ethnic groups. A majority (55%) of API Californians and nearly half (49%) of Hispanic residents say the American Dream is still a reality, while fewer white (43%) and black (39%) Californians agree. Nearly half of white (48%) and black (48%) residents say that the American Dream once held true but no longer does, and about one in ten (8% and 13%, respectively) say that the American Dream never held true. The racial and ethnic divide is even larger among those working and struggling with poverty, where Hispanics are 20 percentage points more likely than whites to say the American Dream still holds true (52% vs. 32%).
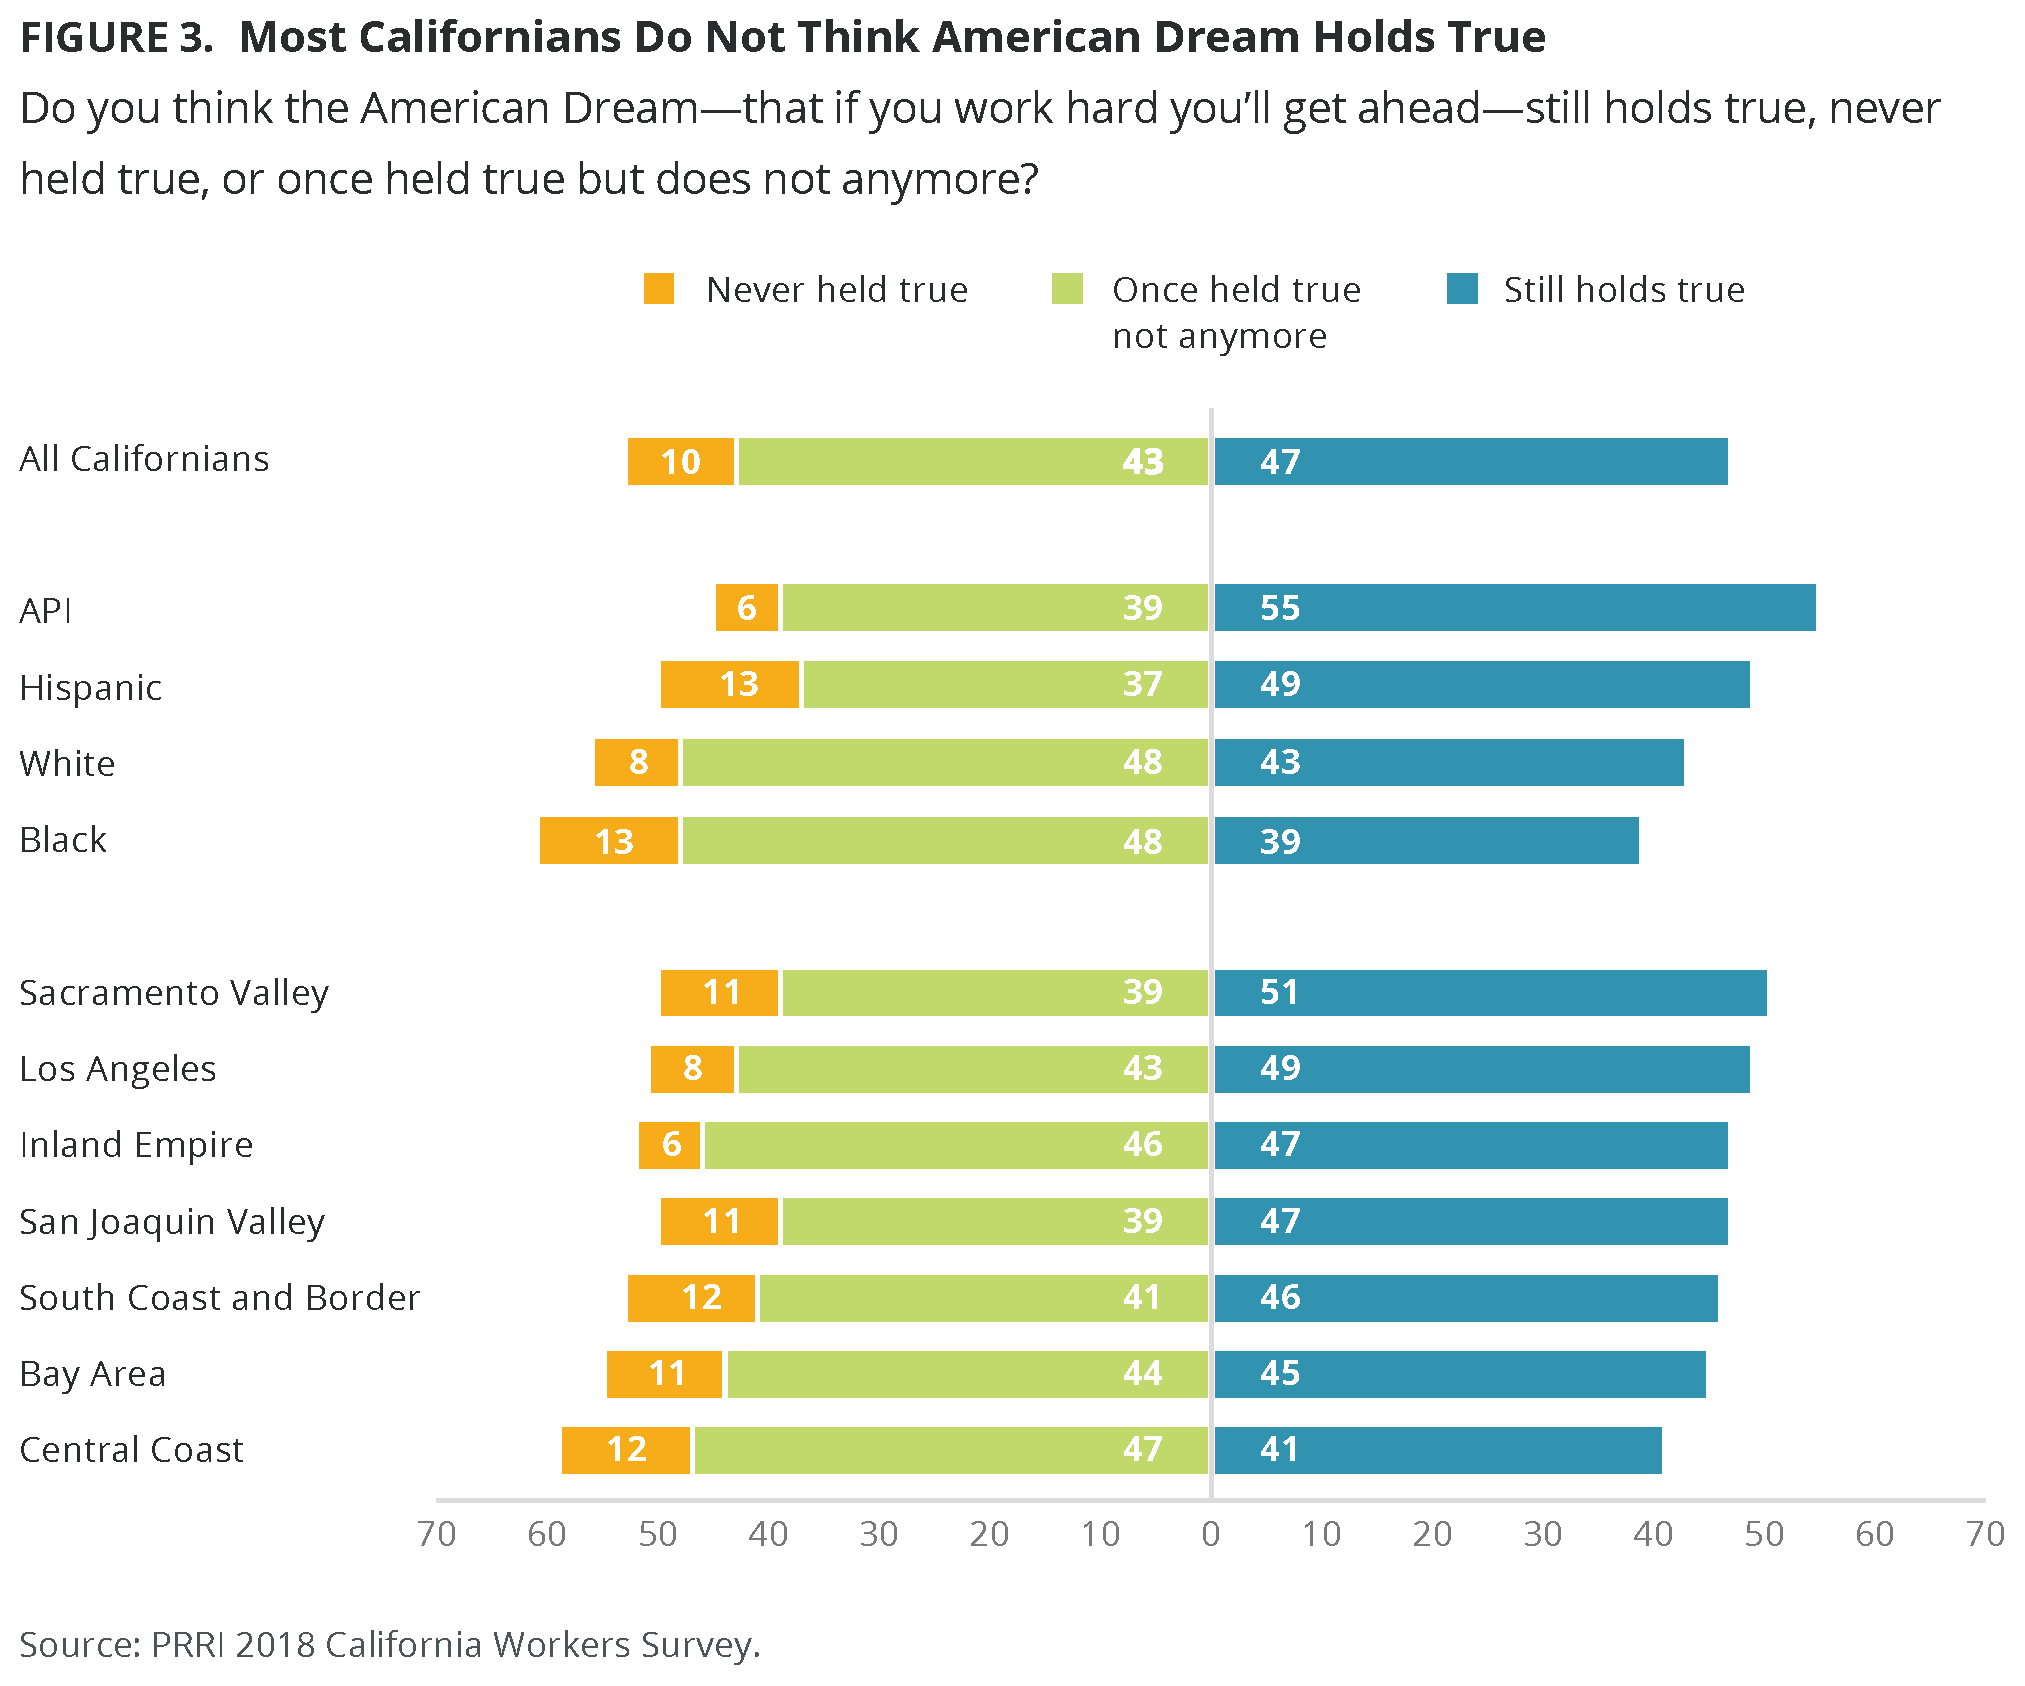
Notably, there are no significant differences of opinion among Californians by age. About half of young California residents (ages 18 to 29) and a similar number of California seniors (ages 65 and older) say the American Dream remains true today (45% vs. 48%).
The California Dream
In addition to the American Dream, Californians also talk about the <em>California Dream</em>. Though the expression has had different meanings throughout the state’s history, a common understanding of the phrase today is that the American Dream—the idea that working hard and playing by the rules will be rewarded with financial security and economic well-being—is more likely to occur in California than elsewhere in the country.
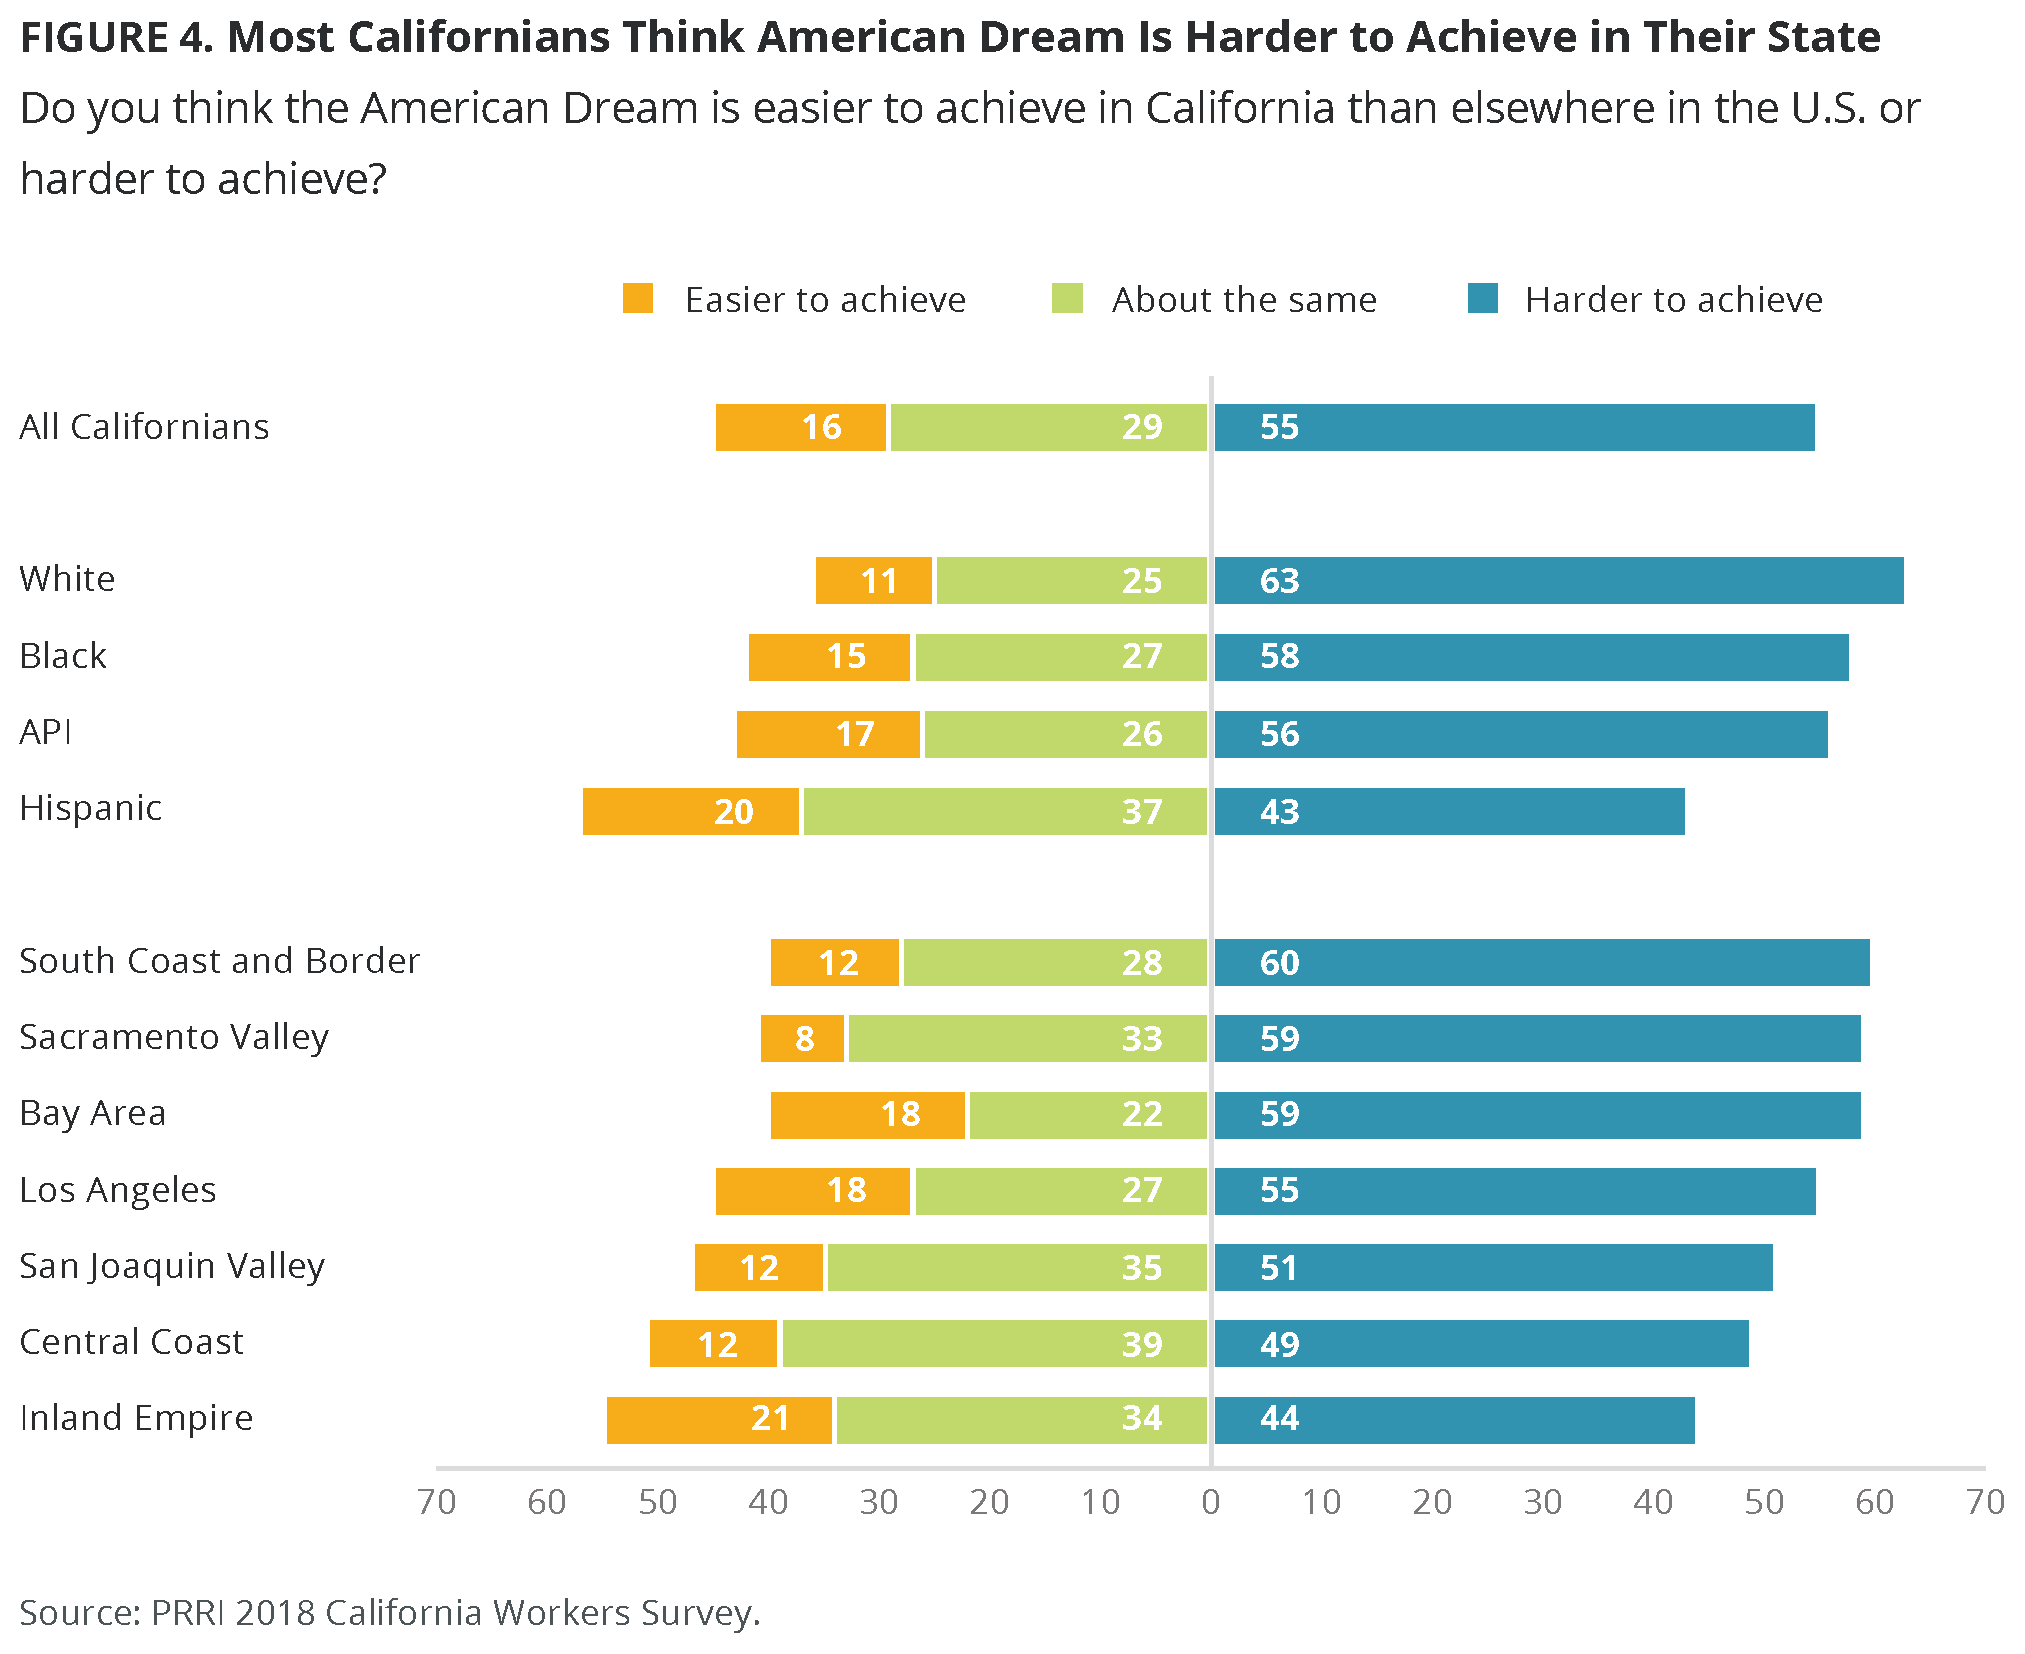
Today, however, Californians are actually more pessimistic about the existence of the American Dream in their state compared to other parts of the country. A majority (55%) of Californians say that the American Dream is harder to achieve in California than elsewhere in the United States. About three in ten (29%) Californians say it is about as difficult to achieve the American Dream in California as it is elsewhere in the country, and only 16% say the American Dream is easier to achieve in California than in the rest of the nation.
Notably, Californians who are working and struggling with poverty are actually less pessimistic than other California workers about the existence of the American Dream in California. While nearly six in ten (59%) California workers who are not struggling with poverty say that achieving the American Dream is more difficult in California than it is elsewhere in the U.S., half (50%) of workers who are struggling with poverty agree.
Hispanic Californians are generally less pessimistic about the American Dream in California compared to other racial and ethnic groups. While a majority of white (63%), black (58%), and API (56%) residents say the American Dream is more difficult to achieve in California than in the rest of the country, only 43% of Hispanic Californians say the same. Nearly four in ten (37%) Hispanic Californians say it is about as easy to achieve the American Dream in California as it is in other states. There are similar racial and ethnic divides among those working and struggling with poverty. Hispanics in this group are less likely than their white counterparts to say that the American Dream is harder to achieve in California (39% vs. 71%) and more likely to believe it is easier to achieve in California compared to other states (20% vs. 6%).
Economic Mobility
Geographic Mobility: Difficulty Relocating for a New Job
More than six in ten Californians say that it would be very (28%) or somewhat (34%) difficult to relocate if they found a good or better job. About one-third say it would be not too difficult (21%) or not at all difficult (14%). Notably, Californians who are working and struggling with poverty (60%) are about equally likely as Californians who are working but not struggling with poverty (64%) to say that it would be at least somewhat difficult to relocate if they found a good or better job.
White and API Californians are more likely than members of other racial and ethnic groups to say it would be difficult to relocate. More than two-thirds of white (68%) and API (68%) Californians say that it would be very or somewhat difficult to relocate if they found a good or better job. Fifty-five percent of Hispanic Californians and fewer than half of black (48%) Californians say that relocating would be difficult. These racial and ethnic differences are similar among those who are working and struggling with poverty. White Californians working and struggling with poverty are more likely than their Hispanic counterparts to say that it would be difficult to relocate (72% vs. 57%).
There are few differences among residents of California’s various regions on this question.
Class Mobility: Then vs. Now
While most Californians describe themselves as coming from a working or lower-class family, they generally describe their current economic situation as better than the one in which they grew up. Asked to describe their family’s financial position growing up and their current financial standing, Californians are less likely to describe their present day status as lower class (13% vs. 7%) or working class (40% vs. 30%). Californians are more likely to describe their current financial situation as middle class (36% vs. 44%) or upper-middle or upper class (10% vs. 17%).
This also holds true among those working and struggling with poverty. Compared to their description family’s economic status when they were a child, Californians who are working and struggling with poverty are less likely to say that they are currently lower class (19% vs. 11%), are more likely to describe themselves as working class (44% vs. 54%), and are about as likely to say they are middle class (32% vs. 29%).
Among all major racial and ethnic groups, Californians are more likely to indicate that their current economic status is higher than the one into which they were born.
Most Californians Believe Young People Should Seek Opportunities Elsewhere
Looking ahead, most Californians are pessimistic about economic opportunities for young people in their local communities. Nearly two-thirds (64%) of Californians say they would generally encourage young people in their community to leave to find more opportunity elsewhere, while only about one-third (34%) say that they would encourage young people to stay in the area.
California residents who are working and struggling with poverty are only modestly more pessimistic than more financially secure workers about economic opportunities for young people. More than two-thirds (68%) of Californians who are working and struggling with poverty say they would encourage young people in their community to leave for better opportunities, compared to about six in ten (61%) Californians who are working but not struggling with poverty.
There is a sizable education gap on this question. Compared to Californians with a four-year college degree, those without a college education are more likely to advise young people to leave their community for more opportunity (55% vs. 69%).
With the exception of API Californians, the views of Californians of different racial and ethnic backgrounds are quite similar. Roughly two-thirds of white (67%), Hispanic (66%), and black (66%) Californians say that young people should leave their community in search of better opportunities. API Californians are more divided on whether young people in their area should leave to find better opportunities (51%) or stay locally (48%). Among those who are working and struggling with poverty, Hispanics are less likely than whites to say young people should leave their community (63% vs. 77%) and more likely to say they should stay (35% vs. 22%).
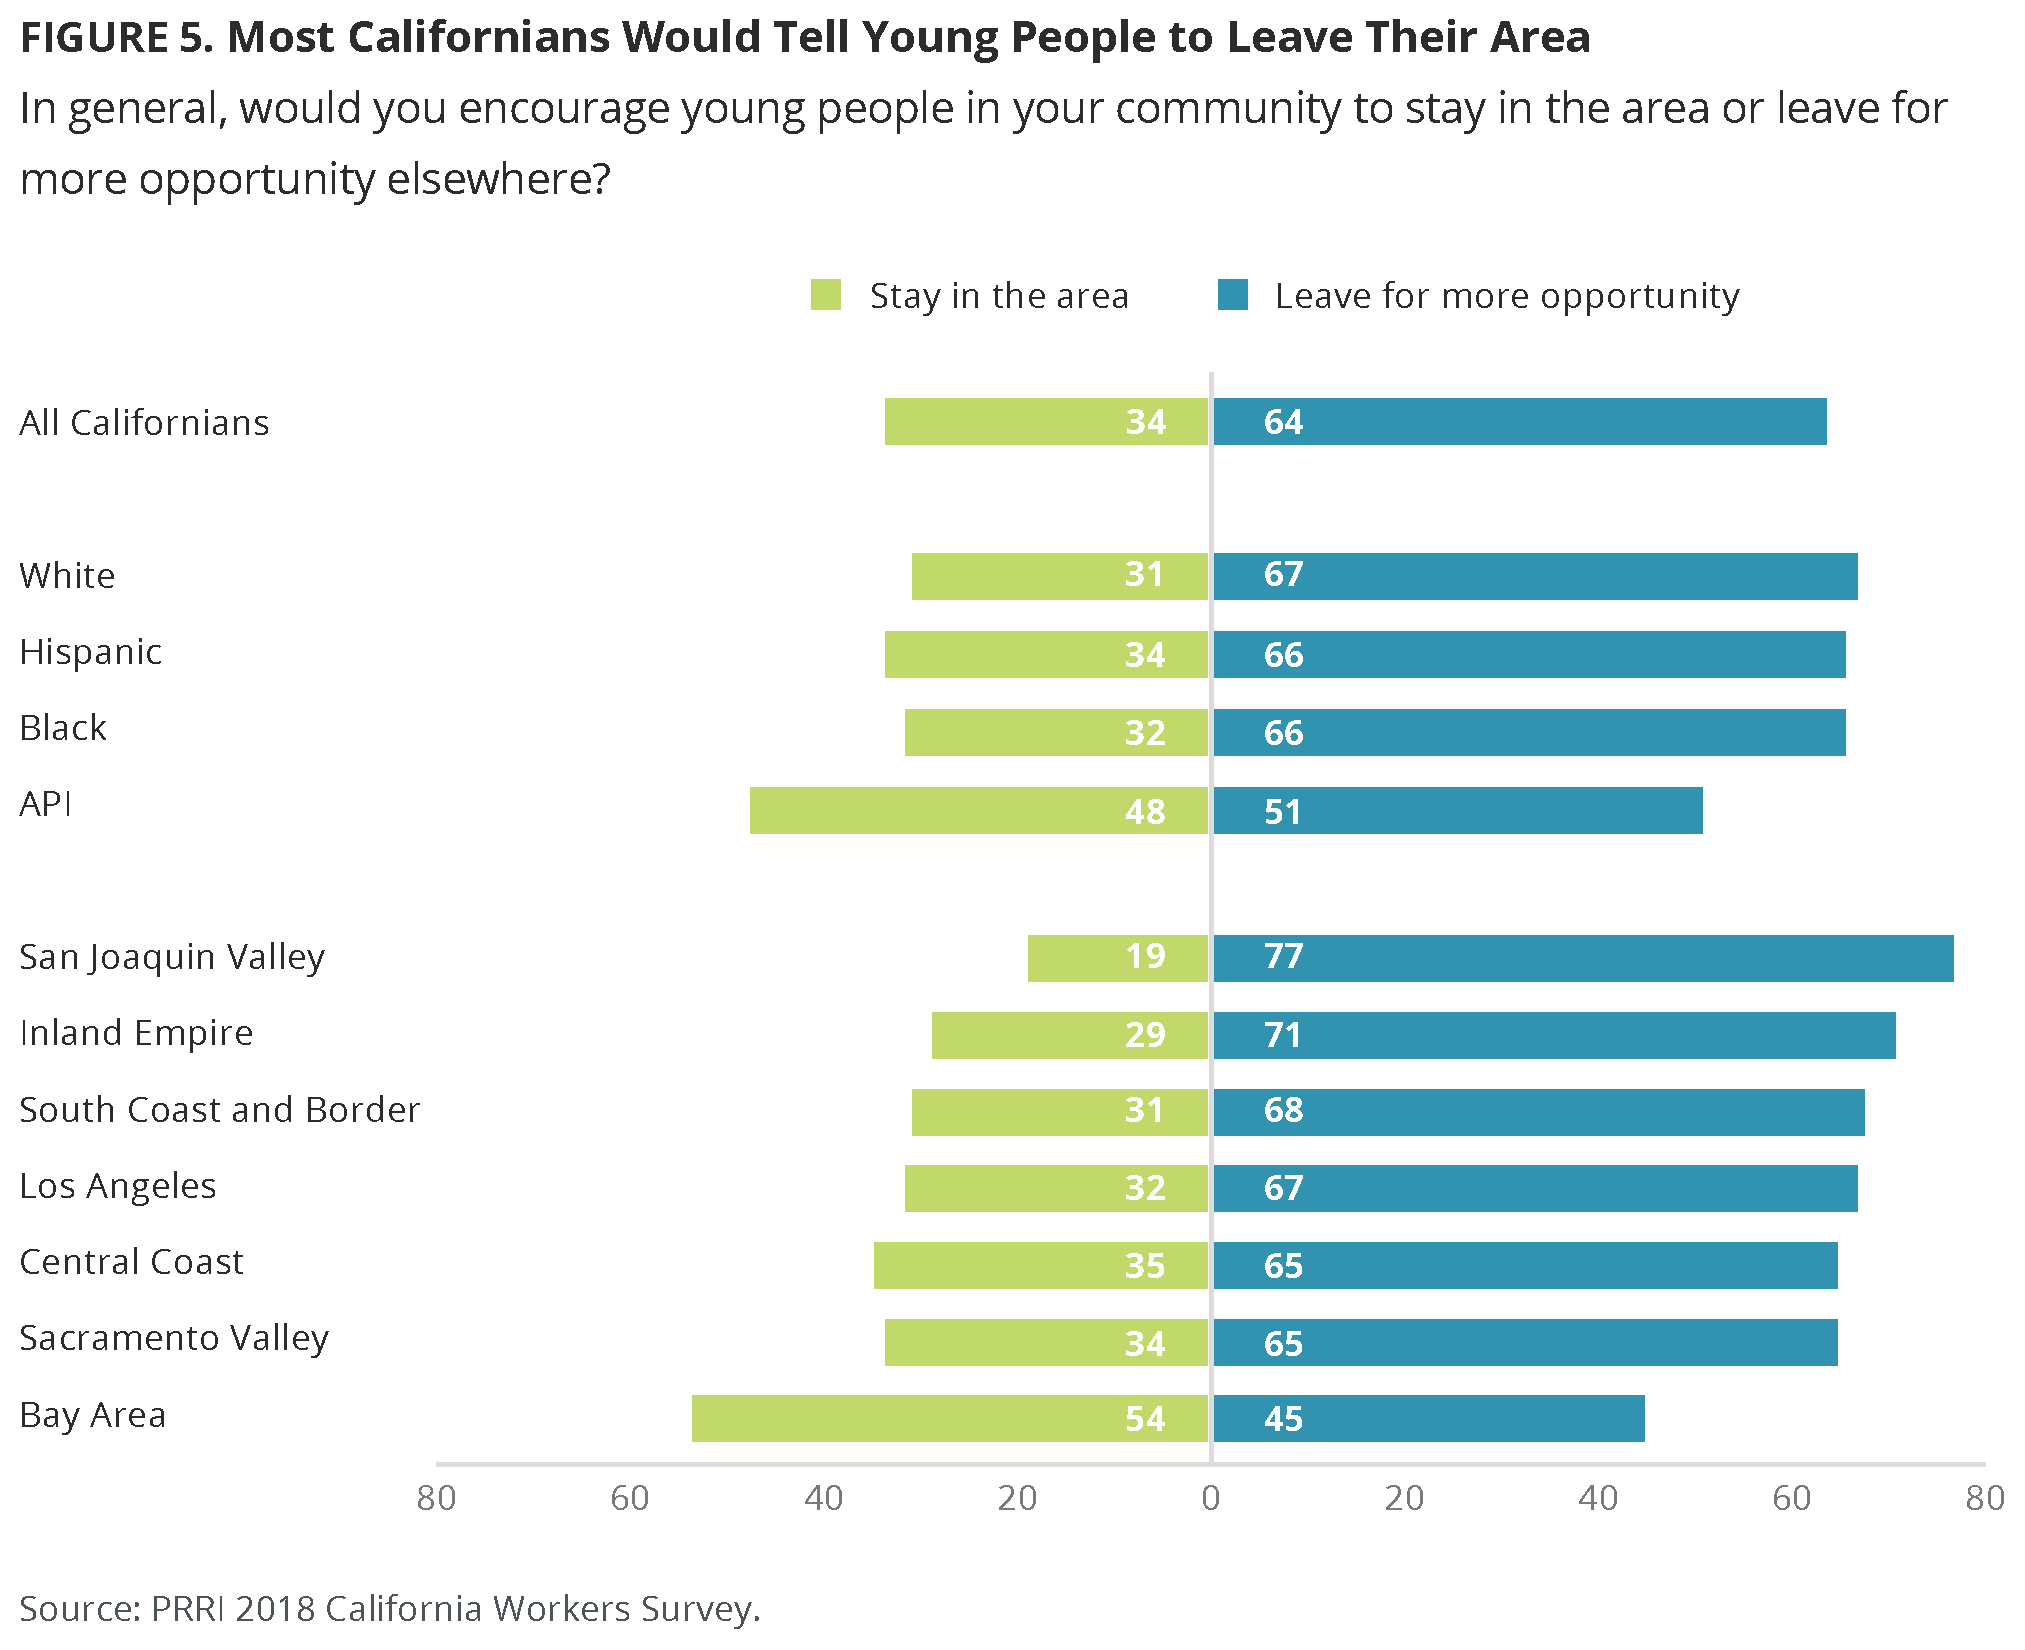
Regionally, the Bay Area stands out because of its residents’ belief that young people can find the best opportunities in their community. A majority (54%) of Bay Area residents say that young people should stay in the area to pursue economic opportunities, while only about one-third of residents in the Central Coast (35%), Sacramento Valley (34%), Los Angeles (32%), South Coast and Border (31%), and Inland Empire (29%) regions feel the same. Residents of the San Joaquin Valley are especially pessimistic: Only 19% say young people should stay in the area, while 77% say they would encourage young people to seek opportunities elsewhere.
Personal Efficacy
Hard Work Not Seen as a Guarantee of Success
Californians tend to reject the idea that hard work and determination are a guarantee of success for most people. A majority (54%) of Californians say that hard work and determination alone provide no guarantee of success for most people, while about four in ten (44%) disagree.
There is a notable divide on this question among California workers of different economic status. Nearly two-thirds (65%) of Californians working and struggling with poverty say that hard work and determination do not promise success for most people, while only one-third (33%) say these ingredients alone assure success. In contrast, workers who are not economically struggling are evenly split—about half (49%) say that with hard work and determination, most people will be successful, while a similar number (50%) do not hold this view.
Educational attainment is a significant dividing line for Californians as well. Californians without a four-year college degree are substantially more likely than Californians with a college degree to say that hard work and determination do not guarantee success (59% vs. 46%).
Black and Hispanic Californians express considerably greater pessimism than other racial and ethnic groups about the efficacy of hard work. While more than six in ten Hispanic (63%) and black (61%) Californians say that hard work does not necessarily lead to success, only about half of white (51%) and API (47%) Californians express this view. However, this racial and ethnic divide is less pronounced among workers who are struggling with poverty. Among those working and struggling with poverty, roughly equal numbers of white (68%) and Hispanic (66%) Californians agree that hard work and determination are not guarantees of success.
Perceptions of Efficacy: Changing Financial and Workplace Conditions
Most Californians believe that it is possible to change one’s financial situation, though a sizable number say this not possible after a certain point. A majority (56%) of Californians reject the idea that at some point there is little a person can do to change their financial situation, while about four in ten (42%) agree with this statement.
Among California workers, those struggling with poverty are less optimistic than those who are not struggling. Half (50%) of workers who are struggling with poverty say that at some point there is not much to do to change one’s economic status, compared to only about one-third (35%) of Californians who are working but not struggling with poverty.
A majority of Californians of different racial and ethnic backgrounds reject the notion that one’s financial situation is fixed, although there is some variation among groups. About two-thirds (66%) of black Californians reject the notion that there is little a person can do to change their financial situation, compared to less than six in ten white (59%), Hispanic (53%), and API (52%) Californians.
Most (56%) Californians say that they think there is something people like them can do to improve their working conditions, compared to 41% who believe there is little that can be done. Among workers, a majority (53%) of those struggling with poverty agree that there is <em>not</em> much people like them can do to improve their working conditions, compared to about one-third (35%) of those who are not struggling.
The Value of Education
Going to College: Smart Investment or Risky Gamble?
Most Californians believe in the promise of higher education. More than six in ten (62%) Californians believe that a college education is a smart investment in the future, while fewer than four in ten (37%) believe it is a gamble that may not pay off in the end. California workers who are struggling with poverty are about as likely as those not struggling to agree that a college education is a smart investment (59% vs. 63%).
However, there is a sharp generational divide among Californians in views about higher education that may indicate a shift in confidence in higher education as a key to success. Only around half (51%) of young Californians (ages 18-29) say attending college is wise investment, while nearly as many (46%) say it is a gamble that may not pay off. In contrast, nearly two-thirds (66%) of Californians over the age of 65 believe that college is a smart investment.
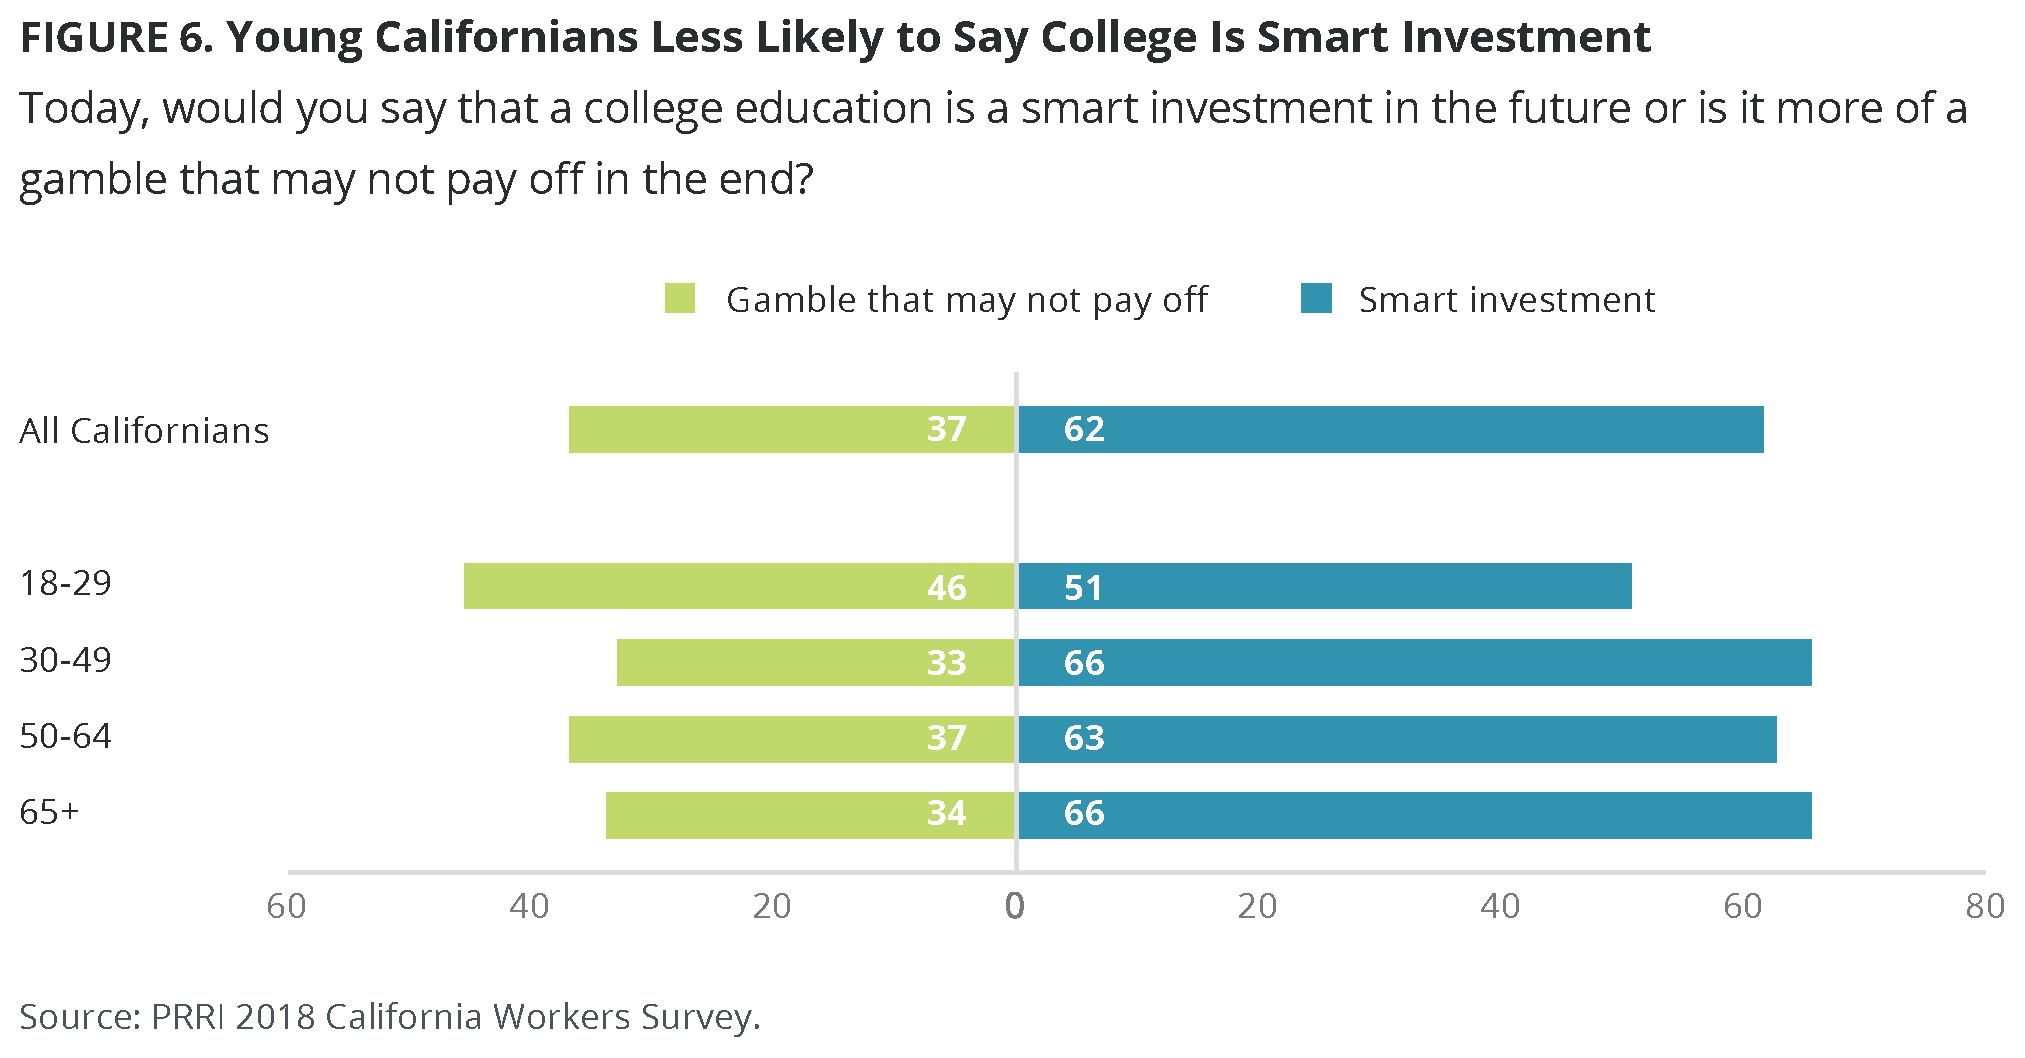
Importantly, Hispanic and API Californians are more likely than white and black Californians to see value in higher education. Nearly seven in ten Hispanic (69%) and API (69%) residents believe that a college education is a worthy investment, compared to 60% of black residents and 56% of white residents. This racial divide is much more pronounced among those who are working and struggling with poverty. Hispanics in this group are much more likely than their white counterparts to say that a college education is a smart investment (70% vs. 44%).
College graduates in California are more likely to see the value of a college education, with nearly three-quarters (73%) saying it is a smart investment for the future. Far fewer (57%) Californians who lack a four-year degree express the same sentiment.
There are also regional differences on this issue. Nearly three-quarters (73%) of Bay Area residents say that a college education is a smart investment in the future—which is likely in part a reflection of the region’s well-educated residents.<sup>8</sup> About six in ten residents of Los Angeles (64%), the Central Coast (60%), the South Coast and Border (60%), the Inland Empire (59%), and the San Joaquin Valley (58%) say the same. Residents of the Sacramento Valley were least likely to agree, with a little more than half (54%) saying a college education is a smart investment.
Family Expectations
A majority of Californians report growing up in a family where the expectation was to go to four-year college (44%) or a community college (11%). About one-quarter say they were expected to either enroll in a vocational program (6%) or get a job (17%). More than one in five (22%) say that their family did not talk about these things.
Workers who are struggling with poverty report having very different familial expectations when they were growing up than workers who are not struggling. Compared to those who are not struggling with poverty, struggling workers are nearly half as likely to say that they were expected to go to a four-year college (59% vs. 32%). Nearly half of struggling workers report that they were expected to immediately get a job (24%) or that this was not something their family talked about (22%).
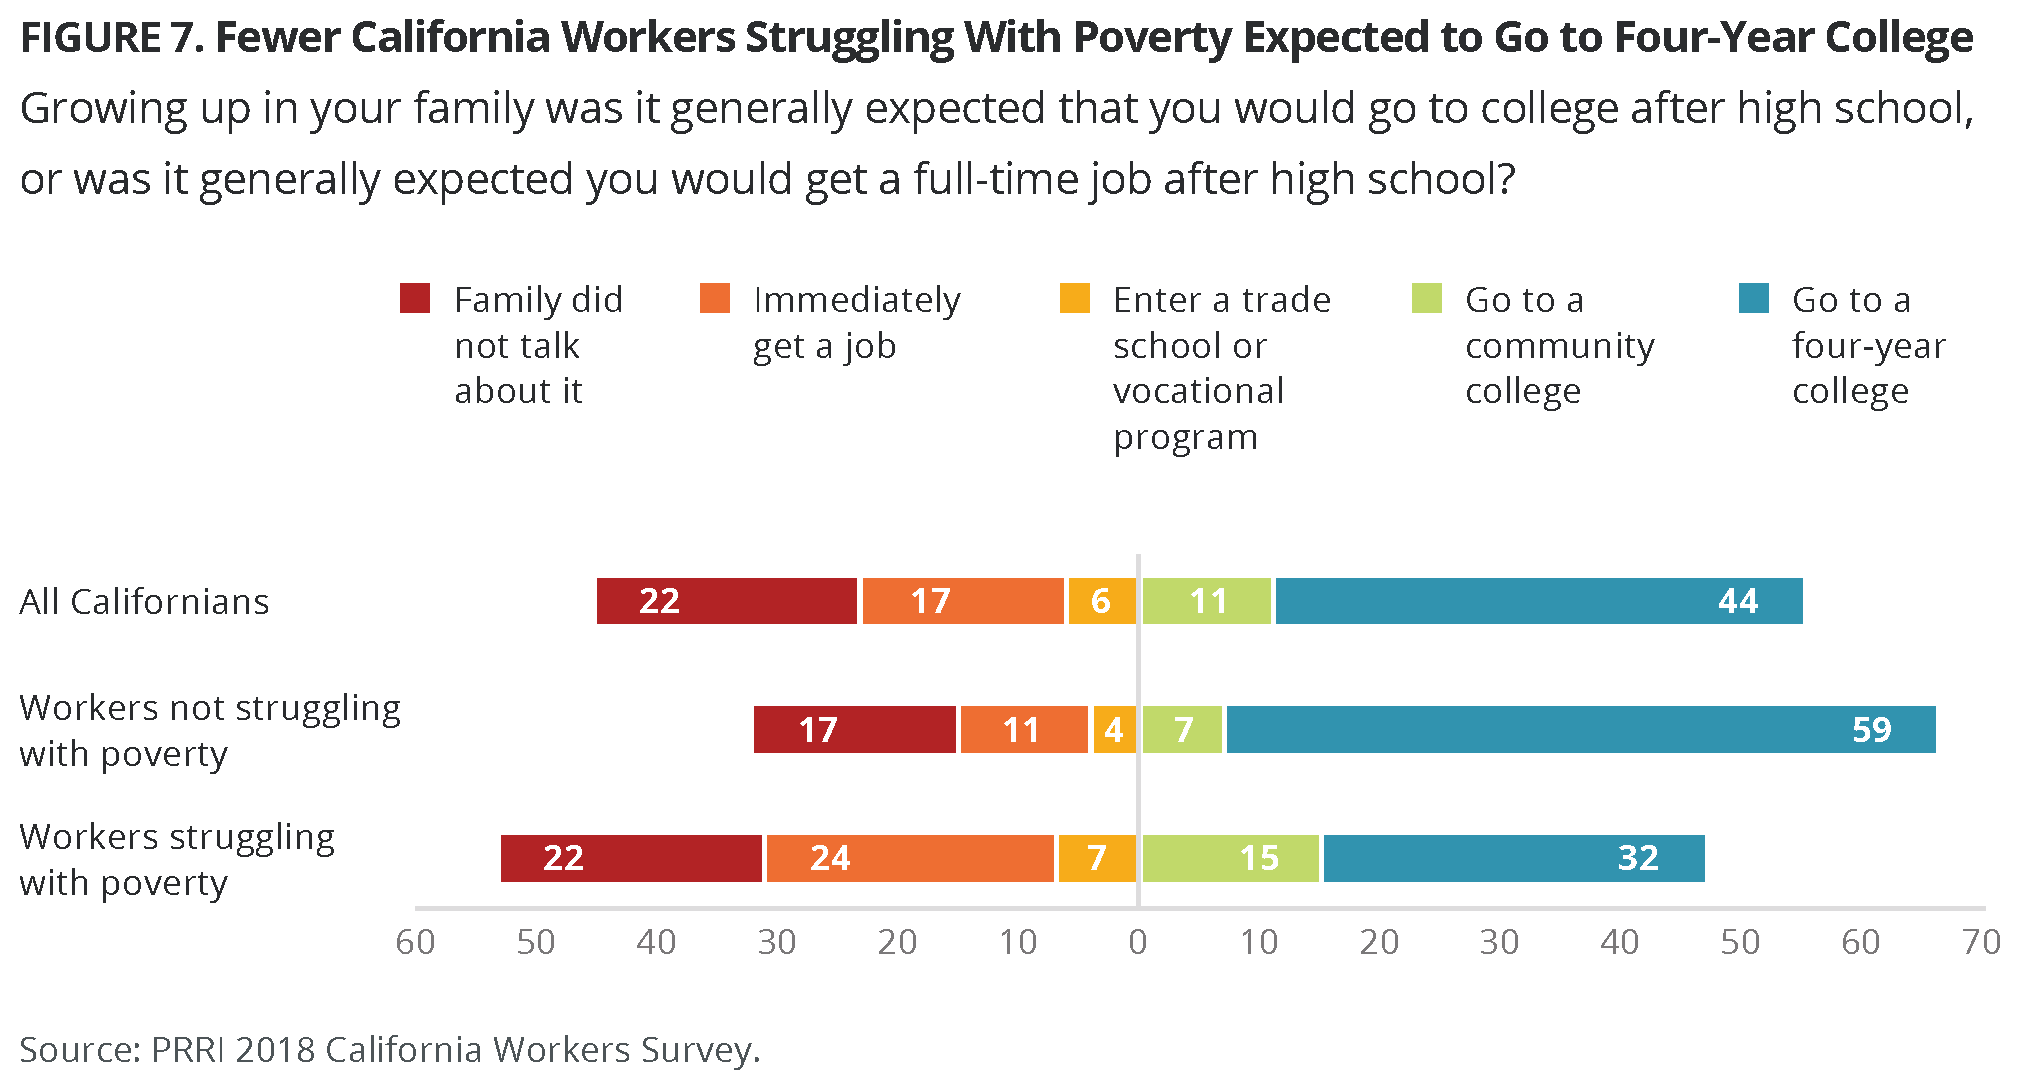
The education gap on this question is stark. More than eight in ten (81%) Californians with a four-year college degree report that their family expected them to go on to a four-year college after high school. In contrast, among Californians without a four-year college education, only 25% report similar familial expectations.
Young Californians are more likely to report an expectation that they go to a four-year college than seniors. Nearly two-thirds of young Californians (ages 18 – 29) say their family expected them to attend a four-year college (49%) or a community college (17%). Less than half of seniors (ages 65 and older) report that their family expected them to go to a four-year college (39%) or community college (10%). More than four in ten seniors say that they were expected to immediately get a job (18%) or that this was never discussed growing up (25%).
API Californians are significantly more likely than members of other racial and ethnic groups to report being expected to attend a four-year college. Nearly three-quarters (74%) of API Californians say they were expected to go to a four-year college, compared to 43% of white residents, 41% of black residents, and 33% of Hispanic residents.
In regions where a college education is more likely to be seen as a smart investment, residents are also likelier to report that they were expected to go to a four-year college. For instance, 64% of Bay Area residents say they were expected to go to a four-year college, compared to roughly one in three residents of the Sacramento Valley (34%), the Inland Empire (31%) and the San Joaquin Valley (29%).
Personal Financial Situation
How Are You Doing Compared to: Other Americans? Other Californians?
Californians tend to be optimistic about their personal financial status compared to other Americans and more pessimistic about their financial status compared to other Californians.
Four in ten (40%) Californians say they are doing better financially than most other Americans, while roughly the same number (43%) say they are doing about the same. Only 16% say they are doing worse compared to most other Americans.
California workers who are struggling with poverty are less optimistic about their financial standing. Only 22% of struggling workers, compared to a majority (54%) of workers who are not struggling with poverty, believe they are better off than other Americans. Still, about half (49%) of struggling workers say they are doing about as well as other Americans, while only 28% say they are doing worse.
Those belonging to different racial and ethnic groups have notably different assessments of their relative financial situation. About half of API (51%) and white (49%) Californians say that they are doing better than most other Americans, a view shared by significantly fewer Hispanic (30%) and black (22%) Californians. But more than half of black (57%) and Hispanic (51%) Californians say they are doing about the same as other Americans, a view shared by significantly smaller number of API (40%) and white (36%) Americans. Relatively few Californians, regardless of their race or ethnic background, perceive that they are worse off financially than other Americans. Fewer than one-quarter of black (21%), Hispanic (18%), white (15%), and API (9%) Californians say they are doing worse than most other Americans.
Across California’s regions, however, there are vastly different perceptions of personal financial situation when compared to most other Americans. Nearly six in ten (57%) Bay Area residents say they’re doing better than most other Americans, while only about one-quarter (26%) of San Joaquin Valley residents say the same about their personal financial situation.
Residents of the Golden State are more pessimistic about their financial situation relative to other Californians. Fewer than three in ten (29%) of California residents say they are doing better than other Californians. A slim majority (51%) report that they are about as well off as other residents, while 19% say they are doing worse.
Californians who are working and struggling with poverty are significantly more likely than those not struggling to say they are worse off than other Californians. Fifteen percent of struggling workers say they are doing better than other Californians, while 56% say they are doing about the same as their fellow state residents. Nearly three in ten (28%) say they are worse off than other Californians. The pattern among workers not struggling with poverty is markedly different. Nearly four in ten (39%) workers who are not struggling with poverty say they are in a better financial position than their fellow California residents, while half (49%) say they are doing about the same. Only 12% say they are in worse shape financially.
Among workers struggling with poverty, Hispanic Californians are less likely than their white counterparts to say they are doing worse than other Californians (16% vs. 44%) and more likely to say they are doing about the same (62% vs. 45%).
Economic Distress
A significant number of Californians and an even greater share of those working and struggling with poverty report experiencing a range of hardships. Lost in the many technical measurements of poverty are the more tangible lived experiences that define individuals’ distress. The survey included a robust array of questions aimed at understanding the unique economic experiences of different Californians, including those who are working and struggling with poverty, and providing a more complete picture of the difficulties, challenges, and obligations that are part of their daily lives.
Respondents were asked if they or someone in their household had personally done or experienced any of the following in the last 12 months:
- Put off seeing a doctor or purchasing medication for financial reasons
- Was not able to pay a monthly bill
- Received food stamps
- Reduced meals or cut back on food to save money
- Received unemployment benefits
- Received food from a food bank or pantry
- Used a payday lending service
- Helped parents or in-laws financially
- Received financial help from friends or family
- Had difficulty paying rent or mortgage
Almost six in ten (59%) Californians report that they or someone in their household has dealt with at least one of these issues in the last 12 months. More than one in four (27%) Californians report that they or someone in their household had to reduce meals or cut back on food to save money. One-quarter (25%) of California residents report that they or someone in their household put off seeing a doctor or purchasing medication for financial reasons. More than one in five (22%) report difficulty paying their mortgage or rent, while a similar number report that they or someone in their household was unable to pay a monthly bill (21%). Almost one-third of Californians report helping their parents or in-laws financially (32%) in the last year.
Fewer than one five report that their household received food stamps (16%) or received food from a food bank or pantry in the last year (13%). A similar number (15%) report that they or someone in their household received unemployment benefits.
More than one in five (22%) Californians report having received financial help from a friend or family member, while 11% say they or someone in their household used a payday lending service at some point in the last year.
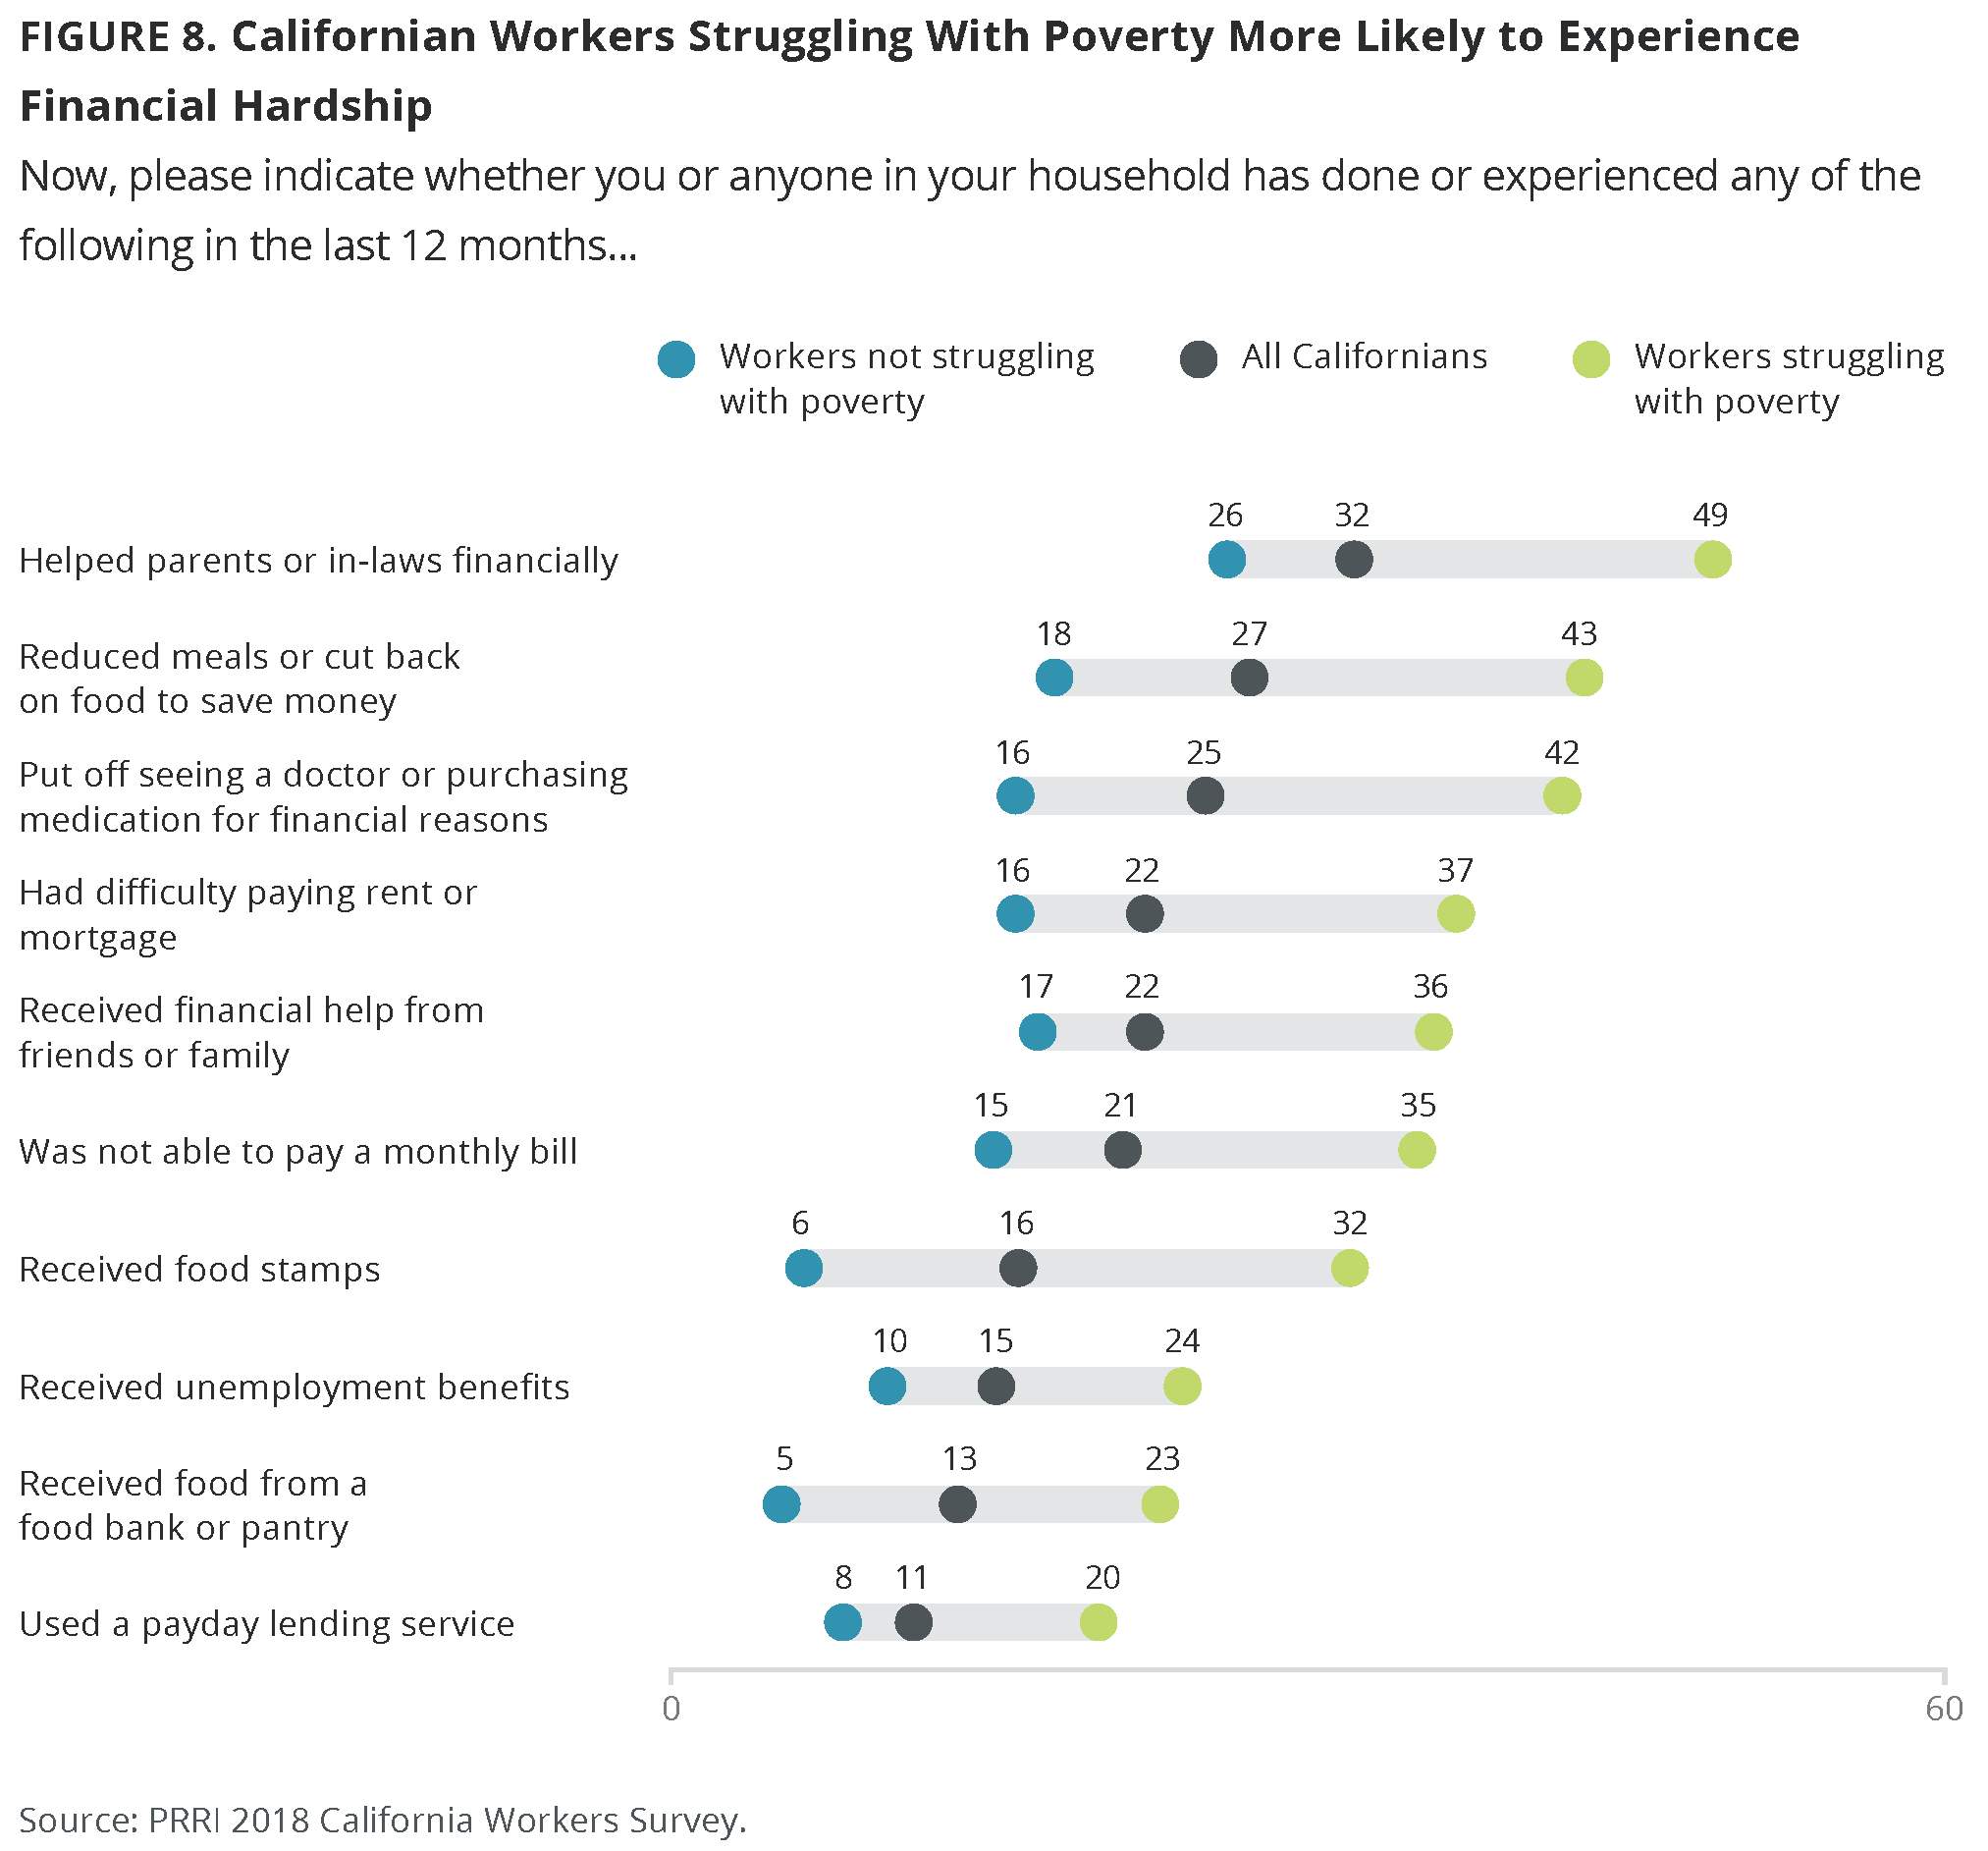
Among California workers, those struggling with poverty are more likely to report these hardships in the last year. Workers who are struggling with poverty are more likely than workers who are not struggling to say that they or someone in their household put off seeing a doctor or purchasing medication for financial reasons (42% vs. 16%), had difficulty paying rent or mortgage (37% vs. 16%), were unable to pay a monthly bill (35% vs. 15%), or used a payday lending service (20% vs. 8%).
Food insecurity is also a far more widespread problem for struggling workers than workers who are more secure financially. Struggling workers are more likely than workers who are not struggling to report having reduced meals or cut back on food to save money (43% vs. 18%), received food stamps (32% vs. 6%), and received food from a food bank or pantry (23% vs. 5%).
Struggling workers are also more likely to report that they both provided and received financial support from friends or family in the last year. Workers struggling with poverty are about twice as likely as those who are not struggling to have helped their parents or in-laws financially (49% vs. 26%). On the other hand, struggling workers are also more likely than workers who are not struggling to have received financial help from family or friends (36% vs. 17%).
Struggling workers are more than twice as likely as those who are not struggling to have received unemployment benefits (24% vs. 10%).
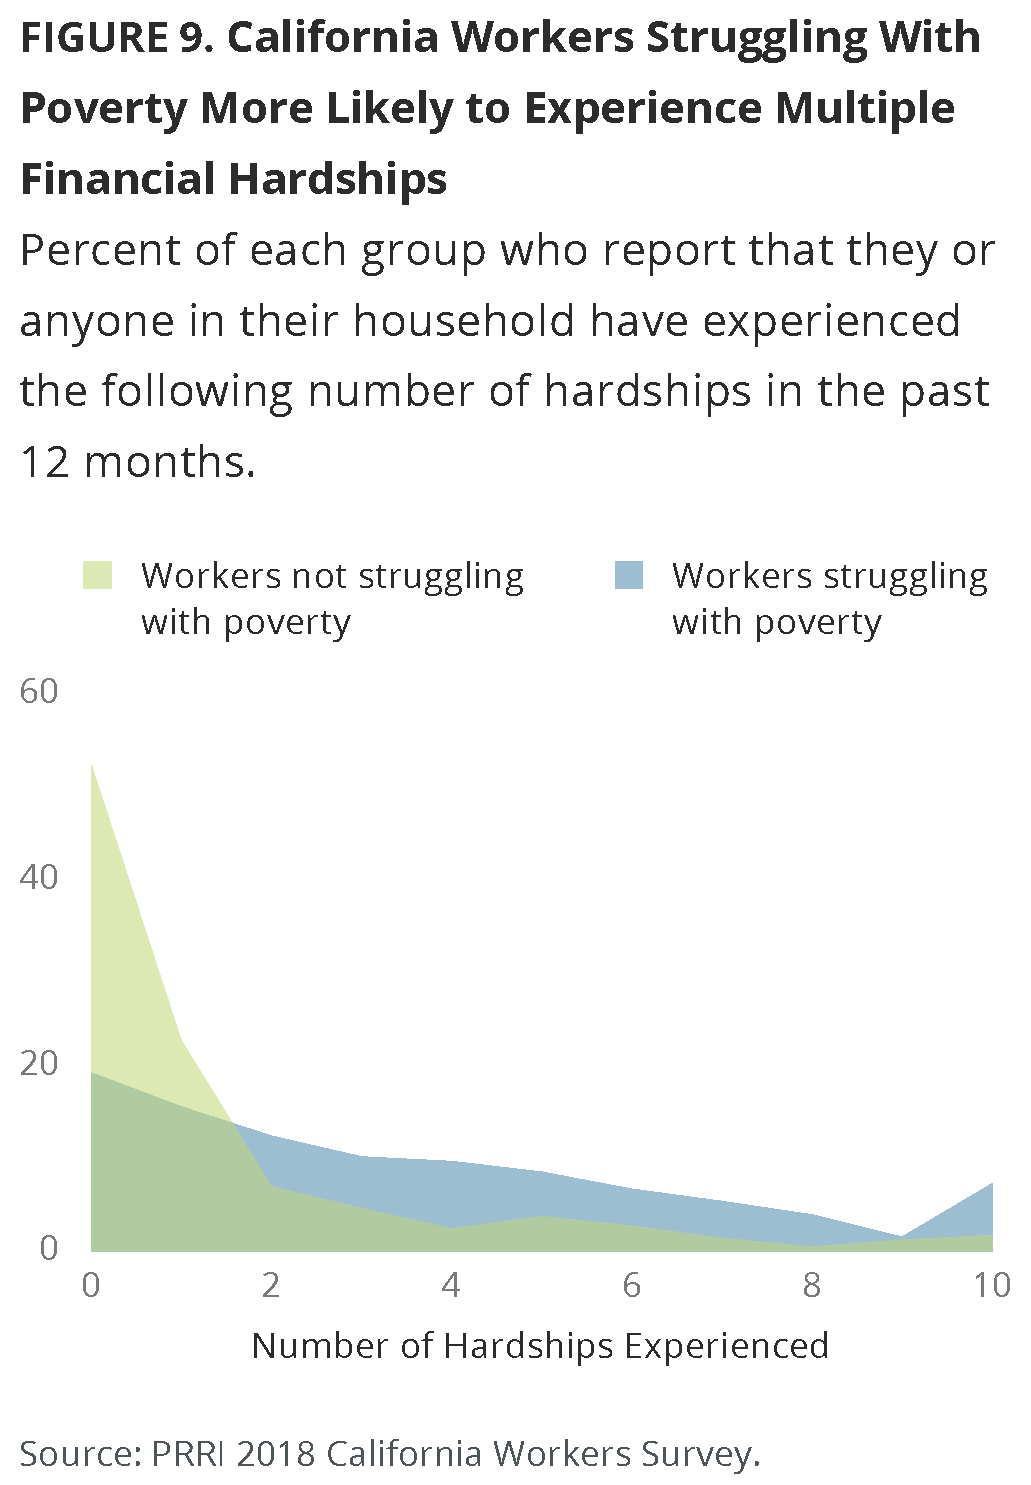
While any individual hardship can have dramatic effects on one’s life, a significant number of Californians and their households are dealing with many of these hardships at once. Taken together, those who are working but struggling with poverty clearly experience more of these hardships than those workers who are not struggling. While a majority (59%) of Californians report they or someone in their household dealt with at least one of these hardships, about one-quarter (23%) say they dealt with between two and four hardships and 17% report dealing with five or more. Compared to workers who are not struggling with poverty, struggling workers are less likely to report dealing with one or fewer hardships (75% vs. 35%) and much more likely to report dealing with two to four (14% vs. 33%) or five or more hardships (12% vs. 33%).9
Notably, seven percent of those who are working and struggling with poverty report that they or someone in their household experienced all ten of these hardships in the last 12 months.
Young Californians (ages 18 – 29) are far more likely than senior residents (ages 65 and older) of the state to face these hardships. Compared to seniors, young Californians are less likely to report experiencing one or fewer hardships (82% vs. 46%) and significantly more likely to say they have experienced two to four (14% vs. 22%) or five or more (4% vs. 32%) of these hardships.
Californians with a lower level of education are more likely to experience a higher number of these hardships. Those without a four-year college degree are less likely than their college-educated counterparts to report experiencing one or fewer hardships in the past year (53% vs. 77%), more likely to report two to four hardships (26% vs. 16%), and more than twice as likely to report five or more hardships (21% vs. 9%).
There are also stark racial and ethnic disparities with respect to these hardships. Over seven in ten white (73%) and API (71%) Californians report that they or someone in their household has experienced one or fewer hardships in the last year, while about half of black (51%) and Hispanic (47%) Californians say the same. Black residents are more likely to report experiencing two to four (18%) of these hardships, and nearly one-third (32%) report experiencing five or more. Almost three in ten (28%) Hispanic residents report they or someone in their household has experienced two to four hardships, while nearly a quarter (24%) report that they or someone in their household experienced five or more. There are no notable differences between white and Hispanic workers who are struggling with poverty.
These experiences also vary by region. Nearly three-quarters (74%) of Bay Area residents report experiencing one or fewer of these hardships. About six in ten Central Coast (63%), Sacramento Valley (61%), South Coast and Border (59%), and Los Angeles (57%) residents, along with a majority of those in the San Joaquin Valley (53%) and Inland Empire (51%) regions, say the same.
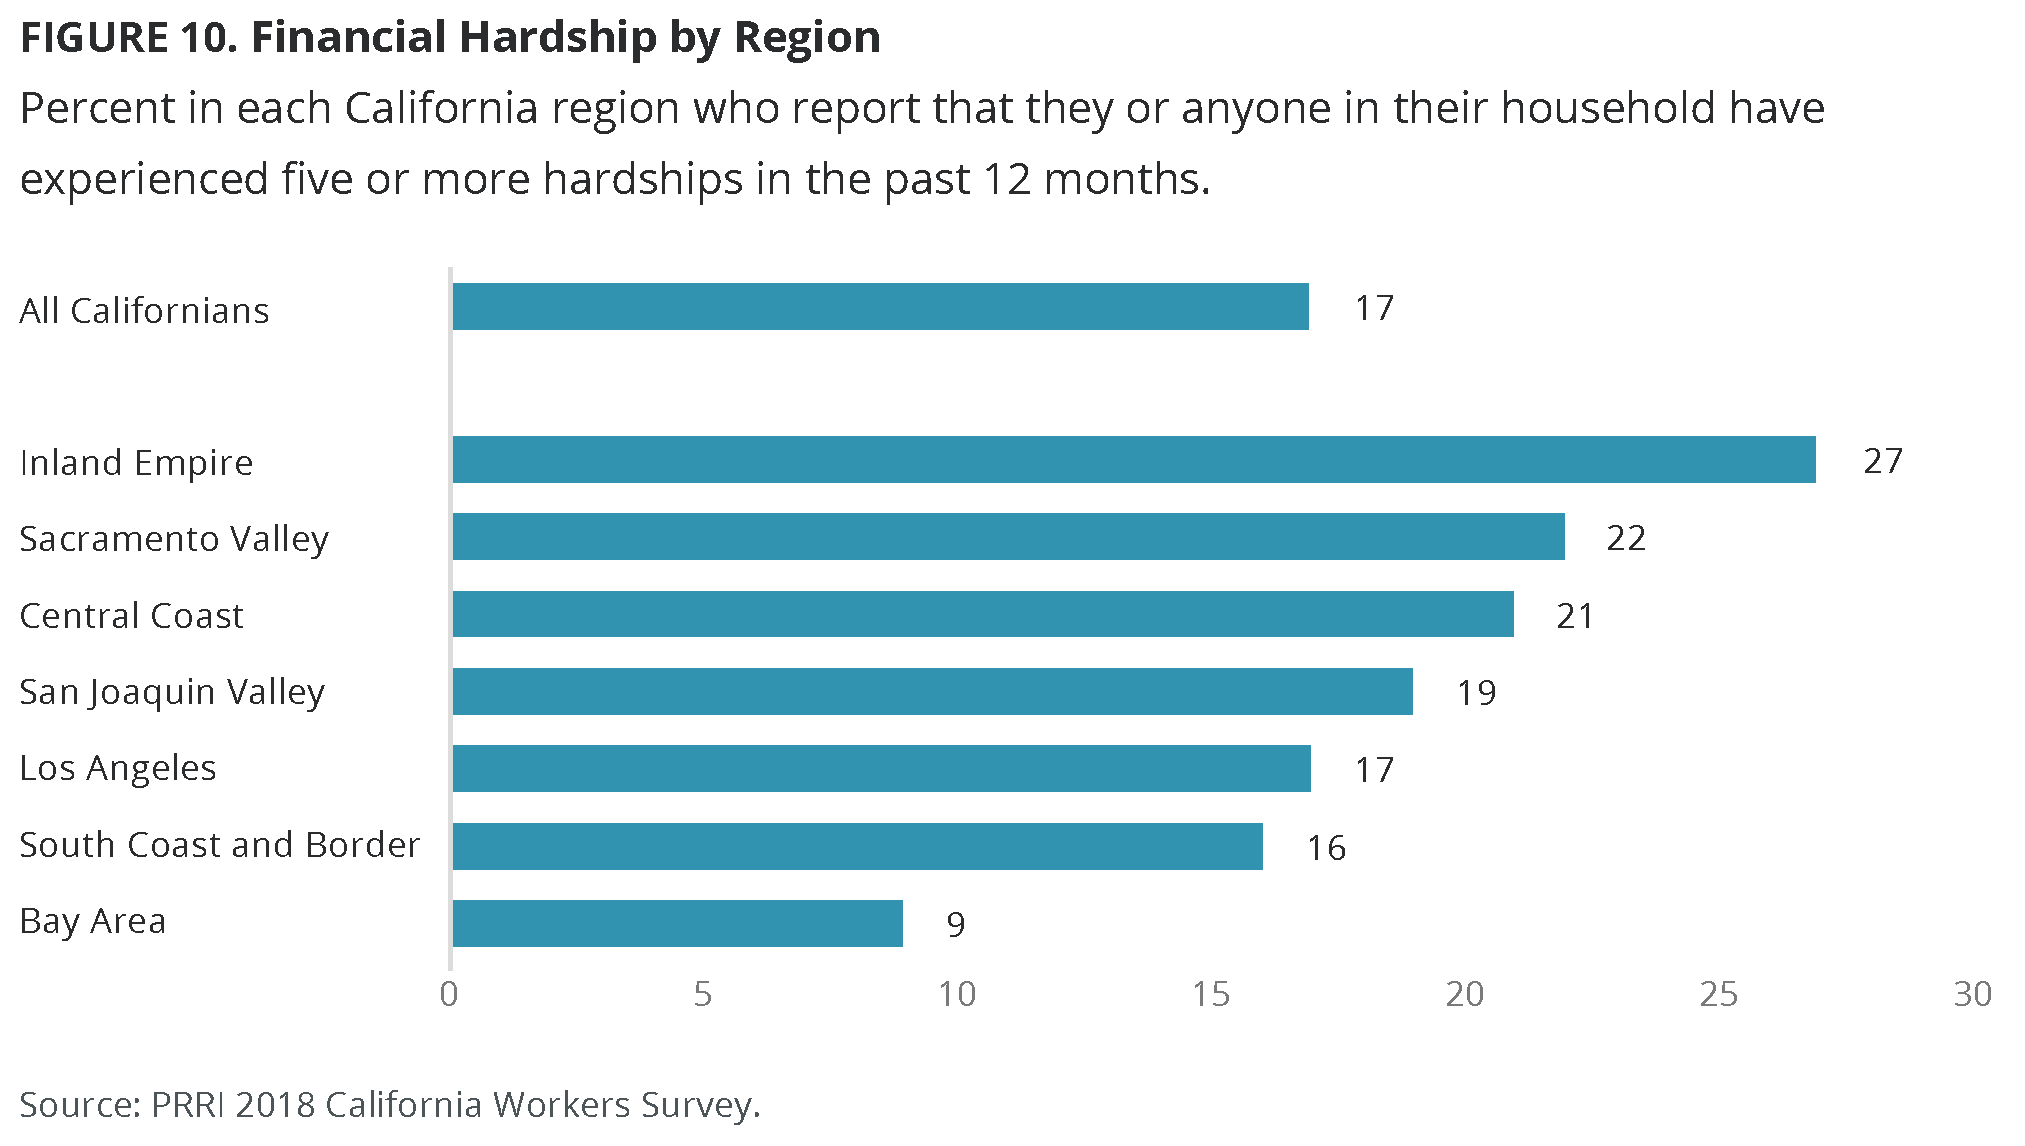
In contrast, around one-quarter of Inland Empire (27%), Sacramento Valley (22%), and Central Coast (21%) residents report five or more of these experiences. About one-fifth of those living in San Joaquin Valley (19%) and Los Angeles (17%) say the same. Fewer than one in ten (9%) residents of the Bay Area region report that they or someone in their household experienced five or more of these hardships.
Student Loan Debt
More than one in ten (14%) Californians report currently having student loan debt. Among those with student loan debt, about four in ten Californians owe less than $10,000 (38%) or between $10,000 and $50,000 (39%). More than one in five (22%) owe more than $50,000.
The proportion of workers with student loan debt does not differ appreciably between those who are struggling with poverty and those who are not. Sixteen percent of workers struggling with poverty and 18% of those who are not struggling with poverty report having student loan debt. Notably, struggling workers owe less than those who are not struggling. More than half (51%) of struggling workers with student loan debt report that they owe less than $10,000, while only about one-quarter (26%) of non-struggling workers report owing less than $10,000. Struggling workers are far less likely than more economically secure workers to report owing more than $50,000 (9% vs. 36%).
Black Californians are more likely than other racial and ethnic groups to report having student loan debt. Nearly one in three (31%) black residents report having student loan debt, which is about twice the rate of Hispanic (16%) and API (15%) residents. Fewer than one in ten (9%) white residents report having student loan debt.
Concerns About Affordable Housing
More than half (51%) of Californians are somewhat or very worried that they or someone in their family will be unable to afford housing. Workers who are struggling with poverty are substantially more likely than those who are not struggling with poverty to worry about finding affordable housing (64% vs. 43%).
Hispanic residents are particularly likely to report concerns about housing. More than six in ten (61%) Hispanic Californians say they are very or somewhat worried about finding affordable housing. Less than half of black (49%), white (44%), and API (44%) Californians say the same. Among those working and struggling with poverty, roughly equal numbers of white (62%) and Hispanic (66%) Californians say they are worried about their ability to pay for housing.
Concerns about the affordability of housing also vary slightly by region. At least half of Los Angeles (58%), Central Coast (54%), South Coast and Border (53%), and San Joaquin Valley (50%) residents feel worried that they or someone in their family will be unable to afford housing. Less than half of those living in the Inland Empire (49%), Sacramento Valley (44%), and Bay Area (43%) regions say the same.
Concerns About Health Insurance
Four in ten (40%) California residents report that they worry that they or someone in their family will lose their health insurance. Among workers, those who are struggling with poverty are more likely than those who are not struggling financially to express concern about losing health insurance (53% vs. 32%).
Hispanic residents are more likely to be concerned about the possibility of losing health care coverage. A majority (56%) of Hispanic Californians say they are somewhat or very worried about losing health insurance, compared to about one-third of API (36%), black (33%), and white (30%) Californians. Among those who are working and struggling with poverty, Hispanics are also significantly more likely than their white counterparts to worry about losing health insurance (60% vs. 36%).
Women are more likely than men to report that they worry that they or someone in their family will lose their health insurance. Nearly half (45%) of women, compared to only 36% of men, report being worried about losing health insurance coverage.
Those living in the Central Coast region are more likely than residents of other regions to worry that they or someone in their family will lose their health insurance. Half (50%) of Central Coast residents say they are somewhat or very worried about losing health insurance, compared to about four in ten Californians living in other regions.
Concerns About Immigration Status and Deportation
About one in ten (9%) Californians say that they or someone in their household has felt vulnerable in the last year because of their immigration status. Workers who are struggling with poverty are more than three times as likely as more economically secure workers to say their immigration status has made them feel vulnerable (17% vs. 5%).
Hispanic Californians are far more likely than members of other racial and ethnic groups to say they or someone in their household has felt vulnerable because of their immigration status in the last year. Almost one in five (18%) Hispanic residents say that they or someone in their household has felt vulnerable because of their immigration status. This rate is notably higher than the number of black (9%), API (5%), and white (1%) California residents who report similar concerns. These same patterns hold among workers struggling with poverty: Among this group, Hispanics are eight times more likely than their white counterparts to report feeling vulnerable about their immigration status (24% vs. 3%).
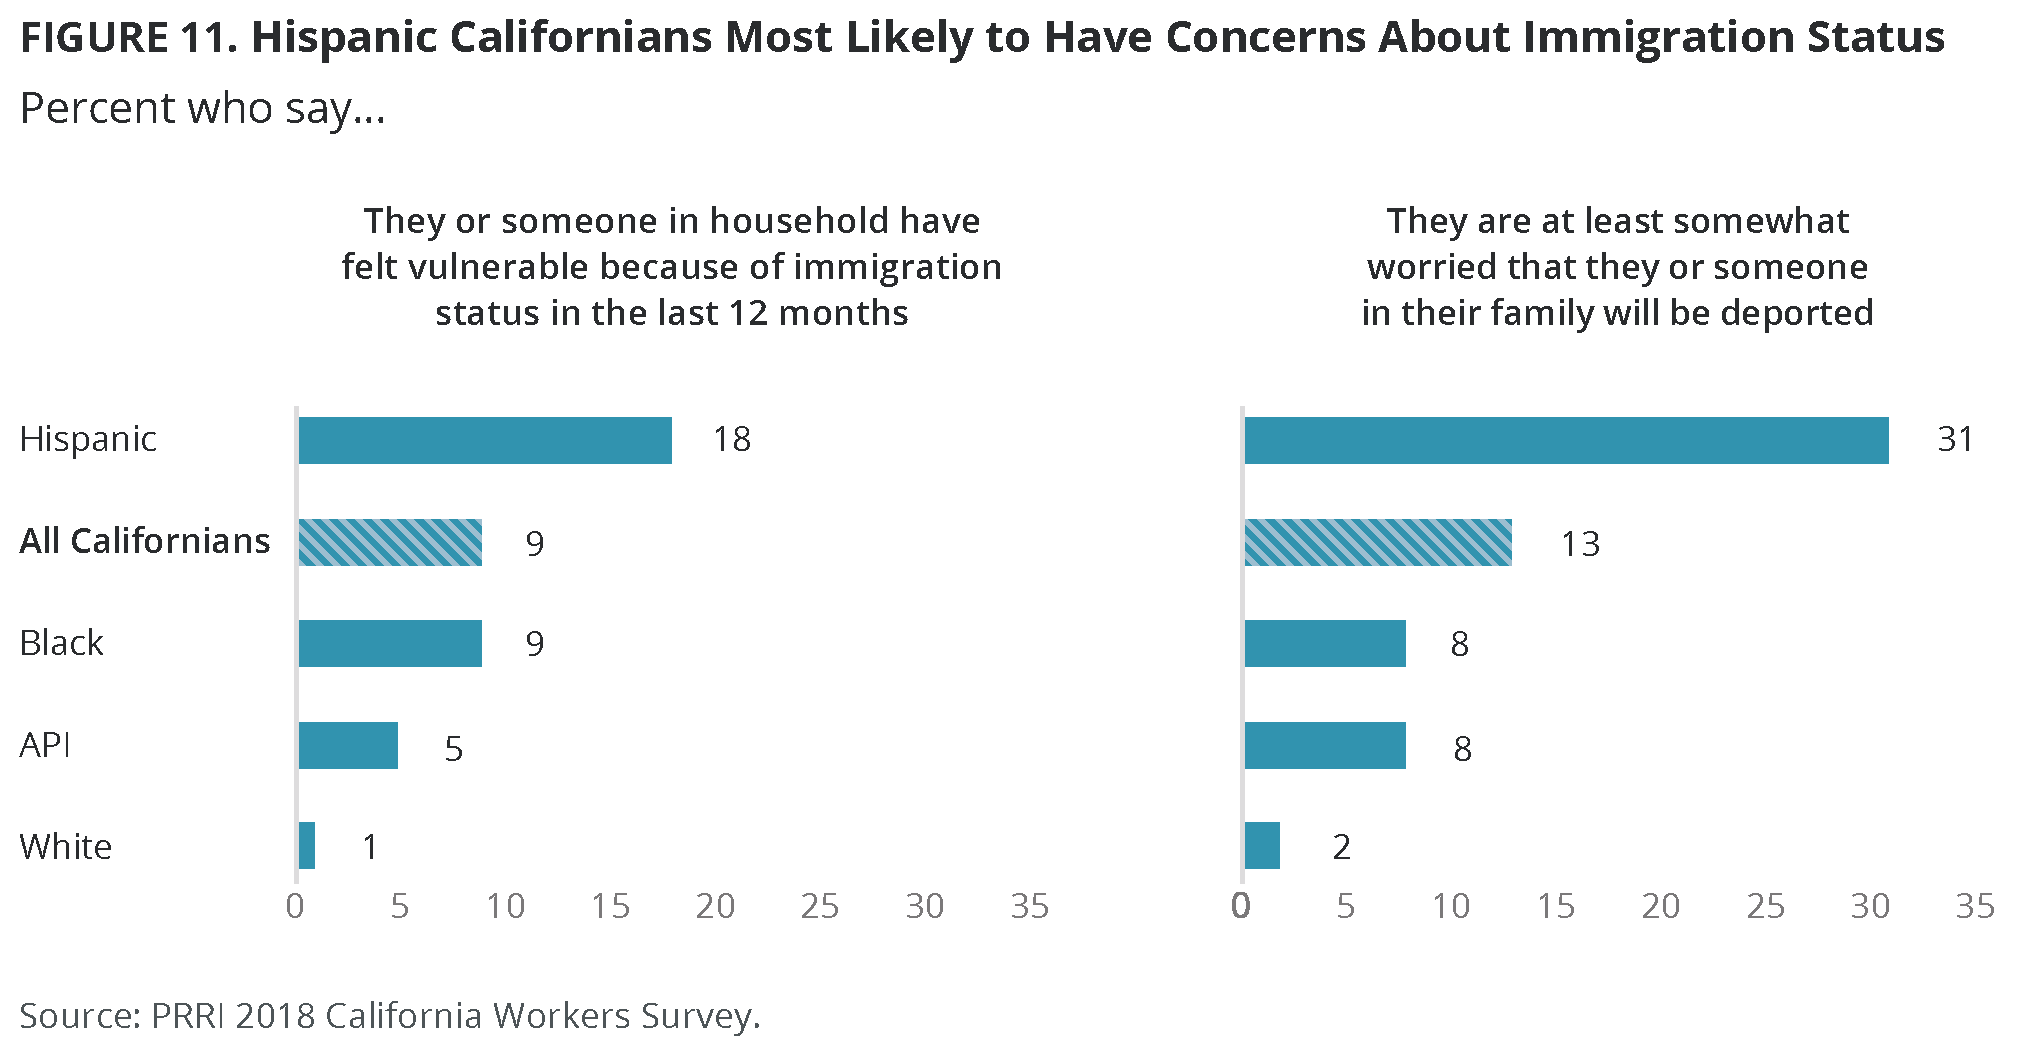
More than one in ten (13%) Californians say they are at least somewhat worried that they or a family member will be deported. Workers who are struggling with poverty are more than three times as likely as workers who are not struggling to say that are worried that they or a family member will be deported (7% vs. 27%).
Hispanic residents are far more likely than other Californians to worry about being deported. More than three in ten (31%) Hispanic Californians say they worry that they or a family member will be deported, while far fewer API (8%), black (8%), and white (2%) Californians share this concern. Once again, Hispanics who are working and struggling with poverty are far more likely than struggling workers who are white to be worried about deportation (39% vs. 4%).
Covering a $400 Emergency Expense
Roughly one-third (35%) of Californians say that it would be at least somewhat difficult to pay for a $400 emergency expense. A majority (56%) of workers struggling with poverty, compared to only 24% of those not struggling, report that it would be difficult or almost impossible to meet a $400 emergency expense.
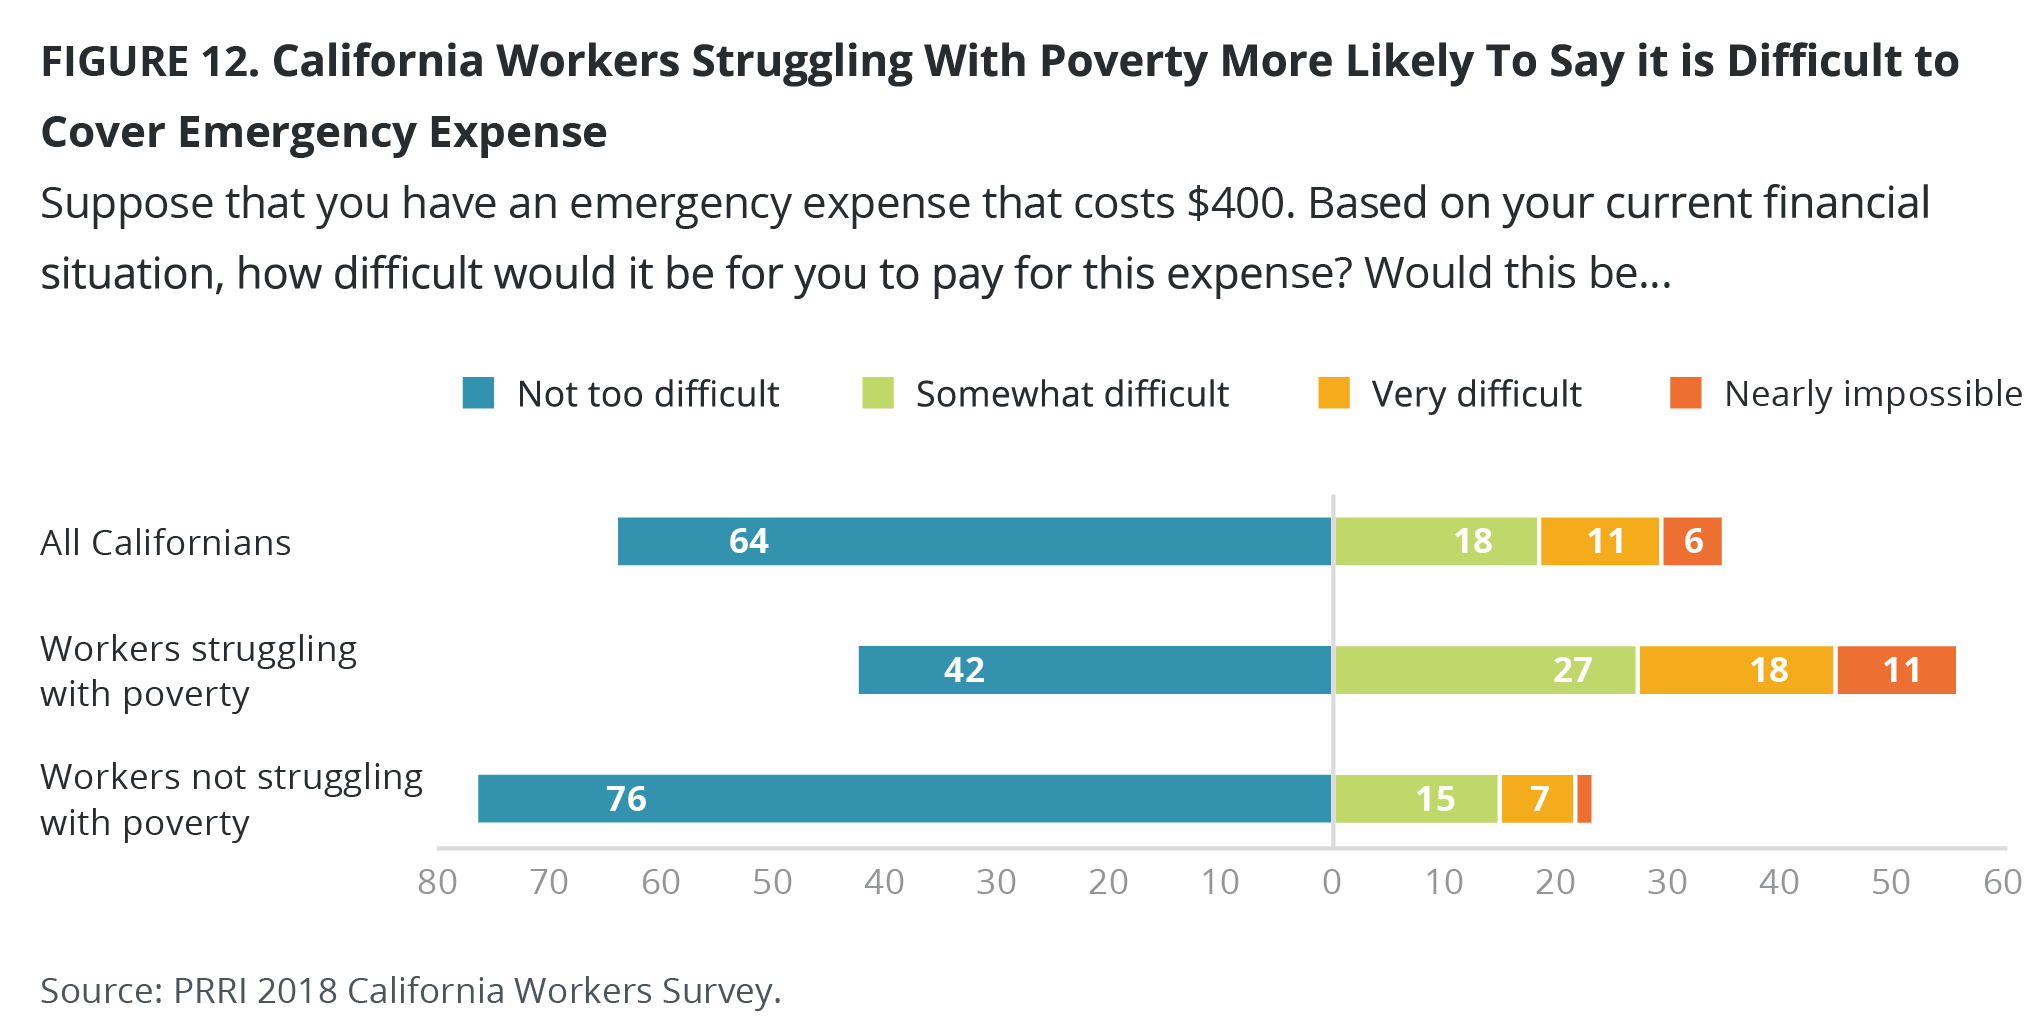
There are stark differences by educational attainment. Only 18% of Californians who graduated from a four-year college, compared to 43% of those without a four-year degree, say it would be difficult to pay a $400 emergency expense. Even among struggling workers, those with a college degree are significantly less likely than those without a four-year college education to say this would be at least somewhat difficult (43% vs. 58%).
Black and Hispanic Californians are much more likely than white and API Californians to say a $400 emergency expense would be very difficult to pay. Nearly half of black (49%) and Hispanic (46%) Californians say that it would be at least somewhat difficult to pay a $400 emergency expense. Substantially fewer white (25%) and API (22%) Californians say this would be difficult. However, among struggling workers, these racial and ethnic differences nearly disappear. Similar numbers of white (51%) and Hispanic (54%) Californians who are working and struggling with poverty say such an expense would be at least somewhat difficult to pay.
Young Californians in particular report that covering this expense would be challenging. A majority (52%) of young Californians (ages 18 – 29) say paying a $400 emergency expense would be at least somewhat difficult. Only 16% of California seniors (ages 65 and older) say the same.
The Working Lives of Californians
Who You Know? How Californians Get Jobs
More than half (54%) of Californians say that their personal connections, such as close friends, family members, or coworkers, did not help them get their current or most recent job, compared to 37% who say that their personal connections did help them.
Workers who are struggling with poverty are more likely than more economically secure workers to have used personal networks to secure employment. Nearly half (47%) of struggling workers, compared to 40% of workers who are not struggling with poverty, report that their close friends or family members helped them get their most recent job.
Among racial and ethnic groups, Hispanic and white Californians are most likely to have used a personal connection to help them get their current or most recent job. About four in ten Hispanic (41%) and white (37%) Californians report that their personal connections played a role in helping them get their most recent job, while fewer black (32%) and API (28%) Californians say the same. Among those working and struggling with poverty, similar numbers of Hispanic (50%) and white (47%) Californians report that their close friends or family members helped them get their most recent job.
Those living in the Sacramento Valley region are less likely than Californians in other regions to have received help from family or friends in their job search. Less than one-quarter (23%) of those in the Sacramento Valley region, compared to about four in ten residents of other regions, say that their personal connections helped them get their current or most recent job.
Young Californians (ages 18 – 29) are notably more likely than seniors (ages 65 and older) to have received help from their friends or family in securing their most recent job. Nearly four in ten (39%) young Californians, compared to only about one-quarter (26%) of California seniors, say that their personal connections helped them get their current or most recent job.
On the Clock: How Many Hours Are Californians Working?
When asked about how many hours they work in a typical week at their current or most recent job, about one-third (36%) of Californians say they work a standard 40-hour week. Thirty percent report that they work less than 40 hours in a typical week (30%), while 34% say they put in more than 40 hours, including more than one in five (22%) who report working in excess of 50 hours per week.
Workers who are struggling with poverty are more likely than workers who are not struggling to work less than 40 hours in a typical work week (38% vs. 23%). Roughly equal numbers of workers who are struggling with poverty (35%) and those who are not struggling (37%) report working 40 hours in a typical week, but struggling workers are somewhat less likely than more financially secure workers to work more than 40 hours in a typical week (26% vs 40%).
California workers who earn a salary stand out for the high number of hours per week they work. Nearly half (47%) of salaried workers put in over 40 hours in a typical week. In contrast, hourly workers and workers who are paid by the job are far less likely to work more than 40 hours per week (25% vs. 24%). About four in ten (39%) hourly workers report that they work less than 40 hours per week.
Stable or Inconsistent Income
Three-quarters (75%) of Californians report that their income mostly stays the same from month to month, while about one-quarter (23%) say that their income changes from month to month or seasonally.
Californians who are working and struggling with poverty are significantly more likely than more financially secure workers to report that their income varies from month to month or seasonally. Nearly four in ten (38%) struggling workers, compared to only 20% of workers who are not struggling, say their income fluctuates throughout the year. Nearly eight in ten (79%) workers who are not struggling say that their income mostly stays the same from month to month.
Hispanic Californians are more likely than members of any other racial or ethnic group to report having variable income. About one-third (34%) of Hispanic Californians have an income that changes from month to month or seasonally, compared to less than one in five white (18%), API (16%), and black (14%) Californians. These divides nearly disappear among those who are working and struggling with poverty. About four in ten Hispanic (41%) and white (38%) struggling workers report having an income that changes month to month or seasonally.
Other than Los Angeles, southern California regions tend to have greater numbers of residents with irregular income, compared with other parts of the state. About one-third of Californians living in the Central Coast (35%), San Joaquin Valley (31%), and Inland Empire (31%) regions report that their income changes from month to month or seasonally. More than one in five Californians in Los Angeles (22%) and the South Coast and Border (22%) regions, along with less than one in five of those in the Bay Area (17%) or Sacramento Valley (14%) regions, experience similar variations in their incomes.
Californians with lower levels of education are more likely to report an income that varies seasonally or month to month. About one-quarter (27%) of Californians who lack a four-year college education have an income that varies seasonally or month to month, while only 15% of Californians who are college graduates say the same.
How Long Are Californians Commuting?
On average, Californians have relatively modest commute times, although a significant number spend considerable time traveling to and from work. Close to half (45%) of Californians commute for less than half an hour round-trip on a typical work day. About one-quarter (26%) travel between 30 minutes and one hour, while 22% report travel times of between one and two hours round-trip. Few (7%) Californians report travel times in excess of two hours round-trip on a typical workday.10
Commute times do not differ appreciably between workers who are struggling with poverty and those who are not. Nearly half (47%) of struggling workers travel for less than 30 minutes to and from work, compared to about four in ten (42%) of those not struggling with poverty. A similar number of struggling and non-struggling workers (31% vs. 27%) spend at least one hour commuting to and from work each day.
Across racial and ethnic groups, however, there is considerable variability in daily commute time. Nearly half of white (49%) and Hispanic (45%) Californians report that their round-trip commute on a typical work day is under thirty minutes, while fewer than four in ten API (38%) and black (36%) Californians say the same. Black Californians are significantly more likely than any other racial or ethnic group to have a two-hour or longer commute. Nearly one in five (18%) black Californians report having a commute of this length, compared to fewer than one in ten Hispanic (8%), API (5%), or white (4%) Californians. Among those who are working and struggling with poverty, white and Hispanic Californians report similar commute times.
Average commute length also varies drastically by region. More than six in ten (63%) residents of the San Joaquin Valley have a round-trip commute that is under half an hour. More than half of those living in the Central Coast (56%) and Sacramento Valley (52%) regions—and less than half of those in the Inland Empire (46%), Bay Area (40%), South Coast and Border (40%), and Los Angeles (38%) regions—say the same. About one in ten residents of the Inland Empire (10%) and Central Coast (11%) regions have a commute of at least two hours round-trip as well as about one in twenty residents of every other region.
Challenges Faced by Californians in Their Working Lives
Difficulty of Taking Off Work for Personal Matters
Most Californians report that they have flexibility at work if they needed to take time off to take care of personal matters. More than three-quarters (76%) of Californians say it would not be too difficult to take a day or two off work to take care of personal or family matters. About one-quarter say it would be somewhat (17%) or very (6%) difficult to take time off work to address personal or family matters.
Californians who are working and struggling with poverty are twice as likely as more economically secure workers to say that it would be somewhat or very difficult to take time off work to deal with personal or family matters (33% vs. 16%).
Hispanic Californians are more likely than other residents to report that it would be difficult to take time off work to deal with family matters. Nearly three in ten (29%) Hispanic Californians say it would be very or somewhat difficult to take a day or two off work for this purpose, compared about one in five black (20%), white (19%), and API (18%) Californians. These racial differences disappear among those working and struggling with poverty, however. White Californians who are working and struggling with poverty are just about as likely as their Hispanic counterparts to say that it would be difficult to take a day or two off work (33% vs. 32%).
Ability to Take Vacations
Six in ten (60%) Californians say that they or someone in their household took a vacation that lasted more than three days in the last year, while about four in ten (39%) say that they did not.
Workers who are struggling with poverty are significantly less likely than those who are not struggling to have taken a vacation that lasted more than three days in the last year (46% vs. 71%).
There are stark racial and ethnic divides on whether Californians took vacations in the last year. Close to three-quarters (72%) of API Californians and more than six in ten black (65%) and white (62%) Californians say that they or someone in their household took a vacation that lasted more than three days at some point in the last 12 months. Only about half (51%) of Hispanic Californians reported the same, while nearly as many (47%) said that no one in their household took a vacation of more than three days in the past year.
Californians in different regions report taking vacations at varying frequencies. More than seven in ten residents of the Bay Area (72%) and Central Coast (72%) regions say that they or someone in their household took a vacation lasting more than three days in the last year. No more than six in ten residents of the Sacramento Valley (60%), Los Angeles (58%), or Inland Empire (56%) regions report the same experience. Notably, only about half of those in the South Coast and Border (54%) and the San Joaquin Valley (48%) regions say that they or someone in their household took a vacation that lasted more than three days in the last year.
Problems in the Workplace
Employees Feel Replaceable
Two-thirds (67%) of Californians say that employers generally see people like them as replaceable, while less than one-third (32%) disagree.
This sentiment is more common among workers who are struggling with poverty than workers who are in a more secure financial position. Three-quarters (75%) of struggling workers, compared to less than six in ten (56%) of those who are not struggling, say that employers generally see people like them as replaceable.
Hispanic Californians are particularly likely to feel dispensable at work. More than three-quarters (76%) of Hispanic Californians say that employers see people like them as replaceable, compared to about six in ten API (63%), white (62%), and black (57%) Californians. These racial differences are similar among those who are working and struggling with poverty. Hispanics in this group are more likely than their white counterparts to say that employers see people like them as replaceable (81% vs. 70%).
Wage Theft
A notable number of Californians report experiencing some form of wage theft in the last year. Nearly one-quarter (23%) report that they or someone in their household have been required to work through lunch or received no break at all during the workday in the last 12 months. About one in five (16%) report being required to work overtime without being paid for it. About one in ten (9%) report being paid less than minimum wage, while slightly fewer say they or anyone in their household have had their tips taken by another employee or employer (7%) or had their wages withheld without cause (6%) in the last year.
Overall, workers who are struggling with poverty are much more likely than more financially secure workers to report having had many of these experiences. Workers who are struggling with poverty are significantly more likely than workers who are not struggling to report that they or someone in their household has been paid less than the minimum wage (16% vs. 6%), had tips taken (12% vs. 5%), or had their wages withheld without cause (11% vs. 5%) in the last year.
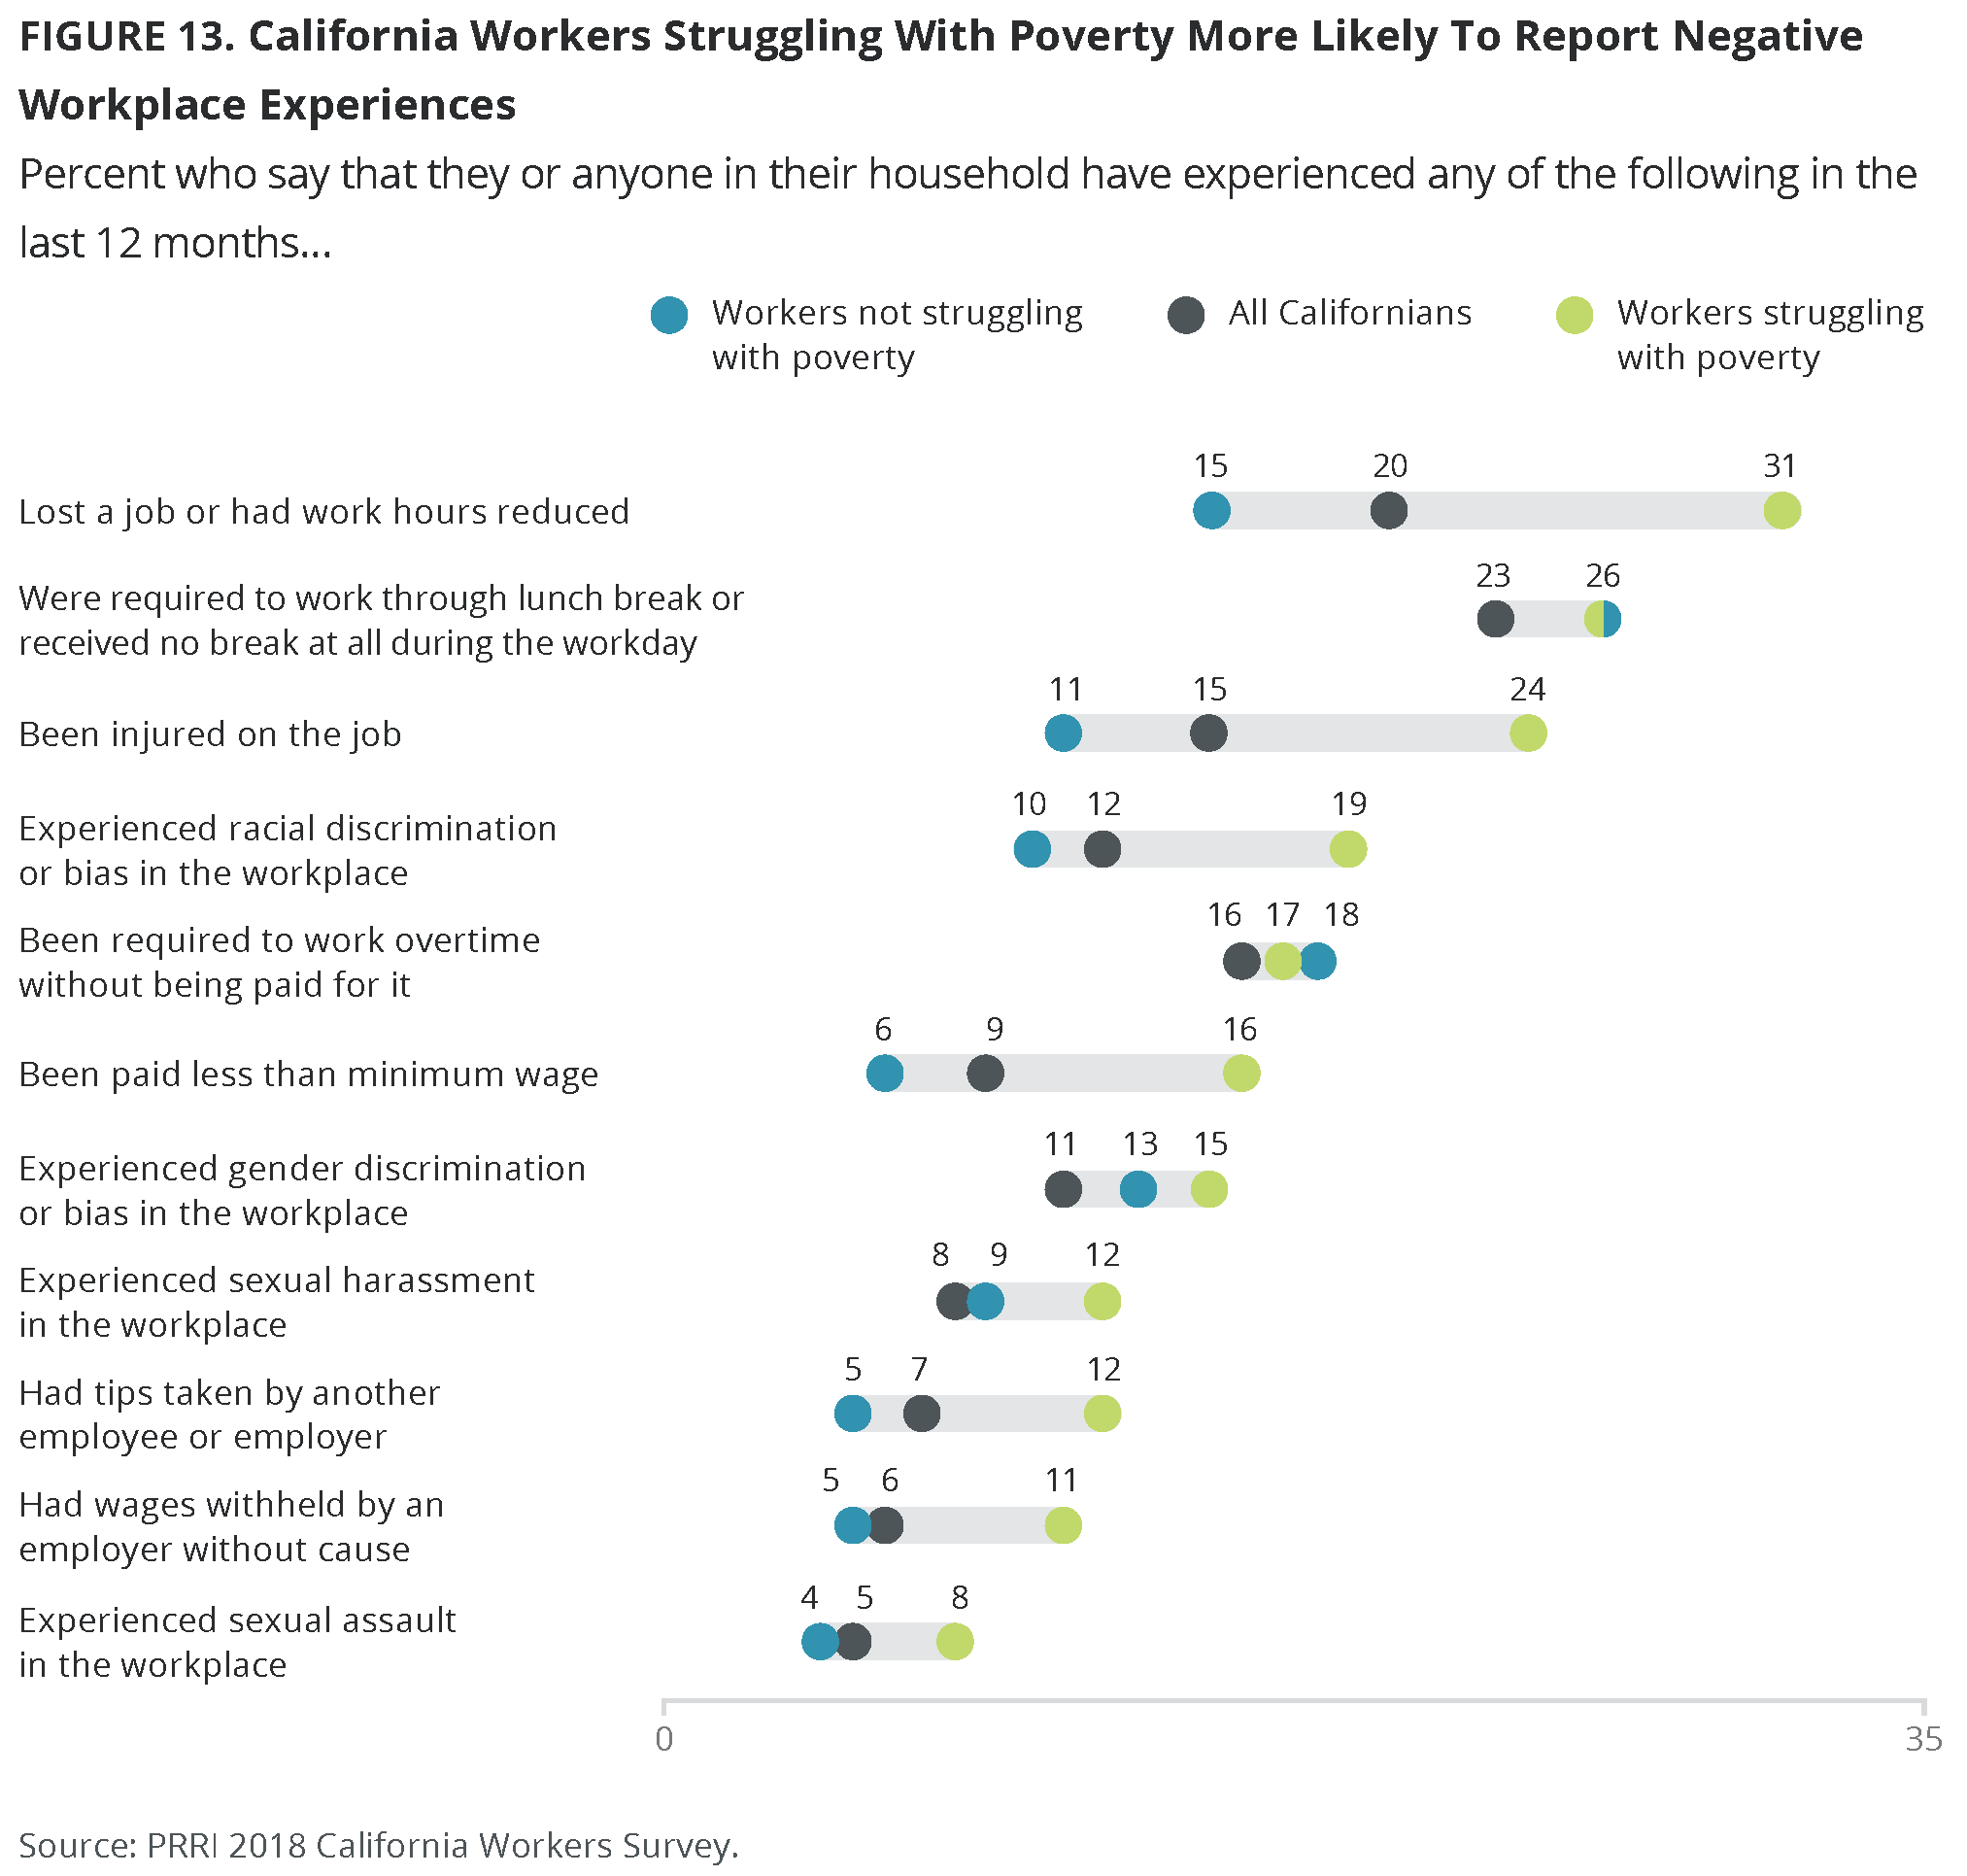
On several metrics, however, workers who are struggling with poverty report wage theft at levels that are similar to more economically secure workers. About one-quarter (26%) of both groups report they or someone in their household were required to work through their lunch break or received no break at all in the last year. In each group, nearly one in five workers struggling with poverty (17%) and those not struggling (18%) report being required to work overtime without being paid for it.
Sexual Harassment and Assault
Almost one in ten (8%) Californians report that they or someone in their household have been sexually harassed in the workplace in the last year, while five percent report that they or a household member have been sexually assaulted in their place of work within the last year.
Californians who are working but struggling with poverty are about as likely as those not struggling to report they or someone in their household have experienced sexual harassment (12% vs. 9%) or assault (8% vs. 4%). Female workers struggling with poverty are not more likely than female workers who are not struggling with poverty to report having personally experienced sexual harassment (9% vs. 7%) or sexual assault (4% vs. 3%) on the job.
Nine percent of women and seven percent of men say that they or a member of their household was sexually harassed within the past year, while identical numbers (5%) say someone in their household was assaulted.
Young Californians (ages 18 – 29) are substantially more likely than seniors (ages 65 and older) to say a household member was sexually harassed (14% vs. 3%) or sexually assaulted (8% vs. 1%) on the job in the last year.
Workplace Discrimination
More than one in ten Californians report that they or someone in their household have experienced racial (12%) or gender (11%) discrimination in the workplace in the last 12 months. Workers who are struggling with poverty are about twice as likely as workers who are doing better economically to report having experienced racial discrimination or bias in the workplace (19% vs. 10%). However, these groups report experiences of workplace gender discrimination in the last year at roughly the same levels (15% vs. 13%).
Women and men are about equally likely to say that they or someone in their household have experienced gender discrimination (12% vs. 11%)
Black and Hispanic Californians are more likely than white and API Californians to report that they or someone in their household have experienced racial discrimination in the workplace. About one in five black (20%) and Hispanic (19%) Californians, compared to about one in ten (11%) API Californians and only five percent of white Californians, report that a household member has experienced racial discrimination in the workplace.
Young Californians (ages 18 – 29) are nearly five times likelier than seniors (ages 65 and older) to report having experienced gender discrimination (19% vs. 4%). In addition, young nonwhite Californians are more than twice as likely as nonwhite seniors to report having experienced racial discrimination in the workplace (24% v. 9%).
Workplace Injury
Workplace injuries are not especially common among Californians, but they occur with much higher frequency among workers struggling with poverty. Fifteen percent of Californians overall report that they or someone in their household was injured on the job in the last year. However, workers who are struggling with poverty are about twice as likely as those who are not struggling to report having been injured at work at some point over the past year (24% vs. 11%).
Workplace injuries are reported with much higher frequency among Hispanic and black Californians. Nearly one-quarter (24%) of black Californians and 21% of Hispanic Californians say that they or a member of their household was injured on the job in the past year. White (9%) and API (10%) Californians report workplace injuries at about half the rate. However, among those working and struggling with poverty, white (24%) and Hispanic (21%) Californians report similar levels of workplace injury.
The Cumulative Impact of Negative Workplace Experiences
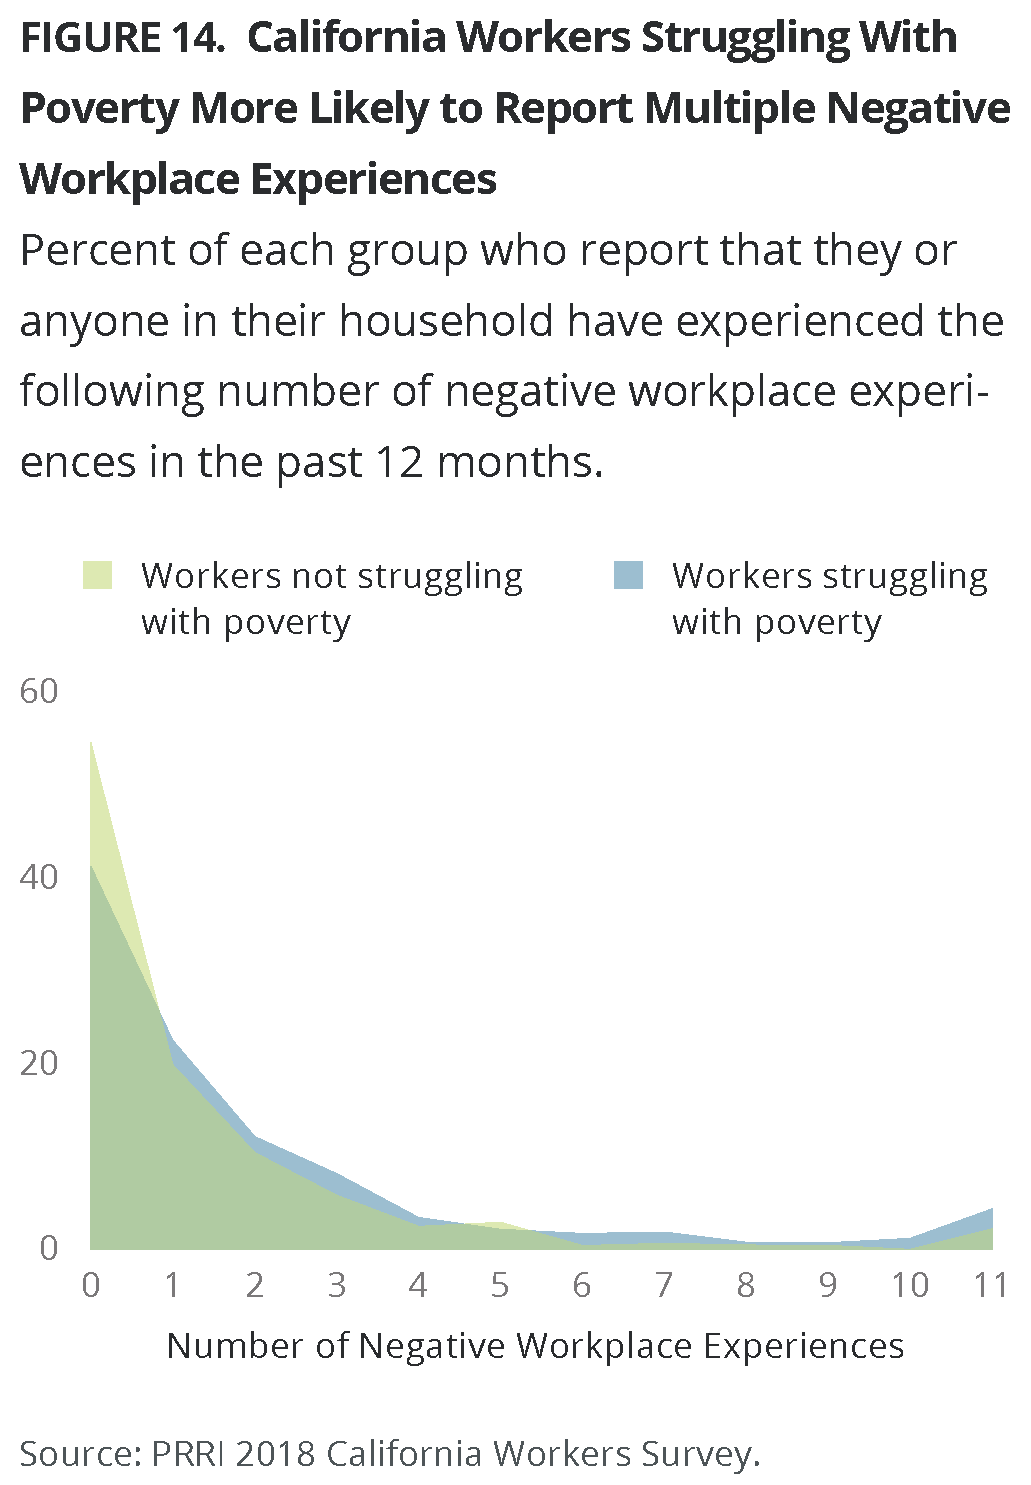 Cumulatively, more than half (54%) of Californians report that they or a member of their household have experienced none of the above-mentioned negative workplace experiences in the past year. More than one-third (36%) say they have experienced between one and three of these incidents, while about one in ten (11%) say they have dealt with four or more in the last year.
Workers struggling with poverty are far more likely than workers who are not struggling to have had at least one negative workplace experience (59% vs. 46%). Sixteen percent of workers struggling with poverty have experienced at least four of these types of negative incidents while only 10% of workers not struggling with poverty report the same.
Hispanic Californians are significantly more likely than members of other racial or ethnic groups to report multiple negative workplace experiences. Hispanic (18%) residents are more likely than API (10%), black (7%), and white (5%) residents to say they have experienced four or more of these negative incidents.
Concerns About Losing Jobs Because of Automation and Technology
Fewer than three in ten (29%) Californians report that they are very or somewhat worried that they or someone in their family will lose their job because of advances in technology or automation, while nearly seven in ten (69%) say they are not too worried or not at all worried about this possibility.
Among working Californians, those who are struggling with poverty are more than twice as likely to express concern about the threat of automation to jobs, compared to workers who are more financially secure. Nearly half (46%) of workers struggling with poverty say that they are very or somewhat worried that they or someone in their family will lose their job because of technology or automation. In contrast, only about one in five (21%) workers who are not struggling with poverty share this concern.
There are also sharp racial and ethnic differences in levels of concern about this issue. Close to half (45%) of Hispanic Californians say they are at least somewhat worried that they or someone in their family will lose their job as the result of automation. Substantially fewer API (27%), black (26%), and white (18%) Californians report being similarly worried about the impact of automation or technological innovation.
Anxiety levels about the impact of technology and automation also vary considerably by educational attainment. More than one-third (35%) of Californians without a college degree are worried that they or someone in their family will lose their job because of automation, but only about one in five (19%) Californians with a four-year college degree say the same.
Californians of different ages also report varying levels of concern about this issue. No group is more concerned about losing their job because of automation and technology than Californians ages 30 to 49. Nearly four in ten (38%) Californians in this age group report being worried about the impact of automation and technology, compared to 31% of young adults (ages 18 – 29), 26% of adults between the ages of 50 and 64, and 16% of seniors (ages 65 and older).
When Do Californians Plan to Retire, if Ever?
Among Californians who have not yet retired, less than half report that they plan to retire at the age of 65 (21%) or before (26%). One in five (20%) say they plan to continue working beyond the age of 65, and roughly one-third report that they never expect to retire, either because they cannot afford to (20%) or they don’t want to (12%).11
When it comes to retirement, workers who are struggling with poverty generally expect to retire later, or not at all. About four in ten workers who are struggling with poverty expect to retire at the age of 65 (20%) or earlier (22%). A majority of those who are working and struggling with poverty say they will retire after the age of 65 (20%) or will not retire at all (37%). In contrast, a majority of workers who are not struggling with poverty say they will retire at the age of 65 (22%) or earlier (31%). Twenty-two percent say they will retire after the age of 65, while one-quarter (25%) do not expect to retire at all.
The Gig Economy
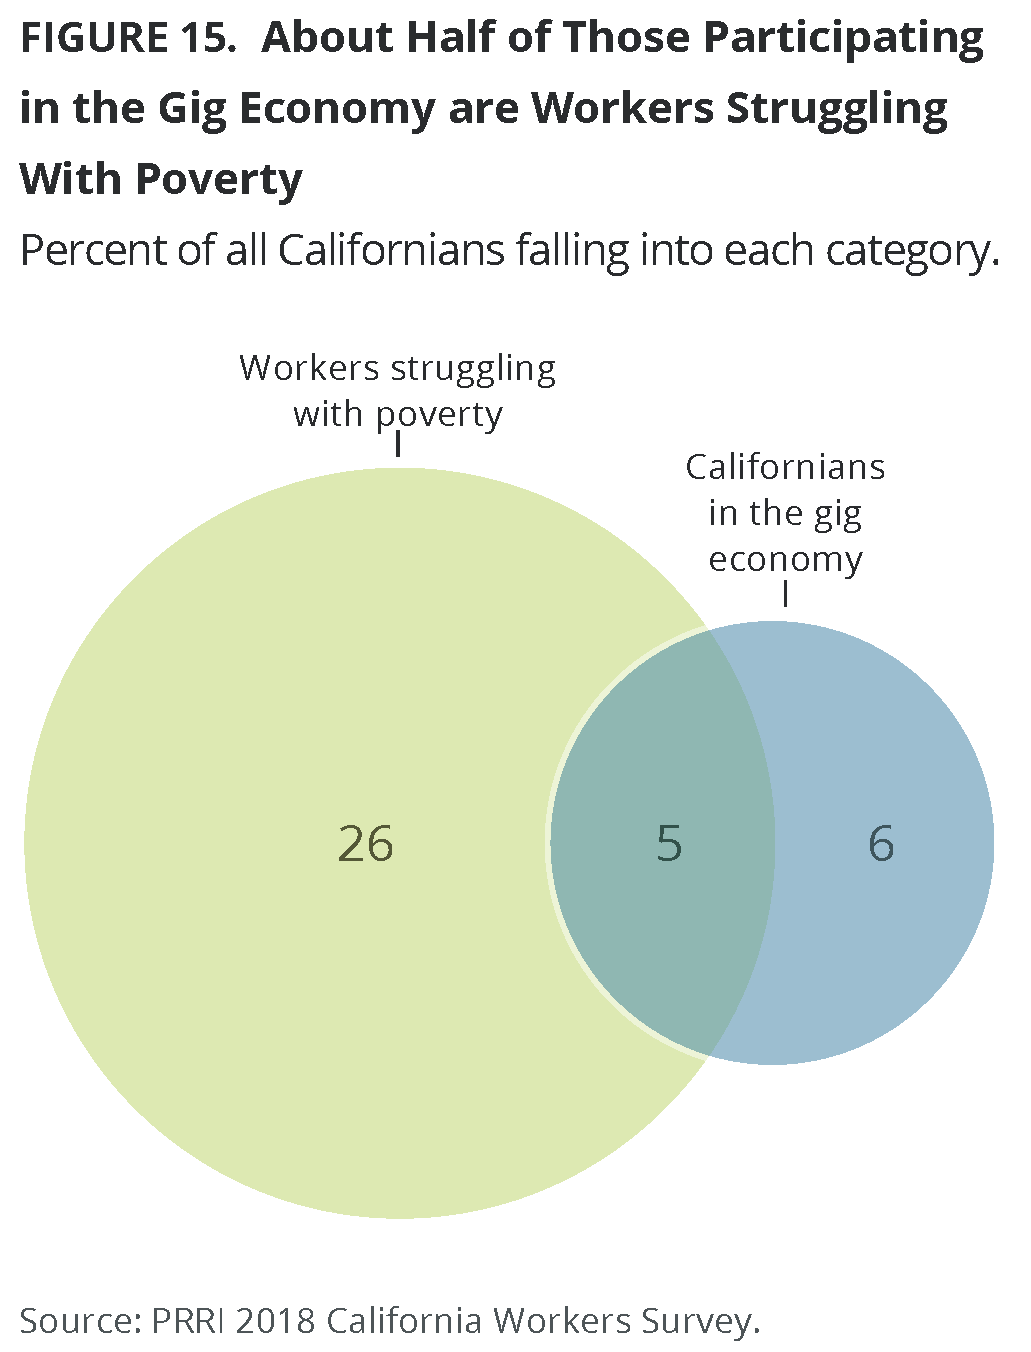
About one in ten (11%) Californians report participating in the gig economy, which is defined here as being paid for performing miscellaneous tasks or providing services for others, such as shopping, delivering household items, assisting with childcare, or driving for a ride-hailing app. Almost half (48%) of those who participate in the gig economy are workers who are struggling with poverty. The other half of gig economy participants are workers who are not struggling with poverty or people who are not traditionally defined as being in the workforce. Similarly, those who are working and struggling with poverty are more likely than workers who are not struggling with poverty to report having participated in the gig economy in the last year (17% vs. 9%).
 Similar numbers of Hispanic (13%), API (12%), black (9%), and white (9%) Californians report having participated in the gig economy. Identical numbers of men and women (11%) say they say they have participated in the gig economy in the last year.
Younger Californians (ages 18-29) report higher rates of gig work. About one in five (21%) young Californians say they have had a gig economy job in the last year—nearly equivalent to the number of Californians between the ages of 30 and 49 (12%), Californians between the ages of 50 and 64 (8%), and seniors (4%) who say they participated in the gig economy combined.
Notably, Californians without a four-year college education are about as likely as Californians who attended college to participate in the gig economy. About one in ten college-educated Californians (10%) and Californians without a college degree (12%) have participated in the gig economy in the past year.
Participation in the gig economy does not vary much by region. Similar percentages of Californians in areas across the state report participating in the gig economy.
Workplace Conditions for Those in the Gig Economy
Those who participate in the gig economy are likelier to report that they or someone in their household experienced negative workplace conditions in the last year than those who have not participated in it.12
Californians who participate in the gig economy are much more likely than residents who don’t participate in the gig economy to report that they or someone in their household has lost their job or had their hours reduced in the last year (38% vs. 18%). They are also much more likely to report conditions consistent with wage theft, including being required to work through lunch or receiving no break (36% vs. 22%), being required to work overtime without compensation (32% vs. 14%), being paid less than the minimum wage (29% vs. 7%), having their tips taken by another employee or employer (18% vs. 5%), or having their wages withheld without cause in the last year (18% vs. 5%).
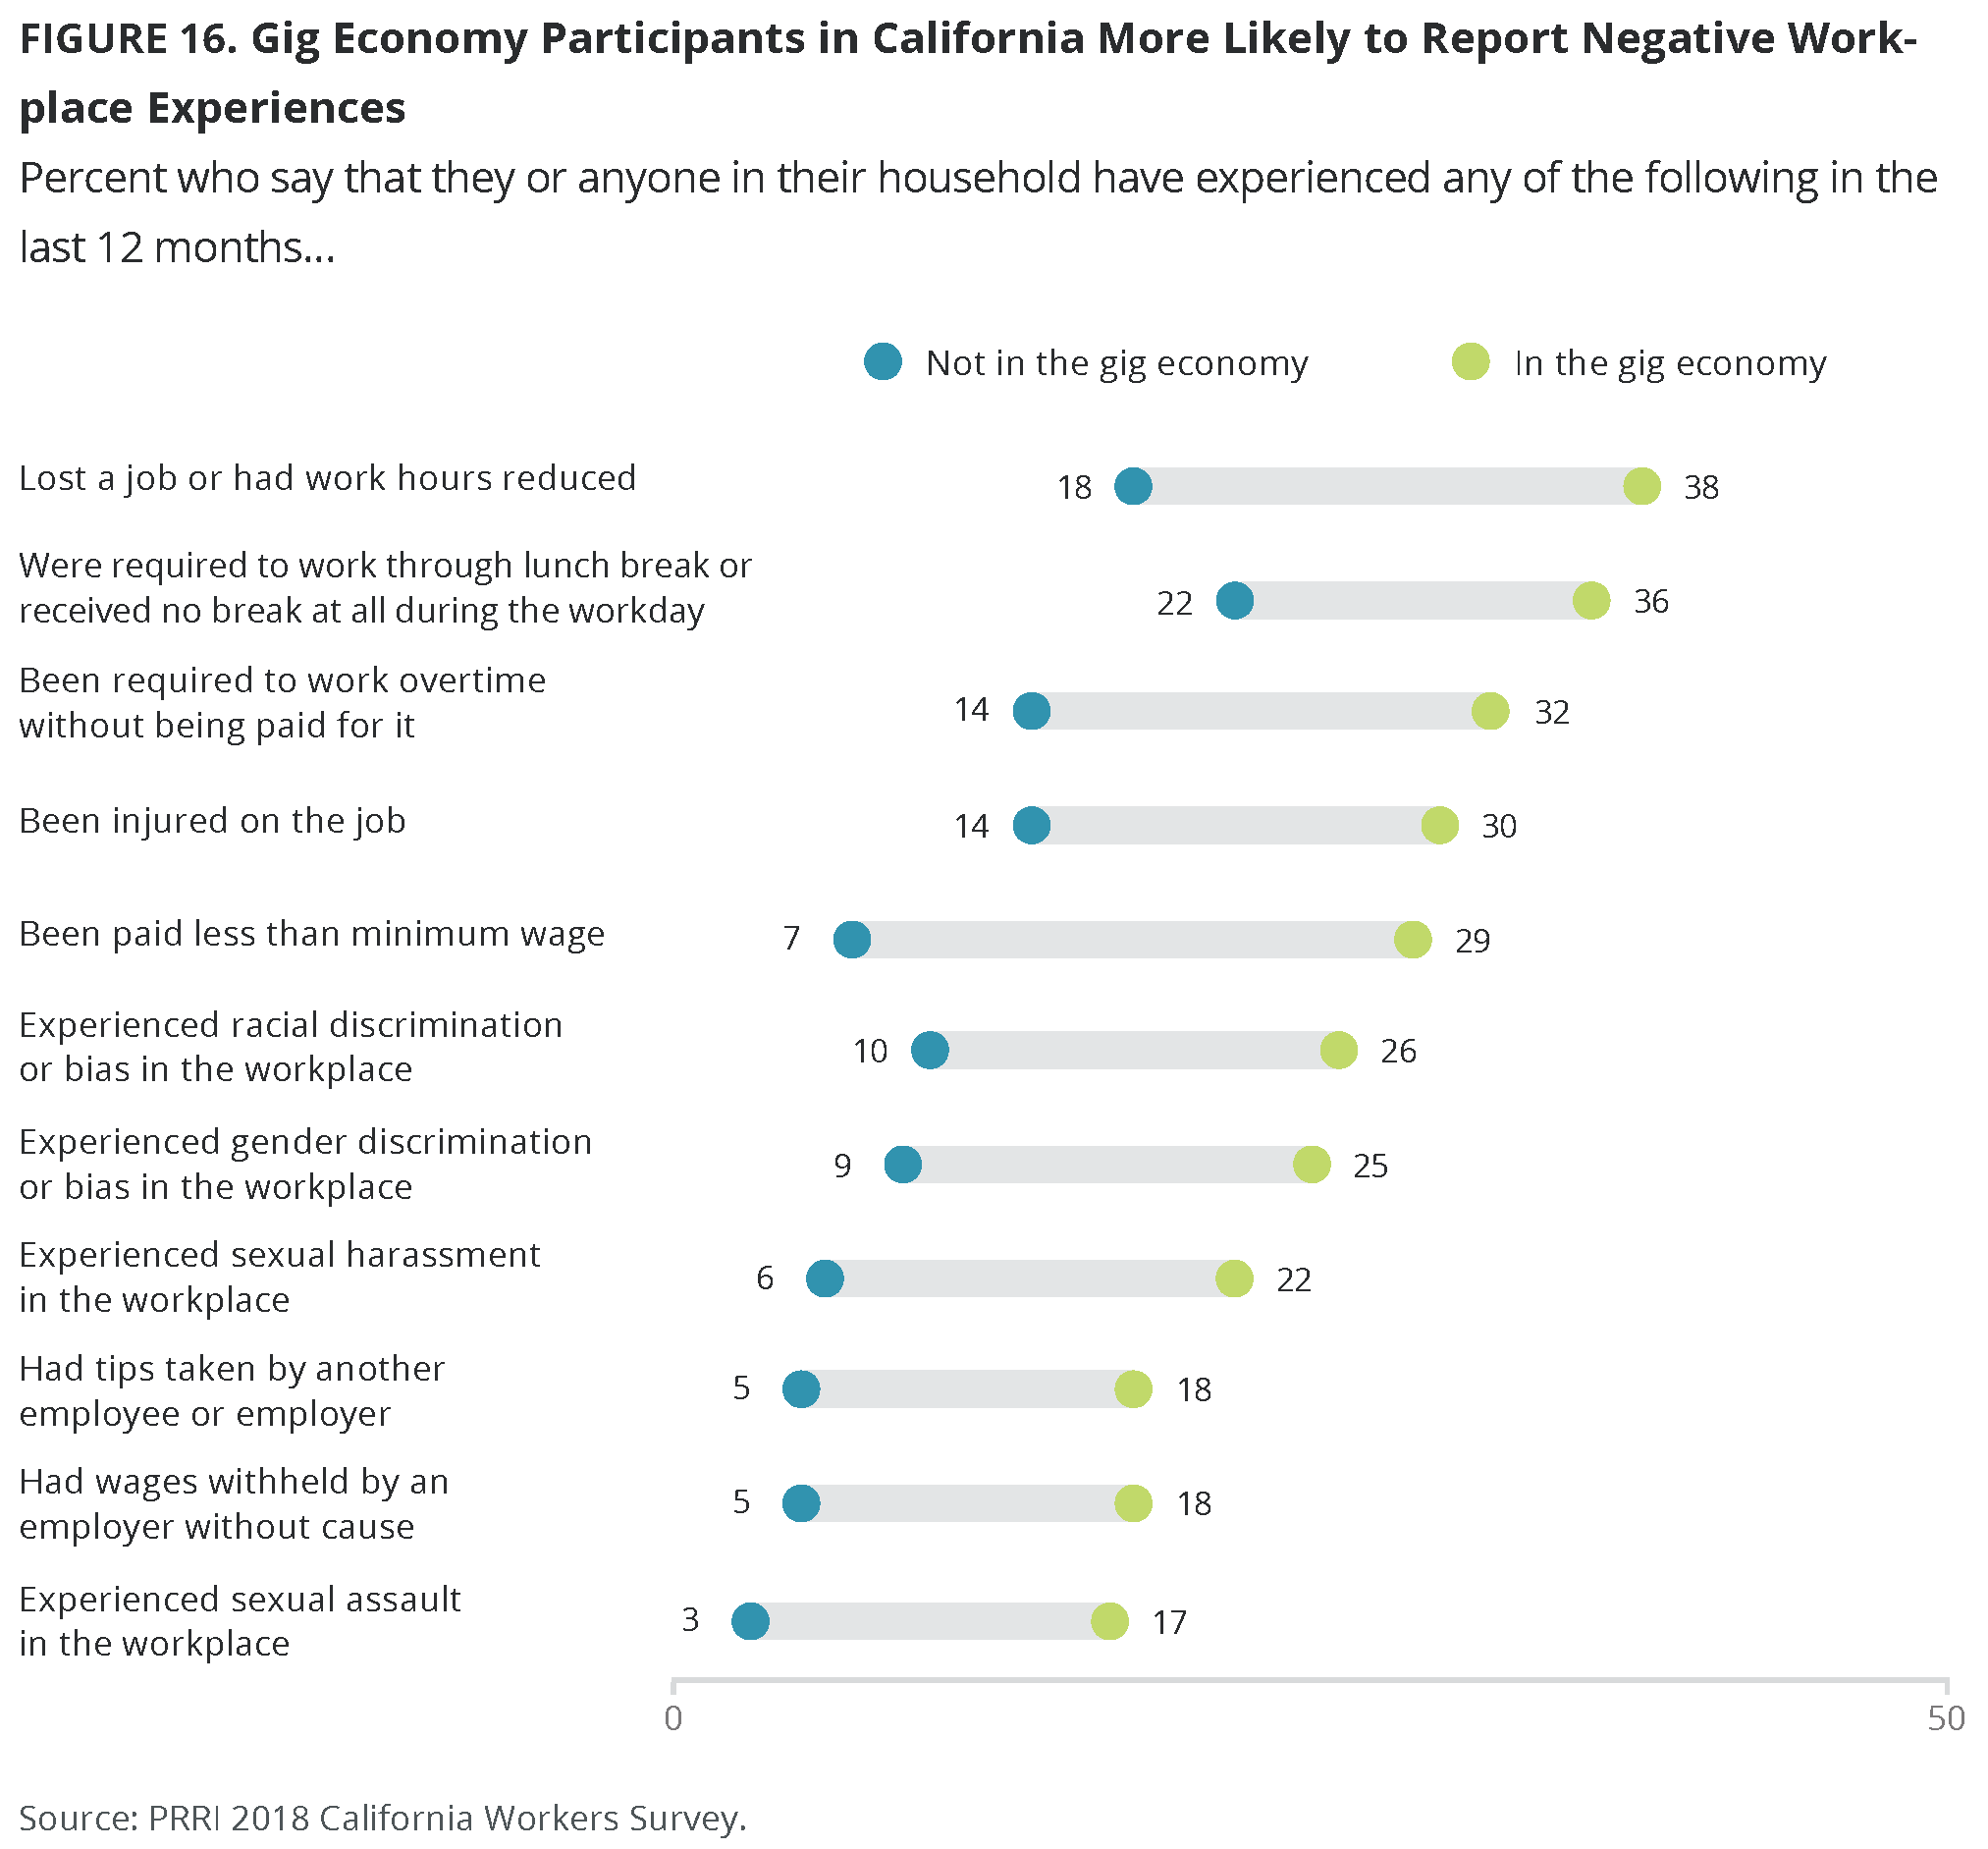
Gig economy participants are also more likely to report experiences of discrimination in the workplace. Around one-quarter of gig economy participants report they or someone in their household have experienced racial (26%) or gender (25%) discrimination in the workplace in the last year, compared to about one in ten (10% and 9%, respectively) Californians who are not gig economy participants. In addition, those participating in the gig economy are significantly more likely than Californians without a gig economy job to report that they or someone in their household have experienced sexual harassment (22% vs. 6%) or assault (17% vs. 3%) in the workplace in the last year.
Those participating in the gig economy are about twice as likely as those outside the gig economy to report that they or someone in their household experienced a workplace injury in the last year (30% vs. 14%).
Political Engagement and Outlook
Civic and Political Engagement
Most Californians do not report engaging in civic or political activities in the last 12 months. Less than one-quarter (24%) have signed a petition. About one in ten say they have commented about politics online (12%) or contacted a government official (11%). Even fewer report attending a protest or rally (7%), serving on a committee for a civic, nonprofit, or community organization (6%), sharing their opinion about local issues at a public meeting (5%), or contacting a media organization—such as a newspaper or live radio show—with a letter, email, or a phone call (4%).
Relatively few Californians engaged in several civic and political activities in the last year. About two-thirds (64%) of Californians report engaging in none of these activities. About one-quarter report having engaged in one (17%) or two (9%) of these activities in the last year, while nine percent say they have engaged in three or more of these activities in the past 12 months.<sup>13</sup>
Workers who are struggling with poverty report being far less active in political and civic affairs than other working Californians. Nearly eight in ten (79%) workers who are struggling with poverty report taking no civic or political actions in the past 12 months, compared to 58% of workers who are working but not struggling with poverty.
Civic and political engagement also varies by race and ethnicity. Hispanic (75%), black (66%), and API (65%) Californians are more likely to report engaging in none of these civic and political activities in the past year compared to white residents (55%). Similarly, a higher number of white Californians (13%) report being very politically and civically engaged—participating in at least three activities—compared to Hispanic (6%), black (4%), and API (4%) Californians.
These racial and ethnic differences extend to those who are working and struggling with poverty. Hispanic Californians who are working and struggling with poverty are more likely than their white counterparts to report participating in none of these activities in the last year (85% vs. 69%).
There are also notable age differences in Californians’ levels of civic and political participation. Young adults (ages 18 – 29) are more likely than seniors (ages 65 and older) to report having participated in none of these activities in the last year (65% vs. 53%). Conversely, seniors are almost four times as likely as young adults to report three or more civic and political engagements (15% vs. 4%).
Civic and political engagement also differs by educational attainment. More than seven in ten (72%) Californians without a four-year college degree report no civic and political engagement in the 12 months, compared to less than half (49%) of Californians with a four-year college degree. Meanwhile, college graduates are about three times likelier than those without a four-year college degree to be highly engaged (14% vs. 5%). These educational divides are similar to those that exist among Californians who are working but struggling with poverty.
Views of the Economic and Political System
Most Californians see American political and economic life as catering to the wealthy while being unresponsive to people like themselves. More than three-quarters (76%) of Californians agree that the economic system in this country unfairly favors the wealthy. Seven in ten (70%) Californians agree that public officials don’t care much about what people like them think. More than half (52%) of Californians agree that it doesn’t matter if they vote because politics and elections are controlled by people with money and big corporations.
There is broad agreement among workers, regardless of whether they are struggling with poverty, about the unfairness of America’s economic and political system. At least three-quarters of workers who are struggling with poverty (79%) and workers who are not struggling with poverty (75%) agree that the economic system in this country unfairly favors the wealthy. Similar numbers of workers who are struggling with poverty (63%) and who are not struggling (48%) agree that it doesn’t matter if they vote because politics and elections are controlled by people with money and big corporations. However, struggling workers are more likely than workers who are not struggling to say that public officials don’t care much about what people like them think (73% vs. 67%).
Worker Organizing
Nearly three-quarters (73%) of Californians agree that it is important for workers to organize so that employers do not take advantage of them. Among workers, those who are struggling with poverty are somewhat more likely than workers who are not struggling to say that organizing is important (80% vs. 70%).
Support for organizing among workers is robust across different racial and ethnic groups, but there are varying degrees of intensity. More than eight in ten (85%) Hispanic Californians, more than seven in ten black (77%), and API (71%) Californians, and more than six in ten (64%) white Californians to say that worker organizing is important. This general pattern persists among those who are working and struggling with poverty.
Younger Californians (ages 18 – 29) are also more likely than seniors (ages 65 and older) to agree that it is important for workers to organize so that employers do not take advantage of them. The overwhelming majority (82%) of young Californians agree with this sentiment, compared to about six in ten (63%) seniors.
Personal Values and Priorities
Children and Marriage
When asked about their life goals and values, Californians’ highest priority is being a good parent. When asked to evaluate which goals are most important, 70% of Californians say that being a good parent is the most important goal to them personally. About one in five (18%) say that being a good parent is very important but not the most important, and about one in ten say that this is only somewhat (5%) or not important (6%).
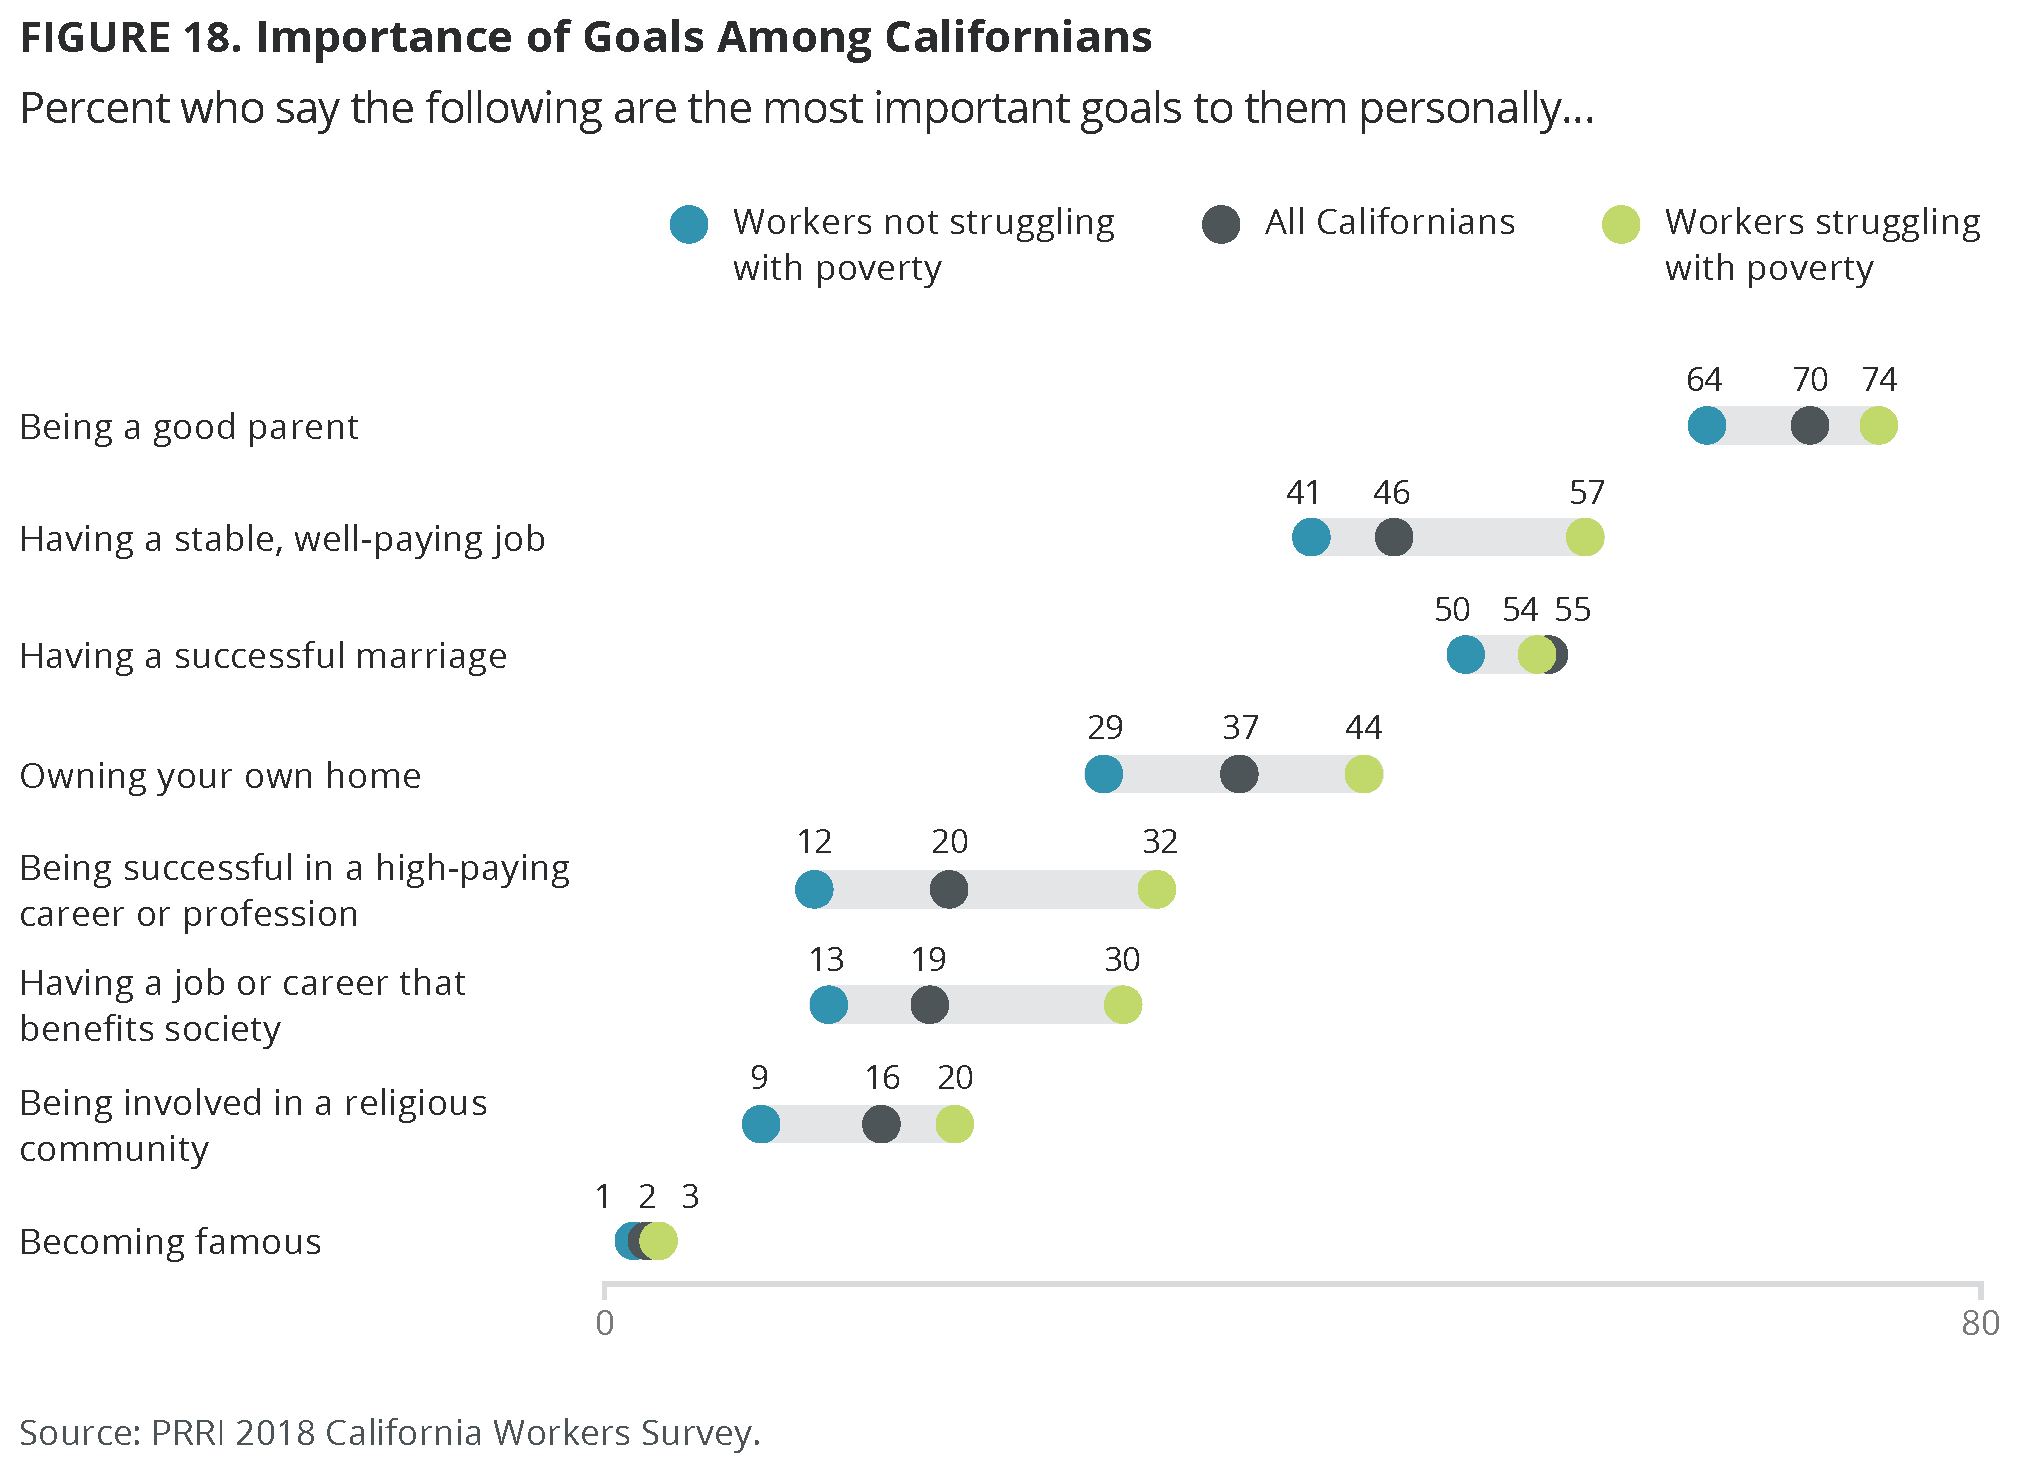
Californians who are working but struggling with poverty are more likely than those who are not struggling to say being a good parent is the most important goal to them personally (74% vs. 64%).
Notably, California women are more likely than men to say that being a good parent is the most important goal in their lives. More than three-quarters (76%) of women say that being a good parent is the most important goal in their life, compared to 64% of men.
Hispanic and black Californians place a particularly high value on being a good parent. More than three-quarters of Hispanic (78%) and black (76%) Californians say that being a good parent is the most important goal in their life. In contrast, about two-thirds (66%) of white Californians and roughly six in ten (62%) API Californians say the same. These racial and ethnic differences are similar among Hispanic and white Californians who are working and struggling with poverty.
Californians also value having a successful marriage. A majority (55%) of Californians say that having a successful marriage is the most important goal in their lives. About three in ten (29%) California residents say that having a successful marriage is very important, but not the most important goal in their lives. Fewer than one in five Californians say that having a successful marriage is somewhat important (8%) or not important (7%). Regardless of their economic condition, the prioritization of successful marriages is not demonstrably different among California workers.
Among racial and ethnic groups, Hispanic Californians are somewhat more likely to say that having a successful marriage is a priority. Six in ten (60%) Hispanic Californians say that having a successful marriage is the most important goal in their life, a view shared by a majority of API (54%), black (53%), and white (51%) Californians. These differences are also present among Hispanic (59%) and white (47%) Californians who are working and struggling with poverty.
Californians of different ages are divided in the emphasis they place on having a good marriage. California seniors (ages 65 and older) are far more likely than younger Californians (ages 18 to 29) report this is the most important goal in their life (62% vs. 42%).
Jobs, Careers, and Financial Security
When asked about the importance of various career goals in their lives, Californians are most likely to prioritize having a stable, well-paying job. Close to half (46%) of California residents say that having a stable, well-paying job is the most important goal in their life, while nearly as many (44%) say this is a very important goal, but not the most important. An additional one in ten say that having a stable, well-paying job is somewhat important (7%) or not important (3%).
Californians who are working but struggling with poverty are far more likely than workers who are not struggling to say that having a stable, well-paying job is their most important goal. Nearly six in ten (57%) Californians who are working but struggling with poverty say that having a stable, well-paying job is the most important goal in their life, a view shared by about four in ten (41%) California workers who are not struggling.
Nonwhite Californians are far more likely than their white counterparts to say that having a stable, well-paying job is the most important goal in their life. Nearly six in ten (58%) Hispanic Californians and about half of black (50%) and API (48%) Californians say this is the most important goal in their life. In contrast, only about one-third (34%) of white Californians rank this as the most important goal in their life. These differences are also present among Hispanic (61%) and white (46%) Californians who are working and struggling with poverty.
Californians are less likely to prioritize having a job or career that benefits society, compared to other career goals. Less than one in five (19%) Californians say this is the most important goal in their life, while about four in ten (39%) say it is very important but not the most important goal for them. About three in ten (29%) say that having a career that benefits society is somewhat important, and 11% say this is not an important goal.
Californians who are working but struggling with poverty are more than twice as likely as workers who are not struggling with poverty to say that having a career that benefits society is the most important goal in their life. Three in ten (30%) Californians who are working and struggling with poverty say that this is the most important goal in their life, a view shared by about one in ten (13%) Californians who are working but not struggling with poverty.
Nonwhite Californians are more likely to prioritize having a job that benefits society. Hispanic (29%), API (22%), and black (20%) Californians are more likely than white (9%) Californians to say that having a job that benefits society is the most important goal in their life. Among those working and struggling with poverty, there is a similar pattern: Hispanic Californians are three times as likely as white Californians to say this is their most important goal (33% vs. 11%).
Compared to having a career that benefits society, roughly the same proportion of Californians say that being successful in a high-paying career or profession is the most important goal in their life. One in five (20%) Californians say that being successful in a high-paying career is their most important goal, while nearly four in ten (37%) say that this is very important but not the most important goal for them. Thirty percent say that this is a somewhat important goal, while more than one in ten (12%) say they do not value this as a goal.
Californians’ economic conditions is also a major factor in the extent to which they value being successful in a high-paying profession. Californians who are working but struggling with poverty are significantly more likely than those not struggling to say this is the most important goal in their life (32% vs. 12%).
Notably, there are no major differences between Californian men and women in the extent to which they prioritize these career goals.
Home Ownership
Californians are more likely to prioritize owning their own home than being successful in a high-paying profession, but home ownership is not the top priority for many Californians. Nearly four in ten (37%) California residents say that owning their own home is the most important goal in their life. Roughly as many (39%) say this is very important but not the most important goal for them. About one-quarter of Californians say that home ownership is somewhat important (17%) or not important (6%) to them personally.
Californians who are working but struggling with poverty are more likely than those who are not struggling to prioritize owning their own home. More than four in ten (44%) Californians who are working and struggling with poverty say that owning their own home is the most important goal in their life, a view shared by less than three in ten (29%) workers who are not struggling.
Hispanic Californians stand out for the degree to which they value home ownership. A majority (52%) of Hispanic Californians say that this is the most important goal in their life, a view shared by roughly one-third of black (35%), API (32%), and white (27%) Californians. Similar differences exist between Hispanic and white Californians who are working and struggling with poverty.
There are notable differences by education as well. More than four in ten (43%) Californians who do not have a college degree say home ownership is the most important goal in their life, compared to only one-quarter (25%) of those with a four-year college degree. Among those working and struggling with poverty, the educational divide is similar.
There are also sizable differences by region in the prioritization of home ownership among Californians. Nearly half (46%) of Californians in the San Joaquin Valley say that home ownership is the most important goal in their lives. This view is shared by about four in ten residents of the Los Angeles (42%), Inland Empire (40%), Central Coast (40%), Sacramento Valley (38%), and South Coast and Border (36%) regions. Substantially fewer (28%) residents of the Bay Area, where home prices can be out of reach for even well-paid Californians, say this is the most important goal in their life. While those working and struggling with poverty each of in these regions were generally more likely than workers not struggling with poverty to prioritize home ownership, the regional differences among them were largely similar.
Religious Communities
While being involved in a religious community is a relatively low priority for most Californians, there are wide gaps based on religious affiliation. Fewer than one in five (16%) Californians say that being involved in a religious community is their most important goal in life, while a similar proportion (20%) say that this is very important to them, but not the most important goal. More than six in ten Californians say that being involved in a religious community is either somewhat (23%) or not (39%) important.
Among workers, those who are struggling with poverty are far more likely than workers who are not struggling to say they value being a part of a religious community. One in five Californians who are working and struggling with poverty say that participation in a religious community is the most important (20%) goal for them, while only nine percent of Californians who are working and not struggling with poverty say the same. About one in five (18%) Californians who are working and not struggling with poverty say that being part of a religious community is very important, but not the most important goal for them, and nearly three-quarters say that this is only somewhat important (22%) or not important (50%).
Hispanic Protestants and white evangelical Protestants in California stand out for highly valuing membership in a religious community. About four in ten Hispanic Protestants (43%) and white evangelical Protestants (39%) say that participation in a religious community is the most important goal in their life. In contrast, fewer than three in ten (29%) black Protestants, 17% of Hispanic Catholics, and fewer than one in ten white Catholics (9%) and white mainline Protestants (8%) say this is their most important goal in life. There is a nearly uniform consensus among the religiously unaffiliated that being a part of a religious community is not something they personally value. More than eight in ten (85%) Californians who are religiously unaffiliated say that being a part of a religious community is not important to them personally.
Methodological Appendix
Defining “Working and Struggling with Poverty”
While this report examines the lived conditions and perspectives of all Californians, it has also zeroed in on a special population—those “working and struggling with poverty.” This definition has, essentially, three moving parts—“working,” “struggling,” and “poverty”—the definitions of which are laid out below.
Working
For the purposes of this study, those who say they are currently employed full- or part-time and those who say they are unemployed but still seeking employment are defined as “working.”
Poverty
From the start of this study, there were two goals in the development of our definition of poverty:
- First, that it would be conceptually consistent with scholarly work and research in the public policy field.
- Second, that the measure would be parsimonious and therefore replicable—requiring a small number of dedicated questions that could be implemented easily in a future public opinion survey.
Consistent with the first goal, the metric was modeled after the California Poverty Measure (CPM)—a state-level version of the Census Bureau’s Supplemental Poverty Measure (SPM) developed by the Public Policy Institute of California and the Stanford Center on Poverty and Inequality. A poverty threshold is generated for each household using information about the number of people in the household and where the household is located within California.14 That threshold is compared to the household’s adjusted income—a measure that accounts for all of the household’s resources15 and expenses.16 Those with an adjusted income less than or equal to the threshold are considered to be “living in poverty.”
To meet the second goal, an abridged version of the CPM was developed—limiting the amount of economic inputs required while also preserving the most important features of the measure. Specifically, the number of adjustments made to household income—additional resources and costs—were reduced to those that had the biggest impact. At the poverty level we used as a cutoff for “struggling” (details below), these adjustments were child care costs and medical costs.17,18
The methodology for constructing the poverty threshold for each household—the amount against which household resources are compared—is identical to the one employed in the CPM. Household thresholds are adjusted by geographic location within California and by the composition of the household.19
Struggling
For this study, those households that have an adjusted income that is 250% of their poverty threshold or less are defined as struggling with poverty. So, if a household had a poverty threshold of $24,000—about the same threshold as the median respondent in the survey—that household would be defined as struggling with poverty if its adjusted income was $60,000.
This cutoff is meant to include not only those actively living in poverty but also those whose economic condition is tenuous. Individuals can cycle in and out of poverty as the circumstances of their lives fluctuate. Changes in family size, household income, unexpected medical costs, and a bevy of other events can push otherwise stable households into financial insecurity. The larger income range employed in this study is an attempt to reflect that economic reality.
Respondents meeting all three of these conditions are classified as working and struggling with poverty. This report also refers to those who are working but not struggling with poverty. These are individuals who are “working” and whose adjusted household incomes exceed 250% of their poverty threshold.
Survey Methodology
The PRRI 2018 California Workers Survey was conducted by PRRI among a random sample of 3,194 adults (age 18 and up) living in California who are part of GfK’s Knowledge Panel. Additionally, the survey includes 124 Californians who are working and struggling with poverty from NORC’s AmeriSpeak panel. This brought the total sample of Californians to 3,318 and the total sample of those working and struggling with poverty to 1,068.20 Interviews were conducted online in both English and Spanish between May 18 and June 11, 2018. The survey is supported by a grant from The James Irvine Foundation.
Respondents are recruited to the KnowledgePanel using an addressed-based sampling methodology from the Delivery Sequence File of the USPS—a database with full coverage of all delivery addresses in the U.S. As such, it covers all households regardless of their phone status, providing a representative online sample. Unlike opt-in panels, households are not permitted to “self-select” into the panel and are generally limited to how many surveys they can take within a given time period.
The initial sample drawn from the KnowledgePanel was adjusted using pre-stratification weights so that it approximates the adult U.S. population defined by the latest Current Population Survey. Next, a probability proportional to size (PPS) sampling scheme was used to select a representative sample. Once assigned to the survey, panel participants received an email notification on May 18th to complete the survey. Additional email reminders were sent out on May 21st, May 26th, and May 29th.
To reduce the effects of any non-response bias, a post-stratification adjustment was applied based on demographic distributions from the most recent Current Population Survey (CPS). The post-stratification weight rebalanced the sample based on the following benchmarks: age, race and ethnicity, gender, Census division, metro area, education, and income. The sample weighting was accomplished using an iterative proportional fitting (IFP) process that simultaneously balances the distributions of all variables. Weights were trimmed to prevent individual interviews from having too much influence on the final results. The final weight was computed to ensure that the demographic characteristics of the sample closely approximate the demographic characteristics of the target population.
The margin of error for the survey is +/- 2.8 percentage points at the 95% level of confidence. The design effect for the survey is 2.7. In addition to sampling error, surveys may also be subject to error or bias due to question wording, context and order effects.
Endnotes
1 These are the regions with a sufficient sample size to confidently estimate population characteristics. About 2% of the sample resides in two other rural regions not discussed in this report, North Coast and North State and Sierra.
2 This includes Californians who are retired, homemakers or stay at home parents, students, and people who are unemployed and not looking for work, disabled, or who refused to answer the question.
3 Here and throughout the report, “white” refers to non-Hispanic whites, “black” refers to non-Hispanic blacks
4 Values have been re-percentaged based on non-refuse responses.
5 An age comparison to all adult Californians is less illuminating because a significant portion of that population is beyond the typical age for participating in the workforce.
6 The analysis in this report is unable to give estimates among black and API workers struggling with poverty due to insufficient sample size.
7 Notably, the generational divide does not appear to be due to student loan debt. Californians who report having student loans are about equally likely to say a college education is a smart investment compared to those without student debt.
8 A majority (55%) of residents in the Bay Area have at least a four-year college degree. In no other part of the state do more than one-third of the region’s residents have a four-year college degree or more.
9 In this section, those who refused to answer a given question were coded as having not done or experienced the hardship.
10 Respondents’ answers refer to their current or most recent job.
11 All analysis in this section was conducted among Californians who are not yet retired.
12 Higher reported rates of a negative work experience or condition by someone who participates in the gig economy does not necessarily imply that these negative experiences occurred while working in the gig economy. These workers may, for example, be participating in the gig economy because of negative experiences at a more traditional workplace.
13 In this section, those who refused to answer a given question were coded as having not done the activity.
14 Creating thresholds based on geographic location helps account for the relative costs of living associated with different communities in California.
15 Resources include but are not limited to household income, tax benefits, and government programs, such as Social Security or the Supplemental Nutrition Assistance Program, that are aimed at alleviating the conditions of poverty.
16 Expenses include but are not limited to additional household costs associated with medical care, child care, work, and federal income taxes.
17 These adjustments were chosen after analysis of the Census’s 2017 Annual Social and Economic Supplement. This analysis consisted of testing which adjustments or combinations of adjustments to household income provided the best predictions of whether a household fell above or below the 250% poverty line definition used in this report. Adjusting for medical costs and child care costs—essentially lowering the resources available to a household in our calculations– increased the accuracy of household categorization better than any other combination of resource adjustments.
18 The following process was used to derive precise dollar values for household income, medical costs, and childcare costs. Respondents were offered broad response categories that covered a range of values (e.g. $5,000 to $7,499) in order to promote question completion. Those ranges were matched with the median value given by respondents in the Census’s 2017 Annual Social and Economic Supplement for a particular question. For example, if a respondent in our survey reported a household income between $5,000 and $7,499, they were matched with the median real dollar value for Californians who reported making between $5,000 and $7,499 dollars in the 2017 Annual Social and Economic Supplement. That median value was used to compute the adjusted household income that would eventually be compared against their individualized poverty threshold.
19 For more on the latest poverty thresholds used by the CPM see: http://www.ppic.org/publication/poverty-in-california/
20 In order to oversample our target population—those Californians who are working and struggling with poverty—we created a predictive model using data from the Census’s 2017 Annual Social and Economic Supplement (ASEC). First, we identified those individual-level and household-level characteristics that appeared in both the demographic profile of GfK’s Knowledge Panel and the ASEC. Second, we created a predictive model from the ASEC data using those analogous characteristics—predicting whether individuals fell above or below the 250% poverty line using characteristics like household size, income, race, and education. Finally, the predictors from this model were applied to GfK’s data—essentially using ASEC as a “donor” dataset to make predictions about this “working and struggling with poverty” characteristic that could not be readily identified in the GfK Knowledge Panel. Individuals living in households that had a high likelihood of falling into the “working and struggling with poverty” category based on the model were then oversampled.
Recommended citation:
Robert P. Jones, PhD, Daniel Cox, PhD, Rob Griffin, PhD, Maxine Najle, PhD, Molly Fisch-Friedman, and Alex Vandermaas-Peeler. “A Renewed Struggle for the American Dream: PRRI 2018 California Workers Survey.” PRRI. 2018. https://www.prri.org/research/renewed_struggle_for_the_american_dream-prri_2018_california_workers_survey.


