Searching for Spirituality in the U.S.: A New Look at the Spiritual but Not Religious
Executive Summary
The relationship between spirituality and religiosity among Americans today is complex. To measure these dimensions, PRRI developed two composite indexes. One measured spirituality using self-reported experiences of being connected to something larger than oneself. The other measured religiosity using frequency of religious attendance and the personal importance of religion. Based on this analysis, Americans fall into the following four categories:
- 29% are both spiritual and religious;
- 18% are spiritual but not religious;
- 22% are not spiritual but religious; and
- 31% are neither spiritual nor religious.
Most Americans who are spiritual but not religious still identify with a religious tradition.
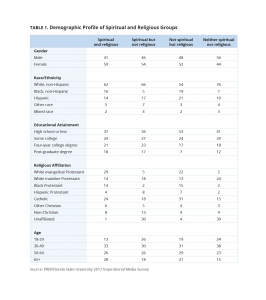
Only three in ten (30%) spiritual but not religious Americans are religiously unaffiliated. Roughly one in five (18%) identify as white mainline Protestant, and an equal number (18%) identify as Catholic. Thirteen percent belong to a non-Christian religious tradition, such as Buddhism, Hinduism, or Judaism. Only 10% are nonwhite Protestant, and five percent are white evangelical Protestant.
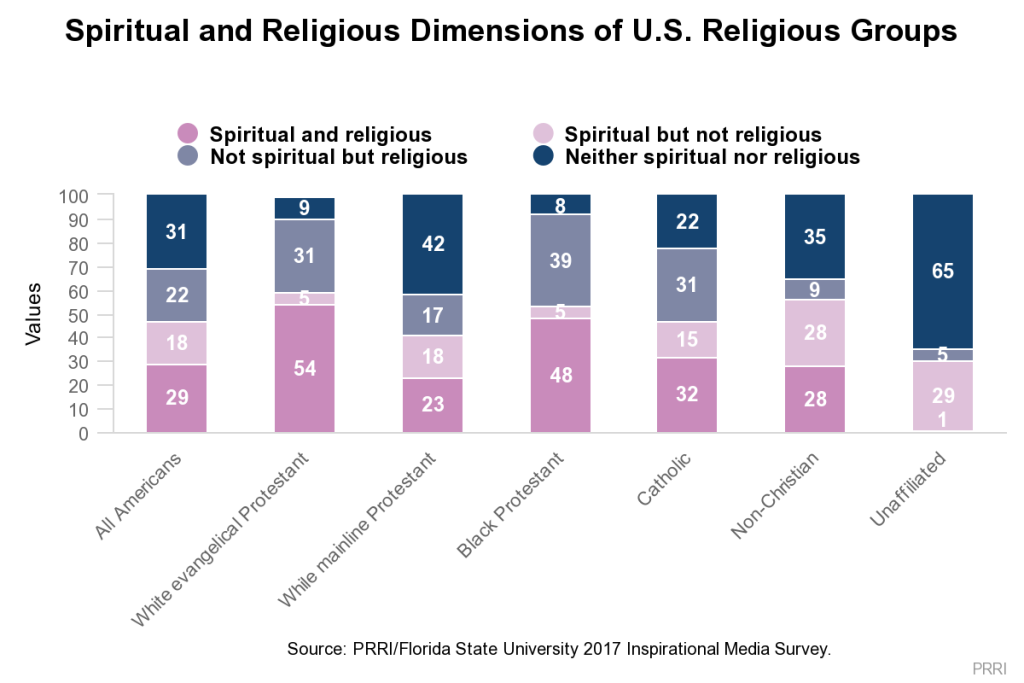
Among religiously unaffiliated Americans, only about three in ten (29%) can be categorized as spiritual but not religious.
About two-thirds (65%) of religiously unaffiliated Americans are neither spiritual nor religious, compared to five percent who are not spiritual but religious and one percent who are both spiritual and religious.
Nonreligious Americans—including those who are spiritual but not religious—are substantially younger than religious Americans.
A majority of Americans who are spiritual but not religious (56%) and those who are neither spiritual nor religious (62%) are under the age of 50. Fewer Americans who are not spiritual but religious (50%) or who are spiritual and religious (46%) are under the age of 50.
Spiritual but not religious Americans are significantly more liberal than other Americans.
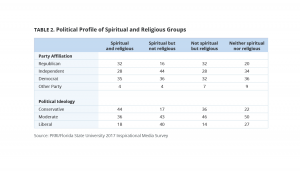
Four in ten (40%) Americans who are spiritual but not religious are liberal, compared to 24% of the general population. Among the other groups, 27% of neither spiritual nor religious Americans, 18% of spiritual and religious Americans, and 14% of not spiritual but religious Americans identify as liberal.
Higher levels of spirituality are strongly related with higher life satisfaction across a range of measures.
More than six in ten (61%) spiritual but not religious Americans and seven in ten (70%) spiritual and religious Americans are very or completely satisfied with their lives overall. Only 53% of those who are not spiritual but religious and fewer than half (47%) of those who are neither spiritual nor religious say the same.
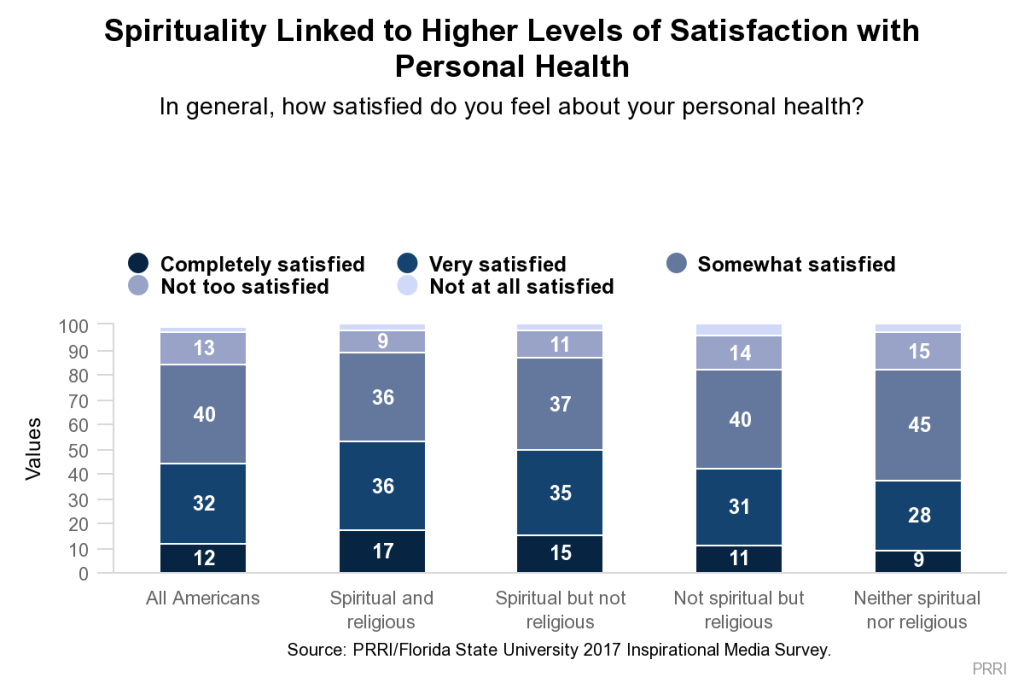
- Similarly, half (50%) of Americans who are spiritual but not religious, and 53% of those who are spiritual and religious, report being satisfied with their personal health. In contrast, about four in ten of those who are not spiritual but religious (42%) and those who are neither spiritual nor religious (37%) report being satisfied with their health.
Americans who are more spiritually oriented are more apt to engage in various kinds of pro-social behaviors.
Thirty-six percent of spiritual Americans —a category that includes Americans who are spiritual but not religious and those who are spiritual and religious—report having done a personal favor for a friend or coworker within the last week, compared to only 22% of nonspiritual Americans.
- Roughly four in ten (41%) spiritual Americans say they have allowed someone to cut ahead of them in line within the last week, compared to only 30% of nonspiritual Americans.
Spiritual Americans are substantially more likely than those who are less spiritual to have inspirational experiences when engaging with various types of media.
- Roughly half (49%) of spiritual Americans, including an identical number (49%) of the spiritual but not religious, report that they felt moved, touched, or inspired while watching television in the last week. More than one-third (36%) of nonspiritual Americans report a similar experience.
- Roughly seven in ten (71%) spiritual Americans—including 69% of the spiritual but not religious—say they have been touched, moved, or inspired within the last week while listening to a song or piece of music. About four in ten (43%) nonspiritual Americans report having this experience.
Introduction: Religious Change and the Rise of Spirituality
The American religious landscape is undergoing unprecedented tectonic shifts in identity and practice. Americans who do not identify with any religious group—the religiously unaffiliated—now account for nearly one-quarter (24%) of the adult public, tripling in size over the last 25 years.1 At the same time, trust in religious institutions has fallen to historic lows. According to Gallup, only 42% of the public report having a “great deal” or “quite a lot” of confidence in organized religion. This is the lowest mark in the more than 40 years Gallup has canvassed American opinion on this topic. At its peak in 1975, more than two-thirds (68%) expressed confidence in organized religion.2
The decline of formal religious affiliation and the rising distrust of institutional religion have led some scholars to question whether the fundamental nature of religious practice and belief is changing. Rising rates of disaffiliation may not necessarily indicate an increasingly secular orientation but rather an abandonment of traditional religious practices in favor of a more personalized and customizable spirituality. This argument—that in leaving formal religion, many people who disaffiliate are not becoming secular, but instead are identifying as “spiritual but not religious”—is supported by research that shows growing interest in spirituality.3
There is some evidence to suggest that interest in spirituality and spiritual activities, such as meditation and yoga, is increasing. A report from the Pew Research Center found that Americans are more likely to report feeling a deep sense of spiritual peace and well-being or a sense of wonder about the universe than they were a few years earlier.4 A CDC study, published earlier this year, found that participation in yoga nearly doubled from 2002 to 2012.5
Despite the widespread attention that the spiritual but not religious group has received in recent years, there have been few efforts to undertake a rigorous investigation of the complex interplay of spirituality and religiosity among the American public. This report focuses on the group of Americans who are spiritual but not religious and explores the unique contribution that spirituality makes on personal behavior and decisions.
Measuring Spirituality and Religiosity
Spirituality is a complex concept with a wide variety of possible meanings. Because this concept is inherently subjective—many activities and experiences can be imbued with spiritual meaning—developing a standard definition poses challenges.
The approach we have taken here is to measure spirituality using self-reported experiences related to feelings of being connected to something larger than oneself. We developed a battery of eight statements that were posed to a nationally representative sample of Americans about how often they had a variety of different experiences related to spirituality. Three questions in particular were highly correlated and seemed to all tap a broader concept that fit well with definitions of what it means to be a spiritual person. These three questions asked Americans how often they “felt particularly connected to the world around you,” “felt like you were a part of something much larger than yourself,” and “felt a sense of larger meaning or purpose in life.”6 We combined these three measures to create a single composite measure of spirituality.
We also combined two measures of religious commitment—religious participation (how often Americans attend formal worship services) and religious salience (how important Americans report religion is in their personal lives)—to create a composite measure of religiosity.
We collapsed the spirituality and religiosity indexes to create a typology of four groups: spiritual and religious; spiritual but not religious; not spiritual but religious; and neither spiritual nor religious:
- Spiritual and religious: people who are both more spiritual and more religious than average;
- Spiritual but not religious: people who are more spiritual than average, but less religious than average;
- Not spiritual but religious: people who are less spiritual than average, but more religious than average;
- Neither spiritual nor religious: people who are both less spiritual and less religious than average.
In general, spirituality and religiosity are highly associated with one another. People who are highly spiritual are, on average, also highly religious. Conversely, those who are not that spiritual tend to be not that religious. Among all Americans, the two largest groups include those who are both spiritual and religious and those who are neither. Overall, about one-third (31%) of Americans are neither spiritual nor religious, meaning that they do not feel particularly spiritual and religion is not a central part of their lives, while nearly as many (29%) Americans are both spiritual and religious.
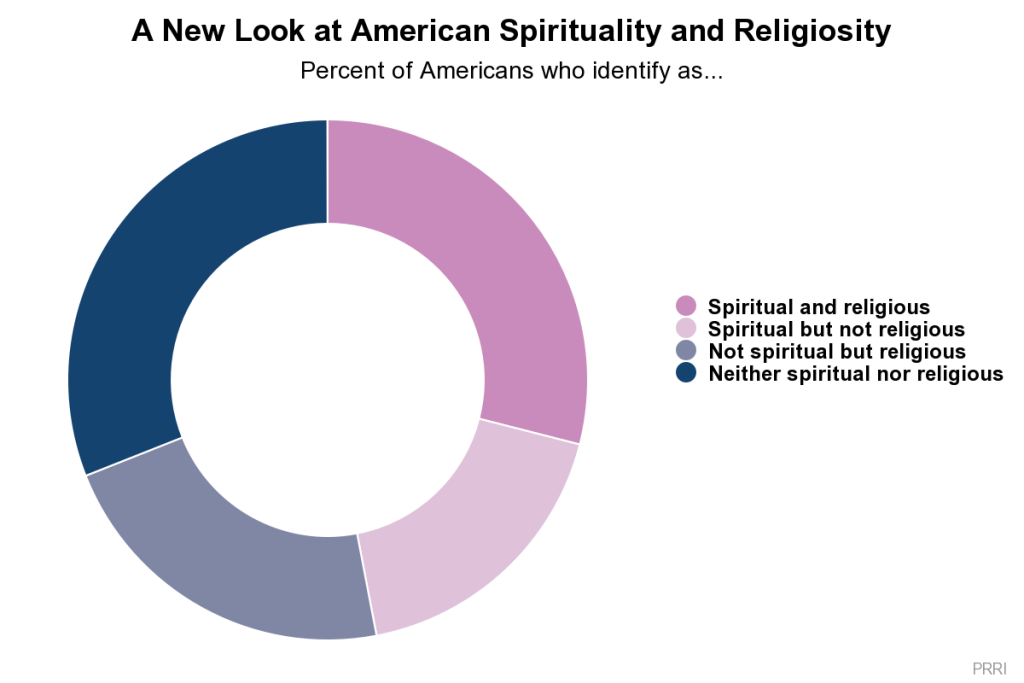
Fewer than one in five (18%) Americans are spiritual but not religious, meaning they report a high level of spirituality, while largely abstaining from religious practice. Similar numbers of Americans (22%) are classified as not spiritual but religious; they report participating in religious services regularly and say religion is important in their lives, but they demonstrate low levels of interest in spirituality.
An Examination of Spirituality and Religiosity
There are substantial differences in patterns of spirituality and religiosity by race and ethnicity. Black Americans are unique for their strong religiosity. Roughly three-quarters of black Americans are spiritual and religious (38%) or not spiritual but religious (36%). Only eight percent are spiritual but not religious. In contrast, about one in five Hispanic (21%) and white Americans (18%) are spiritual but not religious. White Americans (36%) are considerably more likely than Hispanic (21%) and black Americans (17%) to identify as neither spiritual nor religious.
Patterns of spirituality and religiosity vary widely among religious groups. A majority (54%) of white evangelical Protestants and nearly half (48%) of black Protestants are both spiritual and religious. About one-third (32%) of Catholics are spiritual and religious, while fewer than one-quarter (23%) of white mainline Protestants are spiritual and religious.
In contrast, unaffiliated Americans are the most likely to identify as spiritual but not religious (29%), although more than twice as many are neither spiritual nor religious (65%). White mainline Protestants are also far more likely to be neither spiritual nor religious (42%) than they are to be spiritual but not religious (18%). Catholics are much less likely to be neither spiritual nor religious (22%), while similar numbers are spiritual but not religious (15%). Very few white evangelical Protestants (5%) and black Protestants (5%) are spiritual but not religious.
There are significant gender differences in spirituality and religiosity, with men generally reporting lower levels of spiritual and religious activity. Nearly four in ten (37%) men are neither spiritual nor religious, compared to about one-quarter (26%) of women. Conversely, women are more likely than men to identify as both spiritual and religious (33% vs. 24%, respectively).
Partisan differences are somewhat muted. Political independents (24%) are more likely than Democrats (18%) and Republicans (12%) to be spiritual but not religious, while Republicans are more likely than Democrats to be both spiritual and religious (37% vs. 29%, respectively). About one-quarter (24%) of independents are spiritual and religious. Republicans (28%) are also more likely than Democrats (20%) and independents (19%) to be not spiritual but religious. One-third of Democrats (33%) and independents (33%) are neither spiritual nor religious, compared to only 24% of Republicans.
However, conservatives and liberals differ markedly in their spiritual and religious orientations. Nearly two-thirds of liberals are spiritual but not religious (30%) or neither spiritual nor religious (35%). Conservatives are about half as likely to be spiritual but not religious (10%) or neither spiritual nor religious (22%). More than four in ten (42%) conservatives are both spiritual and religious, compared to only 22% of liberals. Conservatives are also twice as likely as liberals to be not spiritual but religious (26% vs. 13%, respectively).
How the Spiritual but Not Religious Stack Up
Americans who are spiritual but not religious have a distinct demographic profile. They are more likely than the public overall to identify with a non-Christian religious tradition or to be unaffiliated. They are also somewhat younger and more politically liberal, and they are better educated than the population at large. Further, they are less likely than the public to identify as white evangelical Protestant or to be African American.
Differences in Religious Affiliation
The patterns of formal religious affiliation are starkly different between the different spiritual and religious groups. The majority of Americans who are spiritual but not religious identify with a specific religious tradition. Only three in ten (30%) spiritual but not religious Americans have no formal religious affiliation. Roughly one in five (18%) identify as white mainline Protestant, and an equal number (18%) are Catholic. Thirteen percent belong to a non-Christian religious tradition, such as Buddhism, Hinduism, or Judaism. Only 10% are nonwhite Protestants, and five percent are white evangelical Protestant.
Similarly, Americans who are neither spiritual nor religious are more likely than not to identify with a specific religious tradition. Roughly four in ten (39%) Americans who are neither spiritual nor religious report being religiously unaffiliated; nearly one in four (24%) are white mainline Protestant, and 15% are Catholic. About one in ten (9%) identify as a member of a non-Christian religious tradition.
Americans who are not spiritual but religious include a disproportionate number of Catholics and black Protestants. Nearly one-third (31%) are Catholic, while 22% are white evangelical Protestant, 15% are black Protestant, and 13% are white mainline Protestant. Only four percent are religiously unaffiliated.
Demographic Divisions
The gender gap varies considerably between the different groups. Americans who are spiritual but not religious are somewhat more likely to be women than men (54% vs. 46%, respectively). In contrast, the majority (56%) of Americans who are neither spiritual nor religious are men, while about four in ten (44%) are women. The gender divide is largest among those who are both spiritual and religious, among whom 59% are women.
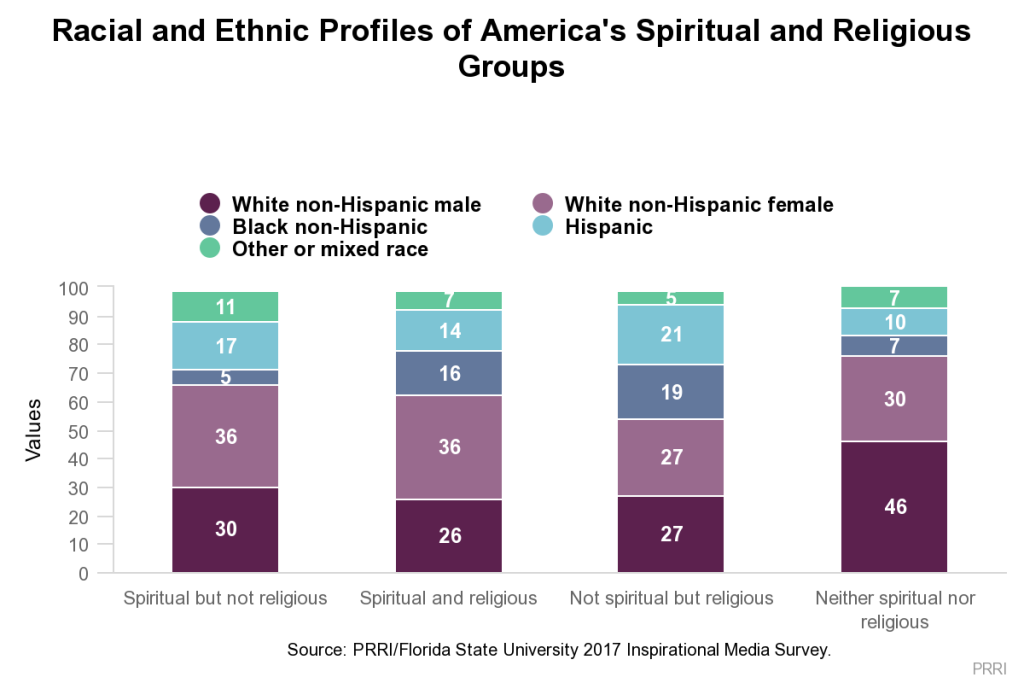
There are wide differences in the racial and ethnic profiles of these groups. Americans who are spiritual but not religious roughly approximate the racial and ethnic composition of the public overall, although they are somewhat less likely to be black. About two-thirds (66%) of spiritual but not religious Americans are white, 17% are Hispanic, and five percent are black. Notably, more than one in three (36%) Americans who are spiritual but not religious are white women.
Americans who are neither spiritual nor religious are considerably less diverse. More than three-quarters (76%) are white, 10% are Hispanic, and only seven percent are black. Notably, nearly half (46%) are white men. In sharp contrast, those who are not spiritual but religious include a much greater share of nonwhite Americans. Fifty-four percent are white, while roughly one in five are black (19%) or Hispanic (21%). Americans who are both spiritual and religious resemble the public overall.
In general, nonreligious Americans, whether spiritual or not, tend to be significantly younger than religious Americans. A majority of Americans who are spiritual but not religious (56%) and those who are neither spiritual nor religious (62%) are under the age of 50, including about one-quarter (26% and 24%, respectively) who are under 30. Fewer Americans who are not spiritual but religious (50%) and those who are spiritual and religious (46%) are under the age of 50. Notably, Americans who are both spiritual and religious are about twice as likely as Americans who are neither spiritual nor religious to be 65 or older (28% vs. 15%, respectively).
There are significant educational disparities between these groups as well. Americans who are spiritual but not religious have substantially higher levels of formal education. Four in ten (40%) have a four-year college degree, including 17% who have a post-graduate level of education. A similar number (39%) of Americans who are spiritual and religious have a four-year college degree. Three in ten (30%) Americans who are neither spiritual nor religious have a four-year college degree. In contrast, only 24% of Americans who are not spiritual but religious are college graduates; 53% have no college education at all.
Political Divisions
Overall, political divisions are most stark between Americans who are religious versus those who are not. Four in ten (40%) Americans who are spiritual but not religious are liberal, compared to 27% of neither spiritual nor religious Americans and fewer than one in five of those who are both spiritual and religious (18%) and not spiritual but religious (14%). Roughly one in five spiritual but not religious Americans (17%) and Americans who are neither spiritual nor religious (22%) identify as conservative. Twice as many Americans who are both spiritual and religious identify as conservative (44%).
When it comes to party affiliation, the spiritual but not religious are much more likely to eschew partisan labels than other Americans. More than four in ten (44%) are politically independent, although they are more than twice as likely to identify as Democrat than Republican (36% vs. 16%, respectively). Americans who are neither spiritual nor religious are about equally likely to identify as independent (34%) as Democrat (36%); only 20% are Republican. Americans who are both spiritual and religious, as well as those who are not spiritual but religious, are about equally likely to identify as Republican, independent, and Democrat.
Spirituality, Religiosity, and Life Satisfaction
The survey included measures of life satisfaction across six areas: life in general, personal health, family life, relationships with friends, quality of life in the local community, and the way things are going in the country as a whole.
Overall, Americans report relatively high levels of satisfaction with the different facets of their lives. Nearly six in ten (58%) Americans report they are very or completely satisfied with their life in general. More than six in ten Americans also report that they are very or completely satisfied with their family life (66%) and relationships with friends (62%). Less than half of Americans report that they are very or completely satisfied with the quality of life in their local community (46%) and personal health (44%).
Notably, only about one in ten (11%) Americans say they are very or completely satisfied with how things are going in the country today; a majority (53%) of Americans say they are not too satisfied or completely dissatisfied.7
The Impact of Spirituality and Religiosity on Life Satisfaction
A person’s level of spirituality is a consistently strong predictor of how satisfied they are with various aspects of their life. Spiritual people—regardless of whether they are religious or not—report higher levels of satisfaction with their relationships, communities, and life in general than do nonspiritual people.
For instance, a majority (53%) of Americans who are both spiritual and religious and half (50%) of Americans who are spiritual but not religious report being very or completely satisfied with their personal health. Fewer than half of those who are not spiritual but religious (42%) and those who are neither spiritual nor religious (37%) report being satisfied with their health.
Similarly, while more than six in ten of those who are both spiritual and religious (70%) and those who are spiritual but not religious (61%) are very or completely satisfied with their life in general, only 53% of the not spiritual but religious and fewer than half (47%) of those who are neither spiritual nor religious say the same.
We combined these six measures of life satisfaction to create the Life Satisfaction Scale.8 Overall, nearly six in ten Americans exhibit very high (22%) or high (37%) levels of life satisfaction, compared to roughly four in ten who express moderate (27%) or low satisfaction (14%) with the various facets of their lives.
No group expresses a greater degree of satisfaction than Americans who are both spiritual and religious. Nearly three-quarters (73%) have high levels of overall satisfaction. More than six in ten (63%) Americans who are spiritual but not religious are also highly satisfied with different aspects of their lives. Fewer Americans who are not spiritual but religious (54%) and those who are neither spiritual nor religious (47%) express a high degree of overall satisfaction. A majority (54%) of Americans who are neither spiritual nor religious have moderate or low levels of satisfaction with various aspects of their life.
The Spiritual Divide in Prosocial Behavior
Americans who are more spiritually oriented are also more apt than those who are less spiritually inclined to engage in various kinds of pro-social behaviors, such doing favors for others or expressing gratitude and appreciation. Praying for someone who is not a close friend or family is the only pro-social behavior measured where religiosity, rather than spirituality, is the dominant influence.
Doing Favors for Others
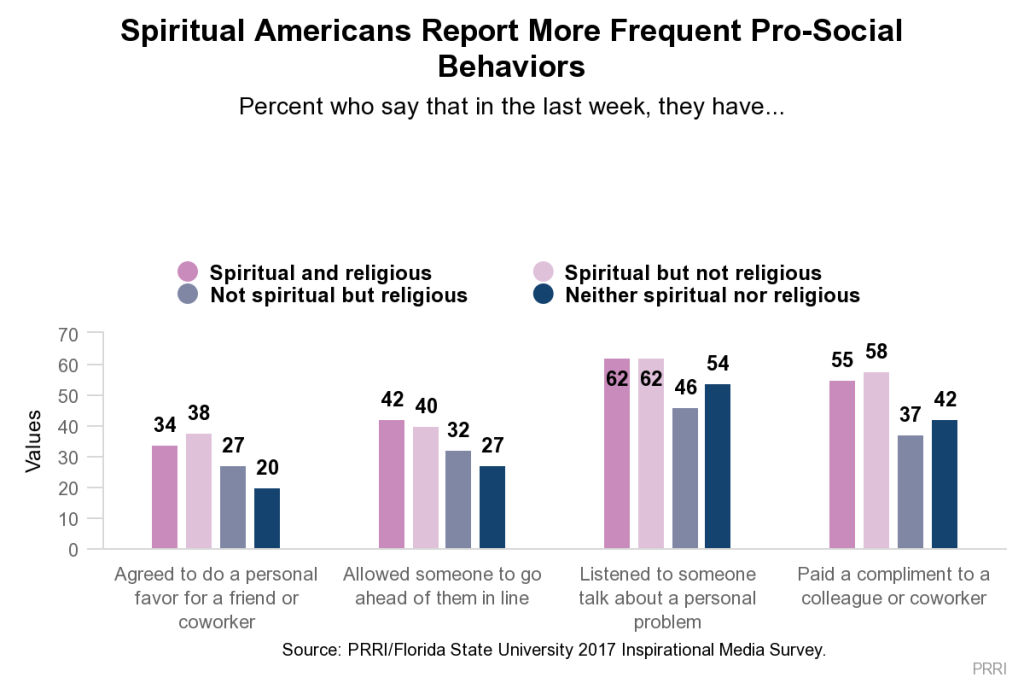
Spiritual Americans are significantly more likely than those who are not spiritual to report having done a personal favor for a friend or coworker within the last week (36% vs. 22%, respectively). The spiritual divide persists regardless of levels of religiosity. Nearly four in ten (38%) Americans who are spiritual but not religious and about one-third (34%) of those who are both spiritual and religious report engaging in this type of activity in the last seven days. By contrast, about one-quarter (27%) of Americans who are not spiritual but religious and only 20% of those who are neither spiritual nor religious report having done a favor for a friend or coworker recently.
There is a similarly sized gap between spiritual and nonspiritual Americans when it comes to allowing someone to cut ahead in line. Roughly four in ten (41%) spiritual Americans, including 42% of the both spiritual and religious and 40% of the spiritual but not religious, say they have done this within the last week. Three in ten (30%) nonspiritual Americans say they have allowed someone to cut ahead of them in line in the last week, including similar numbers of those who are not spiritual but religious (32%) and those who are neither spiritual nor religious (27%).
Americans who are spiritually oriented are also more inclined to listen to someone talk about a problem. More than six in ten (62%) spiritually oriented Americans, including an identical number of the spiritual but not religious (62%) and the spiritual and religious (62%), report having done this within the last seven days. Only half (50%) of those who are not spiritual say they have listened to someone talk about a problem in the last week. Americans who are not spiritual but religious are somewhat less likely than those who are neither spiritual nor religious (46% vs. 54%, respectively) to report listening to someone talk about a problem in the past week.
Expressing Gratitude
Americans who are more spiritually oriented tend to express gratitude and appreciation more frequently than those who are not. A majority (56%) of spiritual Americans, including 58% of those who are spiritual but not religious and 55% of those who are both spiritual and religious, say they have paid a compliment to a colleague or coworker over the past week. In contrast, only about four in ten (41%) nonspiritual Americans say they have done this. Similar numbers of Americans who are neither spiritual nor religious (42%) and not spiritual but religious (37%) report having complimented a colleague or coworker in recent days.
Spiritual people are also more likely to report that they had thanked a stranger in the past week. Nearly three-quarters (74%) of spiritually oriented Americans, including 75% of those who are spiritual but not religious and 74% of those who are spiritual and religious, say they have done this. By contrast, 64% of nonspiritual Americans, including 62% of those who are not spiritual but religious and 65% of those who are neither spiritual nor religious, say they have thanked a stranger within the last week.
Not surprisingly, spiritual Americans express a high level of gratitude for the things in their lives. More than eight in ten (83%) spiritually oriented Americans—including 73% of those who are spiritual but not religious and 89% of those who are both spiritual and religious—say the statement “if I had to list everything I felt grateful for, it would be a very long list” describes them either exactly or very well. Significantly fewer (57%) Americans who are not spiritual, including 66% of those who are not spiritual but religious and only 50% of those who are neither spiritual nor religious, say this statement describes them very well.
Praying for Others
One measure of pro-social behavior, however, shows a different pattern: Praying for someone who is not a close friend or family member. When it comes to this personal behavior, religiosity plays a more important role than spirituality.
Americans who are spiritual and religious are most likely to pray for other people—65% say they have done this in the last week. About half (51%) of Americans who are not spiritual but religious also say they have done this recently. In contrast, only about one-third (35%) of Americans who are spiritual but not religious and about half as many (16%) Americans who are neither spiritual nor religious say they have prayed for other people within the last week.
Spirituality and Leisure Activities
Leisure activities undoubtedly impact our life satisfaction. It is reasonable, then, to expect that spiritual Americans spend their down time differently than their nonspiritual counterparts. The fact that spiritual Americans are more likely to meditate at least once a week (42%) than those who are not spiritual (21%) is not surprising.9,10 However, perhaps unexpectedly, spiritual Americans are more likely than nonspiritual Americans to report spending time with friends at least once a week (73% vs. 62%, respectively). Spiritual Americans are also significantly more likely to spend time gardening, hiking, or enjoying the outdoors at least once a week (59% vs. 51%, respectively).
Spiritual Americans differ in their leisure activities in another important respect as well. Compared to Americans who are not spiritual, those who are differ in the way they engage with certain forms of media—reading a book, listening to a podcast, or watching a movie. The tendency for spiritual Americans to be moved or inspired by media consumption holds true regardless of the type of media being considered.
Spiritual Americans are substantially more likely than those who are not that spiritual to seek out media experiences to find inspiration. Roughly half (49%) of spiritual Americans, including an identical number (49%) of the spiritual but not religious, report that they were moved, touched, or inspired while watching television in the last week. Slightly more than one-third (36%) of nonspiritual Americans report a similar experience. Close to four in ten (38%) spiritual Americans report feeling inspired while watching an online video in the last week; roughly one-quarter (24%) of nonspiritual Americans say the same.
Spiritual Americans are about twice as likely as nonspiritual Americans to have found inspiration while reading a book in the last week (31% vs. 14%, respectively). About one in four (26%) spiritual but not religious Americans say they were personally moved, touched, or inspired by reading a book within the last week. 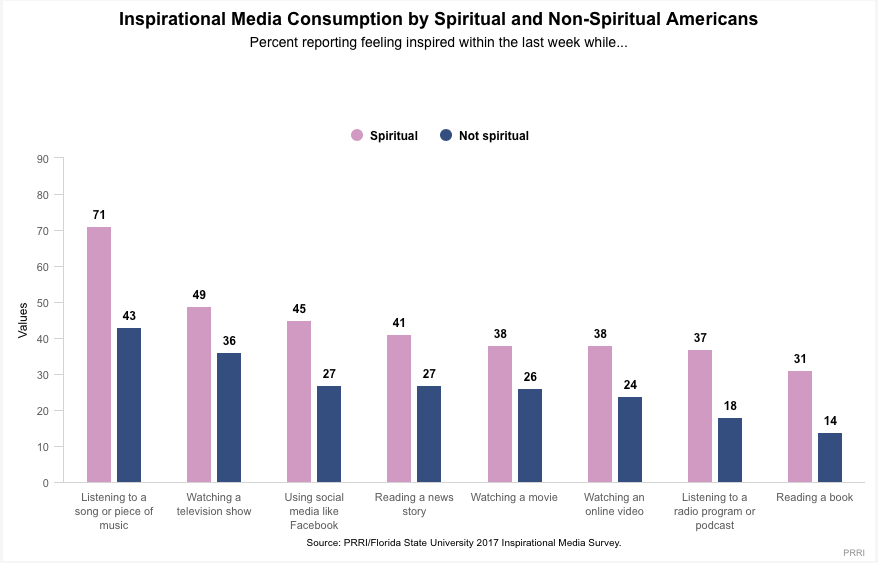 No activity is a greater source of inspiration than listening to music. Roughly seven in ten (71%) spiritual Americans—including 69% of the spiritual but not religious—say they have been touched, moved, or inspired within the last week while listening to a song or piece of music. Fewer than half (43%) of nonspiritual Americans report having this experience, including only 39% of Americans who are neither spiritual nor religious.
Endnotes
[1] PRRI 2016 American Values Atlas.
[2] Saad, Lydia. “Confidence in Religion at New Low, but Not Among Catholics.” Gallup. June 17, 2015. http://news.gallup.com/poll/183674/confidence-religion-new-low-not-among-catholics.aspx.
[3] Lipka, Michael and Claire Gecewicz. “More Americans now say they’re spiritual but not religious.” Pew Research Center. September 6, 2017. http://www.pewresearch.org/fact-tank/2017/09/06/more-americans-now-say-theyre-spiritual-but-not-religious/.
[4] Masci, David and Michael Lipka. “Americans may be getting less religious, but feelings of spirituality are on the rise.” Pew Research Center. January 21, 2016. http://www.pewresearch.org/fact-tank/2016/01/21/americans-spirituality/.
[5] Kachan, Diana et al. “Prevalence of Mindfulness Practices in the US Workforce: National Health Interview Survey.” January 5, 2017. https://www.cdc.gov/pcd/issues/2017/16_0034.htm.
[6] Response options include: “Never,” “seldom,” “once or twice a month,” “a few times a week,” “almost every day,” or “at least once a day.”
[7] There are strong partisan disagreements on this question, with 19% of Republicans, compared to only 3% of Democrats saying they are very or completely satisfied with how things are going in the country today; 72% of Democrats, compared to only 30% of Republicans, say they are not too satisfied or completely dissatisfied.
[8] All six measures of personal satisfaction are highly correlated, although the bivariate relationships vary somewhat between measures. The Cronbach’s alpha for the scale is 0.8, indicating that they are suitable to be combined into a single scale.
[9] This analysis is based on the previous wave of this survey: PRRI/Florida State University 2016 Inspirational Media Survey.
[10] Interestingly, spiritual Americans are not significantly more likely than those who are not spiritual to participate in yoga at least once a week (9% vs. 7%, respectively).
Appendix
Recommended Citation
Jones, Robert P., Daniel Cox, and Art Raney. “Searching for Spirituality in the U.S.: A New Look at the Spiritual but Not Religious.” PRRI. 2017.


