*To see the latest data on this topic, see PRRI’s March 2026 report: “Mapping Support for LGBTQ Rights Across the 50 States: Insights from PRRI’s 2025 American Values Atlas.”
To view a PDF of slides presented during PRRI’s March 4, 2025 live discussion of this report, please click here. For a replay of the event, please click here.
Executive Summary
In 2024, PRRI interviewed over 22,000 adults as part of the PRRI American Values Atlas to provide a detailed analysis of the demographic, political, and religious characteristics of LGBTQ Americans. The report also examines public attitudes on LGBTQ rights across all 50 states and the District of Columbia, focusing on support for nondiscrimination protections, opposition to religiously based service refusals, and support for same-sex marriage. Additionally, new survey questions explore views on transgender-related policies, including restrictions on gender-affirming care for minors and ID laws requiring birth-assigned sex.
LGBTQ Americans trend younger, more female, Democratic, and less religious than other Americans.
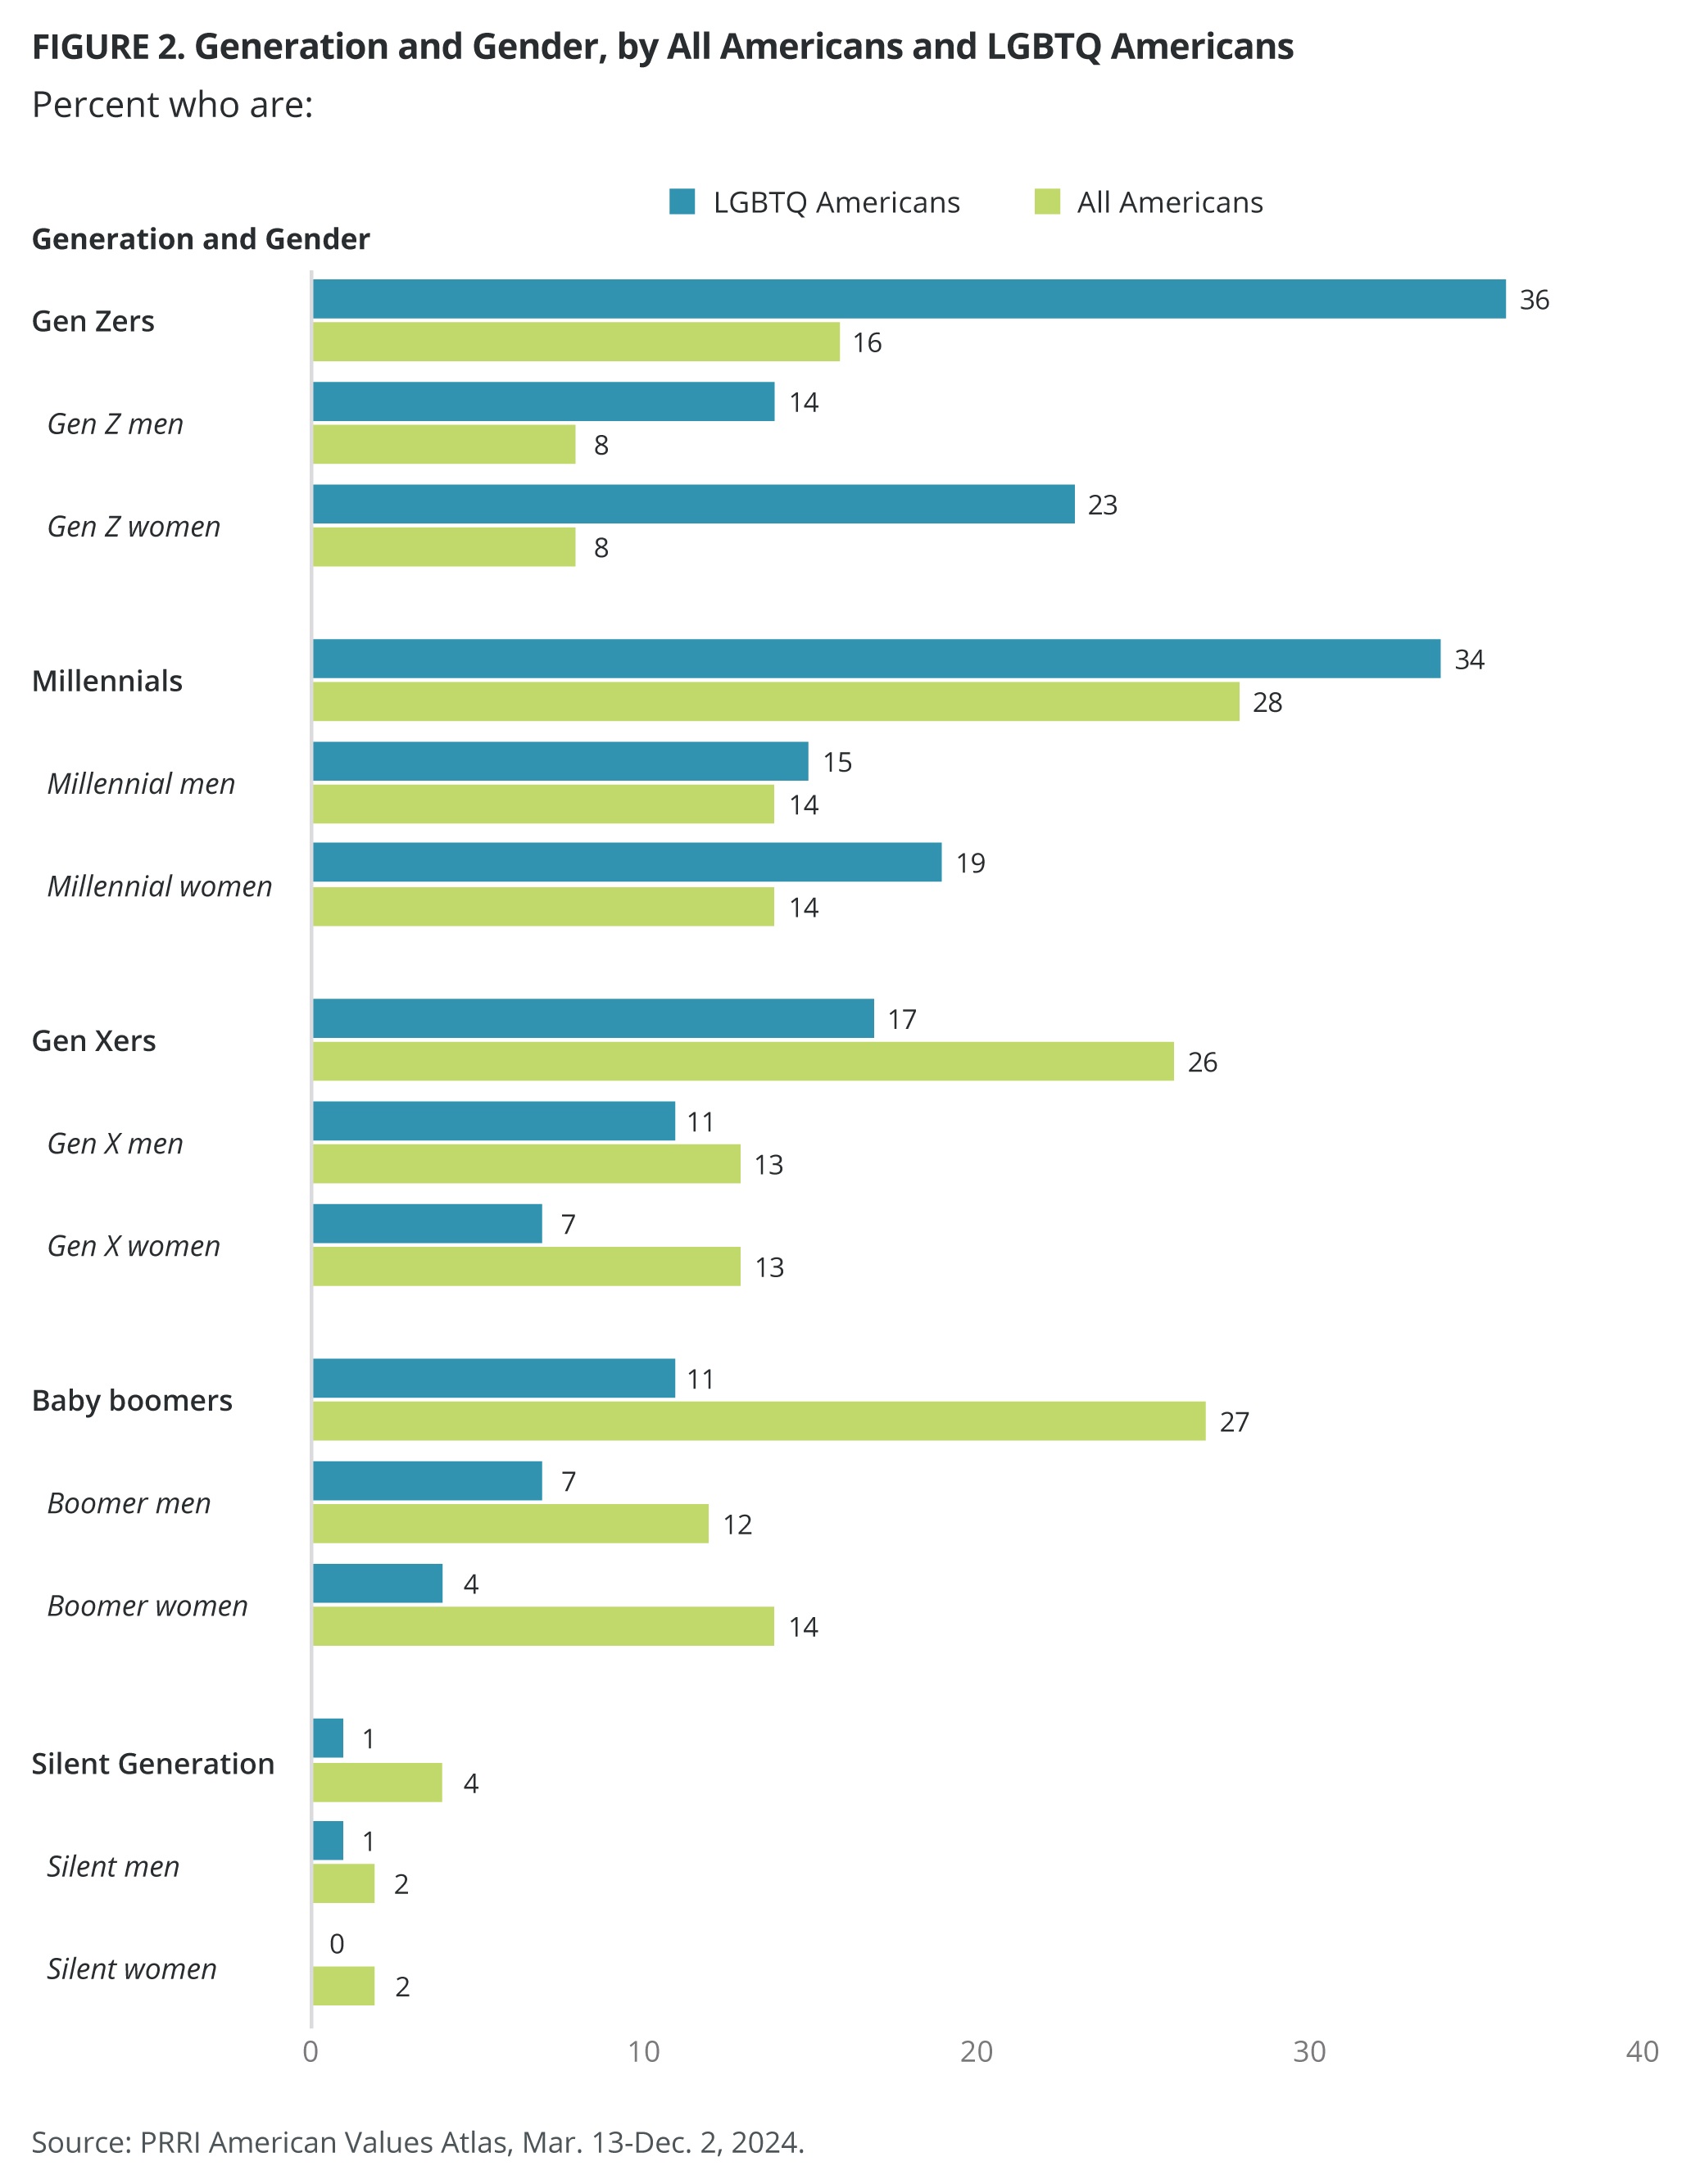
- More than one-third of LGBTQ Americans are Gen Zers (36%) and millennials (34%), compared with 17% of Generation Xers, 11% of baby boomers, and just 1% of the Silent Generation.
- Gen Z women (23%) and millennial women (19%) identify as LGBTQ at higher rates than their male counterparts (14% and 15%, respectively).
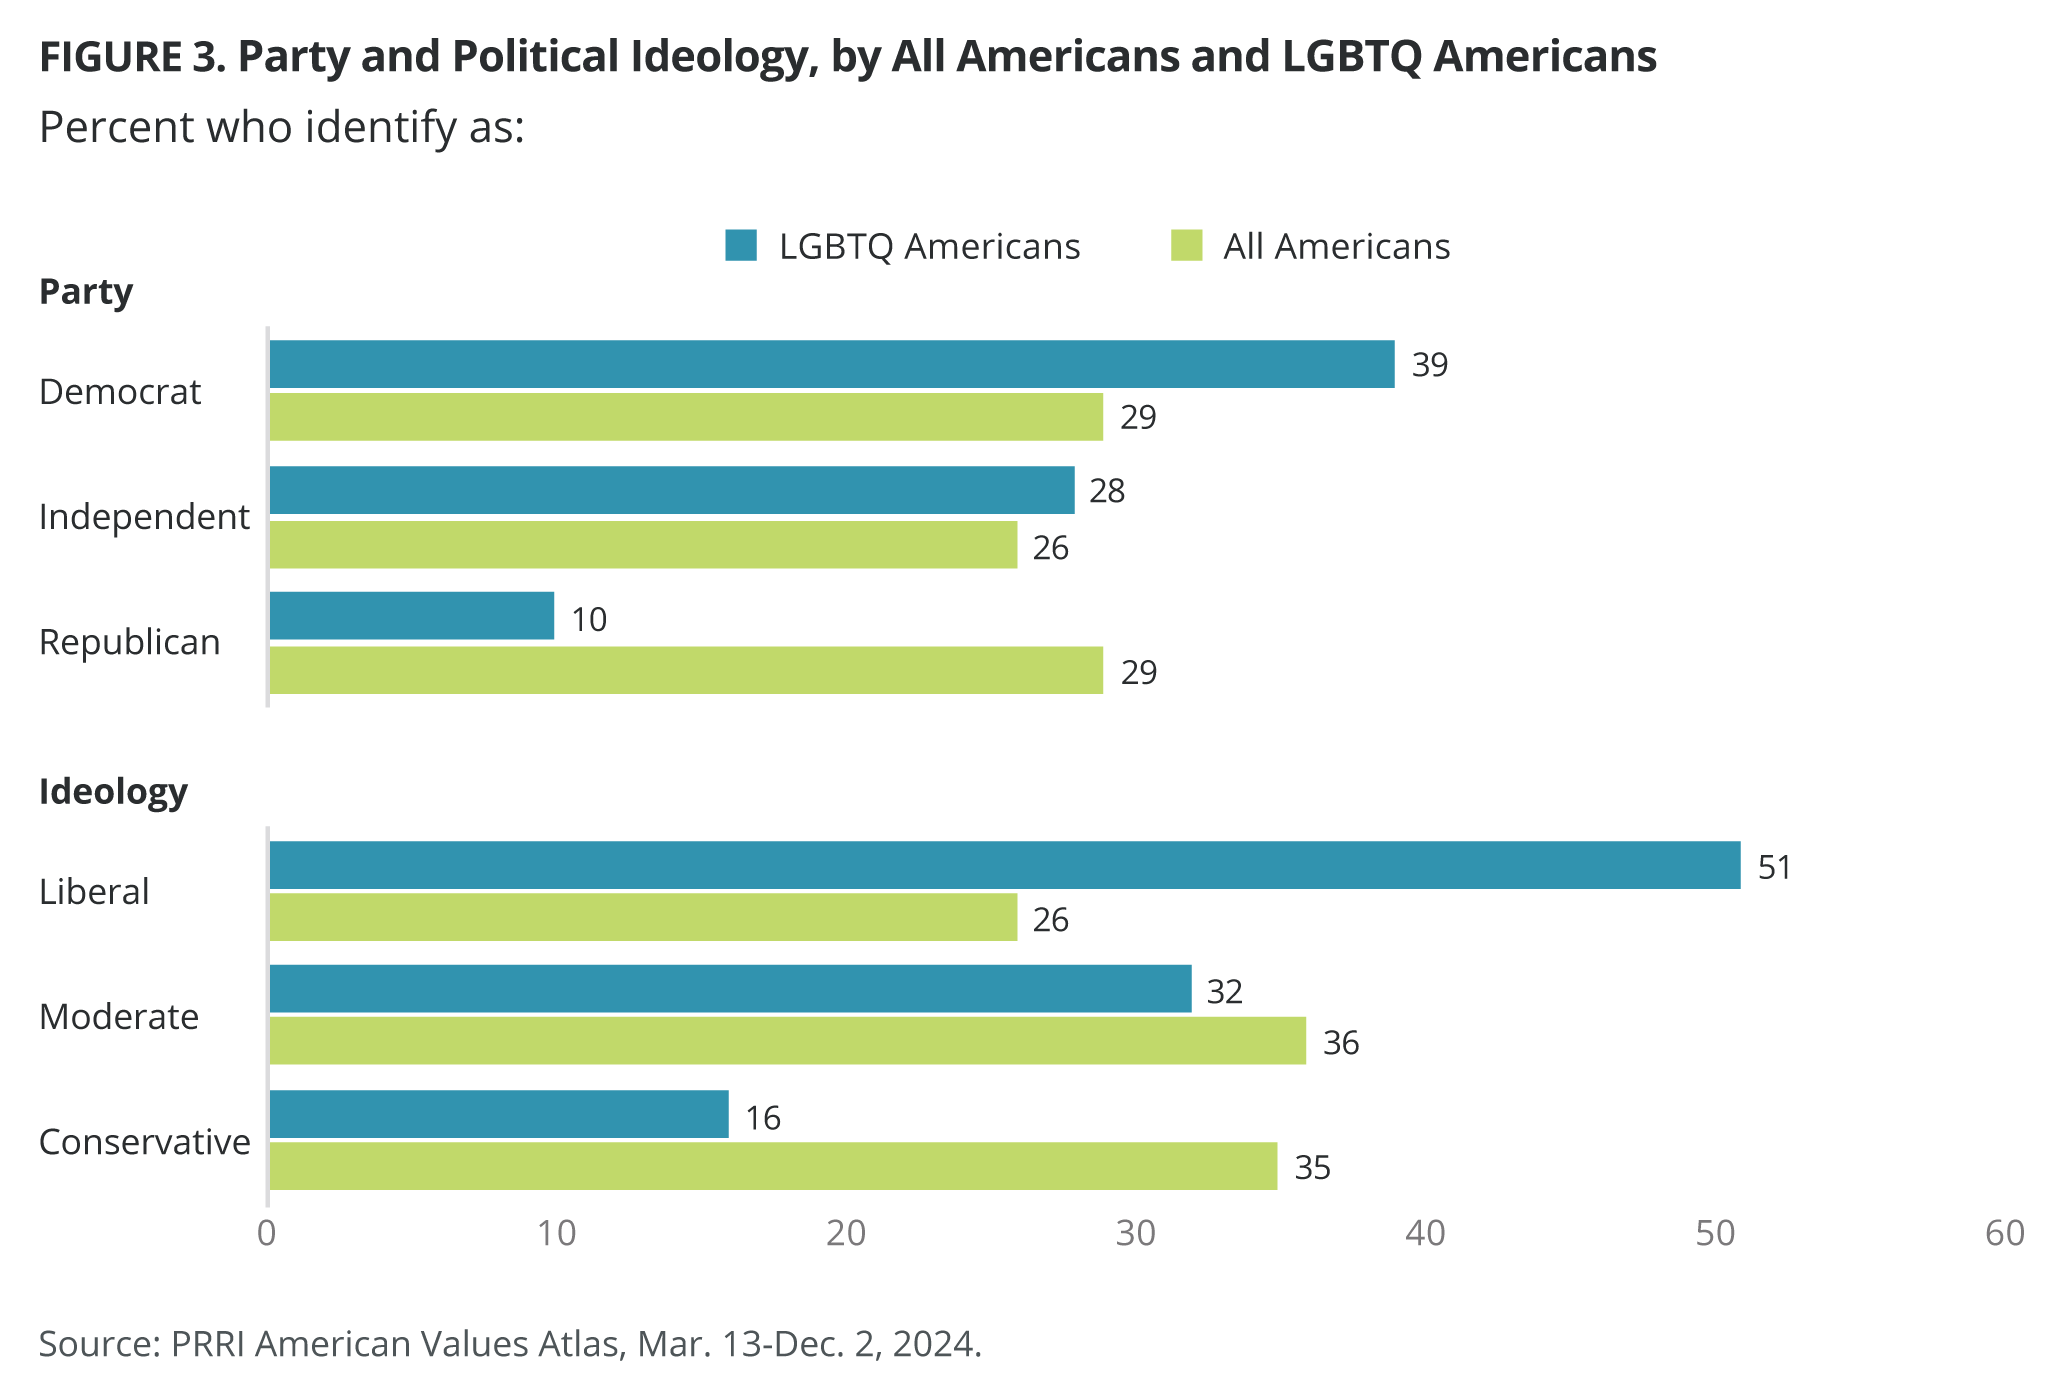
- A plurality of LGBTQ Americans are Democrats (39%) and over half of LGBTQ Americans identify as politically liberal (51%).
- The majority of LGBTQ Americans identify as religiously unaffiliated (52%), twice the rate of the general U.S. population (28%). More than a third of LGBTQ Americans identify with a Christian faith (36%) and 10% are members of non-Christian religions.
Support for LGBTQ rights differs strongly by state; while majorities in virtually all states support marriage equality, it is higher in states where same-sex marriage would remain legal if Obergefell v. Hodges were overturned.
- Americans who live in states that have legal protections in jobs, public accommodations, and housing are slightly more likely than those in states without these protections to favor nondiscrimination laws (78% vs. 71%).
- Opposition to religiously based service refusals is highest in the District of Columbia (75%), Rhode Island (75%), and Vermont (72%), while lowest in Oklahoma (43%) and Tennessee (44%).
- Same-sex marriage is now supported by a majority in every state, with the highest support in Massachusetts (87%), Vermont (86%), and the District of Columbia (82%). The lowest support is in southern states, including Oklahoma (50%), West Virginia (51%), and Louisiana (52%).
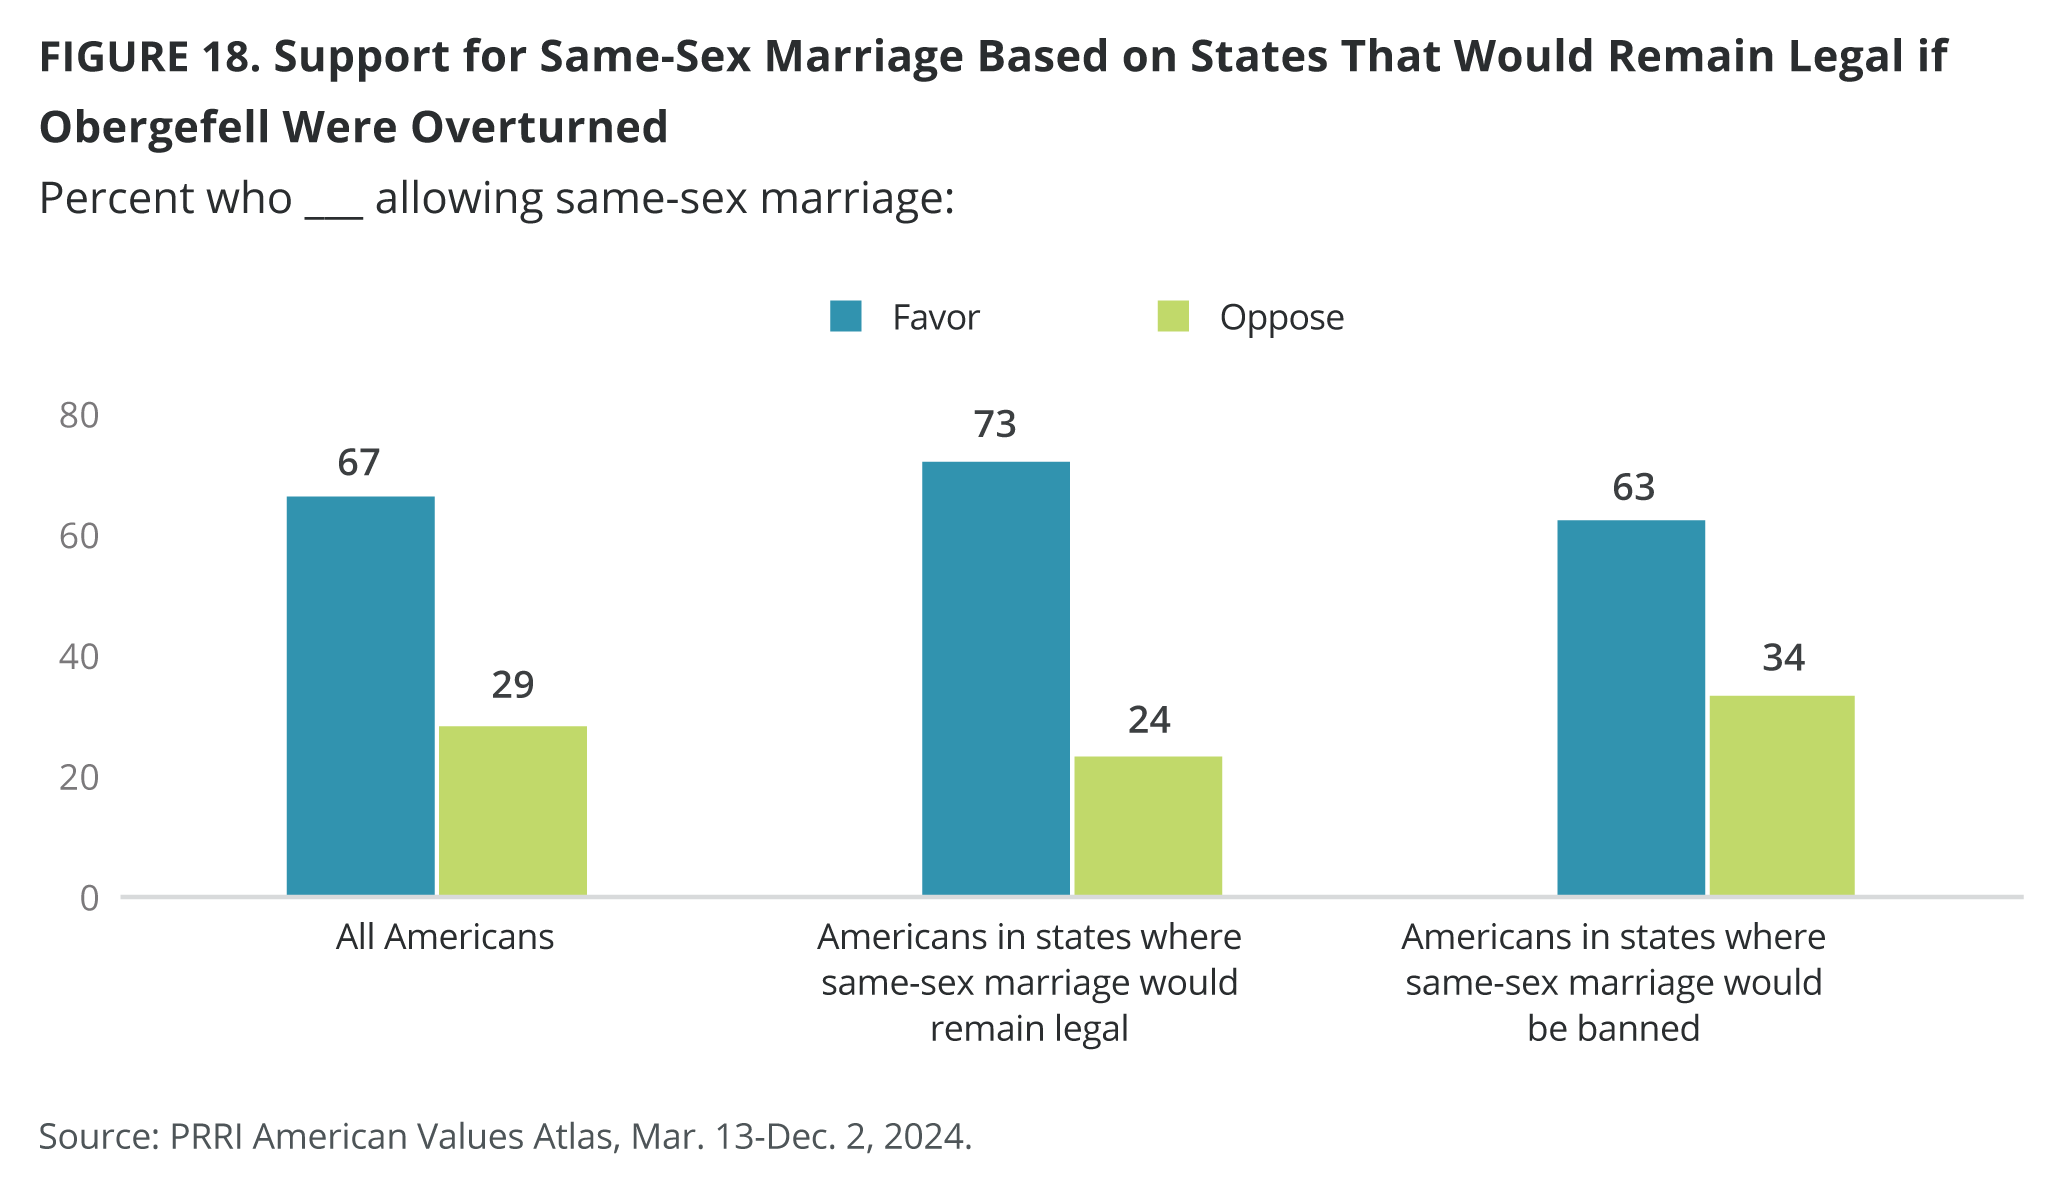
- Americans in states where same-sex marriage would remain legal if Obergefell v. Hodges were overturned (73%) are 10 percentage points more likely to support marriage equality than those in states where it would become illegal (63%).
Strong majorities of Americans — including most people of faith — support nondiscrimination protections for LGBTQ individuals.
- Three-quarters of Americans support policies that protect LGBTQ Americans from discrimination in housing, employment, and public accommodation (75%) in 2024. This represents a 4-percentage-point increase since the question was first asked in 2015, although support has declined from its peak of 80% in 2022.
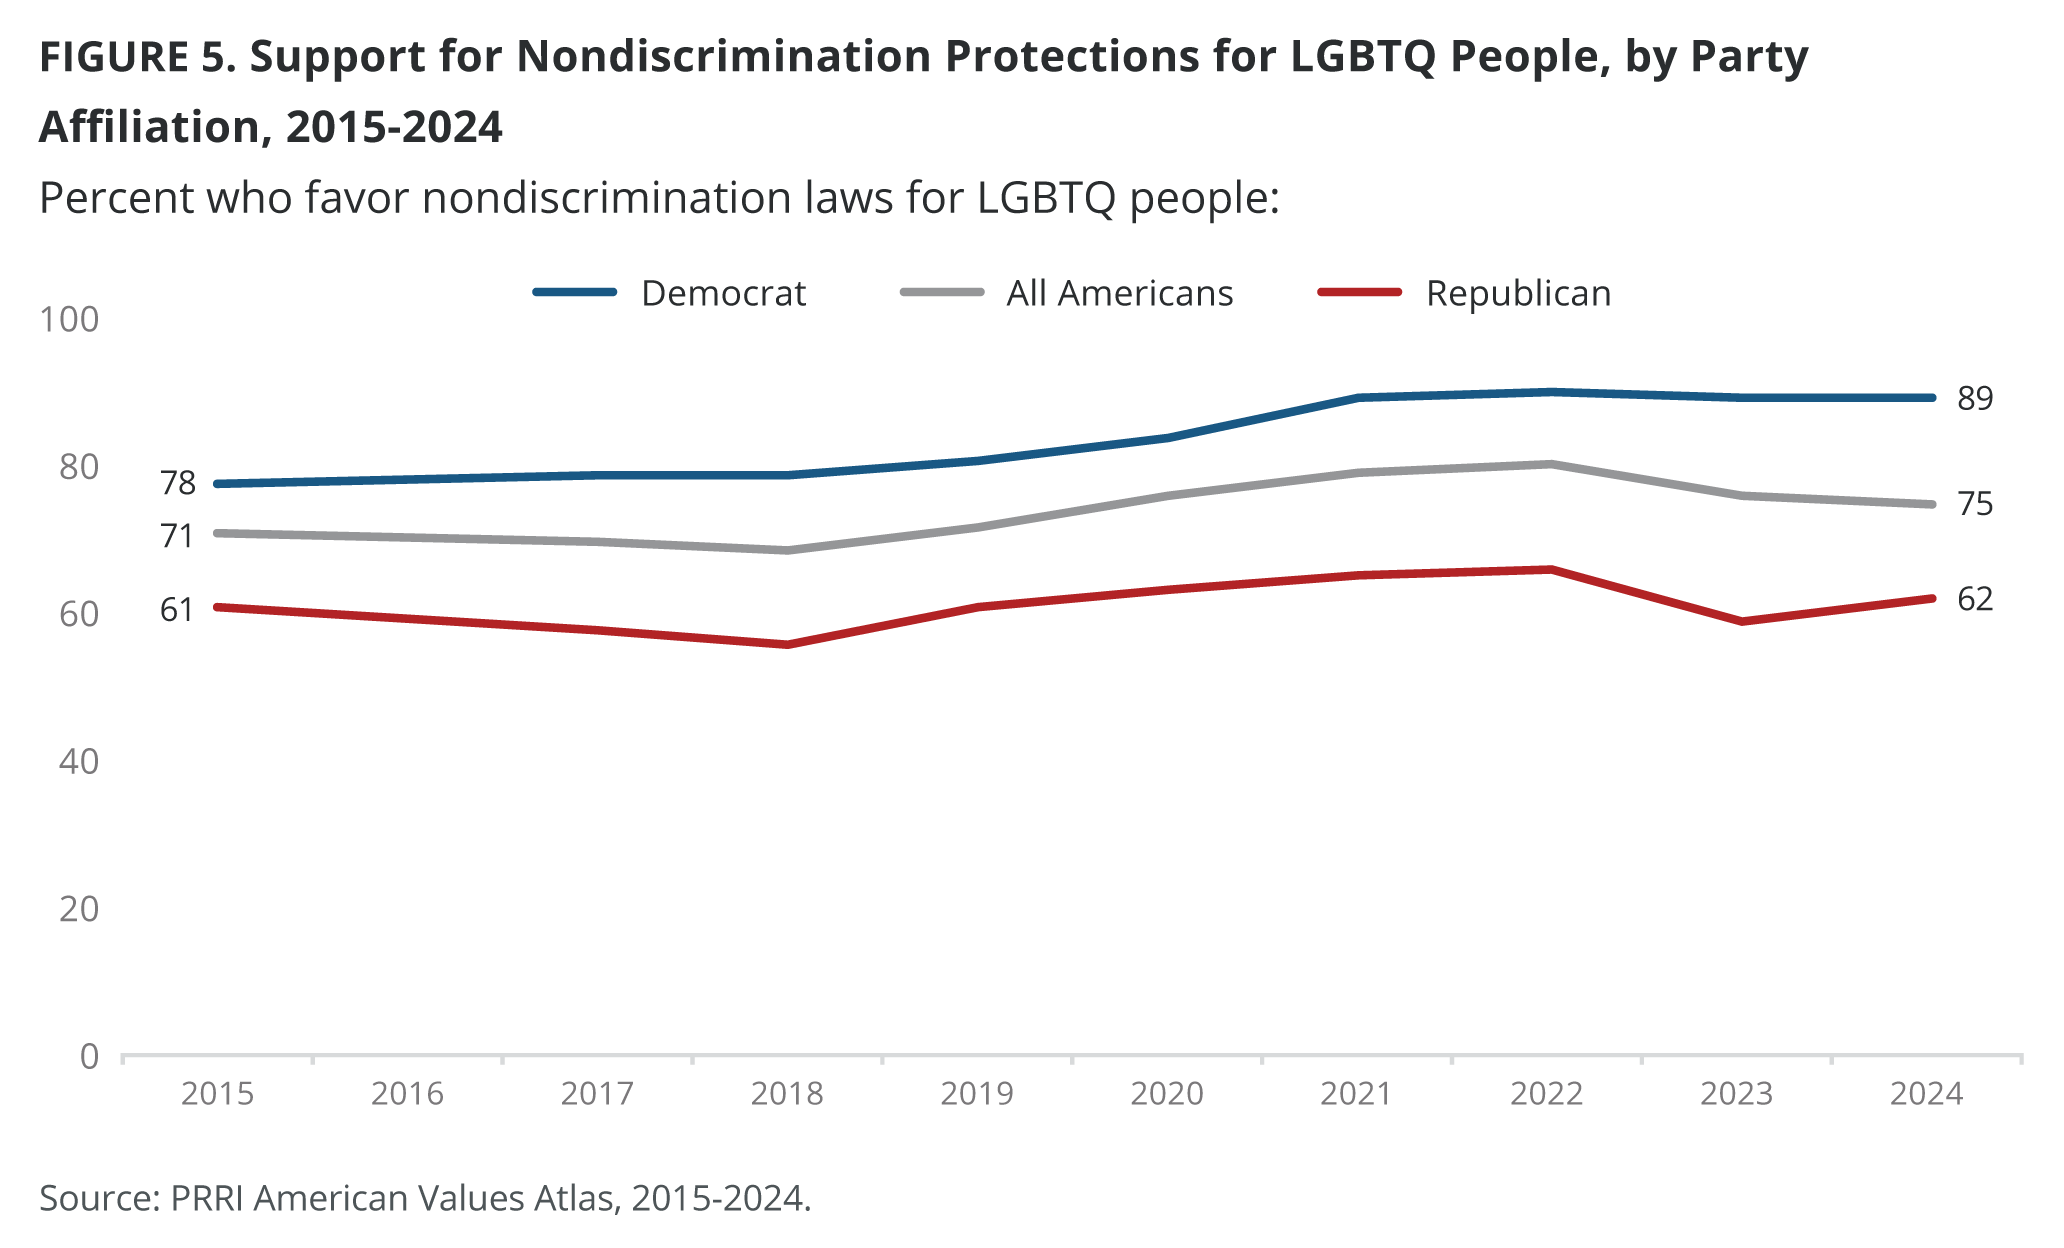
- Most Americans support nondiscrimination protections for LGBTQ people, with Democrats (89%) being the most supportive, followed by independents (78%) and Republicans (62%). Since 2015, support has grown among Democrats and independents, while Republican support has remained steady.
- Support for LGBTQ nondiscrimination protections has remained stable or increased among most religious groups between 2015 and 2024.
- Over the past decade, Americans ages 18-29 show a gradual decrease in support for LGBTQ nondiscrimination laws, from 80% in 2015 to 73% in 2024.
Most Americans continue to oppose religiously based service refusals for LGBTQ people.
- Democrats (83%) are the most likely to oppose allowing small businesses to refuse service to LGBTQ people on religious grounds, compared with independents (56%) and Republicans (35%). While opposition among Democrats has grown since 2015, it has remained steady among independents but declined among Republicans.
- A majority of members of most religious groups oppose religiously based service refusals; however, Latter-day Saints (40%), Jehovah’s Witnesses (37%), and white evangelical Protestants (31%) have the lowest opposition, with the latter two experiencing significant declines since 2015.
- Young Americans ages 18-29 show a gradual decrease in opposition to allowing religiously based service refusals, from 67% in 2015 to 61% in 2024.
Support for same-sex marriage remains high.
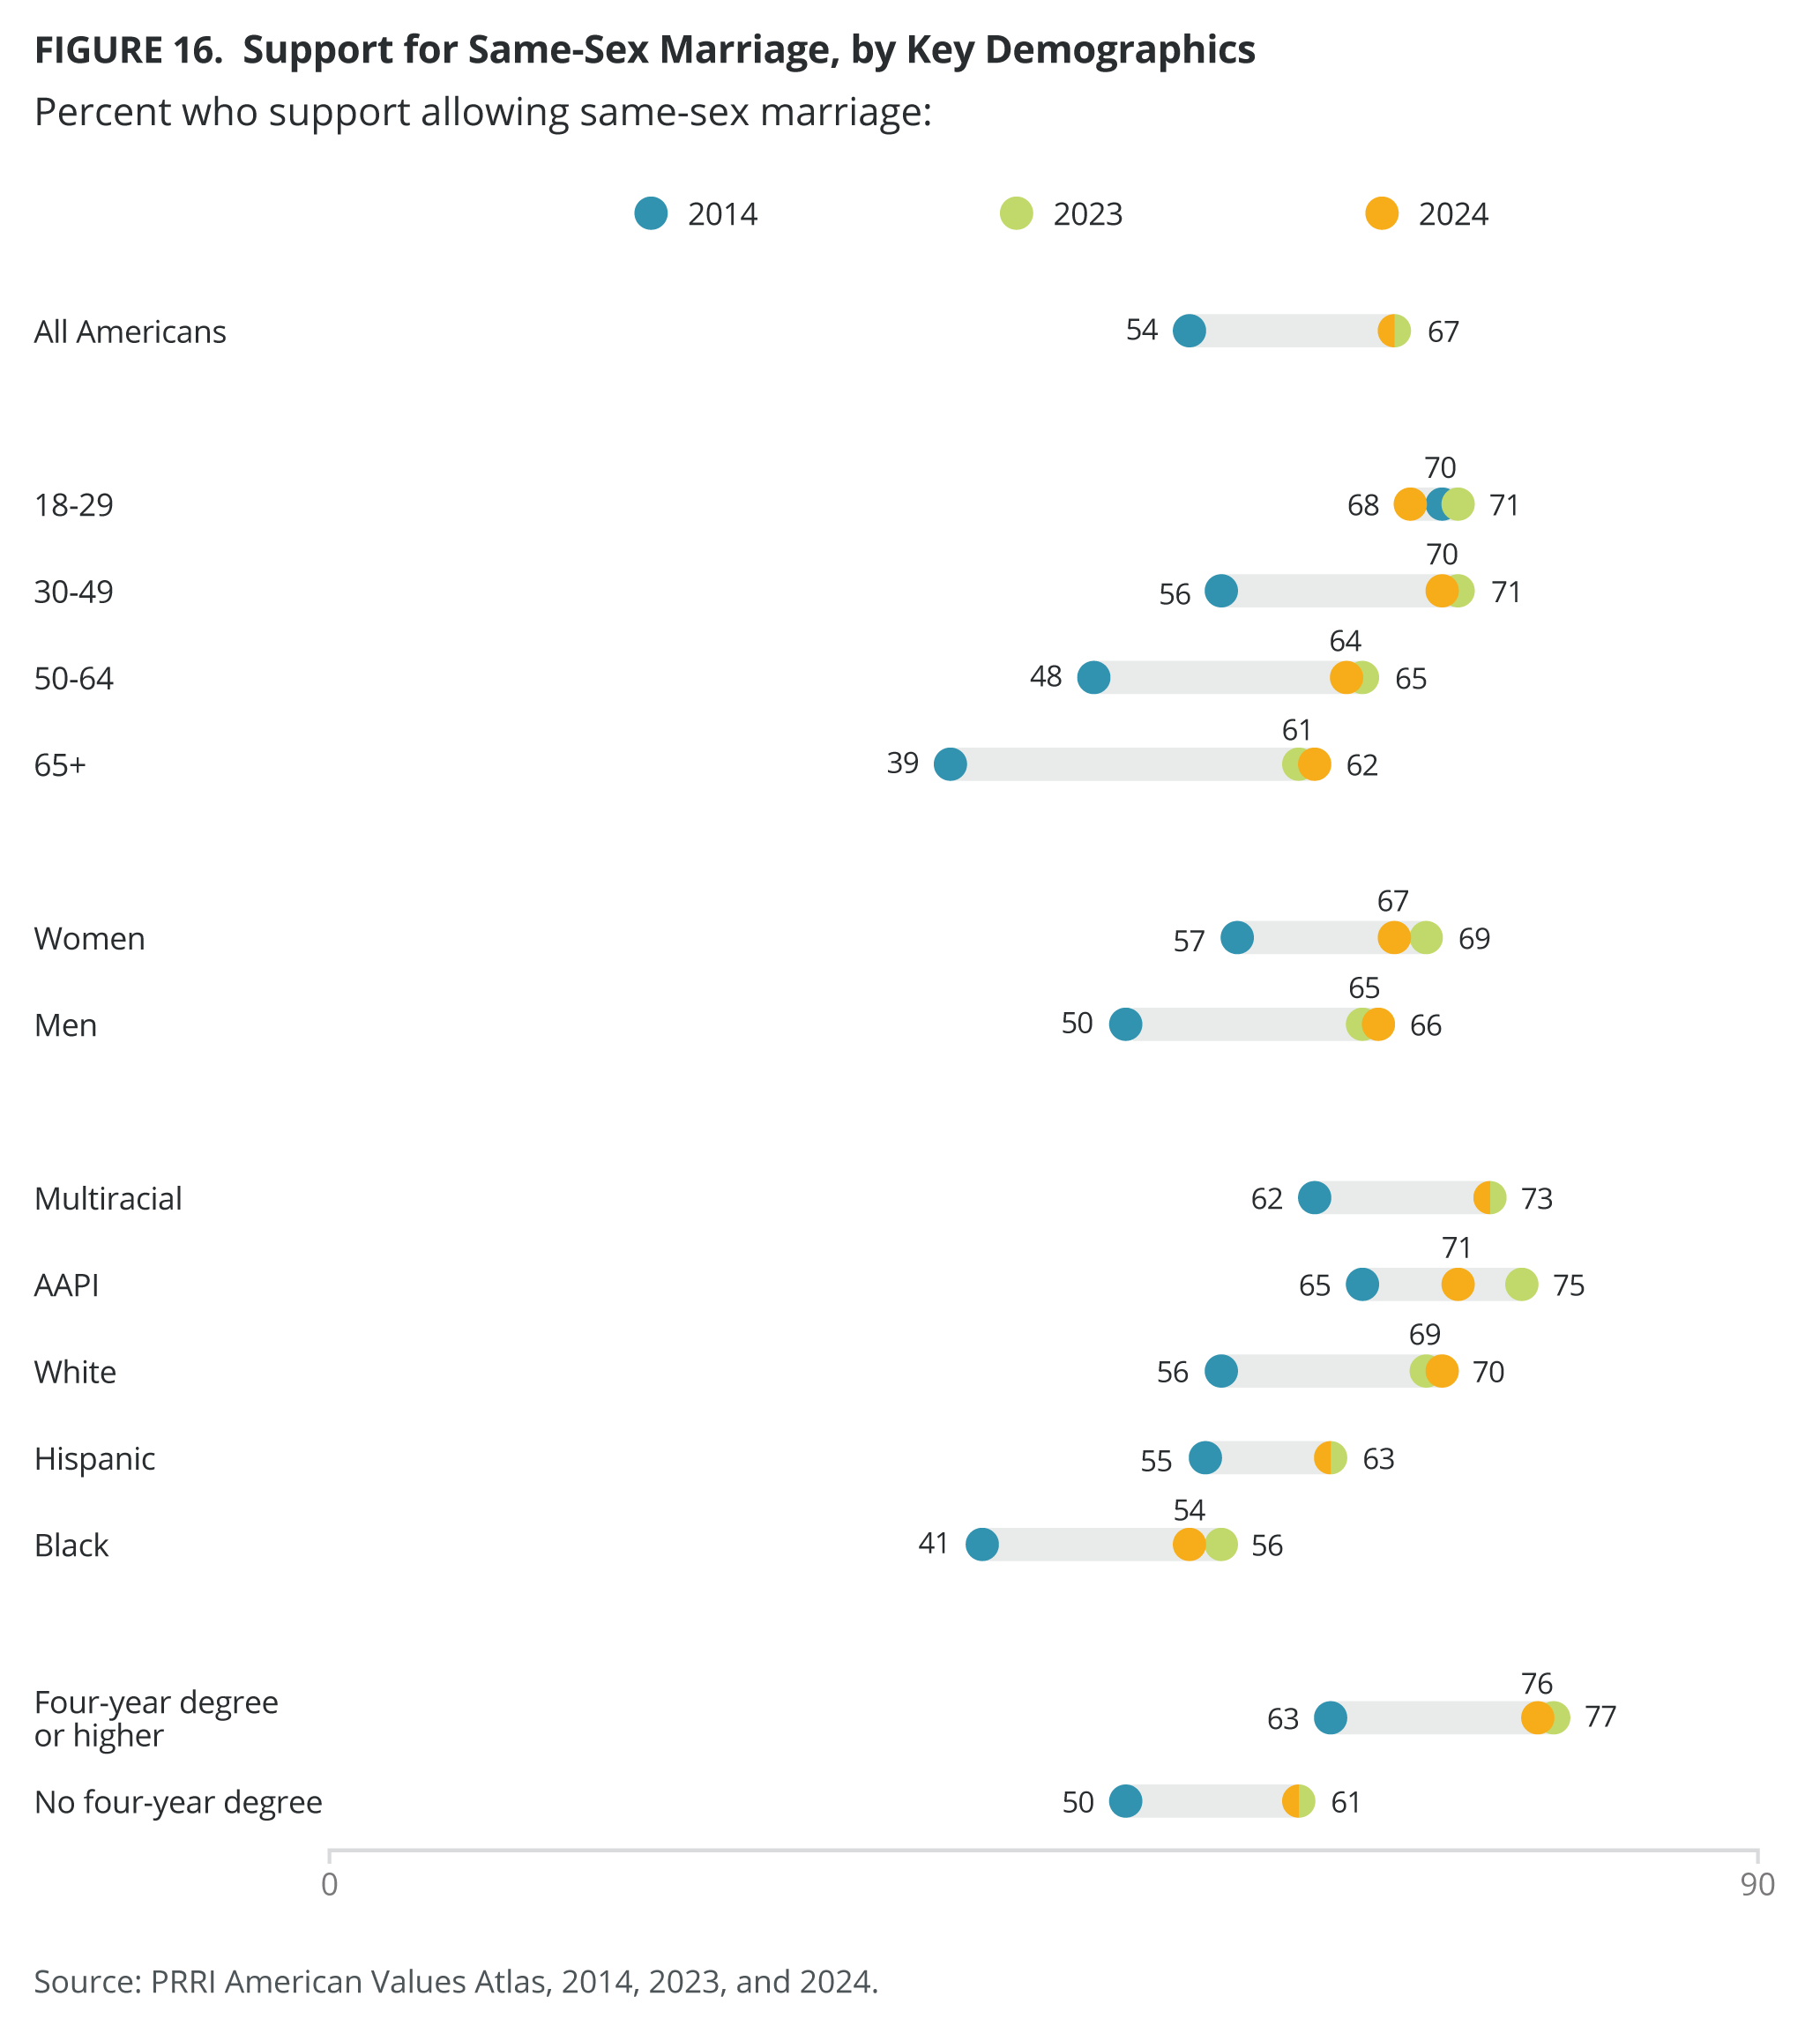
- Two-thirds of Americans (67%) support allowing same-sex couples to marry legally, a 13-percentage-point increase in support since 2014 (54%).
- Republicans (50%) are notably less likely than Democrats (83%) and independents (72%) to support same-sex marriage, but their support has grown substantially from 35% in 2014.
- Majorities of most religious groups favor same-sex marriage, except for Hispanic Protestants (41%, up from 35% in 2014), white evangelical Protestants (38%, up from 28% in 2014), Muslims (33%, down from 42% in 2014), and Jehovah’s Witnesses (16%).
- Support has steadily grown across older age groups, with majorities of Americans ages 50-64 (64%) and senior Americans (62%) now in favor, compared with a plurality in 2014 (48% and 39%, respectively).
Americans are divided on bans on gender-affirming care for minors but show more support for laws requiring government IDs to show sex at birth instead of gender identity.
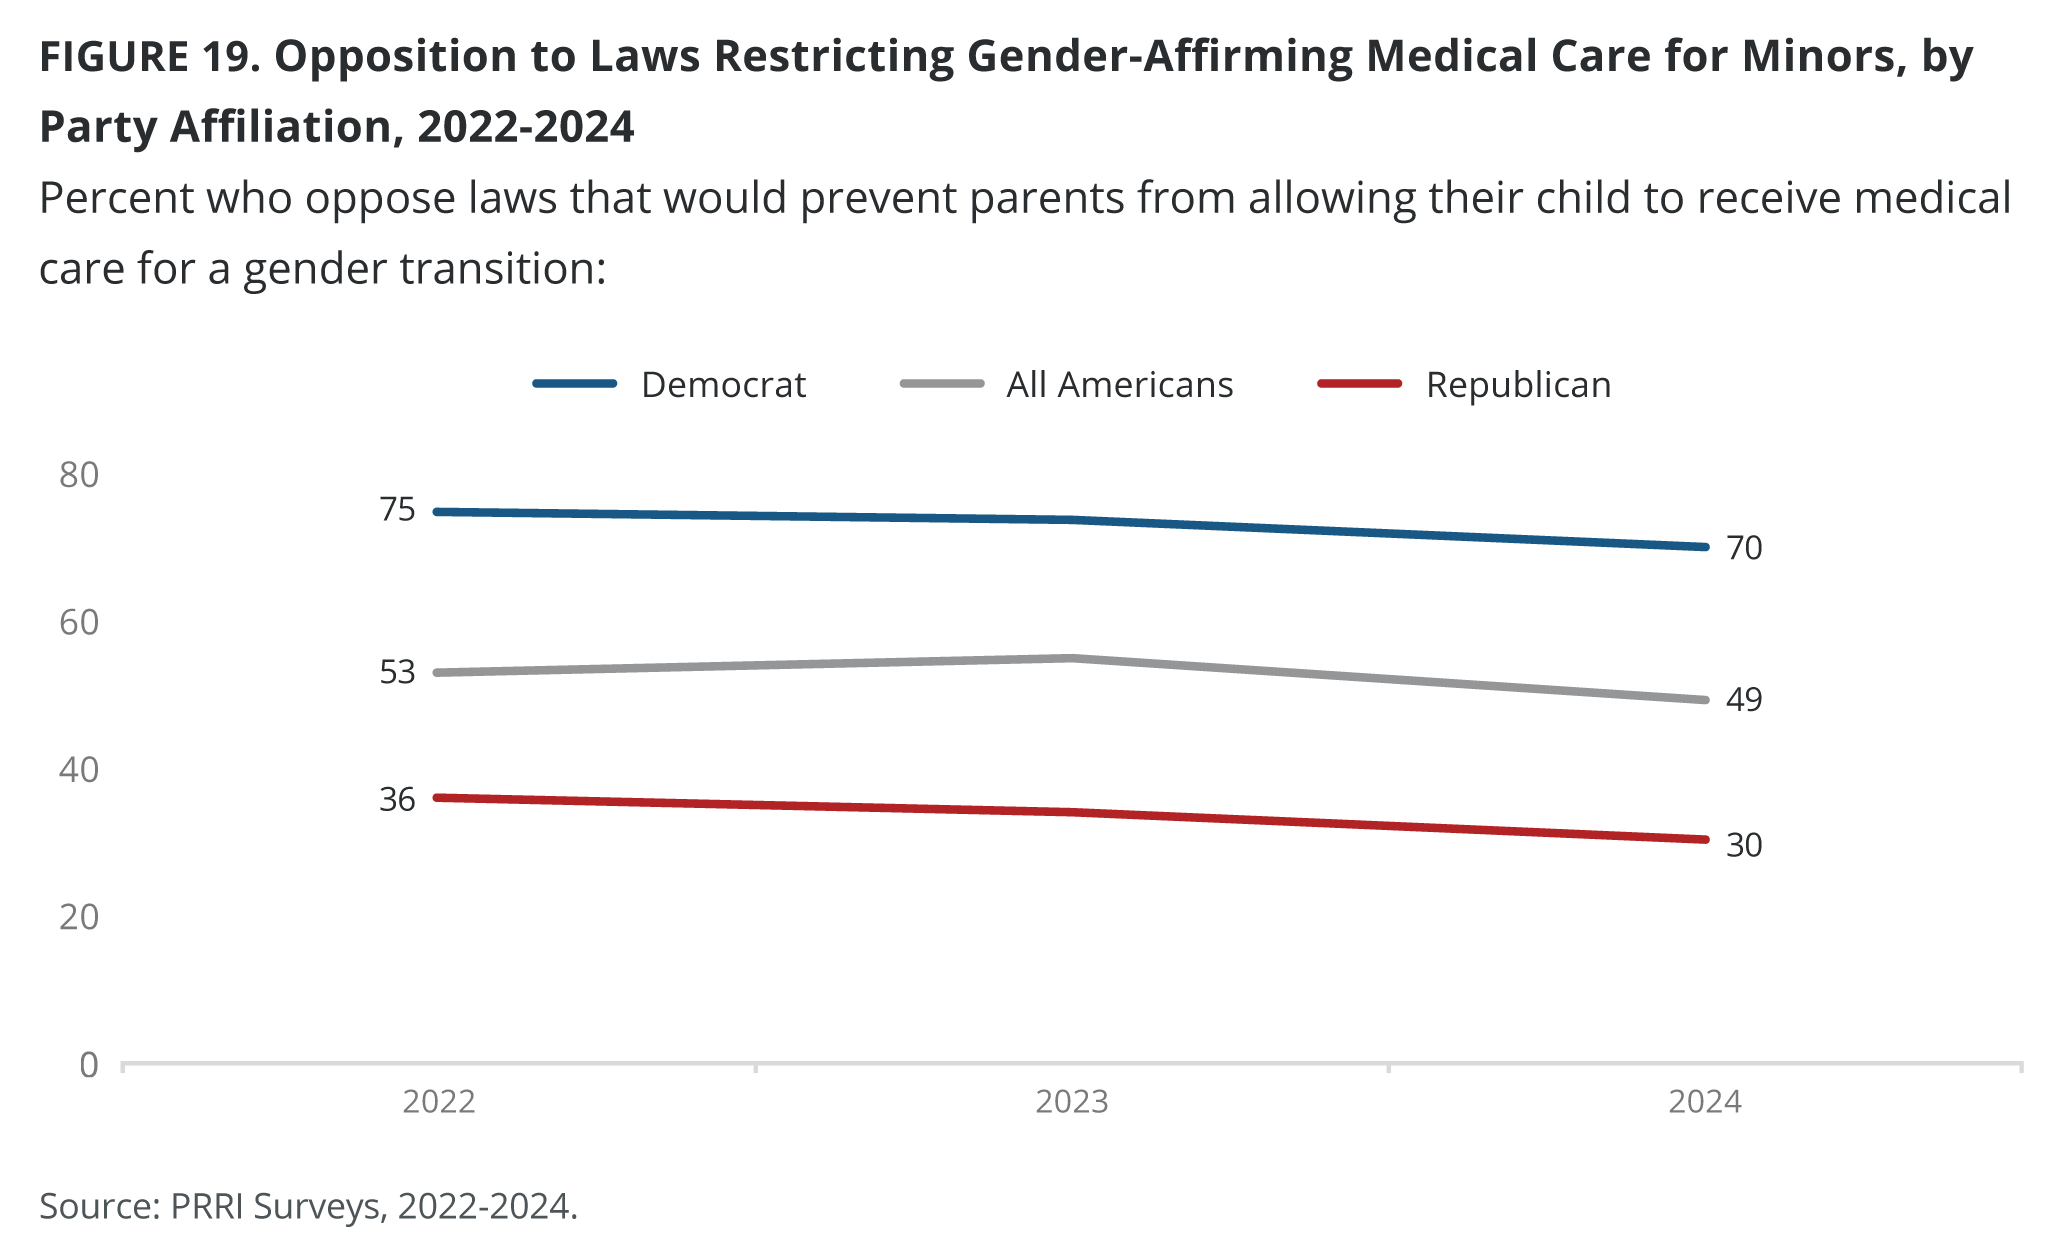
- Americans are divided on laws preventing parents from allowing their child to receive medical care for a gender transition (49% oppose, 47% in favor). Democrats are most likely to oppose such laws (70%), followed by independents (49%) and Republicans (30%).
- Residents of states without bans are more likely to oppose such laws than those in states with bans (54% vs. 44%).
- Most Democrats (60%) oppose laws that require driver’s licenses and government IDs to show a person’s sex at birth rather than their gender identity, compared with 37% of independents, and just 14% of Republicans.
- Most states allow gender marker changes on licenses, though requirements vary. Four states — Kansas, Texas, Florida, and Tennessee — prohibit these changes. However, residents in these states do not exhibit the lowest opposition to laws that require IDs to display sex at birth.
Christian nationalism Rejecters are more likely to support LGBTQ rights than Skeptics, Sympathizers, or Adherents.
- Americans who qualify as Christian nationalism Rejecters (93%) are the most likely to favor protections for LGBTQ Americans in housing, public accommodations, and employment, followed by 80% of Skeptics, 62% of Sympathizers, and 48% of Adherents.
- Christian nationalism Rejecters (82%) are significantly more likely to oppose religiously based service refusals than Skeptics (59%), Sympathizers (41%), and Adherents (33%).
- Nearly all Christian nationalism Rejecters (92%) and three-fourths of Skeptics (74%) support same-sex marriage, compared with 46% of Sympathizers and 23% of Adherents.
- Christian nationalism Rejecters (72%) are significantly more likely to oppose laws that prevent parents from allowing their children to receive medical care for a gender transition than Skeptics (48%), Sympathizers (35%), and Adherents (31%).
- Two-thirds of Christian nationalism Rejecters (66%) oppose laws that require a person’s sex at birth to be shown on their ID, compared with 33% of Skeptics, 18% of Sympathizers, and 12% of Adherents.
Introduction
Over the course of 2024, PRRI interviewed more than 22,000 adults as part of the PRRI American Values Atlas, offering a detailed and comprehensive profile of the demographic, religious, and political characteristics of LGBTQ Americans. Building on insights from previous years, this report examines public attitudes on LGBTQ rights across all 50 states and the District of Columbia, with a focus on three key policy areas: nondiscrimination protections, religiously based service refusals, and same-sex marriage. To address emerging issues, PRRI’s American Values Atlas survey also introduced two new questions throughout 2024 exploring views on transgender-related policies, including laws restricting gender-affirming care for minors and ID laws requiring the display of birth-assigned sex.
Measuring LGBTQ Identity
PRRI measures sexual orientation by asking whether respondents identify as gay, lesbian, bisexual, straight, or another identity. Individuals identifying as gay, lesbian, bisexual, or something else are classified as LGBTQ, while those identifying as straight are classified as non-LGBTQ.
Gender identity is measured through questions about birth-assigned sex and current gender identity. Respondents are classified as cisgender if their current gender matches their birth-assigned sex, while those whose responses indicate differences — such as identifying as transgender, non-binary, or another identity — are classified as transgender/non-binary.
The final LGBTQ identity category includes all individuals who are transgender, non-binary, or who identify as a sexual minority, while cisgender individuals identifying as straight are categorized as non-LGBTQ.[1] In the 2024 PRRI American Values Atlas, 10% of Americans identify as LGBTQ, including 3% who identify as gay or lesbian, 4% who identify as bisexual, and around 2% who identify as “something else.” Compared with 2016, the size of the LGBTQ population has more than doubled, from 4% to 10%.
Profile of LGBTQ Americans
While Americans who identify as LGBTQ mirror the American population on many demographic fronts, LGBTQ Americans are more likely than the general population to reside in Western states, be younger, women, Democrats, religiously unaffiliated, and Christian nationalism Rejecters.
Geography
While the highest proportion of LGBTQ Americans resides in the District of Columbia (18%), LGBTQ identity tends to be higher in Western states such as New Mexico (17%), Nevada (16%), Alaska (16%), Washington (13%), and Oregon (13%).
LGBTQ identity is also more pronounced in Northern states such as Rhode Island (16%) and Massachusetts (16%). In the South, the states with the highest numbers of LGBTQ Americans are Kentucky (14%), Mississippi (14%), Oklahoma (13%), and Virginia (13%). Similarly, in the Midwest, Indiana (12%), Missouri (11%), and Ohio (11%) have the largest proportions of LGBTQ residents.
The states with the lowest proportions of LGBTQ residents are South Dakota (4%), Louisiana (6%), Idaho (7%), New Jersey (7%), Hawaii (7%), and Iowa (7%).
Generation and Gender
Nearly one-quarter of Gen Z adults identify as LGBTQ (24%), followed by 13% of millennials, and fewer than one in ten Gen Xers (7%), baby boomers (4%), and members of the Silent Generation (2%). These percentages have remained stable since 2023.
LGBTQ Americans are significantly younger than the general population. The percentage of LGBTQ Americans who are Gen Zers (36%) is more than twice the share of all American Gen Zers (16%). Millennials (34%) are also overrepresented among LGBTQ Americans, compared with their share in the general population (28%). In contrast, members of Generation X (17%), baby boomers (11%), and the Silent Generation (1%) are underrepresented among the LGBTQ population, compared with all Americans (26%, 27%, and 4%, respectively).
LGBTQ Americans are slightly more likely to be women than men (53% vs. 47%), a gender difference that becomes more pronounced across generations. Gender differences in LGBTQ identity are particularly noticeable among younger groups, with Gen Z women (23%) and millennial women (19%) identifying as LGBTQ at higher rates than their male counterparts (14% and 15%, respectively). In contrast, gender differences are minimal among Gen X, baby boomers, and the Silent Generation, where both men and women report similar lower levels of LGBTQ identity.
Party and Political Ideology
LGBTQ Americans are more likely than the general population to identify as Democrats (39% vs. 29%) and less likely to identify as Republicans (10% vs. 29%). However, they are just as likely to identify as independents (28% vs. 26%). Additionally, one in four LGBTQ Americans (24%) align with other political parties or are uncertain about their political identity, compared with 16% of all Americans.
Half of LGBTQ Americans identify as liberal, twice the rate of all Americans (51% vs. 26%), while they are half as likely as all Americans to identify as conservative (16% vs. 35%). LGBTQ Americans are also slightly less likely than all Americans to identify as moderate (32% vs. 36%).
Religious Affiliation and Christian Nationalism
The majority of LGBTQ Americans identify as religiously unaffiliated (52%), about twice the rate of all Americans (28%); LGBTQ Americans are also more likely to identify with a non-Christian religion (10% vs. 6%).[2] In contrast, LGBTQ Americans are notably less likely than all Americans to identify with a white Christian group, including as white evangelical Protestant (4% vs. 14%), white Catholic (6% vs. 12%), or white mainline/non-evangelical Protestant (8% vs. 12%). There are little differences between LGBTQ Christians of color and all Christians of color.
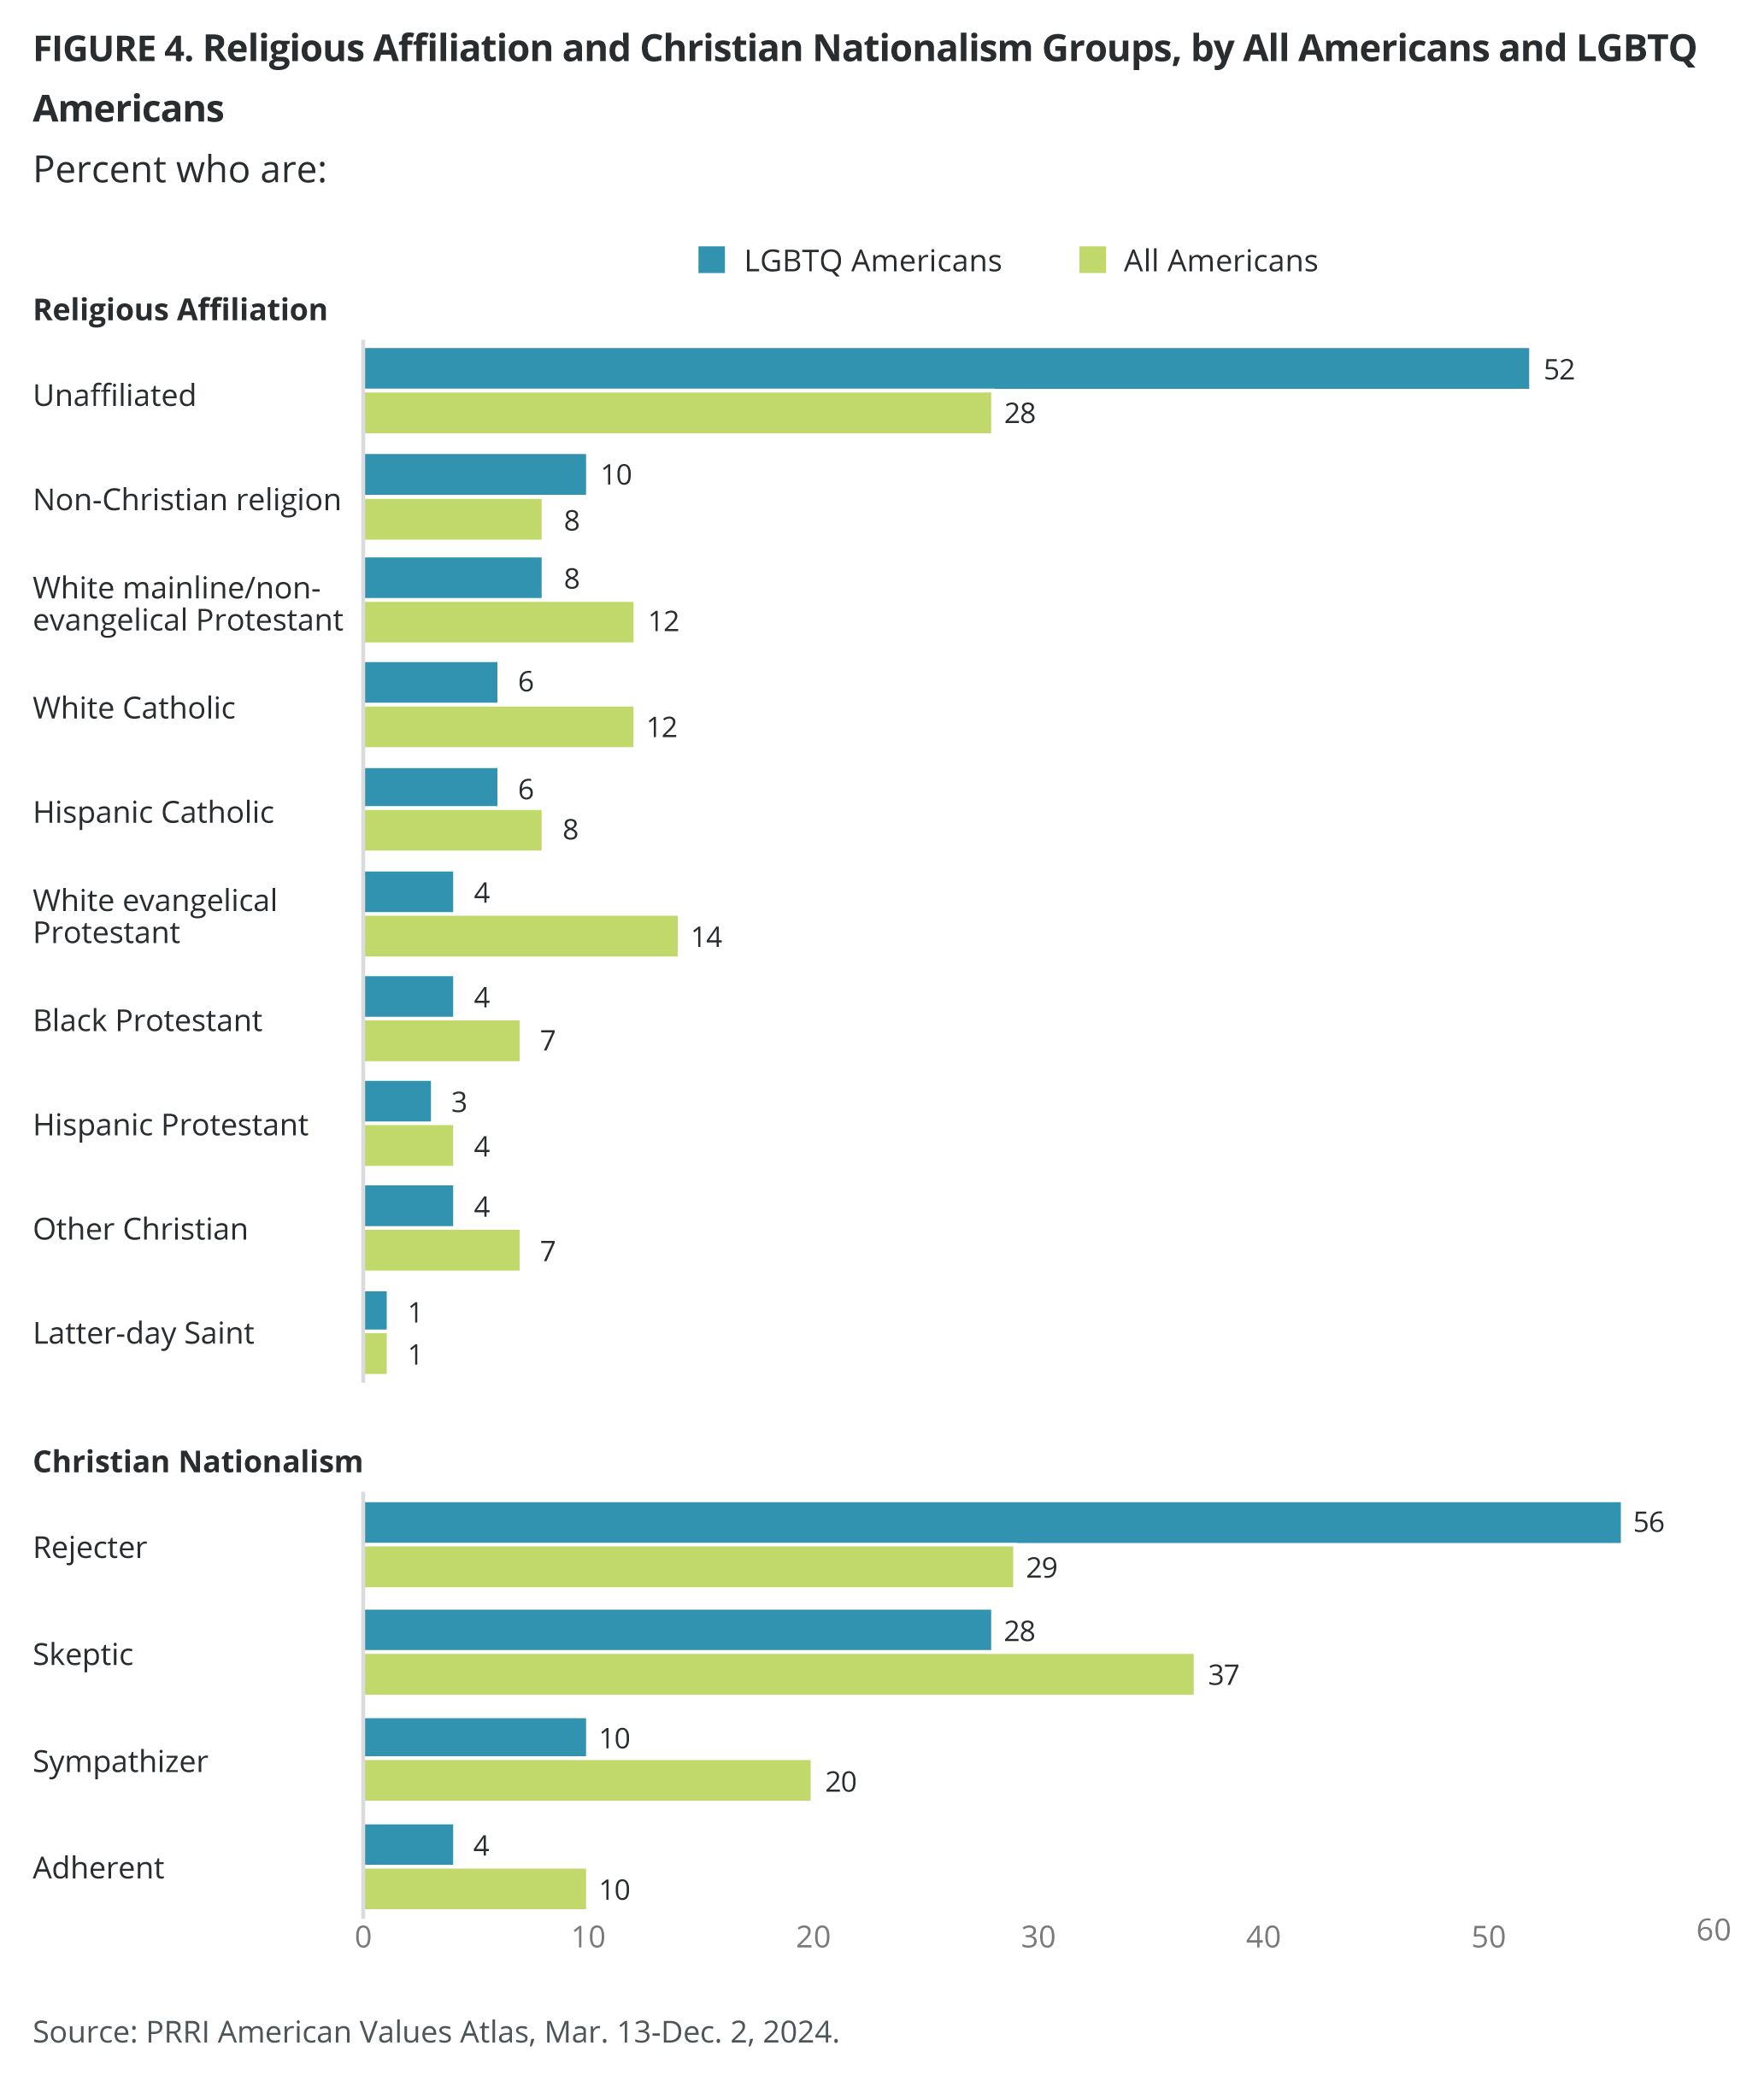
In addition, the majority of LGBTQ Americans qualify as Christian nationalism Rejecters (56%), nearly twice the rate of all Americans (29%). In contrast, LGBTQ Americans are less likely than all Americans to qualify as Christian nationalism Skeptics (28% vs. 37%), Sympathizers (10% vs. 20%), and Adherents (4% vs. 10%).[3]
Attitudes Toward LGBTQ Policies
PRRI has been tracking Americans’ support for or opposition to three key LGBTQ-related policies: (1) nondiscrimination laws, (2) religiously based service refusals, and (3) same-sex marriage. The nondiscrimination question is framed as “laws that would protect gay, lesbian, bisexual, and transgender people against discrimination in jobs, public accommodations, and housing.” For service refusal policies, it is worded as “allowing a small business owner in your state to refuse to provide products or services to gay or lesbian people if doing so would violate their religious beliefs” and for same-sex marriage, it is worded as “allowing same-sex couples to marry legally.”
Support for Nondiscrimination Protections 2015-2024
Three-fourths of Americans (75%) support policies that protect LGBTQ Americans from discrimination in housing, employment, and public accommodations. This represents a 4-percentage-point increase since the question was first asked in 2015, although support has declined from its peak of 80% in 2022.
Party Affiliation
Although majorities of Americans, regardless of political affiliation, favor nondiscrimination protections for LGBTQ people, Democrats (89%) are more likely than independents (78%) and Republicans (62%) to do so. Compared with 2015, support for these protections has increased by 11 percentage points among Democrats (89% vs. 78%) and by 5 percentage points among independents (78% vs. 73%). Republican support has remained consistent since 2015 (62% vs. 61%).
Religious Affiliation and Christian Nationalism
Support for nondiscrimination protections for LGBTQ individuals has remained stable or increased among most religious groups between 2015 and 2024. Overall, three-fourths of Americans (75%) support these protections in 2024, up from 71% in 2015. Support among Unitarian Universalists (86%), Buddhists (84%), the religiously unaffiliated (83%), white mainline/non-evangelical Protestants (78%), white Catholics (78%), and Hispanic Catholics (79%) remains stable or has grown since 2015. White evangelical Protestants (59%), Muslims (60%), and Hispanic Protestants (60%) have shown slight gains but support remains lower than the national average. Support among Jehovah’s Witnesses has declined significantly, from 51% in 2015 to 36% in 2024.
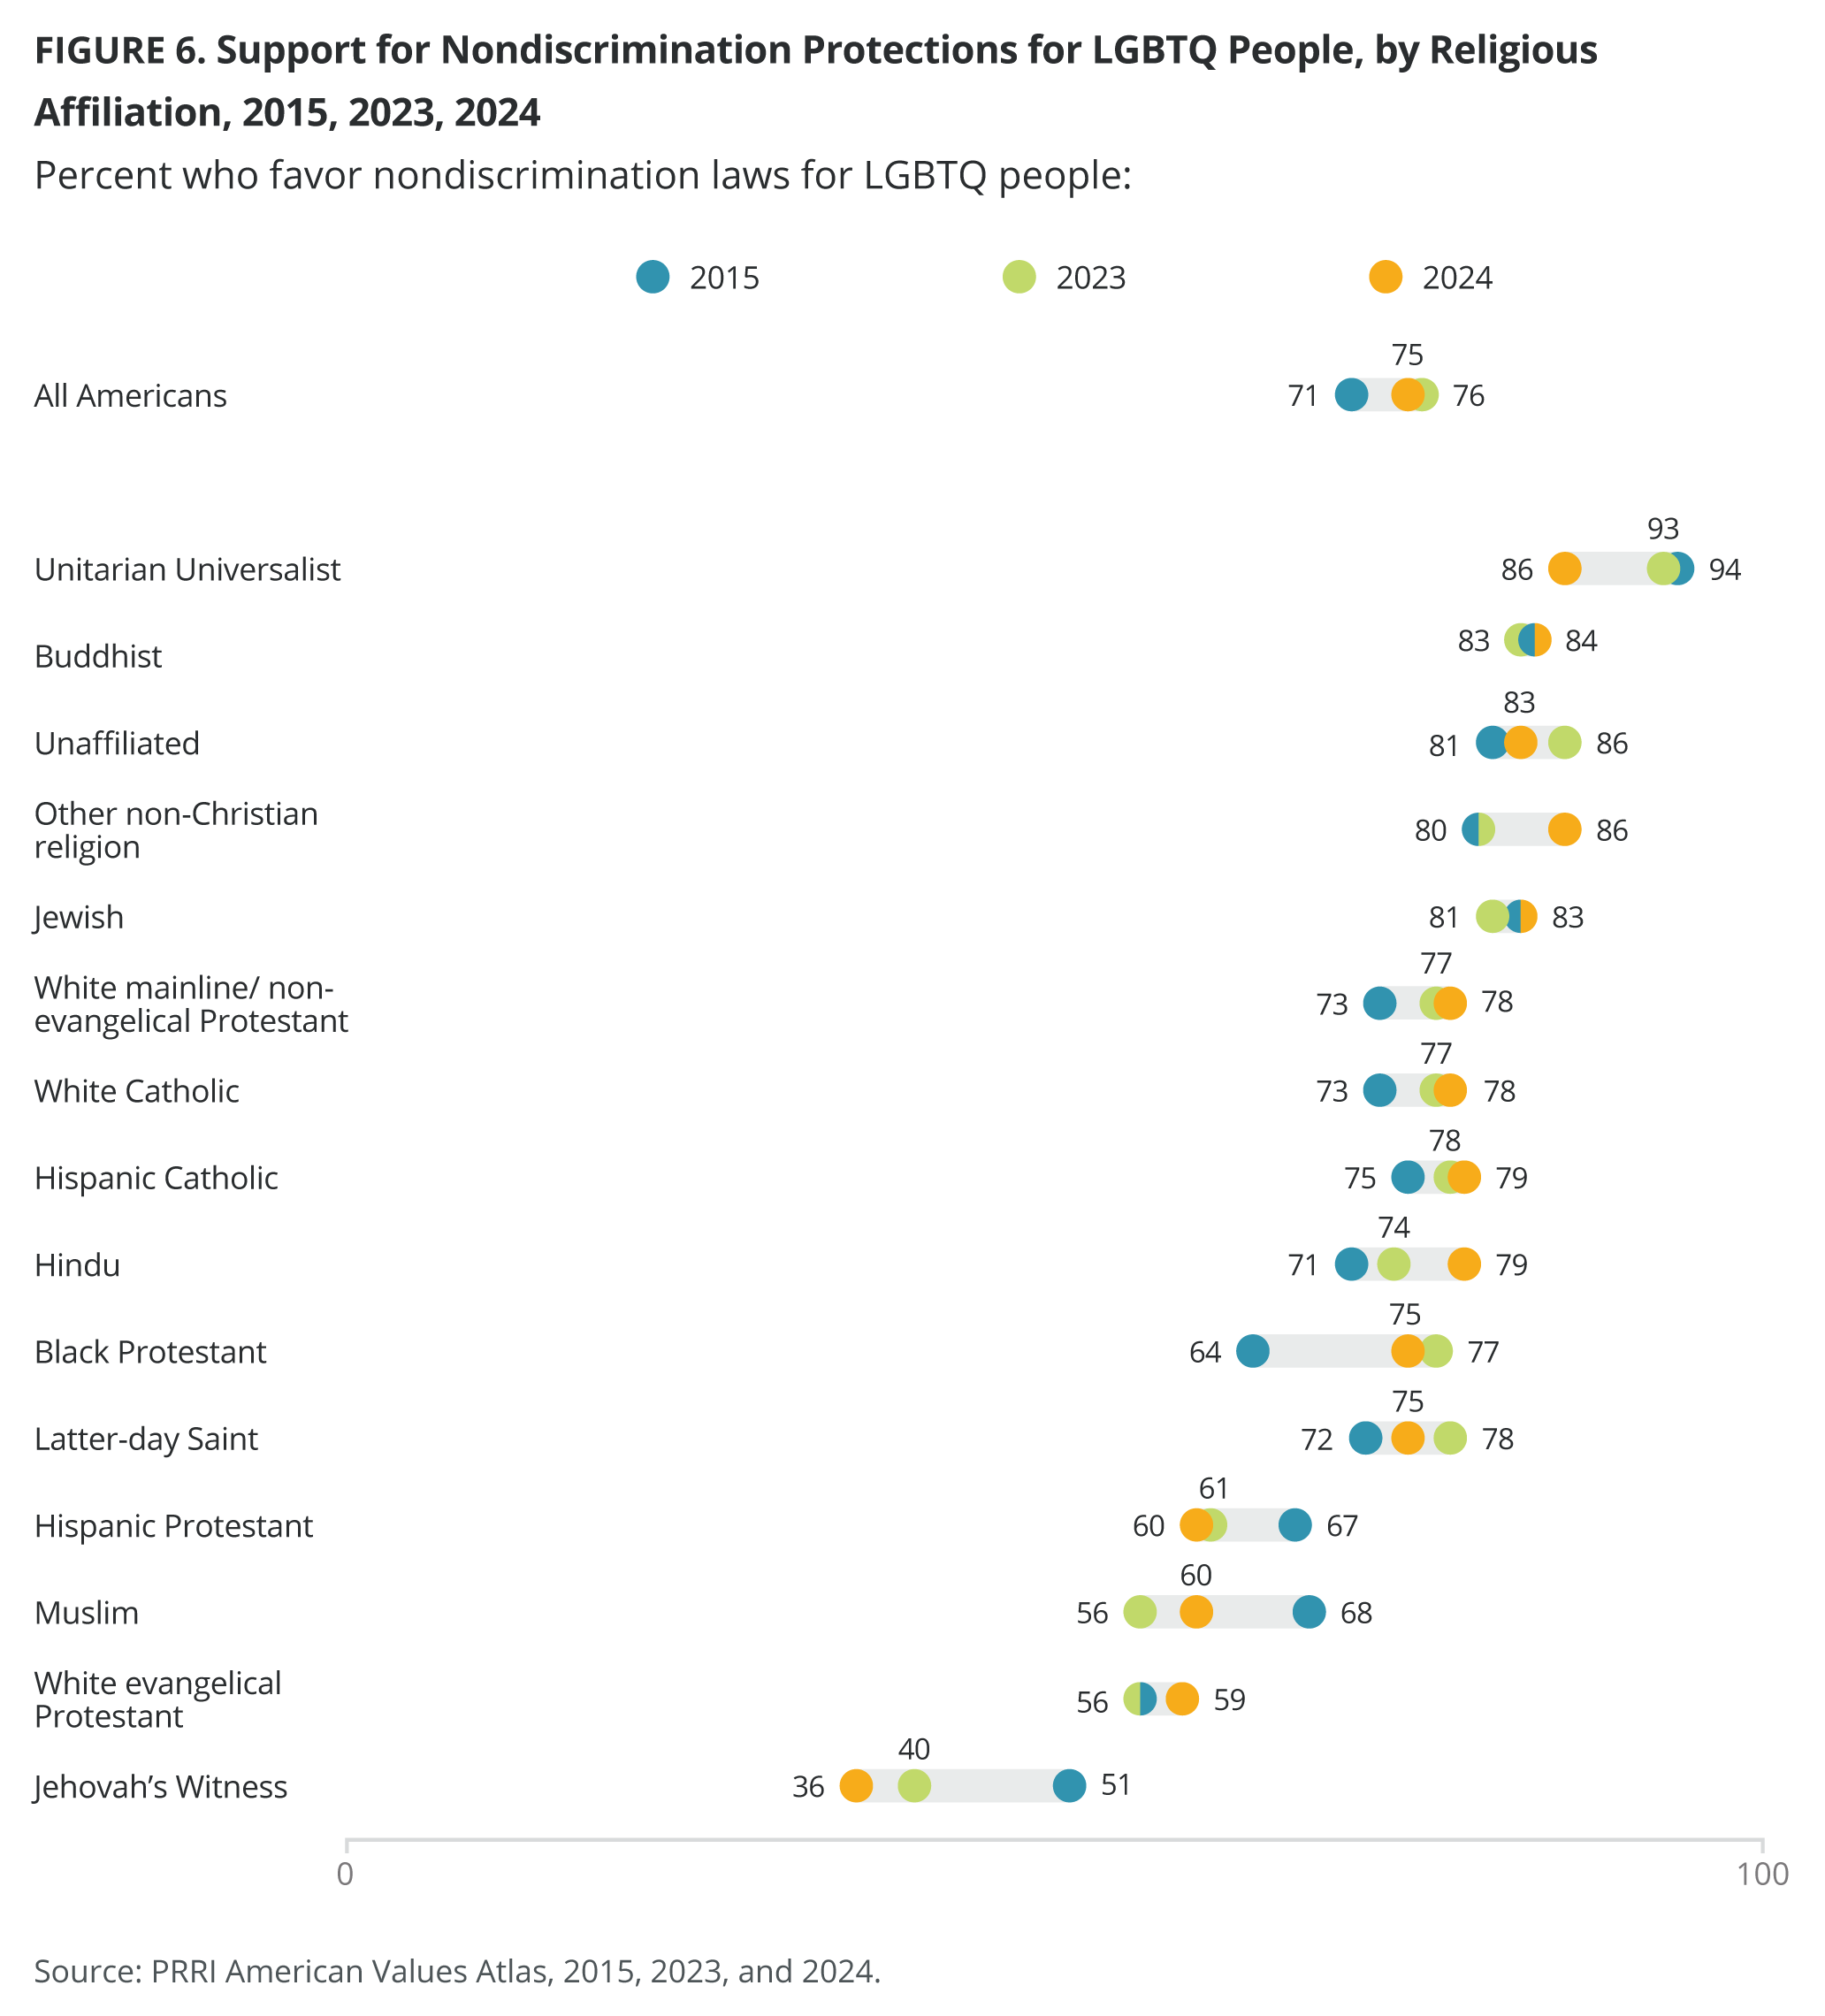
Christian nationalism Rejecters (93%) are the most likely to favor protections for LGBTQ Americans in housing, public accommodations, and employment, followed by 80% of Skeptics, 62% of Sympathizers, and 48% of Adherents.
Demographics
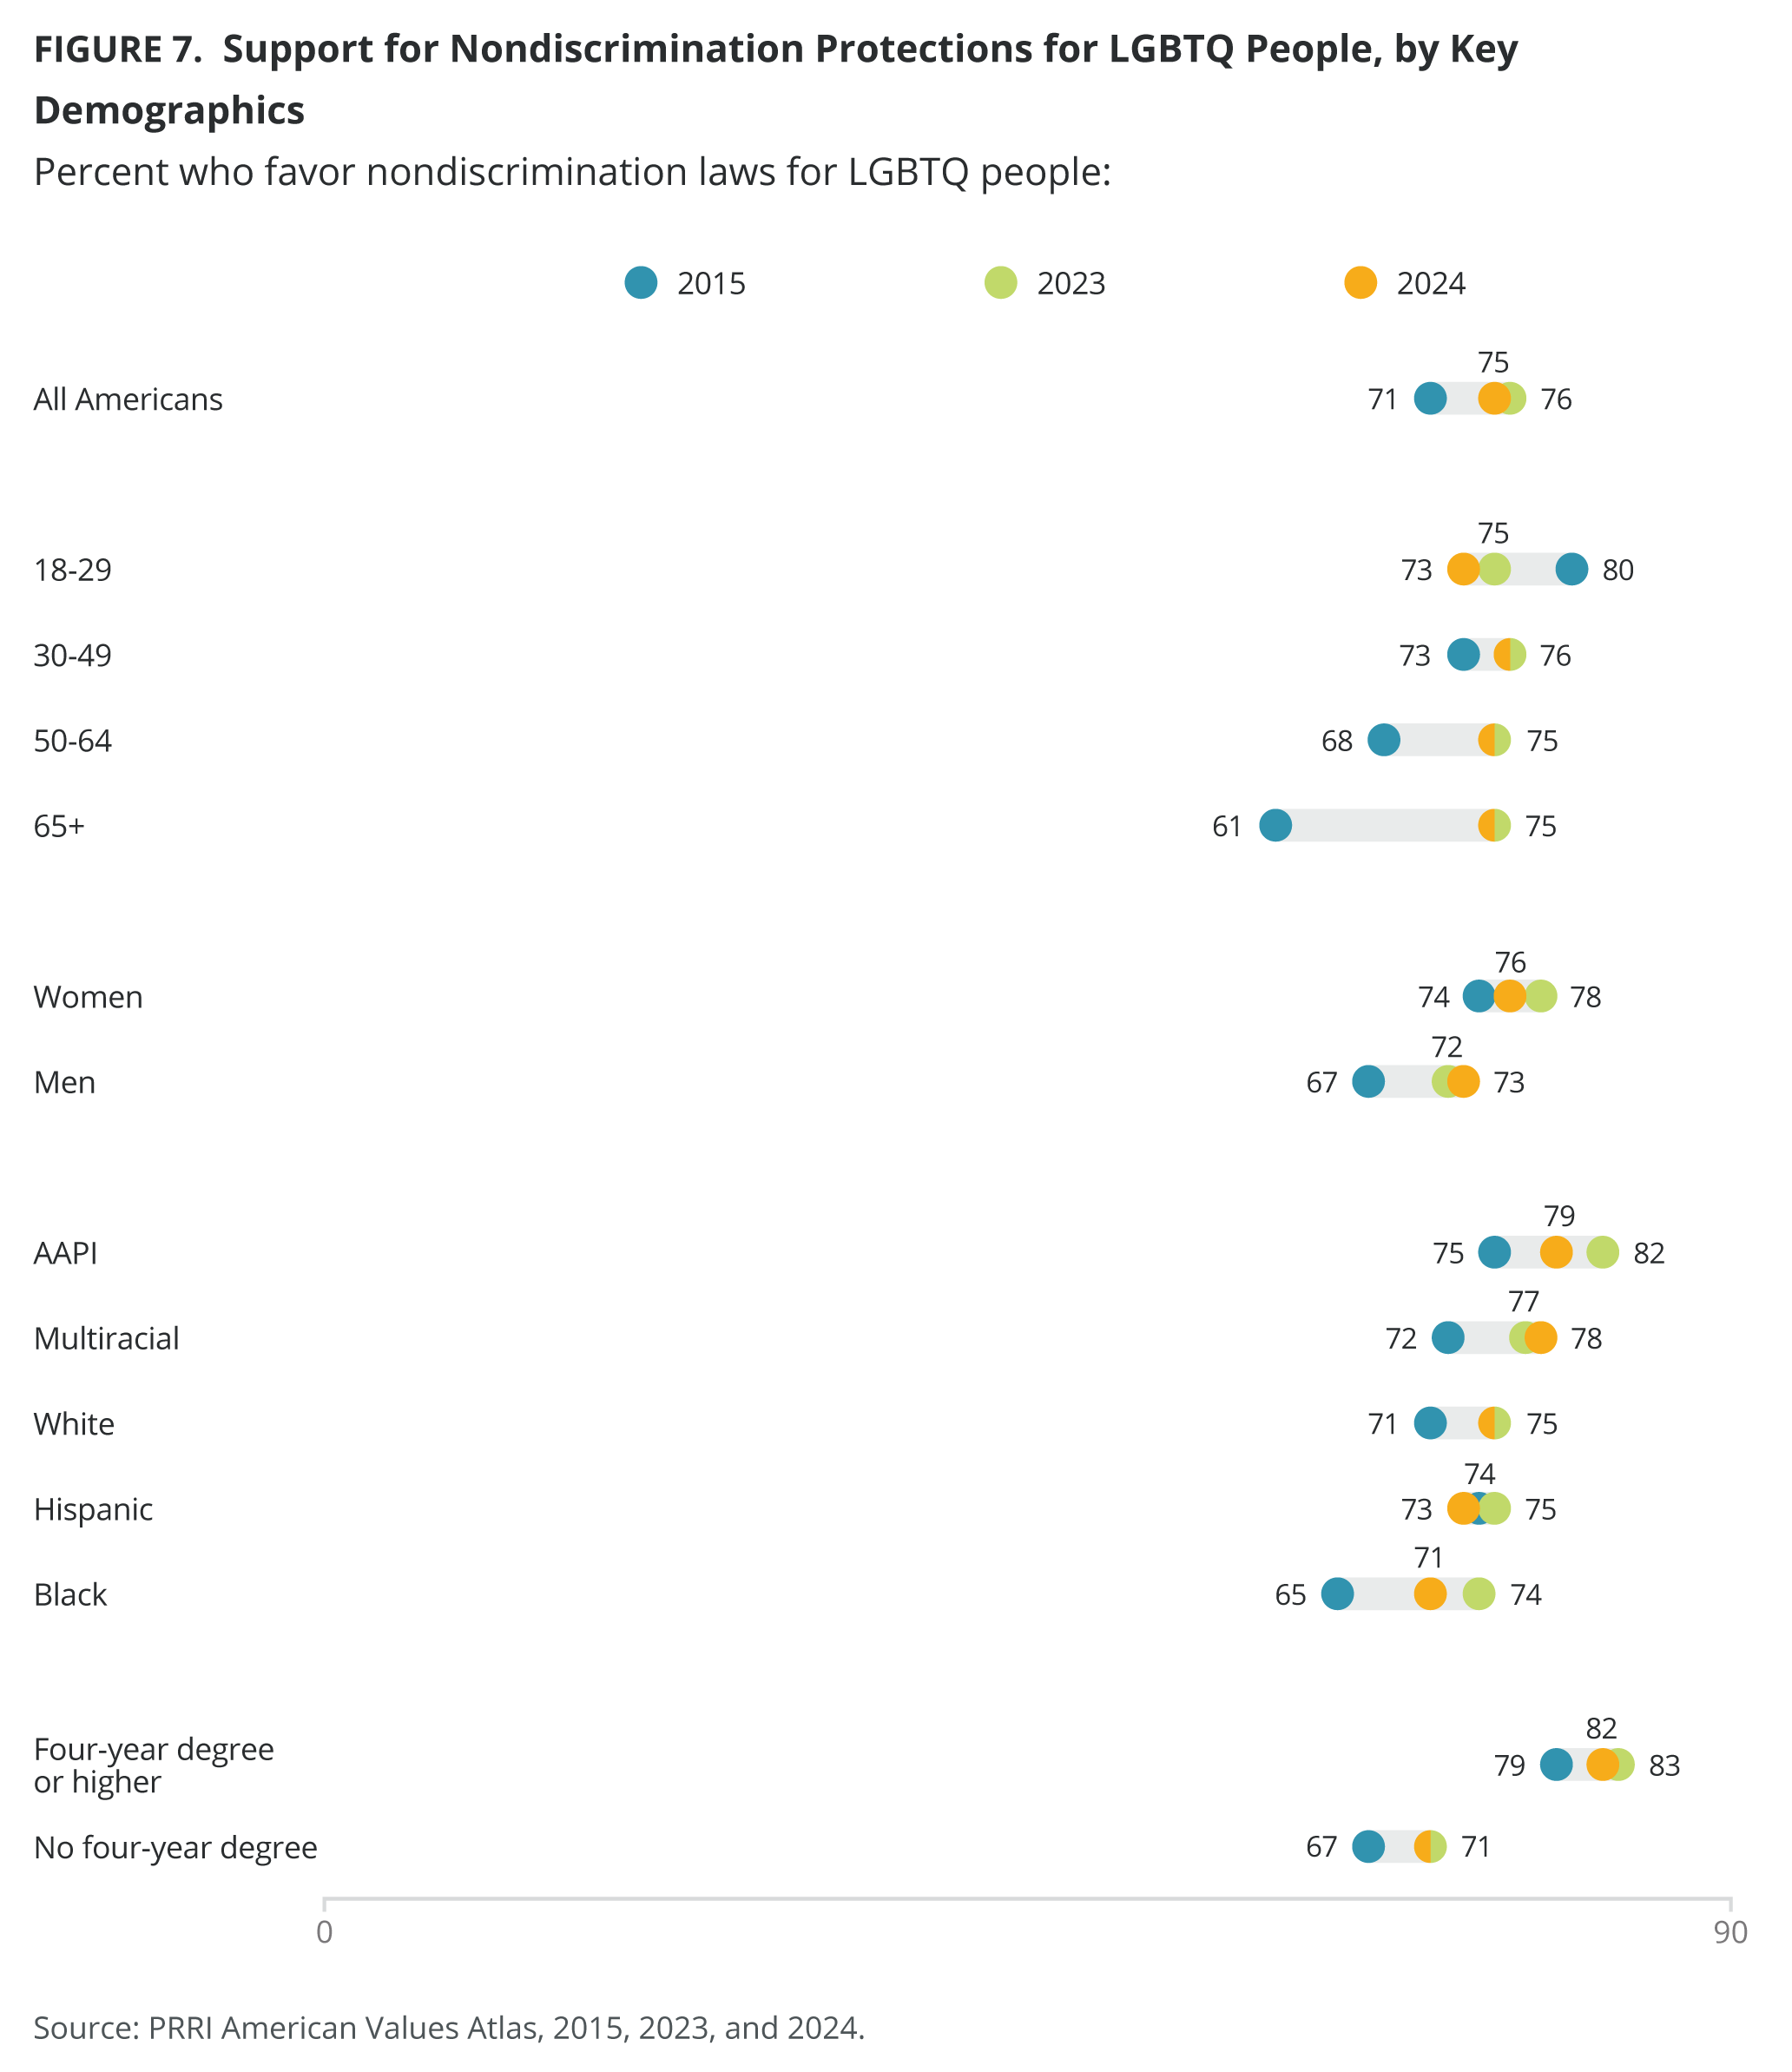
Across all generations, roughly three-fourths of Gen Zers (72%), millennials (76%), Gen Xers (74%), baby boomers (75%), and the Silent Generation (74%) favor nondiscrimination laws. Similarly, three-fourths of Americans in all age groups favor nondiscrimination laws: Americans under 30 (73%), Americans ages 30-49 (76%), Americans ages 50-64 (75%), and seniors 65 and over (75%). However, young Americans ages 18-29 have experienced a gradual decrease in support since 2015 (80%). In contrast, older Americans ages 50-64 and seniors 65 and over have increased their support since 2015 (68% and 61%, respectively).
In 2024, support for nondiscrimination laws shows little difference by gender, with 76% of women and 73% of men in favor. However, men have shown increased support since 2015 (67%), while support among women has remained stable (74% in 2015).
Support for nondiscrimination laws across different racial and ethnic groups remains high. AAPI individuals showed the highest support in 2024, at 79%, an increase from 75% in 2015. While multiracial (78%) and white Americans (75%) have increased their support since 2015 (72% and 71%), Black individuals show the most significant increase, rising from 65% in 2015 to 71% in 2024. Hispanic Americans have maintained consistent support over the years (73% in 2024).
Americans with a four-year degree or higher (82%) are more likely than those without a college degree (71%) to support LGBTQ nondiscrimination laws. However, those without a college degree have increased their support since 2015 (67%).
Support for Nondiscrimination Protections in All 50 States
Nearly nine in ten residents of Vermont (90%), the District of Columbia (88%), and Massachusetts (86%) support nondiscrimination laws, followed by 83% of Connecticut and Maryland residents. The five states with the lowest levels of support for these protections are Oklahoma (57%), Arkansas (60%), South Dakota (65%), Wyoming (65%), and South Carolina (66%). Oregon is the only state that experienced a decline in support from the previous year (81% in 2023 to 70% in 2024), while Vermont showed an increase (79% in 2023 to 90% in 2024).
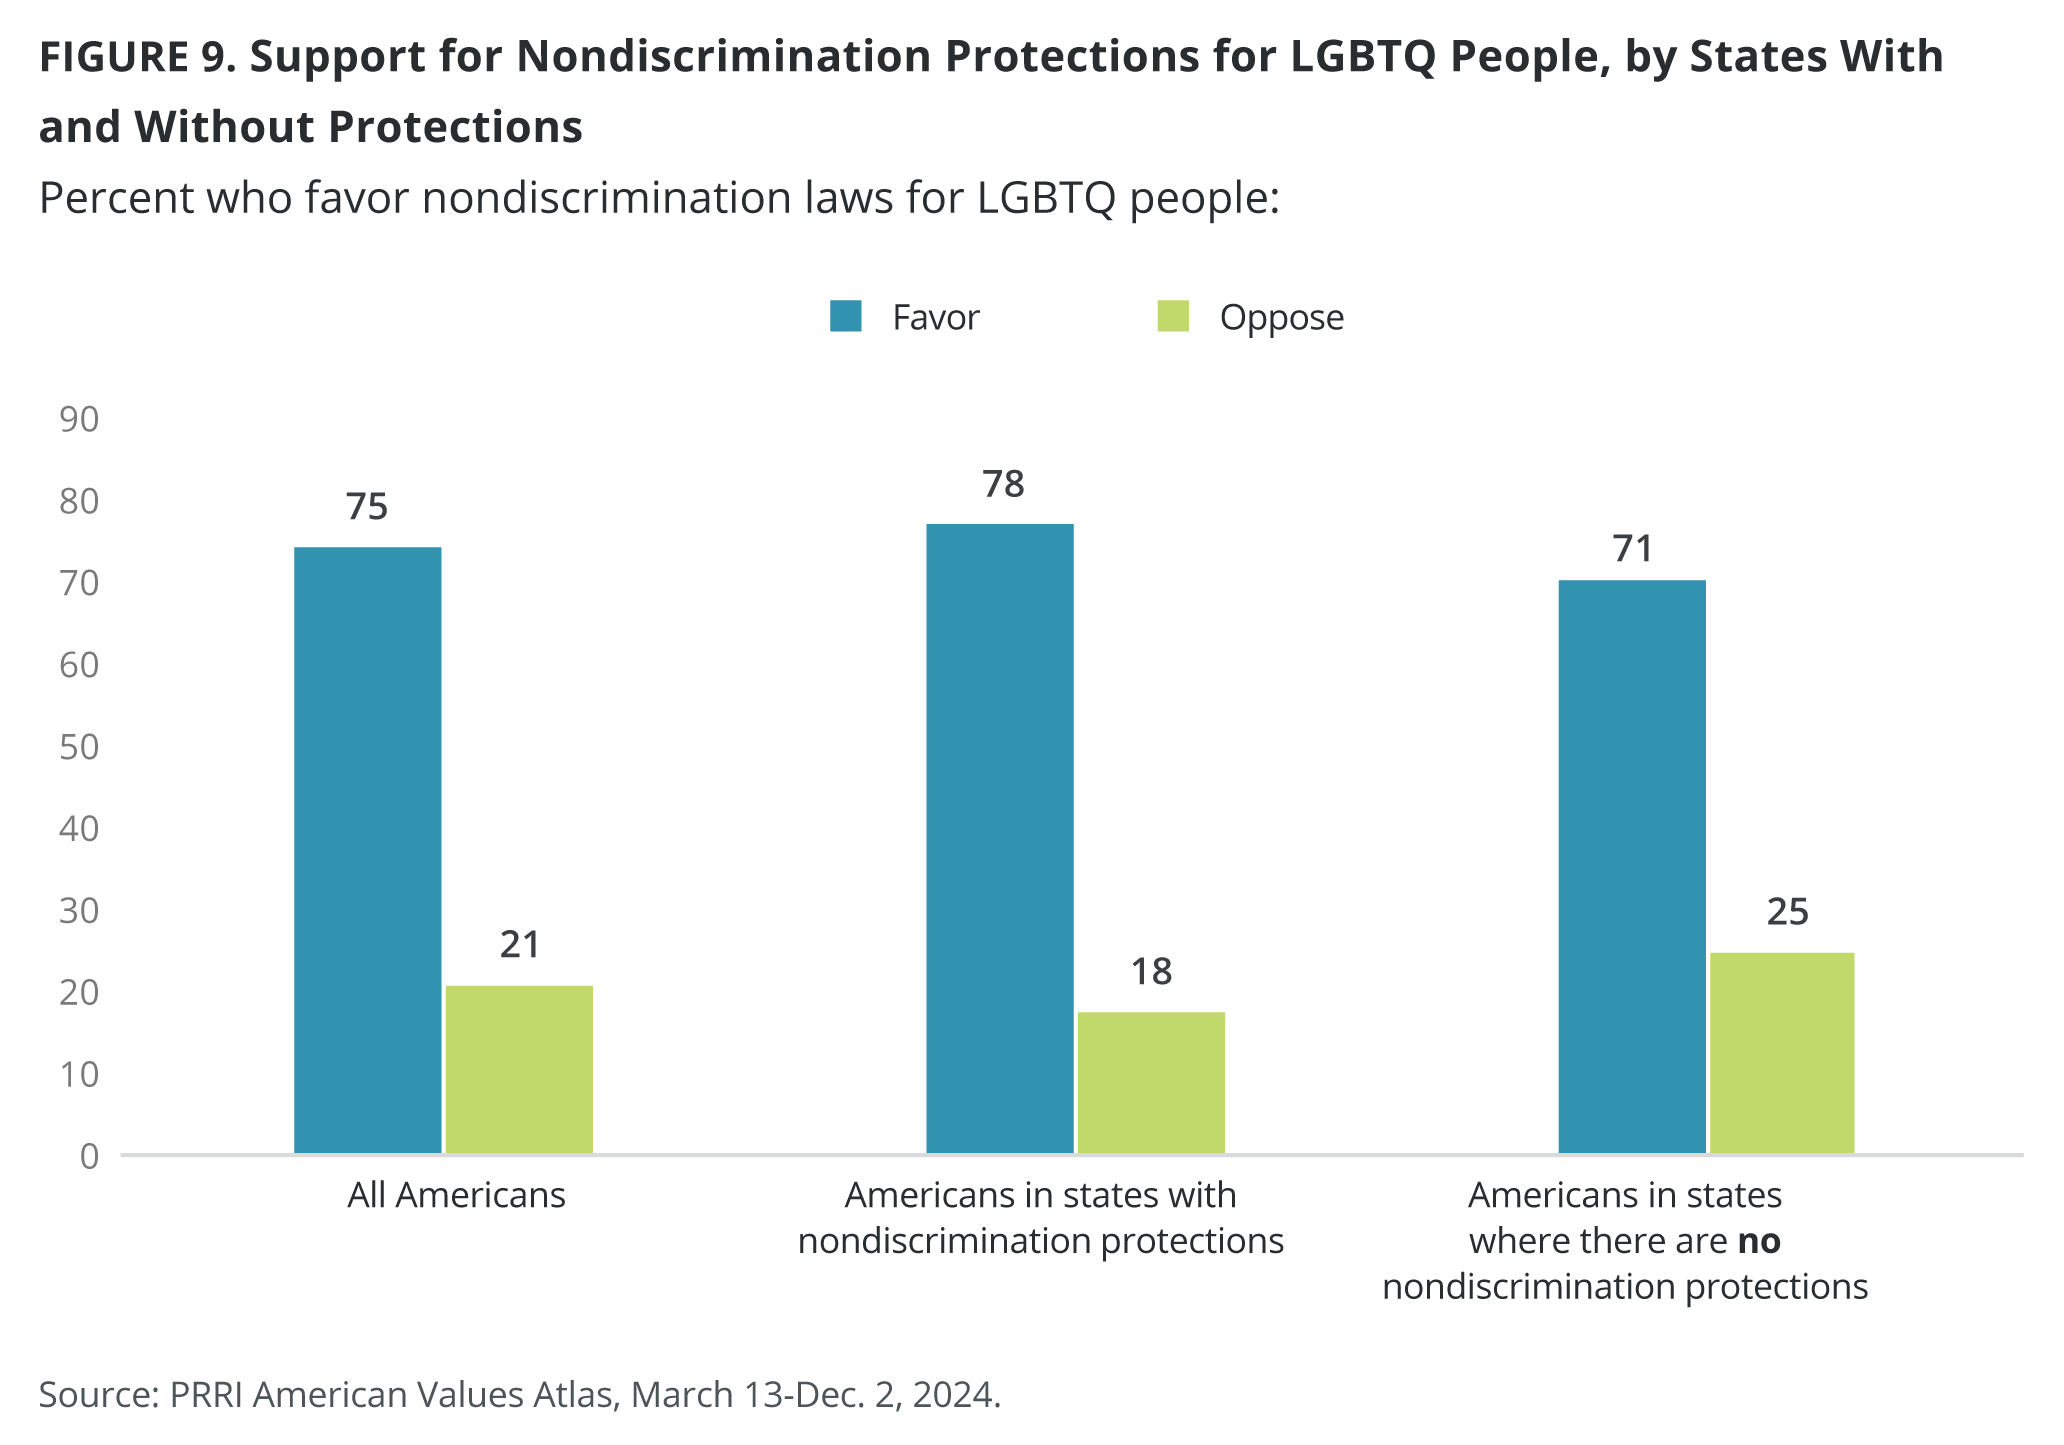
Americans who live in states that have legal protections for LGBTQ people in jobs, public accommodations, and housing are slightly more likely than those in states without these protections to favor nondiscrimination laws (78% vs. 71%).[4]
Opposition to Religiously Based Refusals 2015-2024
Most Americans (58%) oppose “allowing a small business owner in your state to refuse to provide products or services to gay or lesbian people if doing so would violate their religious beliefs,” compared with 38% in favor. This percentage has remained consistent since this question was first asked in 2015 (59%).
Party Affiliation
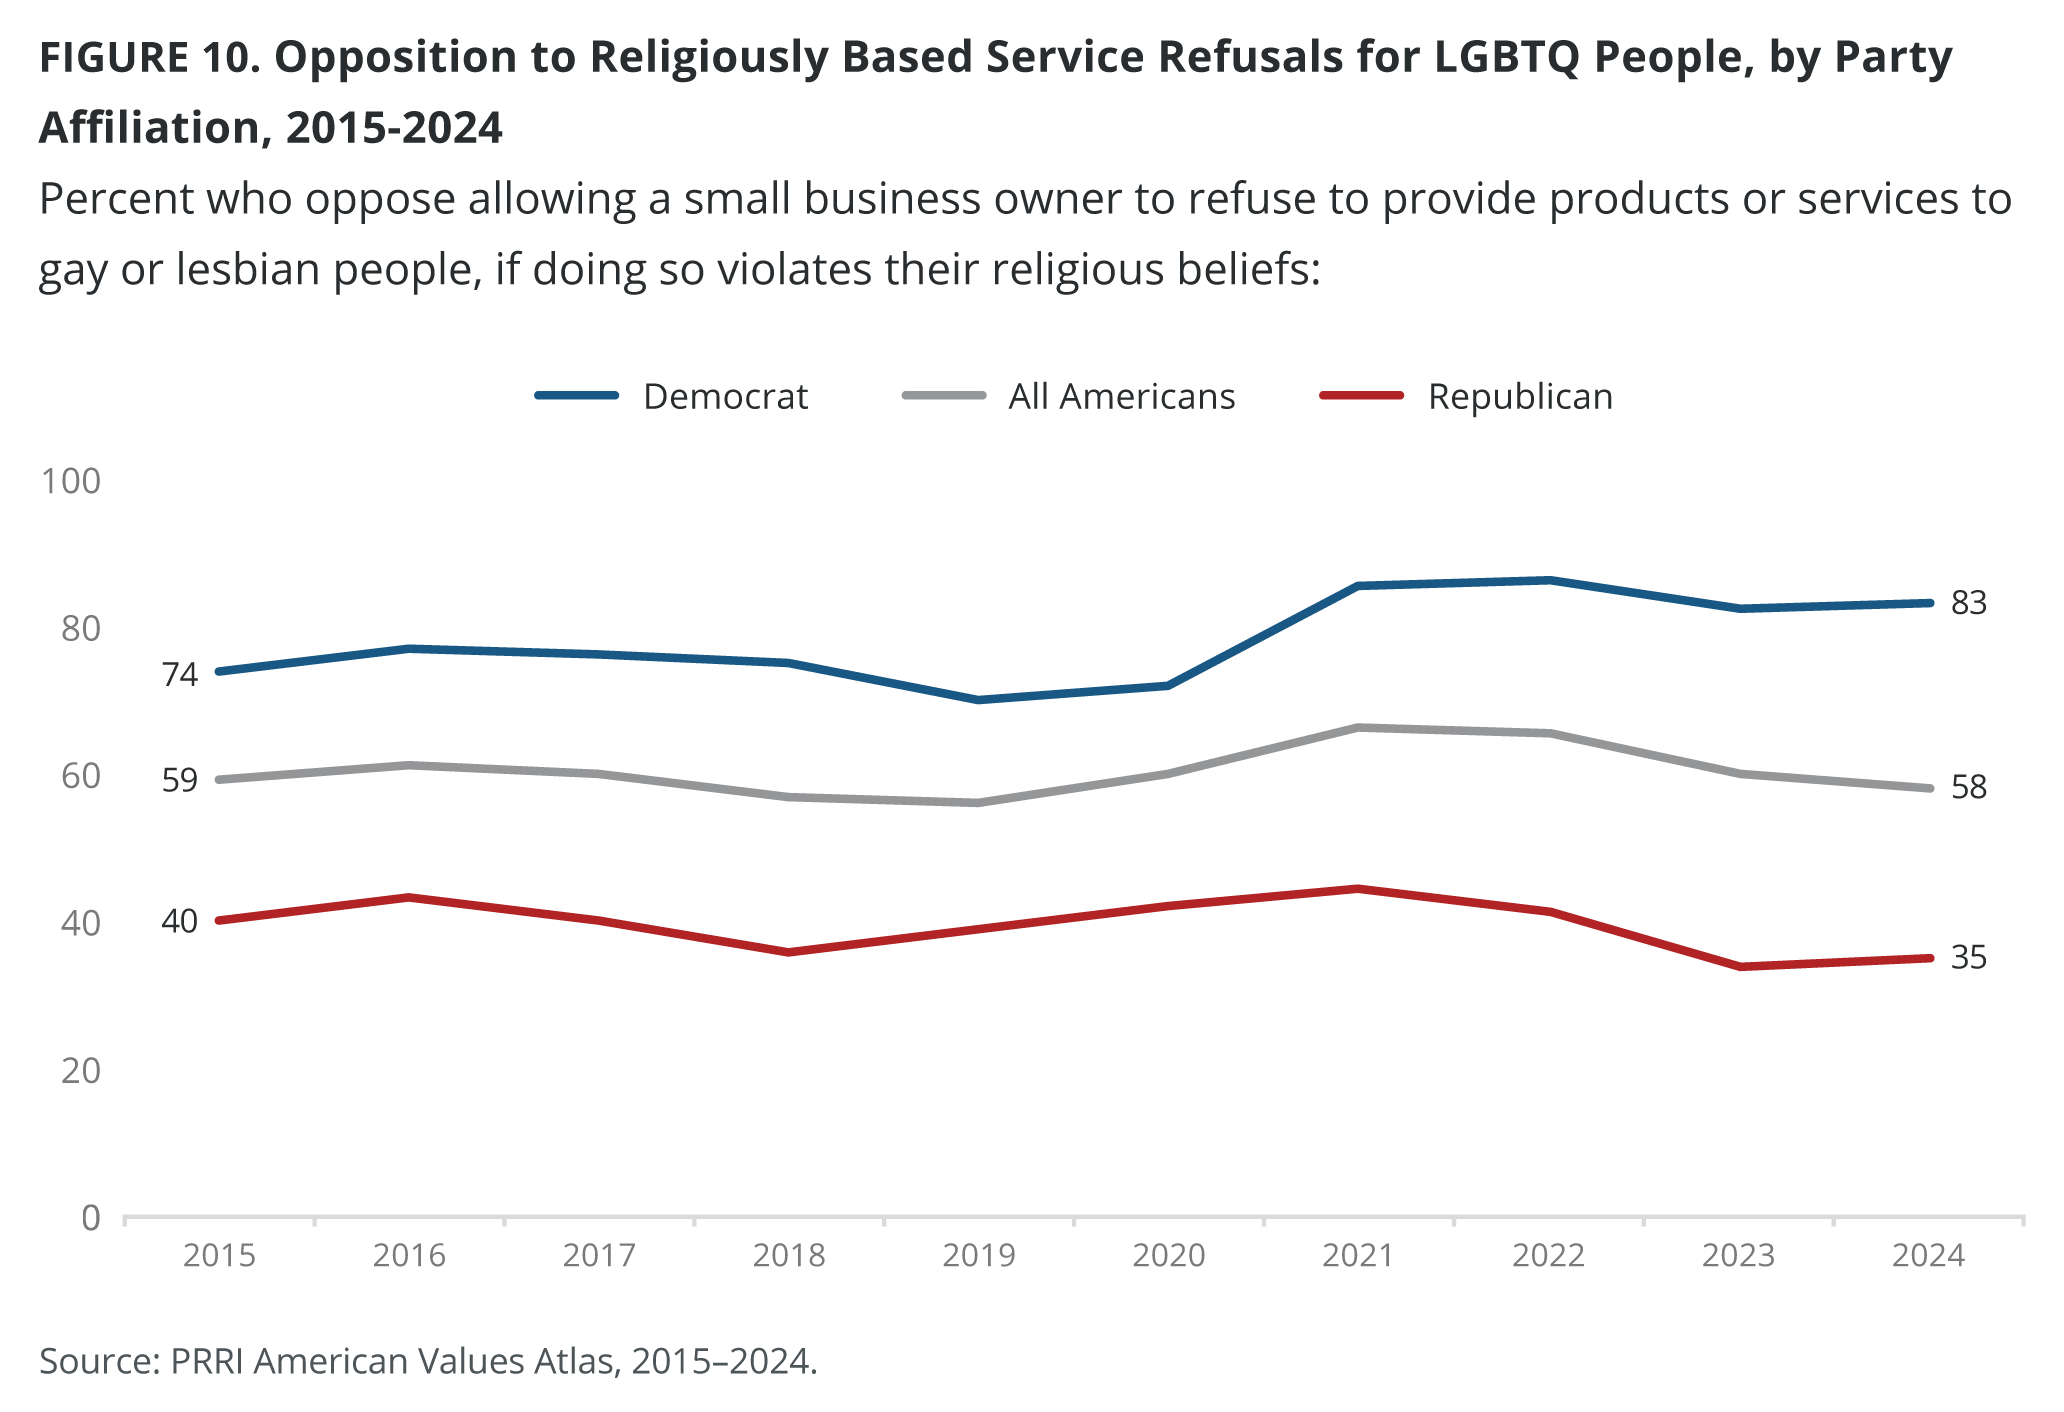
In 2024, Democrats (83%) are notably more likely than independents (56%) and Republicans (35%) to oppose allowing small business owners to refuse service to LGBTQ people based on their religious beliefs. Among Democrats, opposition has risen steadily from 74% in 2015, except for a low of 70% in 2019. For independents, opposition has remained relatively stable, ranging from a low of 56% in 2018 to a high of 66% in 2021. In contrast, Republican opposition has declined, dropping from a high of 44% in 2021 to a low of 34% in 2023.
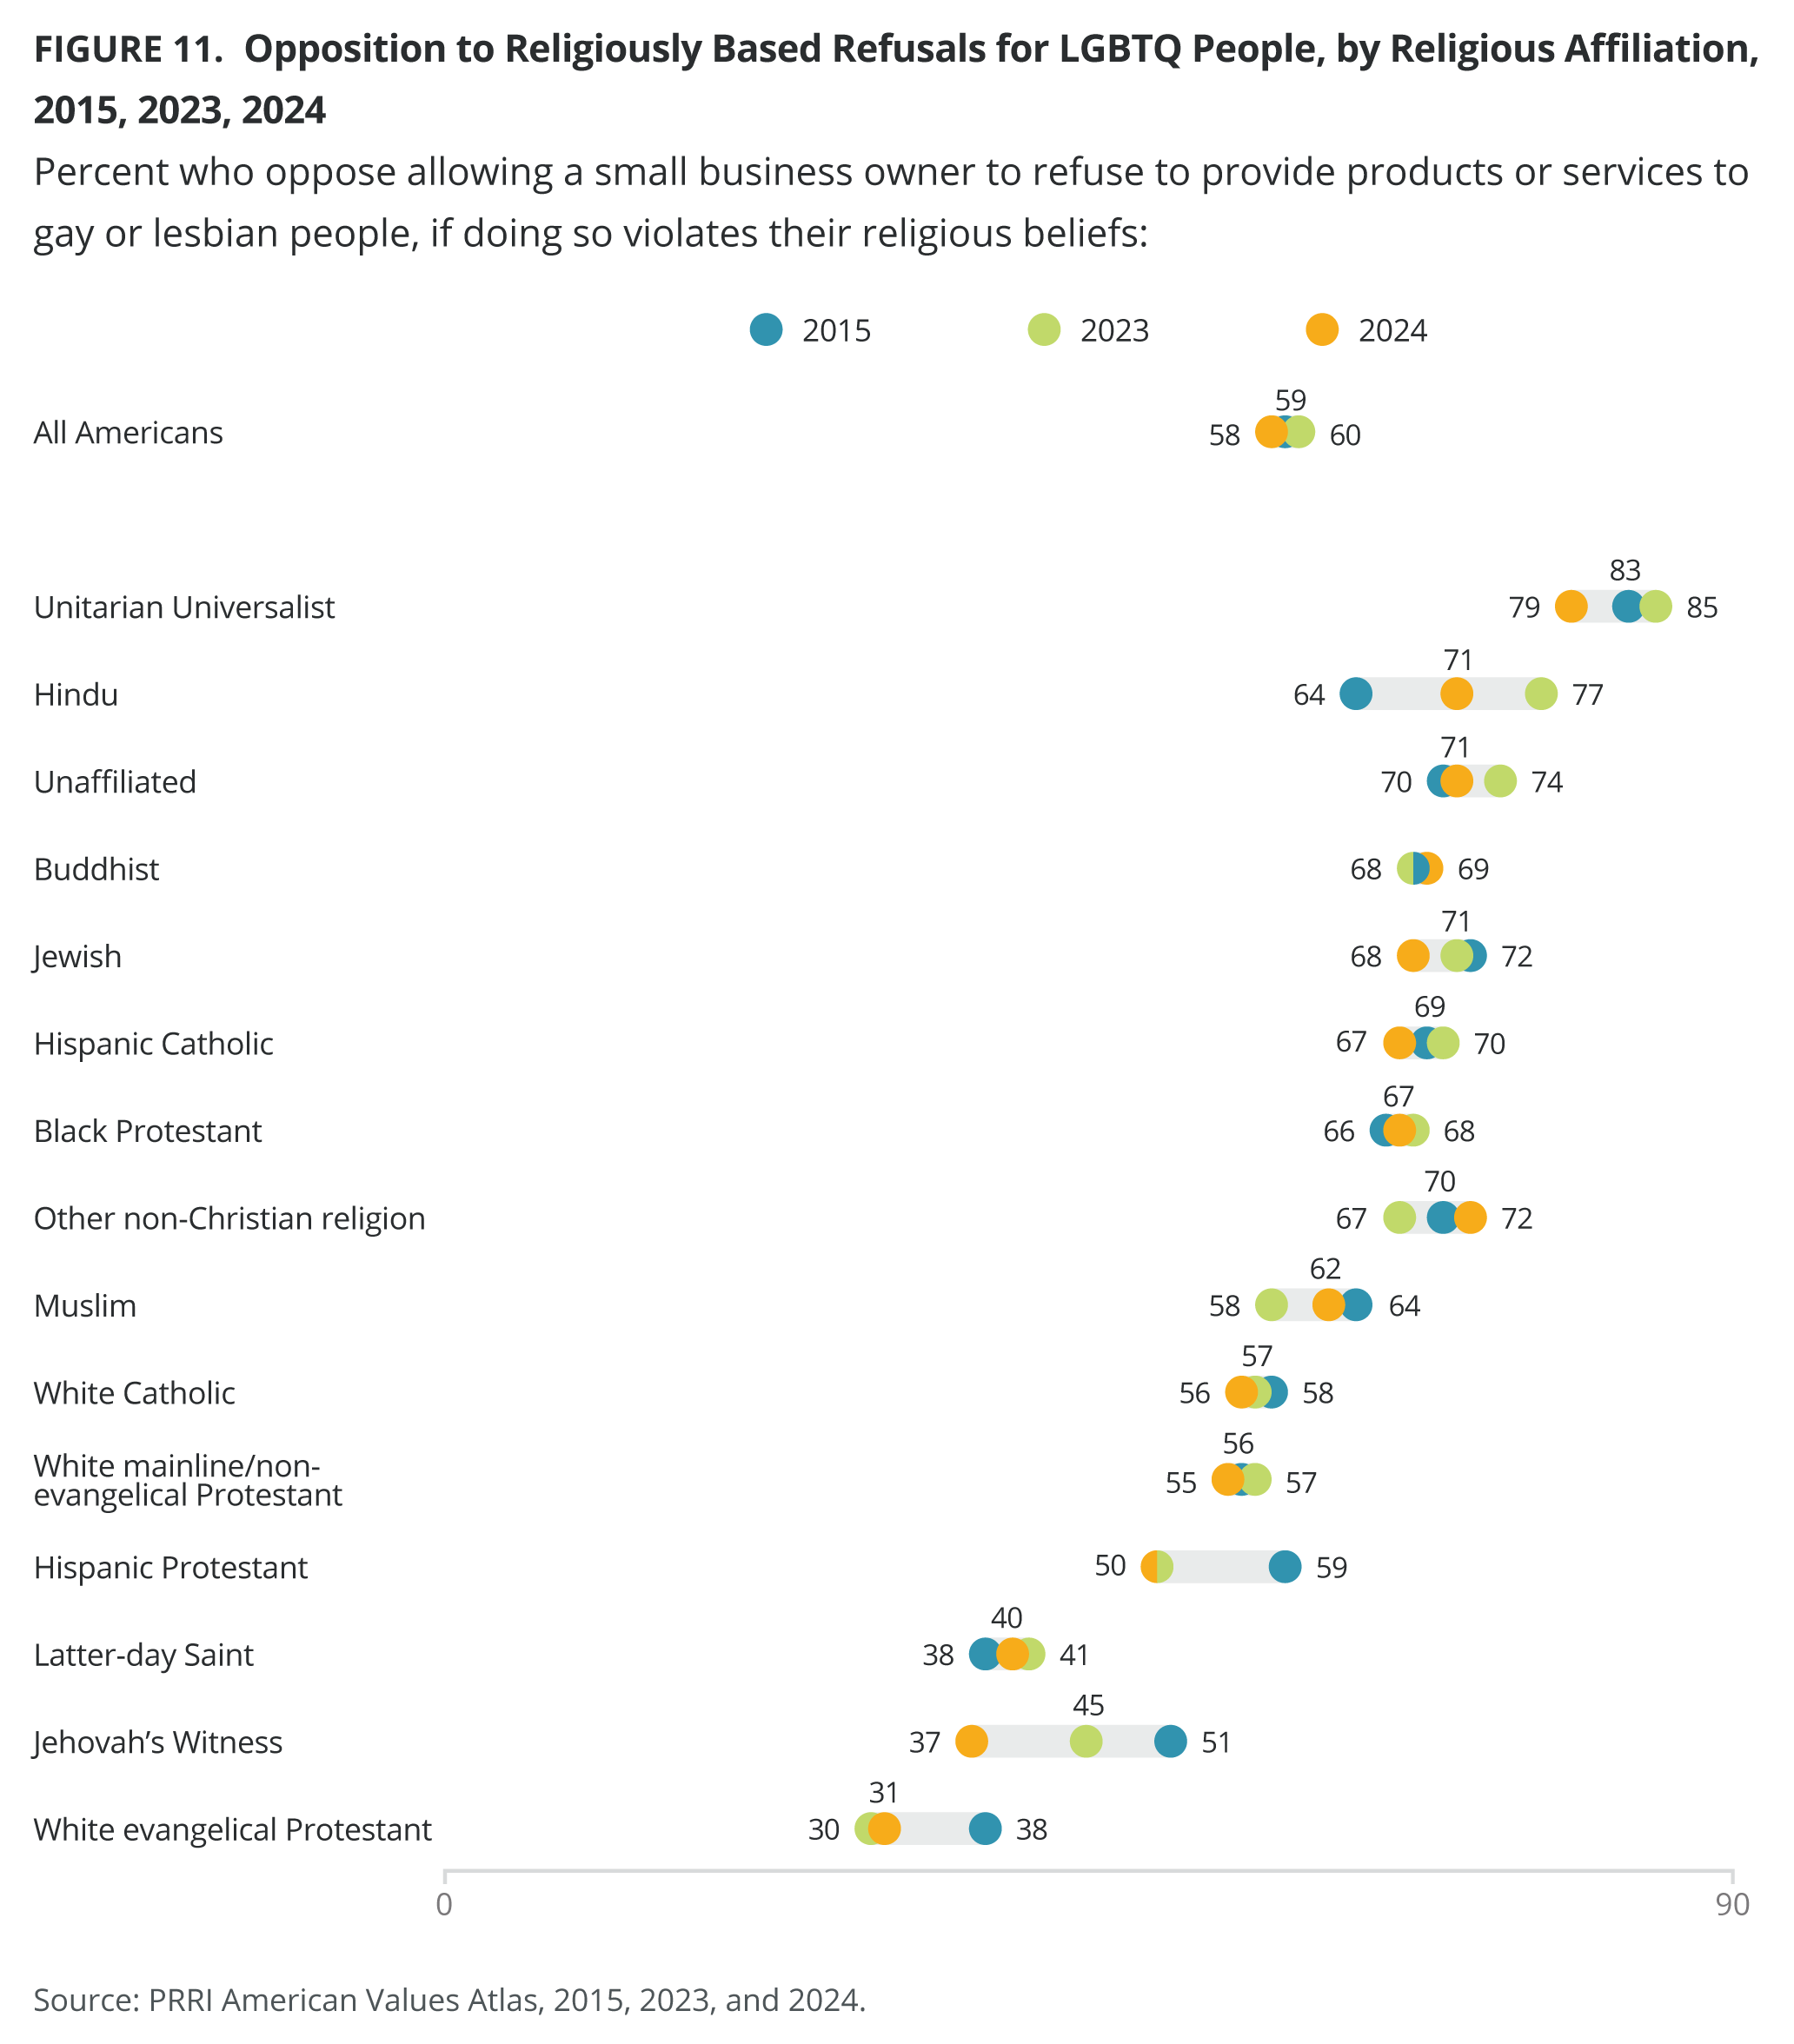
Religious Affiliation and Christian Nationalism
Opposition to religiously based service refusals has remained relatively stable among most religious groups from 2015 to 2024. Unitarian Universalists (79%), Hindus (71%), and the religiously unaffiliated (71%) remain among the most opposed to religiously based refusals, despite slight declines from 2023. Buddhists (69%), Jewish Americans (68%), Hispanic Catholics (67%), Black Protestants (67%), and Muslims (62%) have shown consistency in their opposition. White Catholics (56%) and white mainline/non-evangelical Protestants (55%) have also shown steady majority opposition. In contrast, Latter-day Saints (40%), Jehovah’s Witnesses (37%), and white evangelical Protestants (31%) show the lowest opposition, with the latter two groups showing declines from 51% and 38%, respectively, in 2015. Hispanic Protestants (50%) have also grown less likely to oppose religiously based refusals, down from 59% in 2015.
Christian nationalism Rejecters (82%) are significantly more likely to oppose religiously based service refusals than Skeptics (59%), Sympathizers (41%), and Adherents (33%).
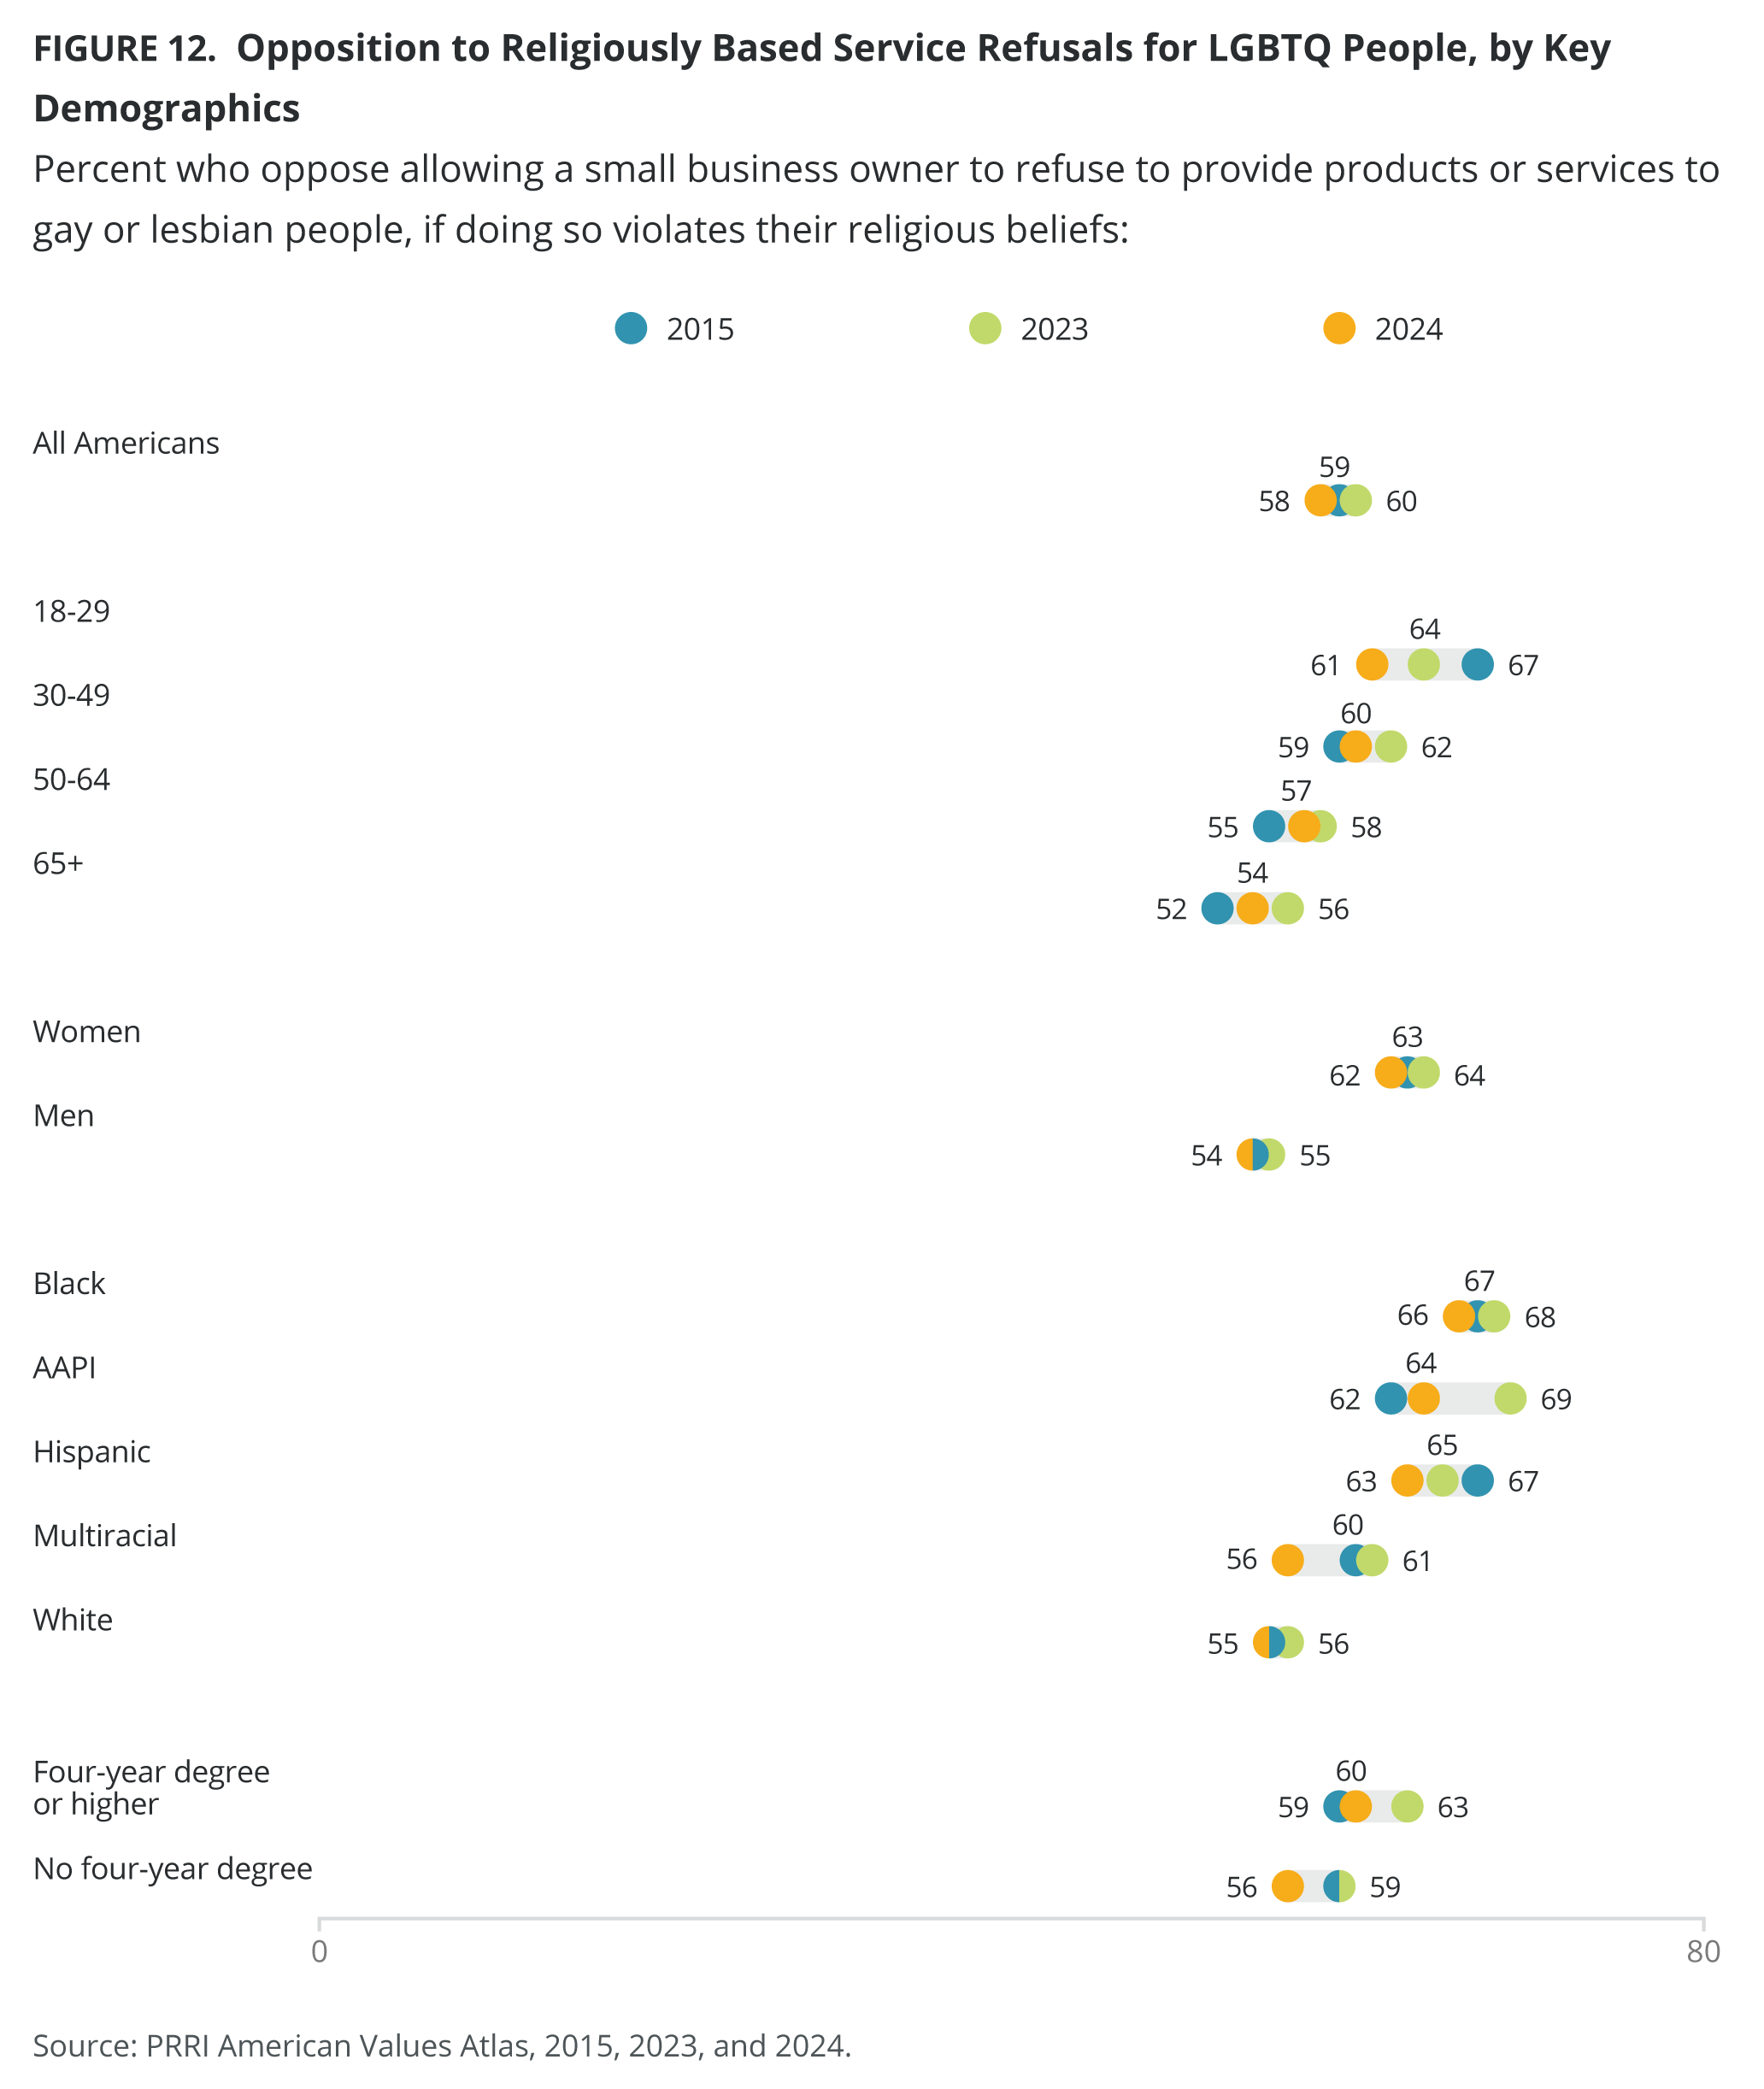
Demographics
Majorities of Americans of all generations oppose allowing religiously based service refusals, including 60% of Gen Zers, 61% of millennials, 57% of Gen Xers, 55% of baby boomers, and 52% of the Silent Generation. Young adults (18-29) have seen a gradual decline in opposition, from 67% in 2015 to 61% in 2024, while opposition among older age groups has remained consistent: Americans ages 30-49 (60%), Americans ages 50-64 (57%), and Americans ages 65 and older (54%).
Over the last decade, women (62%) are consistently more likely than men (54%) to oppose religiously based refusals. Similarly, Black (66%) and AAPI (64%) Americans report higher opposition than white Americans (55%), while opposition among Hispanic Americans has slightly decreased, from 67% in 2015 to 63% in 2024. Those with a four-year degree or higher (60%) maintain slightly higher opposition than those without (56%).
Opposition to Religiously Based Refusals in All 50 States
Residents of the District of Columbia (75%), Rhode Island (75%), Vermont (72%), Hawaii (70%), and Massachusetts (70%) have the strongest opposition to religiously based service refusals. By contrast, the five states with the lowest opposition to religiously based LGBTQ service refusals are Missouri (48%), West Virginia (48%), Idaho (44%), Tennessee (44%), and Oklahoma (43%). Rhode Island is the only state where opposition to religiously based refusals has increased since 2023, from 58% to 75%.
Support for Same-Sex Marriage
Two-thirds of Americans (67%) support allowing same-sex couples to marry legally, compared with 29% who oppose this policy. This reflects a 13-percentage-point increase in support since 2014, when a slim majority was in favor (54%).
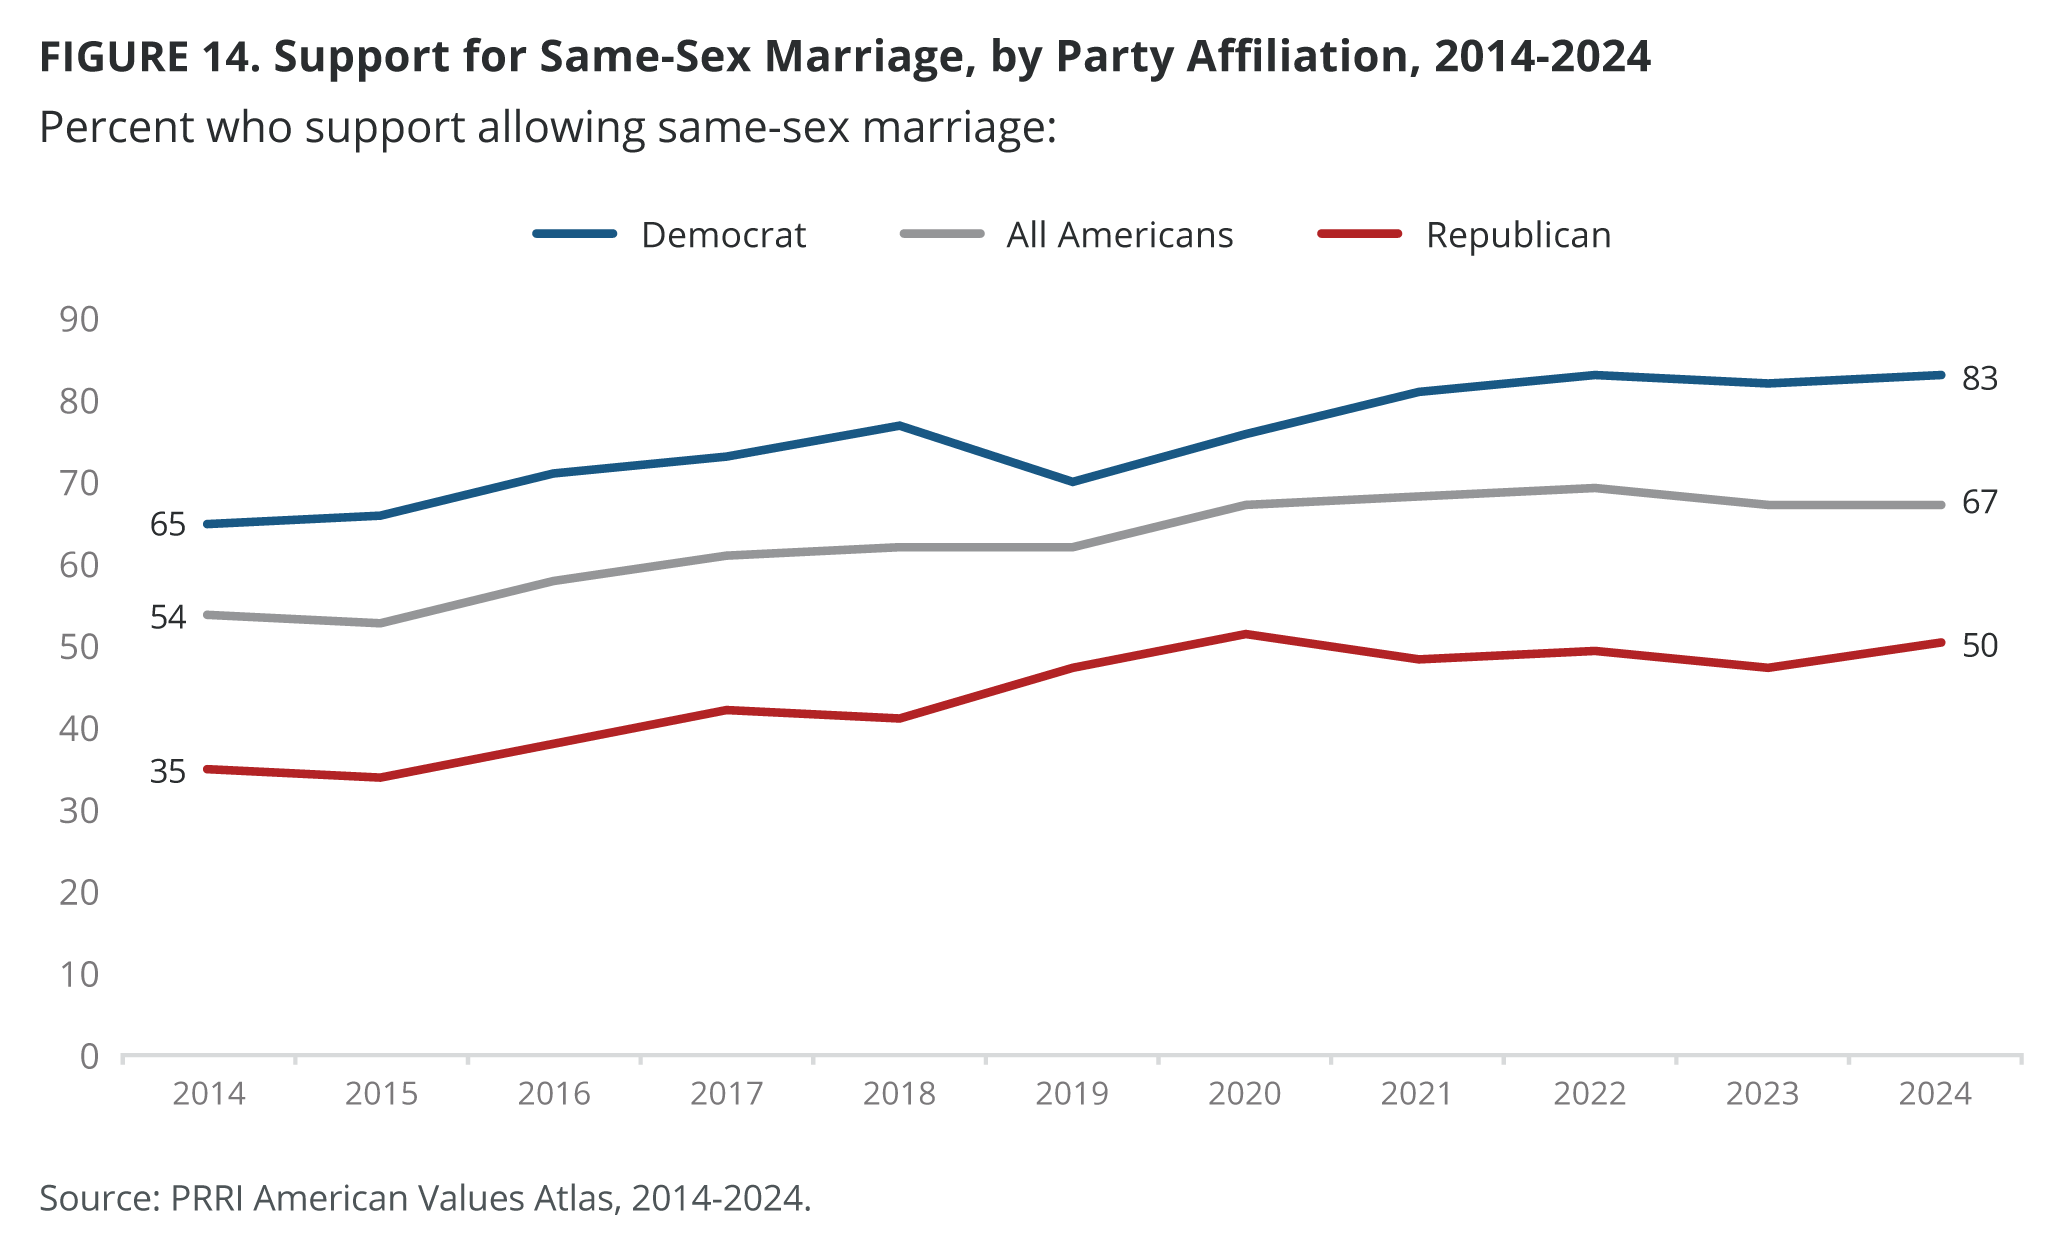
Party Affiliation
Over eight in ten Democrats (83%) support same-sex marriage, an 18-percentage-point increase from 65% in 2014. Similarly, over seven in ten independents (72%) also favor same-sex marriage, showing a similar 15-percentage-point increase from 58% in 2014. Although Republicans are notably less likely than Democrats and independents to support same-sex marriage, their support in 2024 (50%) has grown substantially compared with 2014 (35%).
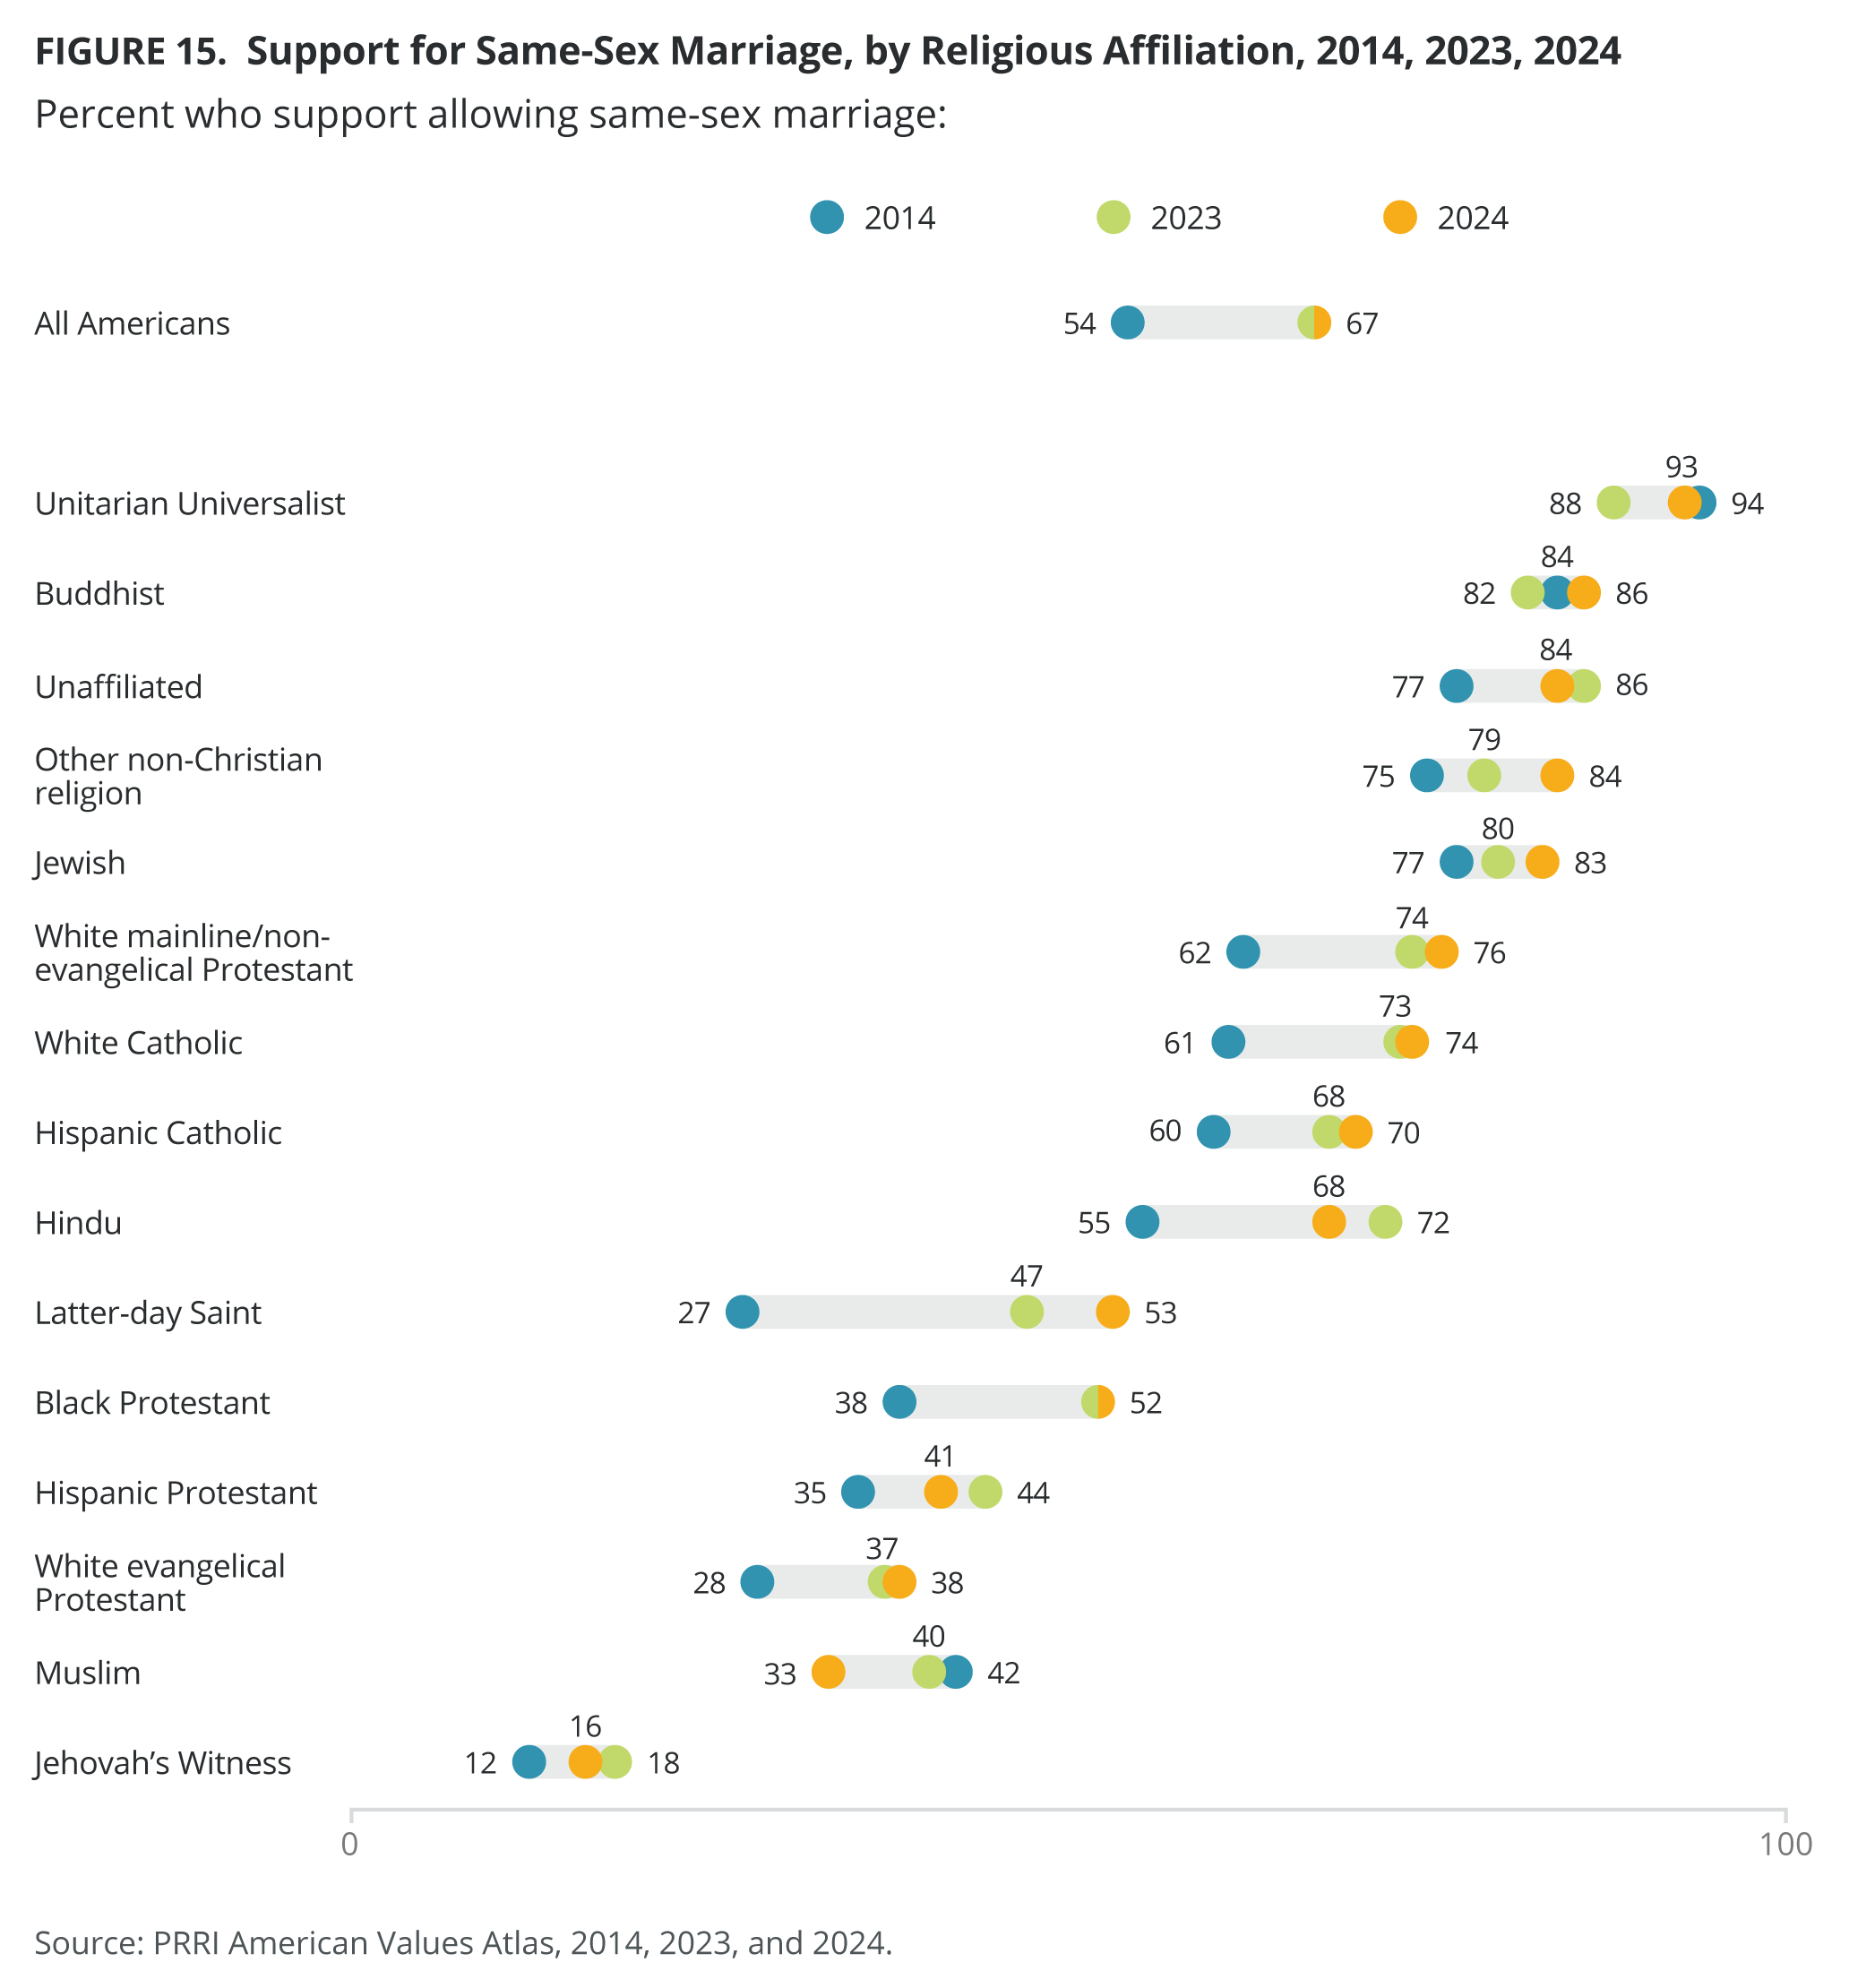
Religious Affiliation and Christian Nationalism
Most religious groups have shown substantial gains in support for same-sex marriage over time. Unitarian Universalists (93%), Buddhists (86%), the religiously unaffiliated (84%), and Jewish Americans (83%) are among the most supportive. White mainline Protestants (76%) and white Catholics (74%) have also increased their support since 2014. Support among Hispanic Catholics and Hindus has grown steadily over the past decade, from 60% to 70% and 55% to 68%, respectively. Latter-day Saints (53%) and Black Protestants (52%) have shown major gains but remain lower than the national average. In contrast, support for same-sex marriage among Hispanic Protestants (41%, up from 35% in 2014), white evangelical Protestants (38%, up from 28% in 2014), Muslims (33%, down from 42% in 2014), and Jehovah’s Witnesses (16%) remains relatively low.
Nearly all Christian nationalism Rejecters (92%) and three-fourths of Skeptics (74%) support same-sex marriage, compared with 46% of Sympathizers and 23% of Adherents.
Demographics
About six in ten or more Gen Zers (68%), millennials (71%), Gen Xers (65%), baby boomers (63%), and members of the Silent Generation (58%) favor same-sex marriage. Younger Americans remain the most supportive, with 68% of Americans ages 18-29 and 70% of those ages 30-49 in favor. Support has steadily grown across older age groups, with majorities of Americans ages 50-64 (64%) and senior Americans (62%) now in favor, compared with a plurality in 2014 (48% and 39%, respectively).
Women (67%) and men (66%) show similar levels of support for same-sex marriage, both reflecting notable increases from 57% and 50%, respectively, in 2014. Multiracial (73%), AAPI (71%), and white (70%) Americans exhibit the highest support, followed by Hispanic Americans (63%) and Black Americans (54%). Support has increased significantly across all racial groups since 2014.
Support for same-sex marriage is higher among those with at least a four-year degree (76%). However, support among those without a college degree (61%) has increased by 11 percentage points, from 50% in 2014.
Support for Same-Sex Marriage in All 50 States
Solid majorities in every state and the District of Columbia now back same-sex marriage, with the highest support in Massachusetts (87%), Vermont (86%), and the District of Columbia (82%). In contrast, states with the least support include Oklahoma (50%), West Virginia (51%), Louisiana (52%), South Carolina (54%), and Tennessee (54%).
Americans who live in states where same-sex marriage would continue to be legal if the Supreme Court’s 2015 Obergefell v. Hodges decision were overturned (73%) are 10 percentage points more likely to favor marriage equality than those who live in states where same-sex marriage would no longer be legal (63%).[5]
Views on Transgender Policies
Opposition to Laws Restricting Gender-Affirming Medical Care for Minors
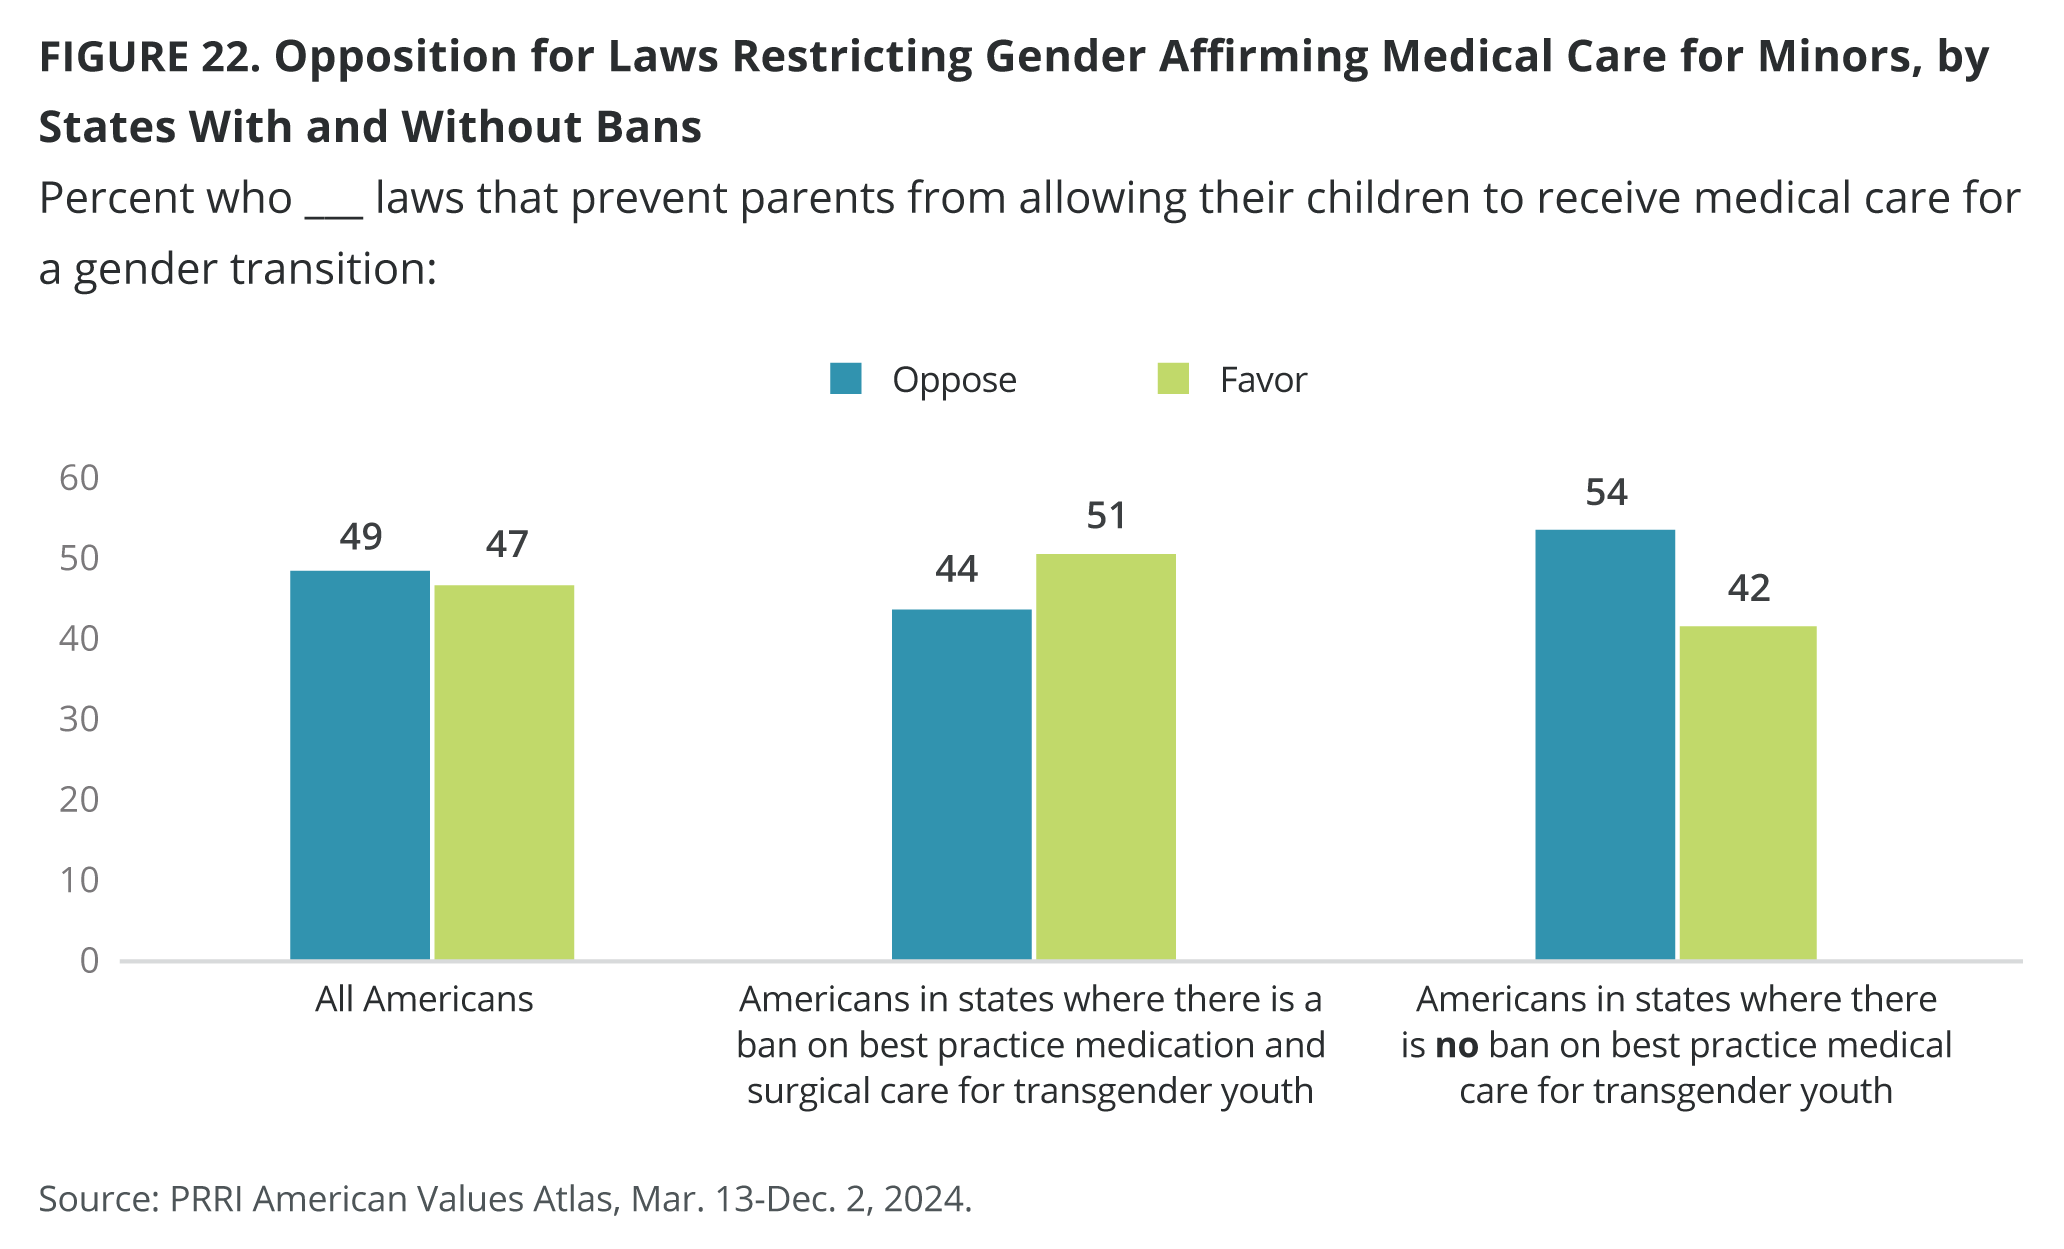
Americans are evenly split on their views toward laws that would prevent parents from allowing their child to receive medical care for a gender transition (49% oppose vs. 47% in favor). Opposition to these laws has declined by 4 percentage points among Americans (53%) since 2022, when the question was first asked.
Party Affiliation
Most Democrats (70%) oppose laws that would prevent parents from allowing their child to receive medical care for a gender transition while independents (49%) mirror the national average and Republicans (30%) are significantly less likely to oppose these laws. Opposition to these laws has decreased among Democrats (75%) and Republicans (36%) since 2022 but has remained steady among independents (50%).
Religious Affiliation and Christian Nationalism
Seven in ten Unitarian Universalists (69%) and six in ten Jewish Americans (63%), religiously unaffiliated (62%), Hindus (59%), members of other non-Christian religions (58%), and Buddhists (57%) oppose laws that prevent parents from allowing their child to receive medical care for a gender transition. Similarly, around half of Hispanic Catholics (54%), Black Protestants (52%), and white Catholics (47%) oppose these laws. A plurality of white mainline/non-evangelical Protestants (45%) and Hispanic Protestants (44%) oppose laws that prevent parents from allowing their child to receive medical care for a gender transition. Muslim Americans (37%), Jehovah’s Witnesses (35%), white evangelical Protestants (31%), and Latter-day Saints (30%) are the least likely to oppose laws that would prevent parents from allowing medical care for a gender transition for their children.
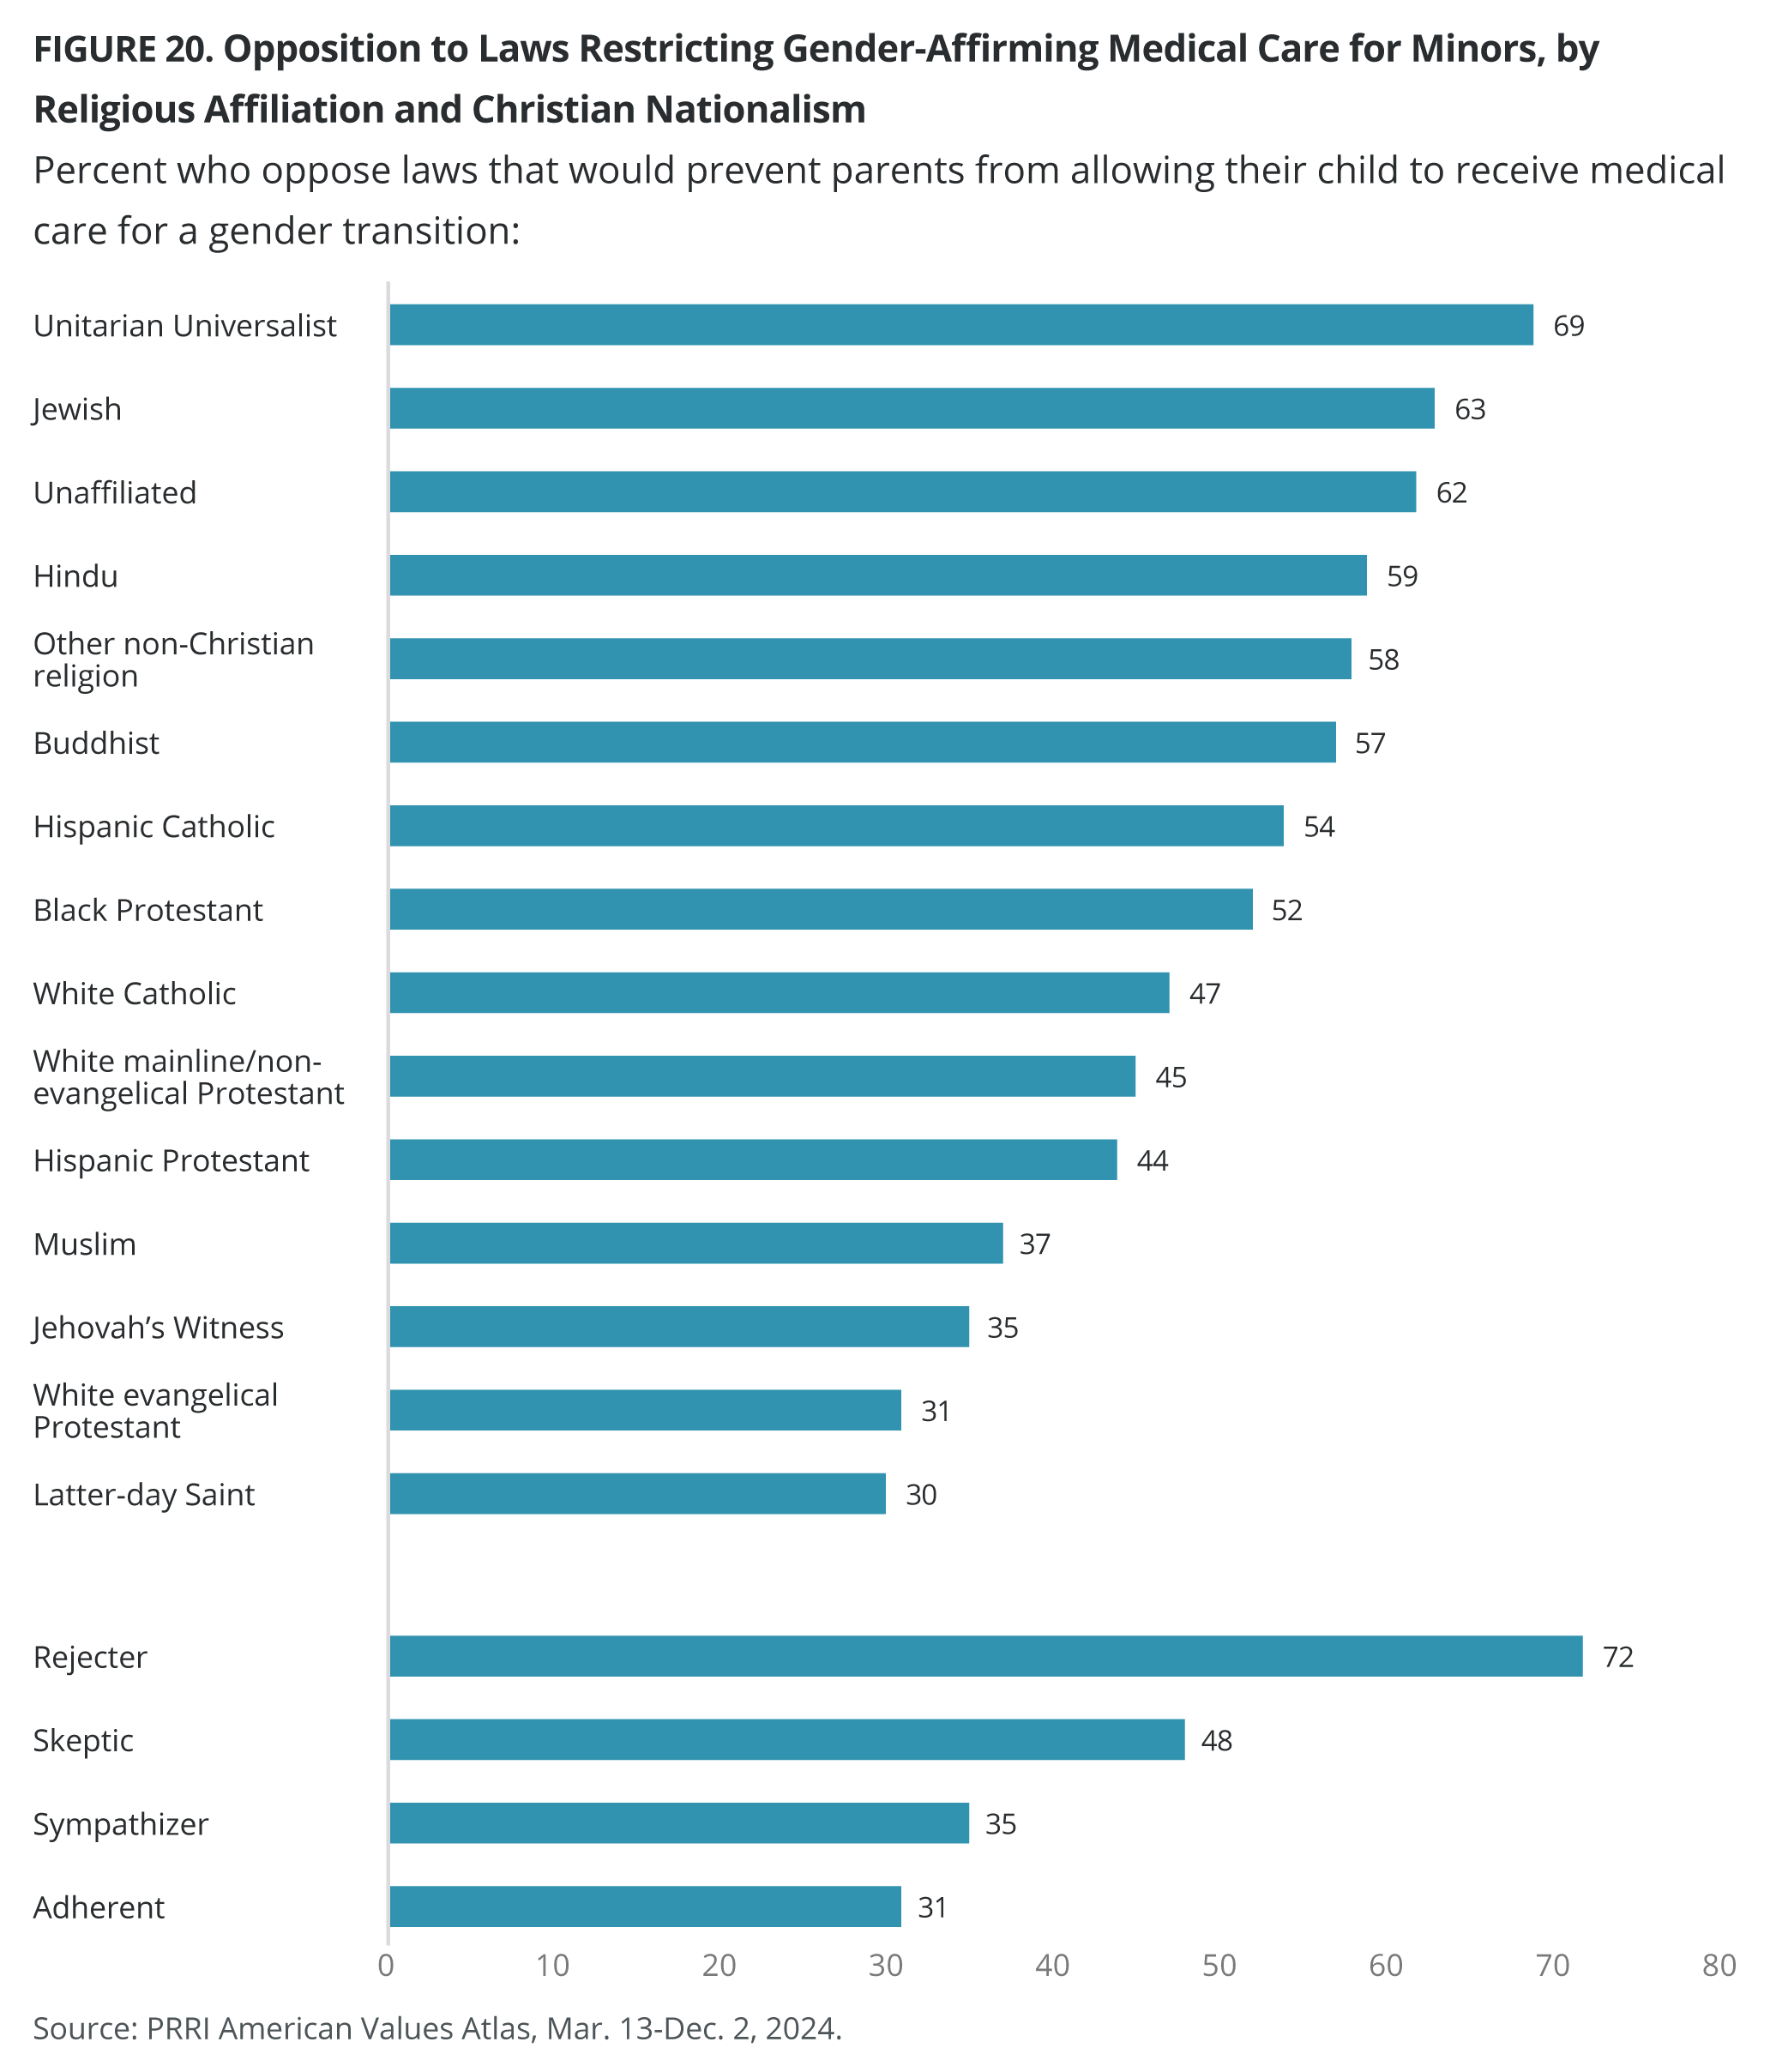
Christian nationalism Rejecters (72%) are significantly more likely to oppose laws that stop parents from allowing their children to receive medical care for a gender transition than Skeptics (48%), Sympathizers (35%), and Adherents (31%).
Demographics
Except for members of the Silent Generation (58% oppose, 38% favor), Americans across most generations are evenly split on their views about laws that prevent gender-affirming medical care for minors: Gen Zers (49% oppose, 46% favor), millennials (48% oppose, 48% favor), Gen Xers (47% oppose, 49% favor), baby boomers (51% oppose, 44% favor). The same trend emerges among all age groups.
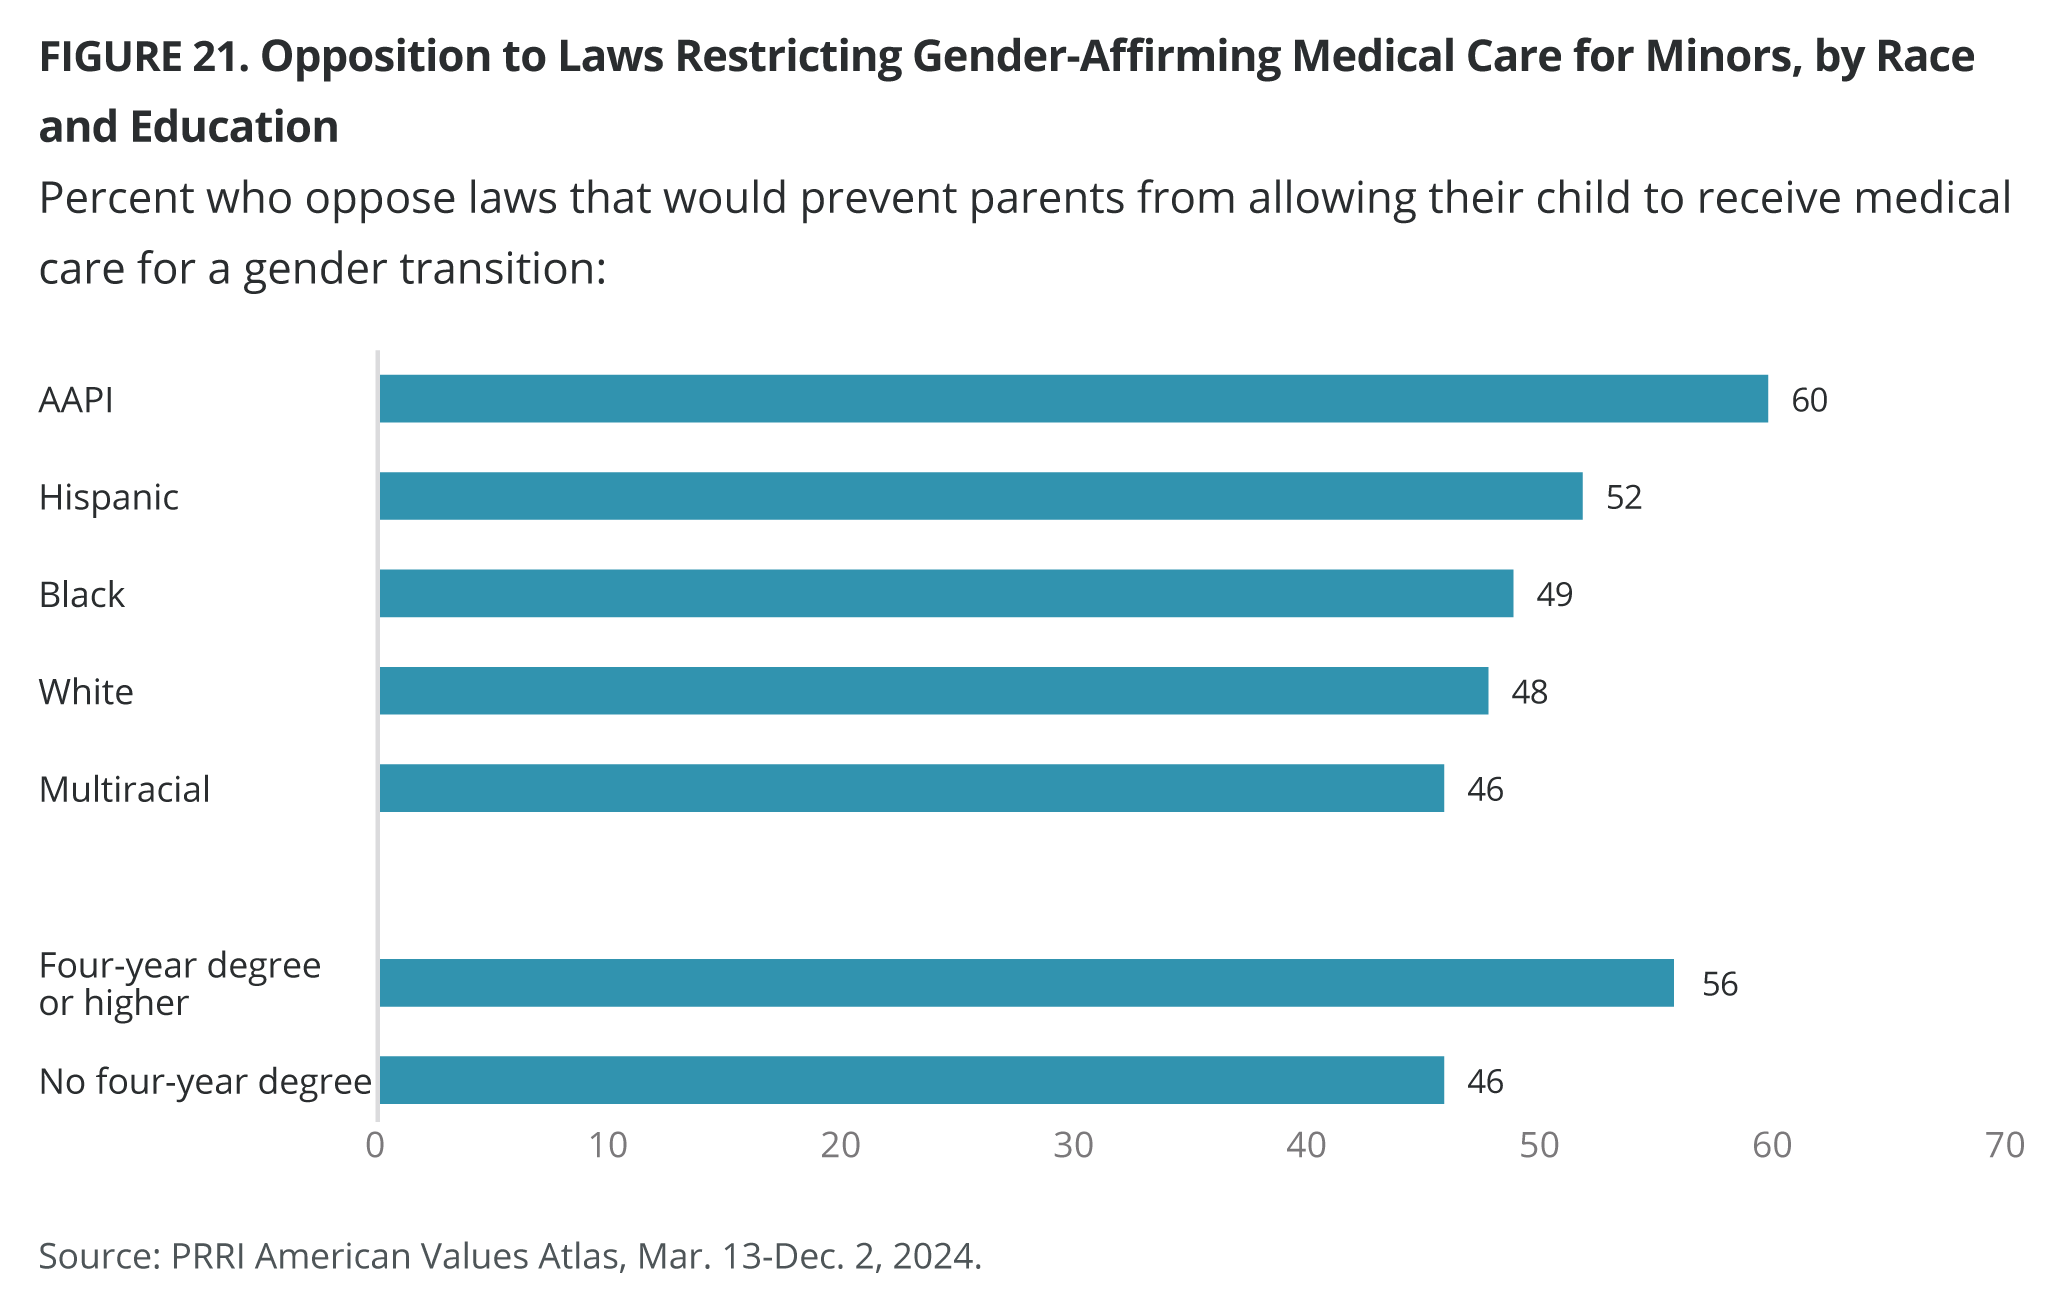
Six in ten Asian Americans and Pacific Islanders (60%) and around half of Hispanic (52%), Black (49%), white (48%), and multiracial (46%) Americans oppose laws that prevent parents from allowing their children to receive medical care for a gender transition.
While there are no differences by gender, Americans who have at least a four-year degree (56%) are more likely than Americans without a four-year degree (46%) to oppose these laws.
Opposition to Laws Restricting Gender-Affirming Medical Care for Minors in All 50 States
Residents in the District of Columbia (72%), Massachusetts (65%), Rhode Island (62%), Vermont (61%), and Oregon (59%) show the highest levels of opposition to laws restricting parents from allowing their children to receive gender-affirming medical care. Further, Americans who live in states without bans on medical care for transgender youth (54%) are more likely to oppose laws that prevent parents from allowing their children to receive medical care for a gender transition than those in states where such bans are in place (44%).[6]
Opposition to Government IDs Displaying Sex at Birth Rather Than Gender Identity
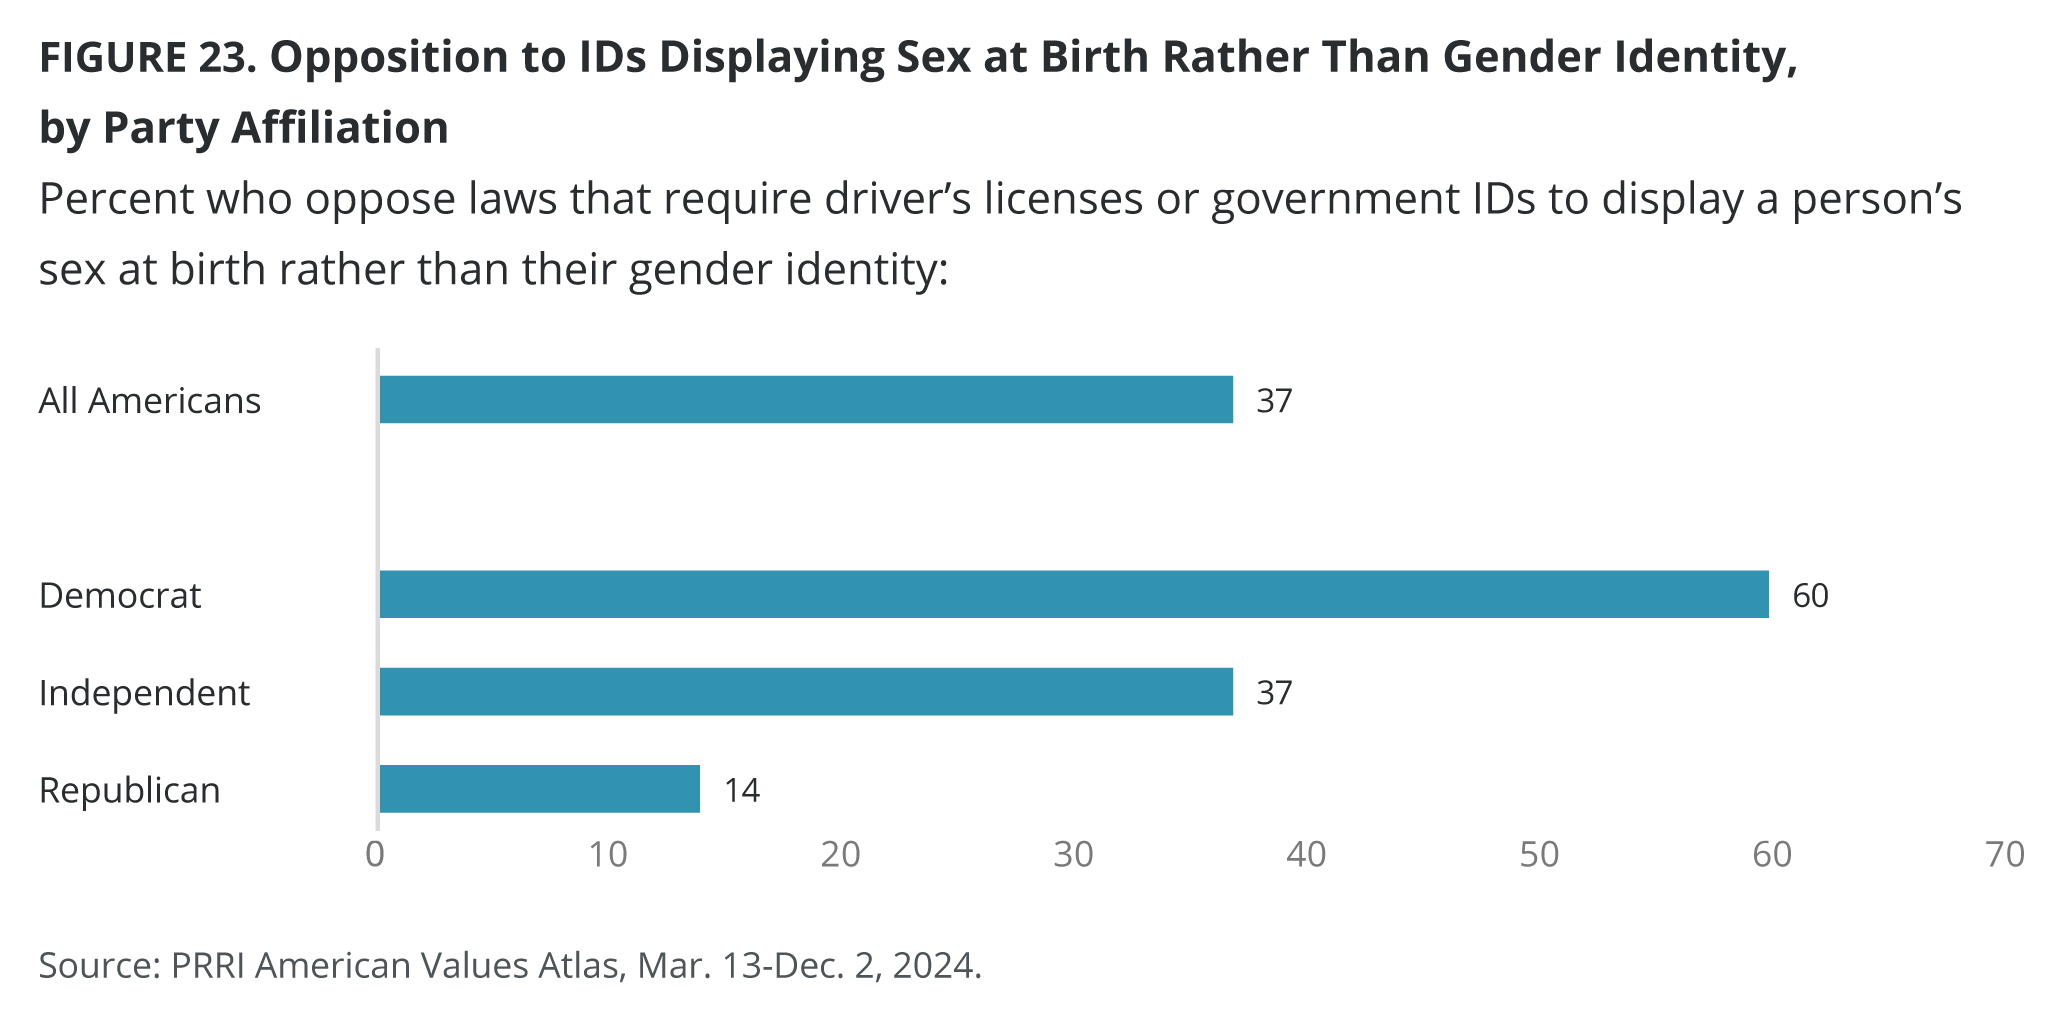
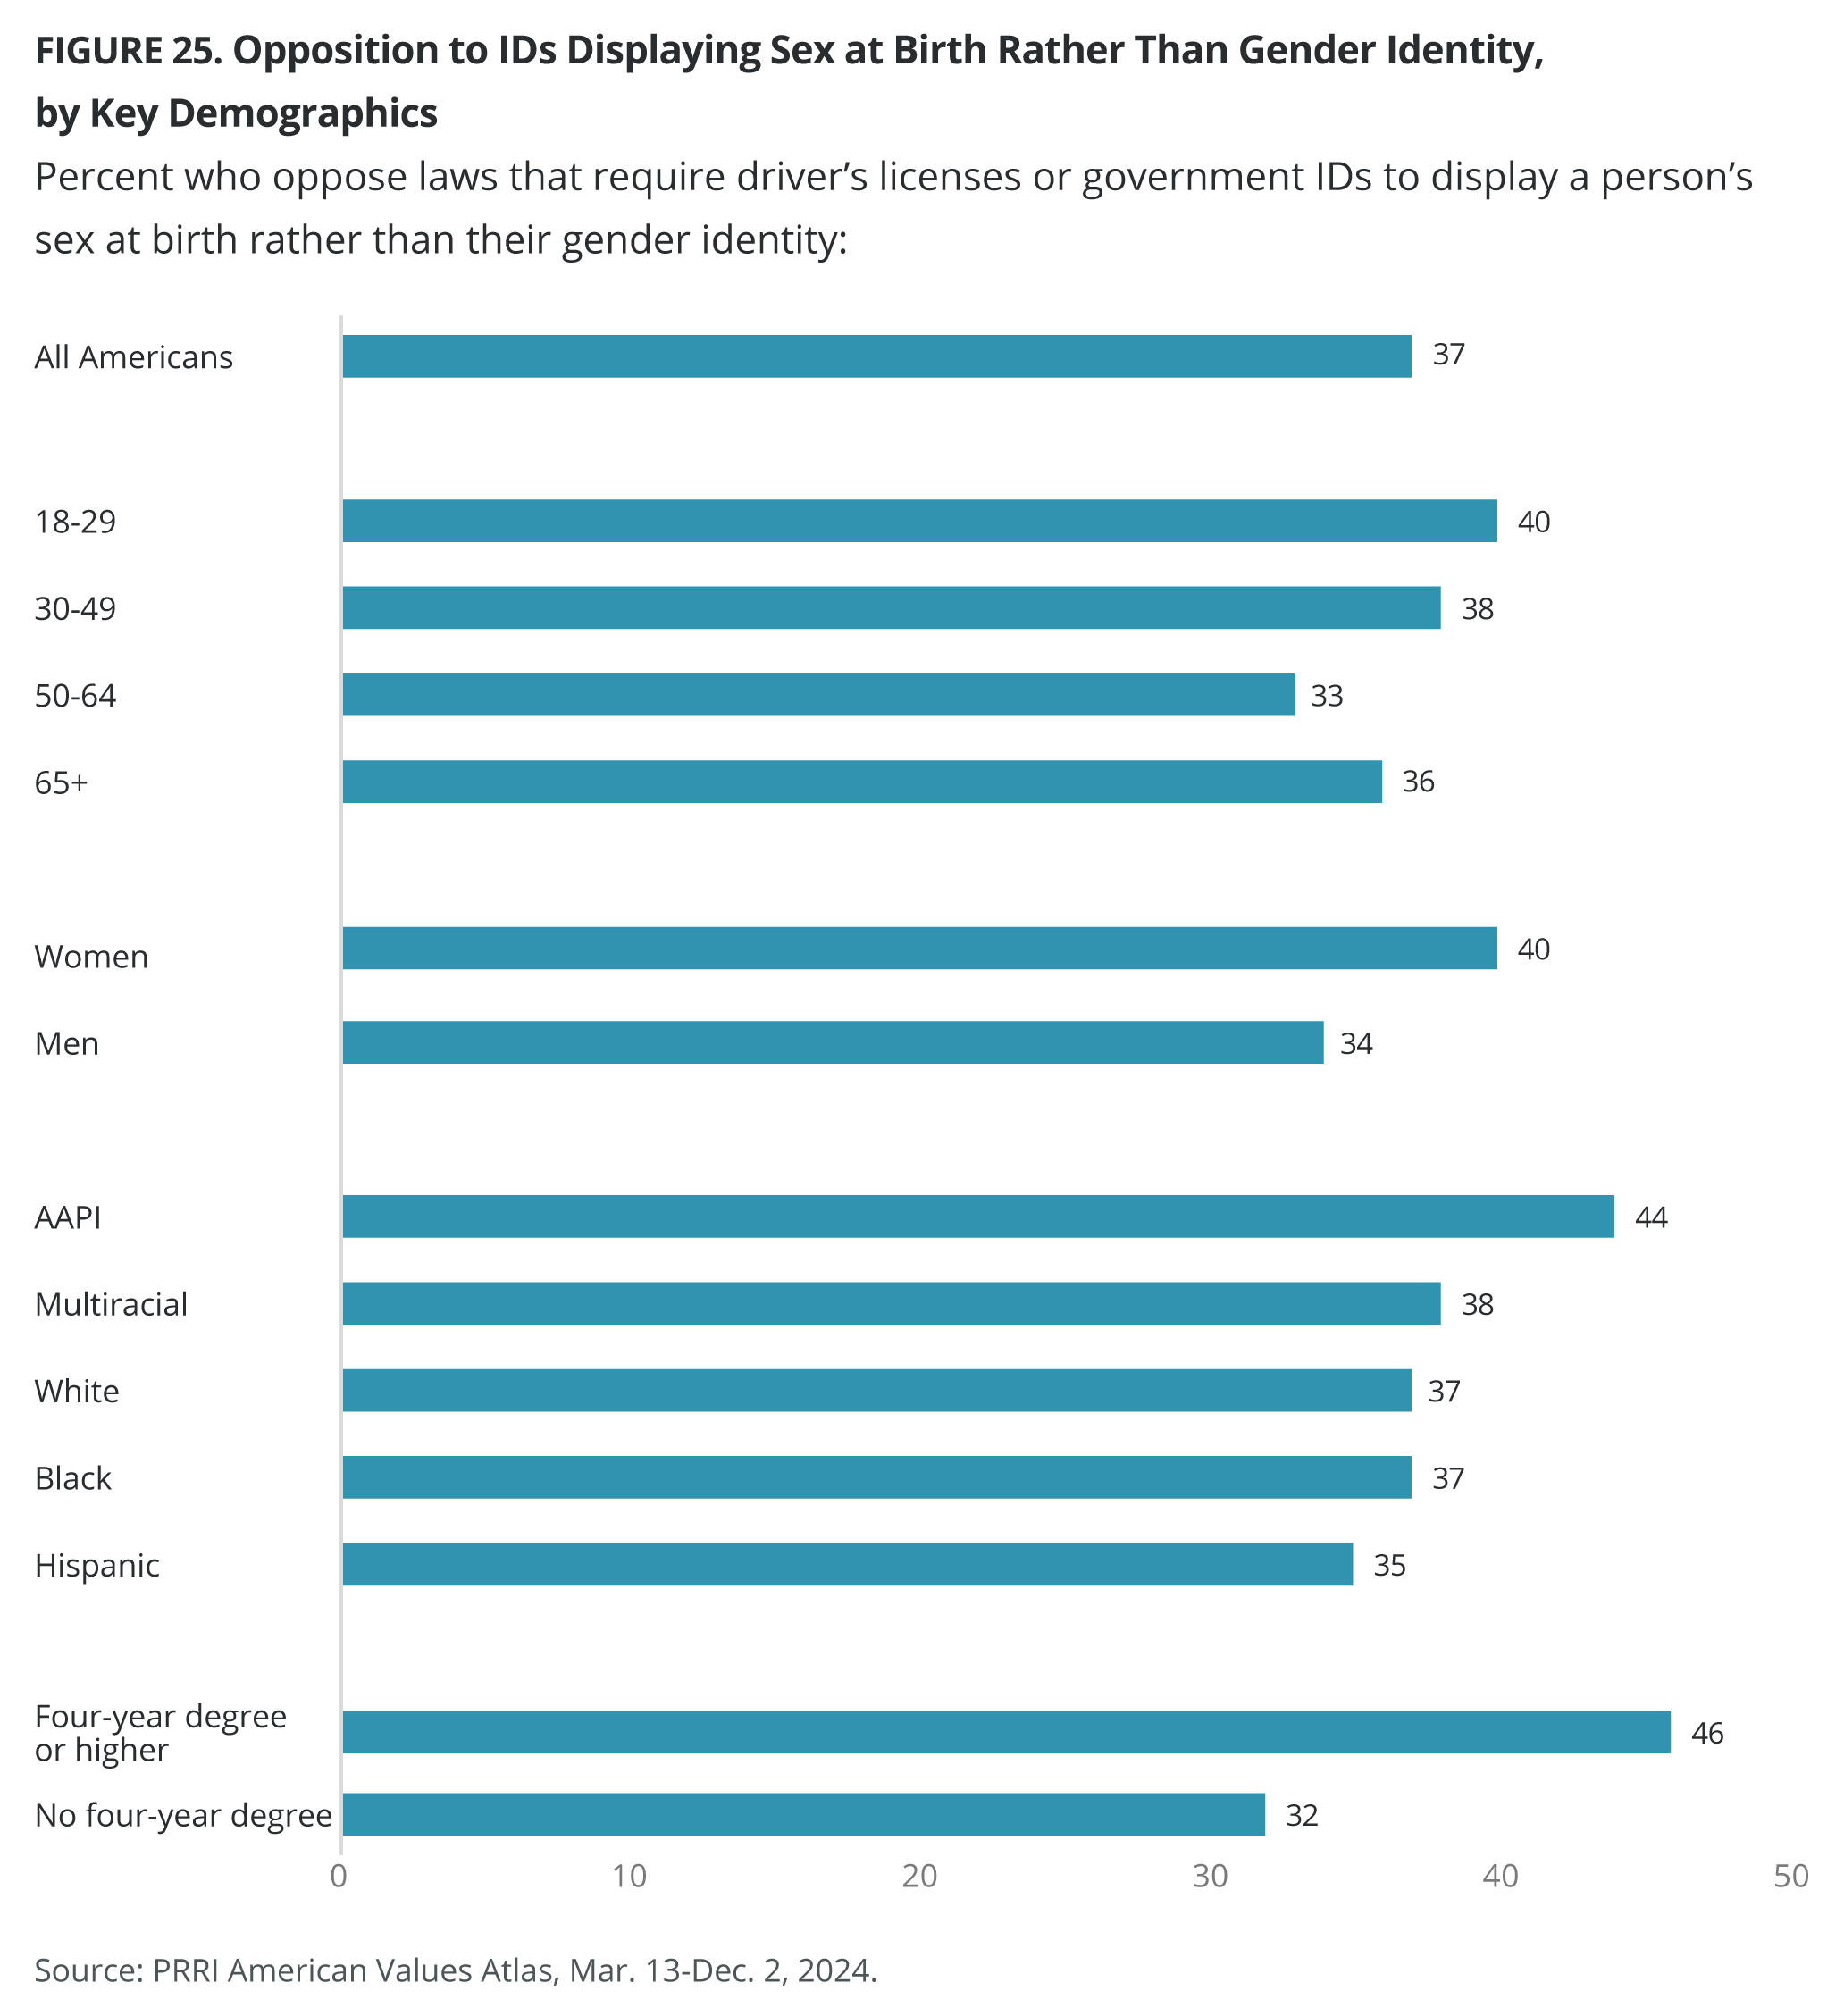
Roughly four in ten Americans (37%) oppose laws that require driver’s licenses or government IDs to display a person’s sex at birth rather than their gender identity.
Party Affiliation
Democrats (60%) are more than four times as likely as Republicans (14%) to oppose laws that require driver’s licenses and government IDs to show a person’s sex at birth rather than their gender identity, while independents fall in the middle (37%).
Religious Affiliation and Christian Nationalism
Unitarian Universalists (66%), religiously unaffiliated Americans (54%), and Jewish Americans (50%) are the most likely to oppose laws that require showing a person’s sex at birth on their license or ID, followed by moderate opposition among Buddhists (45%), Hindus (39%), white mainline/non-evangelical Protestants (35%), Black Protestants (35%), Muslims (34%), white Catholics (33%), Hispanic Catholics (32%), and Hispanic Protestants (29%). Opposition is lower among Latter-day Saints (25%) and Jehovah’s Witnesses (24%). White evangelical Protestants (15%) are the least likely to oppose these laws.
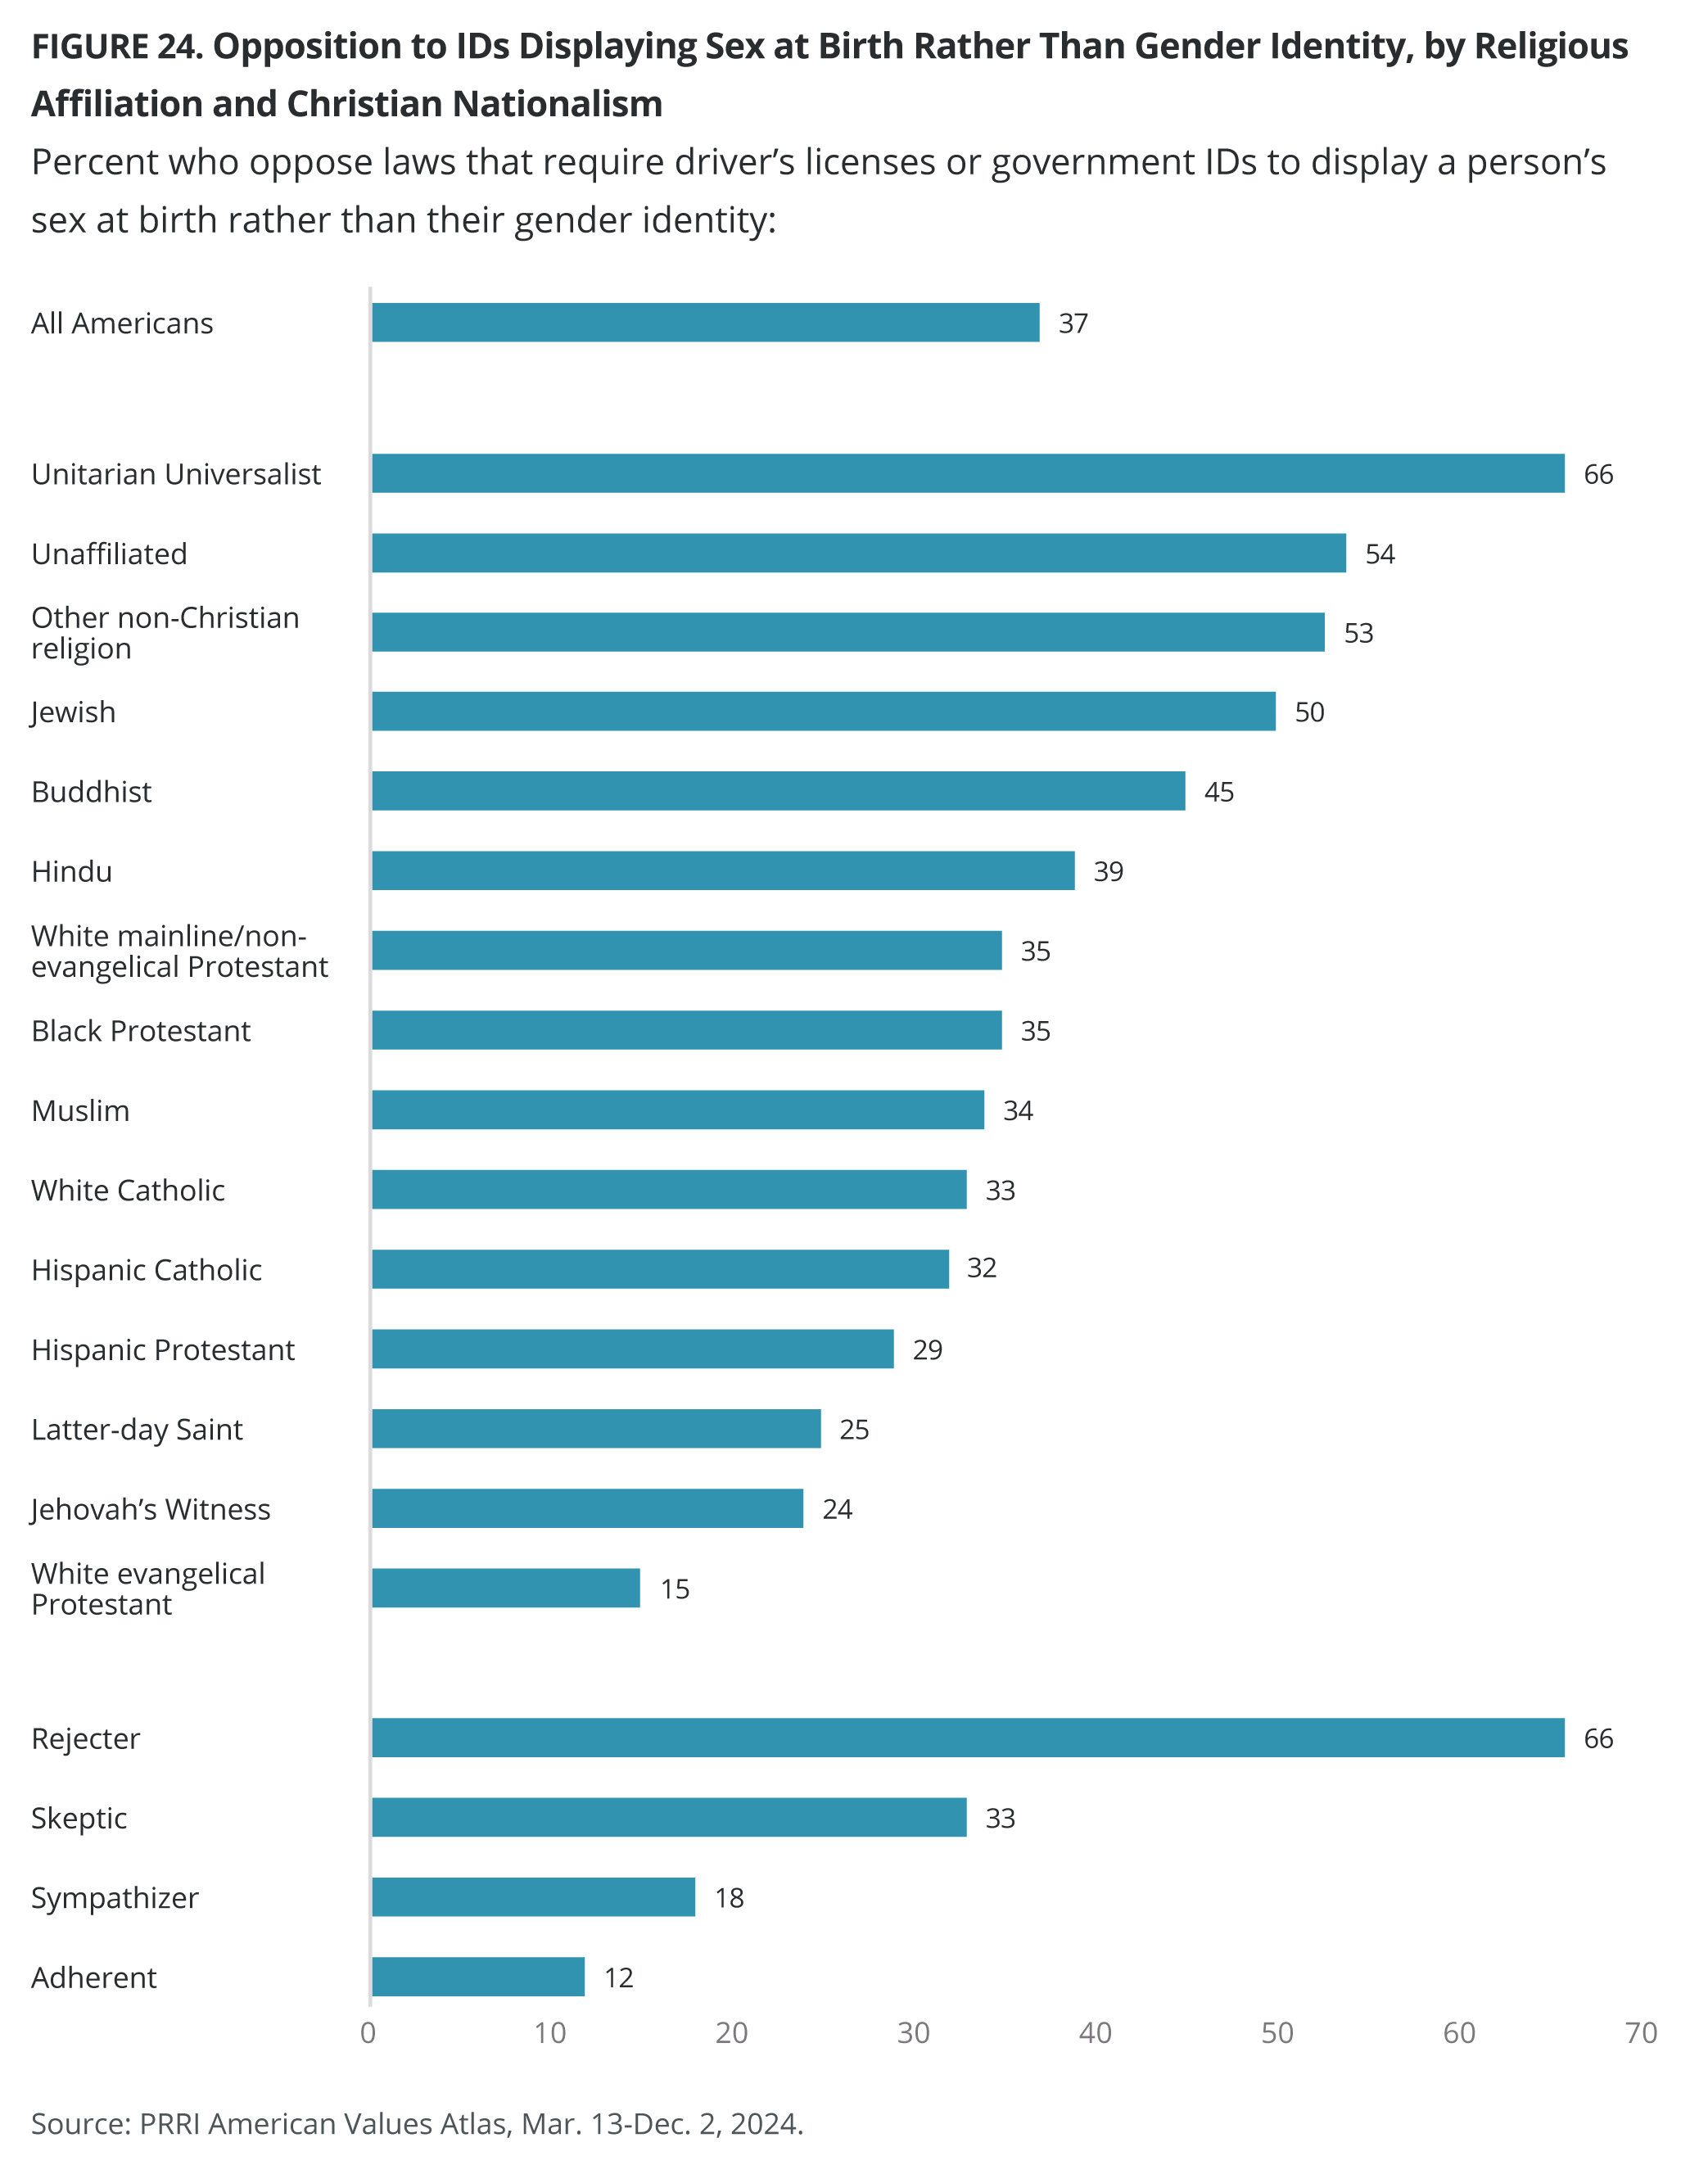
Two-thirds of Christian nationalism Rejecters (66%) oppose laws that require a person’s sex at birth to be shown on their IDs, compared with 33% of Skeptics, 18% of Sympathizers, and 12% of Adherents. The vast majority of Christian nationalism Adherents (86%) support these laws.
Demographics
A plurality of Americans across all generations opposes laws that require driver’s licenses or government IDs to display a person’s sex at birth rather than their current gender identity: Gen Zers (40%), millennials (40%), Gen Xers (34%), baby boomers (35%), and the Silent Generation (37%). The same trends emerge across all age groups.
Asian Americans and Pacific Islanders show the highest opposition at 44%, followed by multiracial (38%), white (37%), Black (37%), and Hispanic (35%) Americans. Women are more likely than men to oppose these laws (40% vs. 34%).
Americans with a four-year degree or higher are notably more likely than those without a four-year degree to oppose laws that require IDs to show a person’s sex at birth and not their gender identity (46% vs. 32%).
Opposition to Government IDs Displaying Sex at Birth Rather Than Gender Identity in All 50 States
In Vermont (60%), the District of Columbia (59%), and Massachusetts (53%), a majority opposes laws requiring identification to display a person’s sex at birth rather than their gender identity. In these places, residents can update their gender marker on their driver’s license or ID and have the option to select a third gender marker (X) alongside male (M) and female (F). An additional 20 states also offer this third gender marker option.[7]
Most states allow residents to change the gender marker on their licenses, though requirements vary. Only four states — Kansas (36%), Texas (33%), Florida (31%), and Tennessee (28%) — prohibit gender marker changes, yet opposition to laws requiring IDs to display sex at birth is not the lowest in these states. The states with the lowest opposition to such laws are Mississippi (24%) and West Virginia (23%).[8]
APPENDIX A. Methodology for Measuring LGBTQ Identity
Measuring Gender Identity
What sex were you assigned at birth on your original birth certificate? Select one answer only.
- Male
- Female
What is your current gender identity? Select all answers that apply.
- Male
- Female
- Transgender
- Non-binary
- A different identity, please specify [O]
How we create gender identity variable:
We first count the number of responses to the current gender identity question. If it is only 1 and that 1 response matches the sex at birth, they are considered cisgender. To be considered transgender, they must respond either with the gender that is opposite their sex at birth, the transgender response alone, or the transgender response in combination with the gender opposite their sex at birth. If they also pick non-binary, or a different identity, they are grouped into the transgender category. If someone picks non-binary alone or along with male or female they are grouped into transgender/non-binary category. If they pick a different identity, they are also grouped in the transgender/non-binary category.
Measuring Sexual Orientation:
Which of the following best describes how you think of yourself? Select one answer only.
- Gay or lesbian
- Straight, that is, not gay
- Bisexual
- Something else
How we create LGBTQ identity variable:
We code “Gay or lesbian,” “bisexual,” and “something else” responses into 1 and “straight, that is, not gay” into 0. Then we combine this variable with our gender identity variable and code into 1 those who identify as “transgender/non-binary/something else” AND “gay or lesbian/ bisexual/something else” and code as 0 “cisgender males and females” who identify as “straight.” We also code those who identify as “transgender/non-binary/something else” AND “straight” as 1, our LGBTQ identity category.
APPENDIX B. Survey Methodology
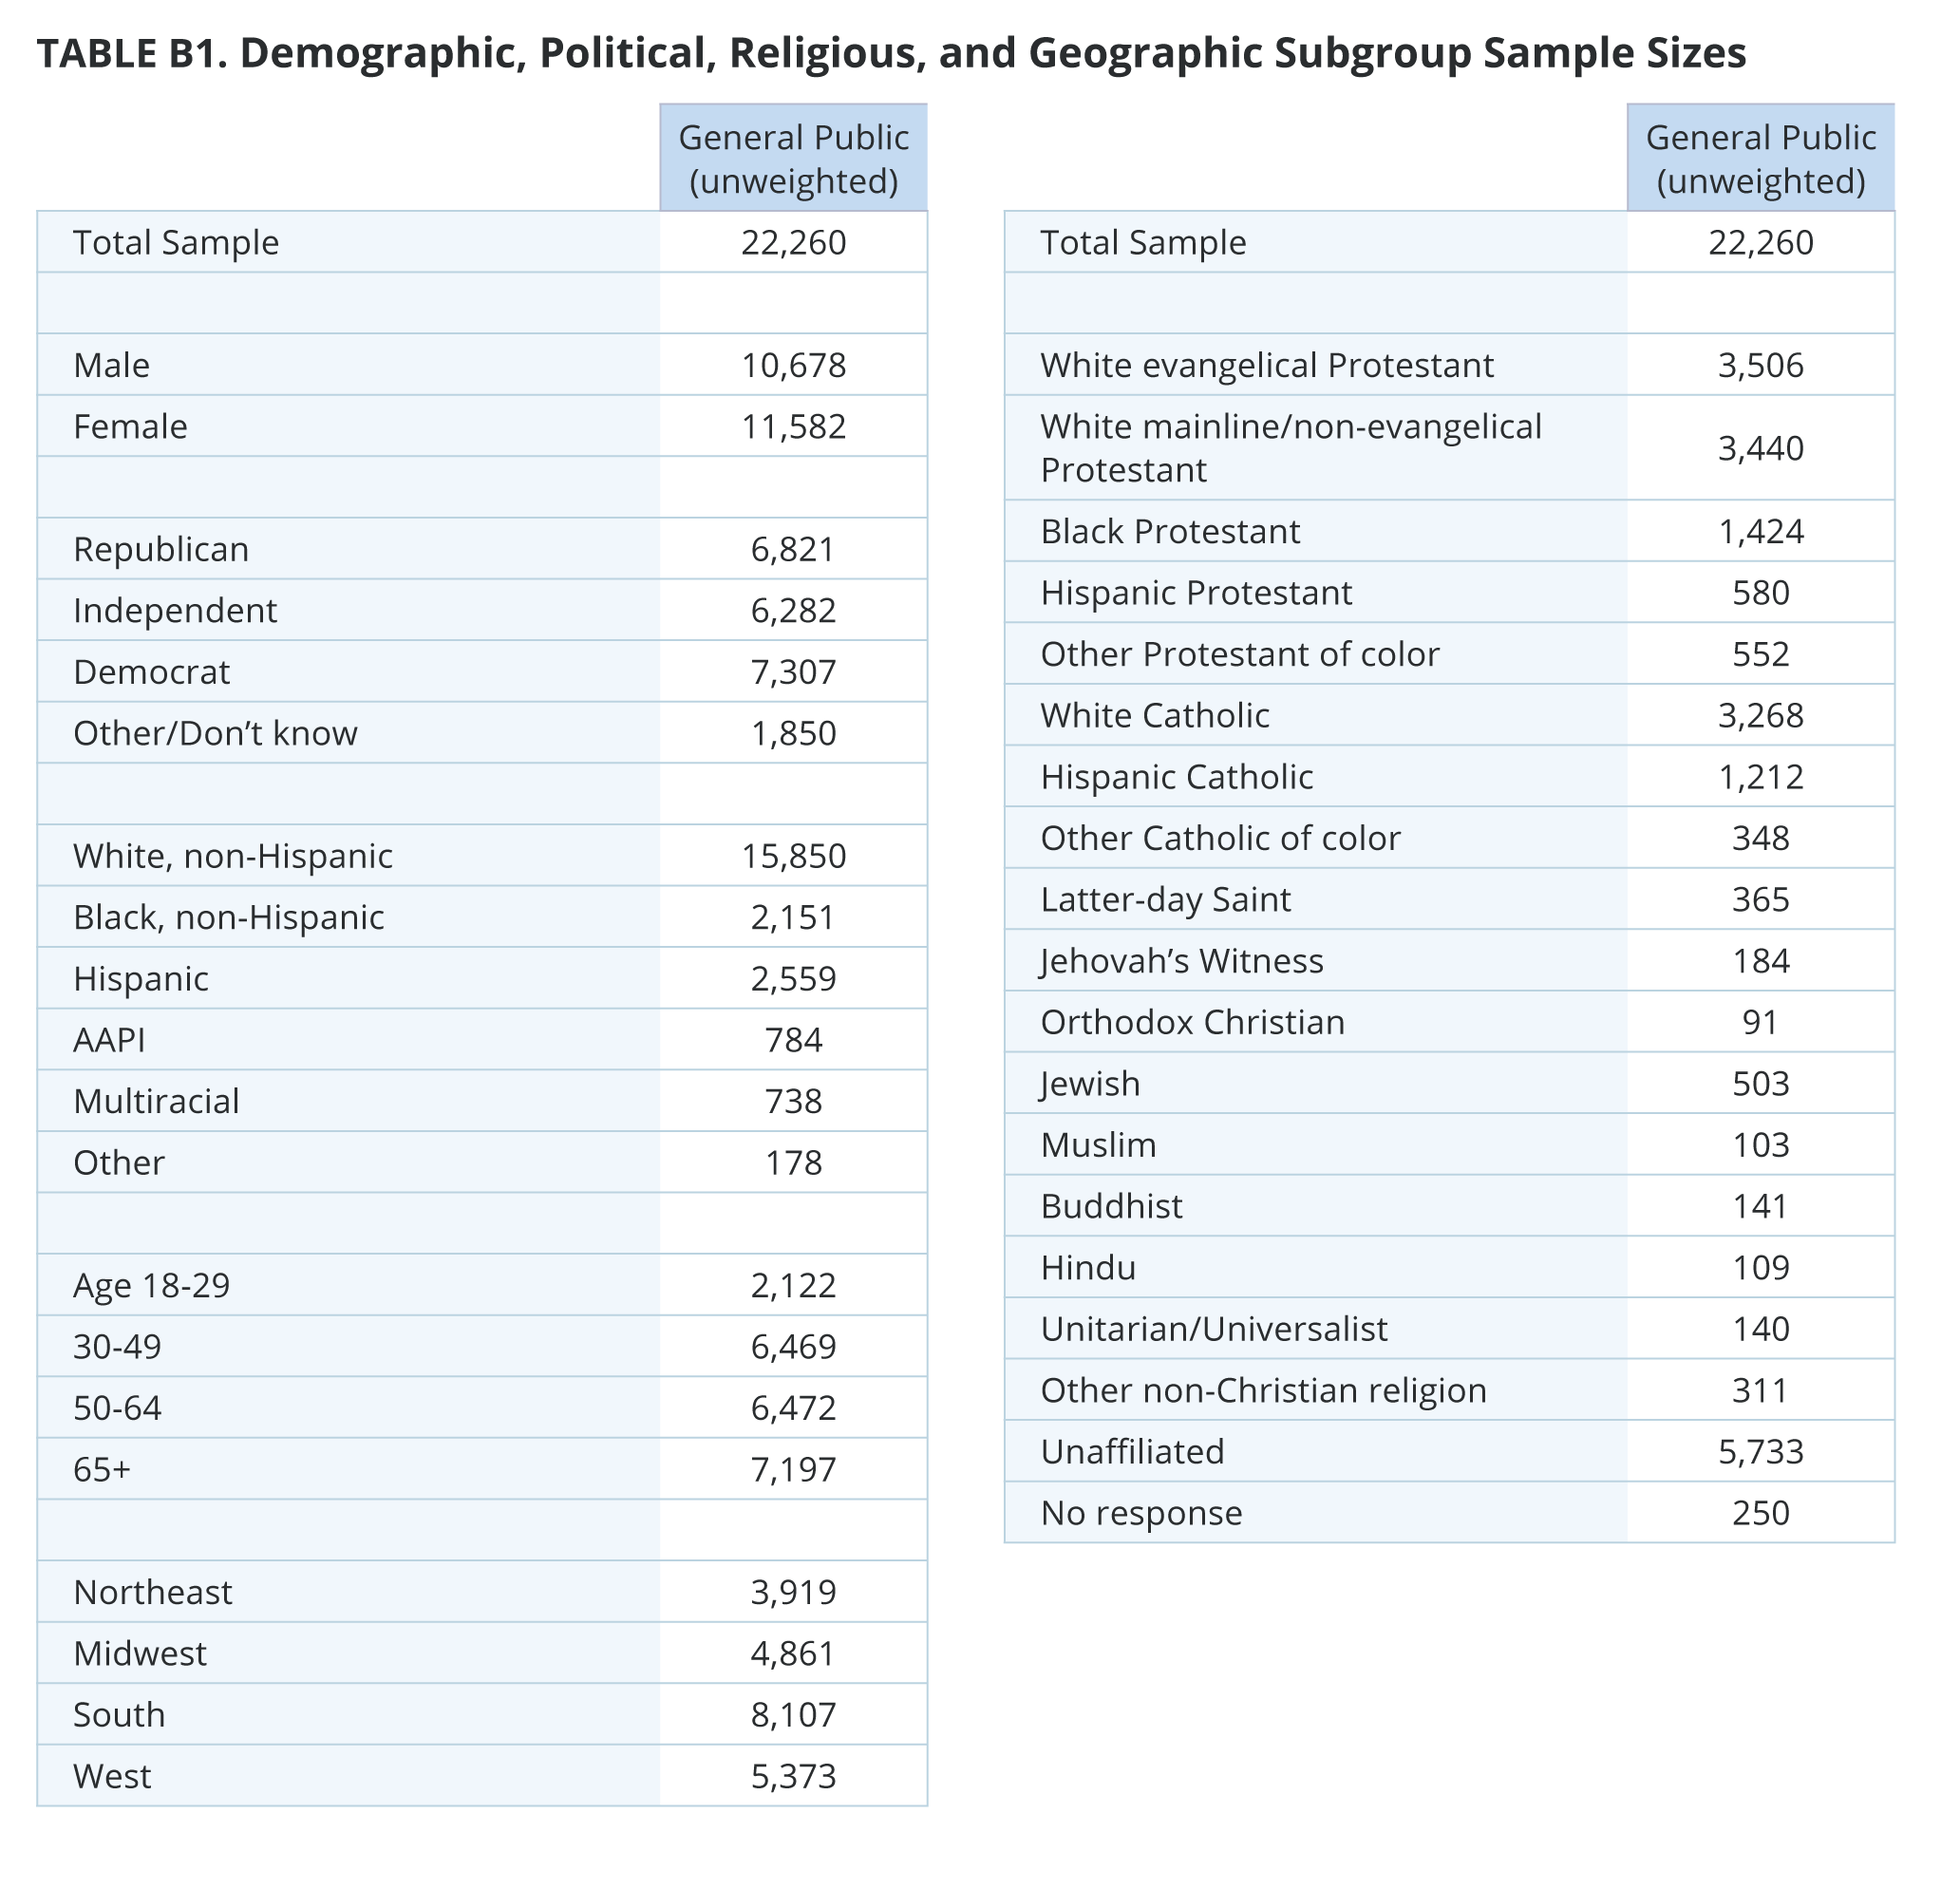
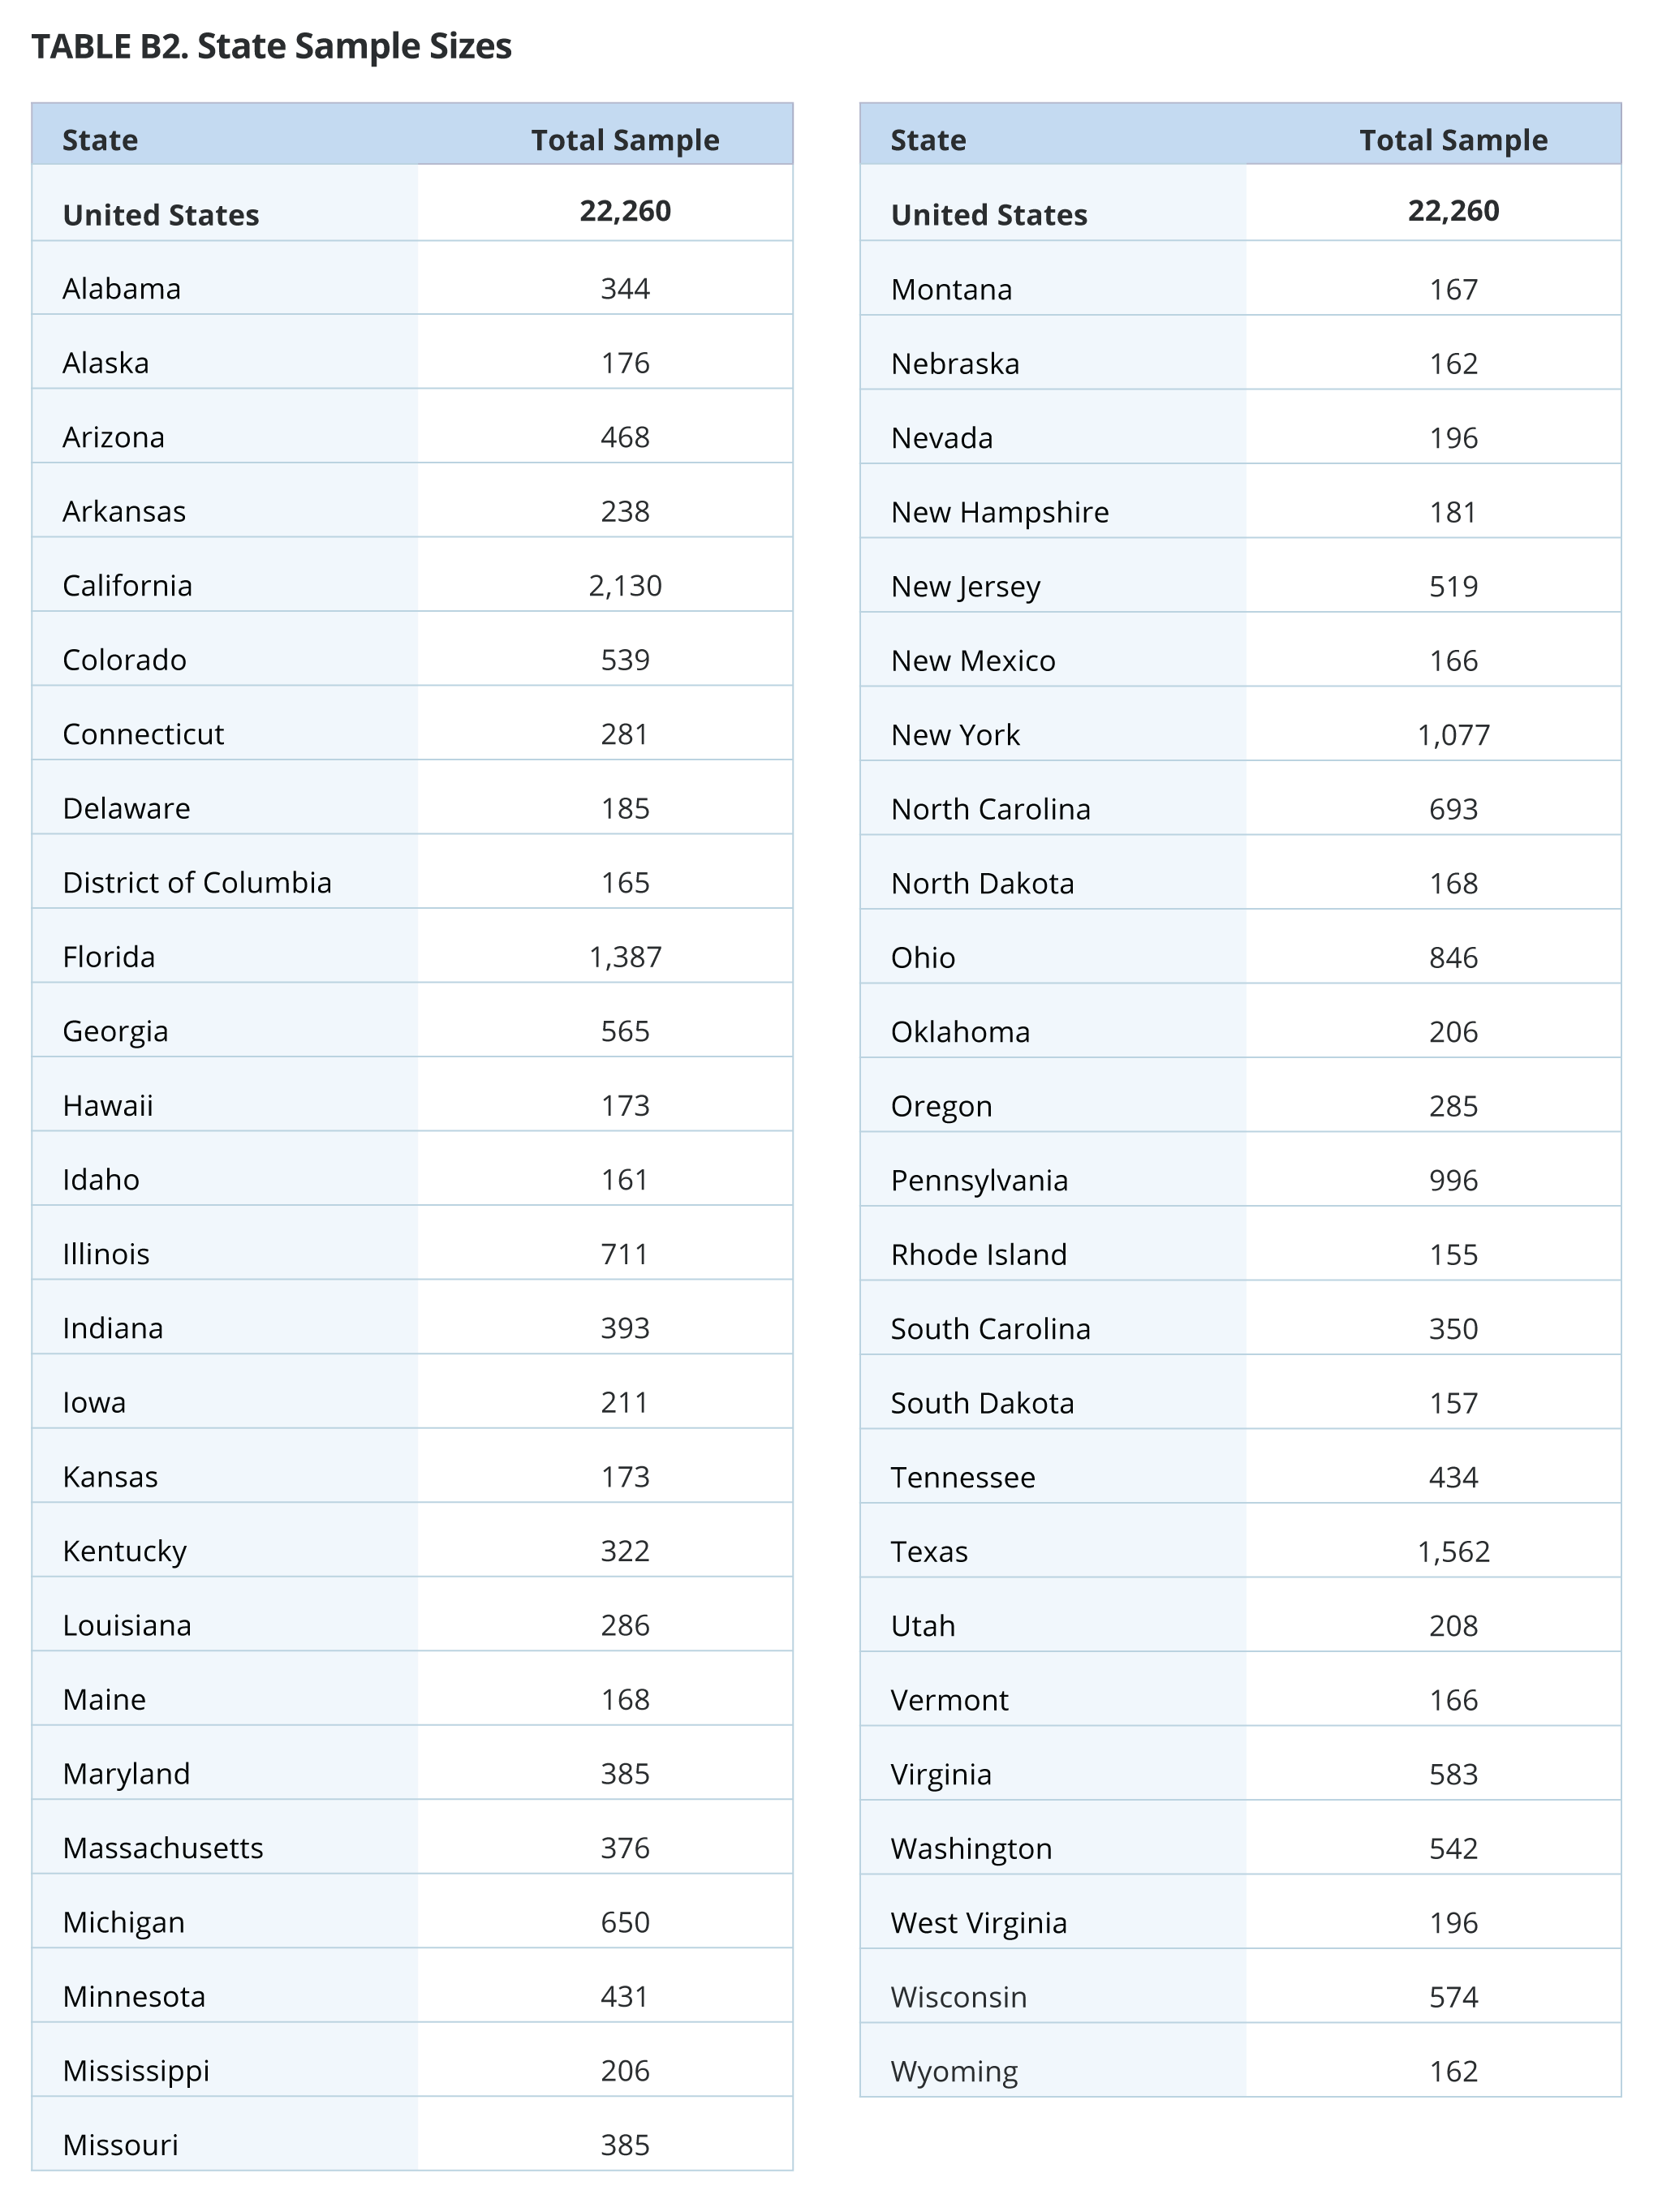
The survey was designed and conducted by PRRI. The survey was made possible through the generous support of the Arcus Foundation, the E. Rhodes and Leona B. Carpenter Foundation, the Gill Foundation, and the Unitarian Universalist Veatch Program at Shelter Rock. The survey was carried out among a random representative sample of 22,260 adults (age 18 and up) living in all 50 states in the United States. Among those, 20,642 are part of Ipsos’s KnowledgePanel and an additional 1,618 were recruited by Ipsos using opt-in survey panels to increase the sample sizes to a minimum of n=150 in smaller states. Interviews were conducted online between March 13 and December 2, 2024.
Respondents are recruited to the KnowledgePanel using an addressed-based sampling methodology from the Delivery Sequence File of the USPS – a database with full coverage of all delivery addresses in the U.S. As such, it covers all households regardless of their phone status, providing a representative online sample. Unlike opt-in panels, households are not permitted to “self-select” into the panel; and are generally limited to how many surveys they can take within a given time period.
The initial sample drawn from the KnowledgePanel was adjusted using pre-stratification weights so that it approximates the adult U.S. population defined by the 2023 March Supplement of the Current Population Survey (CPS), except language proficiency, which is not available from CPS, were obtained from the 2022 American Community Survey (ACS). Next, a probability proportional to size (PPS) sampling scheme was used to select a representative sample.
To reduce the effects of any non-response bias, a post-stratification adjustment was applied based on demographic distributions from the CPS, plus language proficiency from the ACS and party affiliation from Pew’s National Public Opinion Reference Survey (NPORS). The post-stratification weight rebalanced the sample based on the following benchmarks: gender, by age, by race/ethnicity, Census division, metro area by race/ethnicity, education by race/ethnicity, and income by race/ethnicity, language proficiency, party affiliation, and state population size. The sample weighting was accomplished using an iterative proportional fitting (IFP) process that simultaneously balances the distributions of all variables. Weights were trimmed to prevent individual interviews from having too much influence on the final results. In addition to an overall national weight, separate weights were computed for certain states (AZ, CO, FL, GA, MI, NC, NV, PA, TX, WI) to ensure that the demographic characteristics of the sample closely approximate the demographic characteristics of the target populations. The state-level post-stratification weights rebalanced the sample based on the following benchmarks: age, race and ethnicity, gender, education, and income, language proficiency (FL and TX only), and 2020 presidential vote choice.
These weights from the KnowledgePanel cases were then used as the benchmarks for the additional opt-in sample in a process called “calibration.” This calibration process is used to correct for inherent biases associated with nonprobability opt-in panels. The calibration methodology aims to realign respondents from nonprobability samples with respect to a multidimensional set of measures to improve their representation.
The margin of error for the national survey is +/- 0.84 percentage points at the 95% level of confidence, including the design effect for the survey of 1.6. In addition to sampling error, surveys may also be subject to error or bias due to question wording, context, and order effects. Additional details about the KnowledgePanel can be found on the Ipsos website: https://www.ipsos.com/en-us/solution/knowledgepanel
[1] For more detailed information, see Appendix
[2] Non-Christians include Jewish Americans, Buddhists, Hindus, Muslims, Unitarian Universalists, and members of other non-Christian religions.
[3] For more detailed information on our Christian nationalism measures, the extent of its support, and the factors influencing these views, see: https://www.prri.org/research/christian-nationalism-across-all-50-states-insights-from-prris-2024-american-values-atlas/
[4] The following 23 states and the District of Colombia have protections in all three categories: California, Colorado, Connecticut, Delaware, Hawaii, Illinois, Iowa, Maine, Maryland, Massachusetts, Michigan, Minnesota, Nevada, New Hampshire, New Jersey, New Mexico, New York, Oregon, Rhode Island, Vermont, Virginia, Washington, and Wisconsin. Wisconsin has these protections by sexual orientation, but not by gender identity, meaning transgender people are not protected under these laws. Utah has protections for jobs and housing, but not public accommodations. For more information, see: https://www.lgbtmap.org/equality-maps/non_discrimination_laws/public-accommodations.
[5] Same-sex marriage would continue to be legal in the District of Columbia and 18 states: California, Connecticut, Delaware, Hawaii, Illinois, Iowa, Maine, Maryland, Massachusetts, Minnesota, Nevada, New Hampshire, New Jersey, New Mexico, New York, Rhode Island, Vermont, and Washington. In the rest of the states, same-sex marriage would become banned. For more information, see: https://www.lgbtmap.org/Marriage-Report-March-2022
[6] States that have a ban on best practice medication and surgical care for transgender youth, even if the ban is not currently in effect, include Alabama, Arizona, Arkansas, Florida, Georgia, Idaho, Indiana, Iowa, Kentucky, Louisiana, Mississippi, Missouri, Montana, Nebraska, New Hampshire, North Carolina, North Dakota, Ohio, Oklahoma, South Carolina, South Dakota, Tennessee, Texas, Utah, West Virginia, and Wyoming. In the rest of the states, there is no ban implemented. For more information, see: https://www.lgbtmap.org/equality-maps/healthcare/youth_medical_care_bans
[7] The states that allow for a third gender marker option are California, Colorado, Connecticut, Hawaii, Illinois, Maine, Michigan, Minnesota, Nevada, New Hampshire, New Jersey, New Mexico, New York, Oregon, Pennsylvania, Rhode Island, Utah, Virginia, and Washington.
[8] For more information, see: https://www.lgbtmap.org/equality-maps/identity_documents