Is Religious Liberty a Shield or a Sword?
Perceptions of the Meaning of Religious Liberty
Most Americans Agree U.S. Cannot Establish an Official Religion or Favor One Over the Other
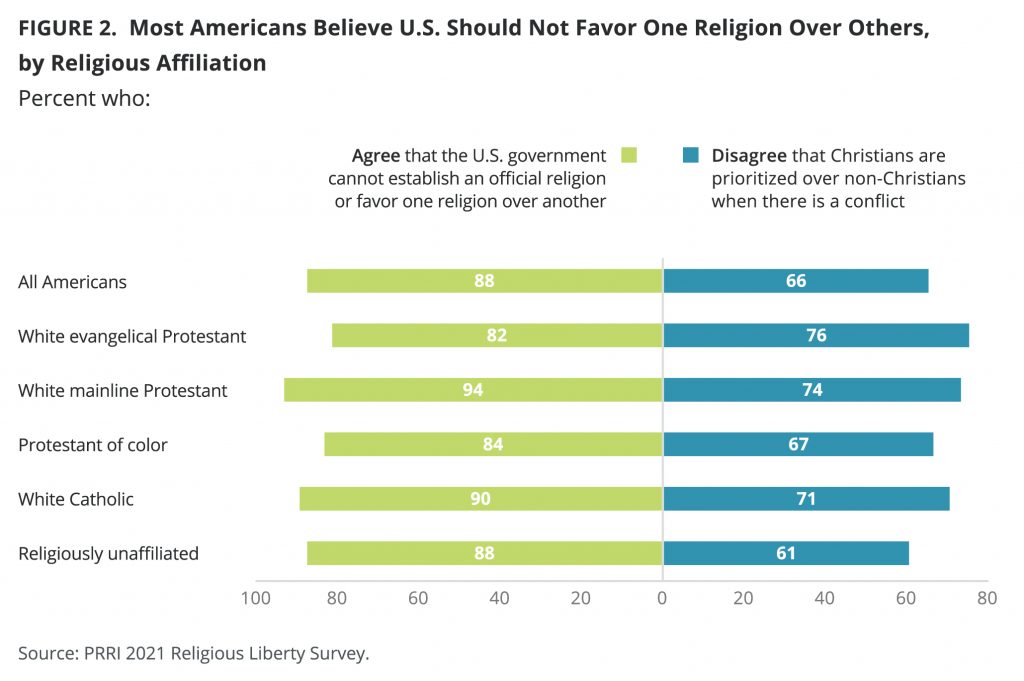
Despite frequent disagreement on how to implement freedom of religion, the vast majority of Americans understand the basic religious protection offered by the First Amendment to the U.S. Constitution. Nearly nine in ten Americans (88%) agree that the U.S. government cannot establish an official religion or favor one religion over another, including 68% who completely agree with this statement. Only 11% of Americans disagree with the idea that the government cannot establish an official religion. Overwhelming agreement with this statement is consistent across all demographic groups.
Large majorities of all religious groups agree that the U.S. government cannot establish an official religion or favor one religion over another, including white mainline Protestants (94%), white Catholics (90%), religiously unaffiliated Americans (88%), Protestants of color (84%), and white evangelical Protestants (82%).[1]
All partisans are equally likely to agree with the statement that the U.S. government cannot establish an official religion or favor one religion over another, including 91% of Democrats, 88% of independents, and 86% of Republicans.
Personal Lives vs. Public Life: Most Americans Agree With the “Do No Harm” Principle for Religious Liberty
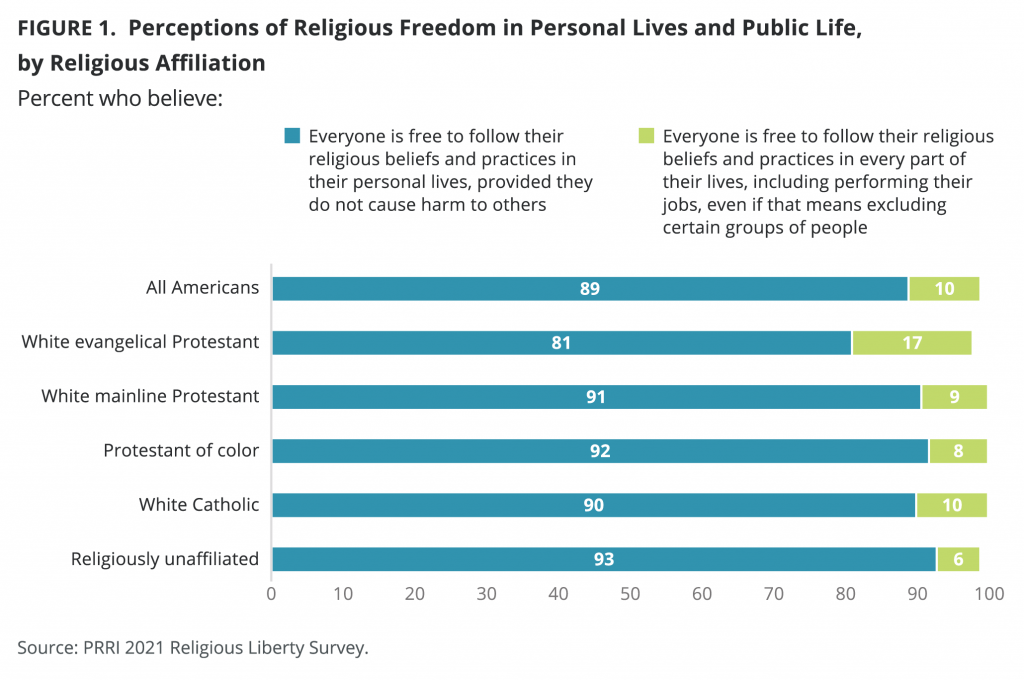
Most Americans (89%) also agree, in the abstract, that everyone is free to follow their religious beliefs and practices in their personal lives, provided they do not cause harm to others. Only one in ten (10%) say that everyone is free to follow their religious beliefs and practices in every part of their lives, including performing their jobs, even if that means excluding certain groups of people. About nine in ten Americans agree with the first statement across demographic groups.
Overwhelming majorities of all religious groups say that everyone is free to follow their religious beliefs and practices in their personal lives, provided they do not cause harm to others, including 93% of religiously unaffiliated Americans, 92% of Protestants of color, 91% of white mainline Protestants, 90% of white Catholics, and 81% of white evangelical Protestants.
Democrats (93%) are more likely than Republicans (87%) to say that everyone is free to follow their religious beliefs and practices in their personal lives, provided they do not cause harm to others. Independents fall in between those two groups (89%).
Most Disagree That Rights of Christians Take Priority Over Others’
Two-thirds of Americans (66%) disagree that in the U.S., when there is a conflict, the rights and religious freedom of Christians have priority over the rights and religious freedom of non-Christians and non-religious Americans, including 43% who completely disagree with this statement. Less than one-third of Americans (31%) agree that Christians have priority when there is a conflict.
Strong majorities of all major religious groups, including all Christian groups, disagree that Christians have priority over others when conflicts exist. About three in four white evangelical Protestants (76%) and white mainline Protestants (74%) disagree that when there is a conflict in the U.S., the rights and religious freedom of Christians have priority over the rights and religious freedom of non-Christians and non-religious Americans. More than two-thirds of white Catholics (71%) and Protestants of color (67%) also disagree. Religiously unaffiliated Americans (61%) are the least likely group to disagree that Christians are advantaged over other groups.
Republicans (75%) and independents (70%) are notably more likely than Democrats (57%) to disagree that the rights and religious freedom of Christians have priority over the rights and religious freedom of non-Christians and non-religious Americans when there is conflict.
There are notable differences by race and education. More than seven in ten white Americans (71%), 62% of Hispanic Americans, 61% of Black Americans, and 53% of Americans who identify as another race disagree with the idea that the rights and religious freedom of Christians have priority over the rights and religious freedom of non-Christians and non-religious Americans.[2] Among white Americans, those without a college degree are notably more likely to disagree with this statement than those with a college degree (74% vs. 65%).
Disagreement with the idea that the rights and religious freedom of Christians have priority when there is conflict increases with age: 57% of young Americans ages 18–29, 62% of Americans ages 30–49, 73% of middle-aged Americans ages 50–64, and 74% of senior Americans ages 65 and over hold this view.
Does Religious Liberty Protect Minority Beliefs or Enable Discrimination?
Threats to Religious Liberty in the U.S.
Approximately four in ten Americans (42%) believe that the right of religious liberty is being threatened in America today, compared to 58% who do not believe this right is threatened.
White evangelical Protestants (72%) are by far the religious group most likely to think religious liberty is being threatened. Less than half of all other religious groups believe that the right of religious liberty is threatened in America today, including white Catholics (44%), white mainline Protestants (42%), and Protestants of color (41%). Religiously unaffiliated Americans are the least likely to believe that the right of religious liberty is threatened (24%). [3]
Republicans (63%) are much more likely than independents (43%) and Democrats (23%) to believe that the right of religious liberty is threatened in America today.
White Americans (46%) are notably more likely than other racial and ethnic groups to believe that the right of religious liberty is threatened in America today. Less than four in ten Hispanic Americans (38%), one-third of Black Americans (33%), and 29% of Americans who identify as another race say religious liberty is threatened. Half of white Americans without a college degree (50%) think that the right of religious liberty is threatened, compared to 36% of white Americans with a college degree.
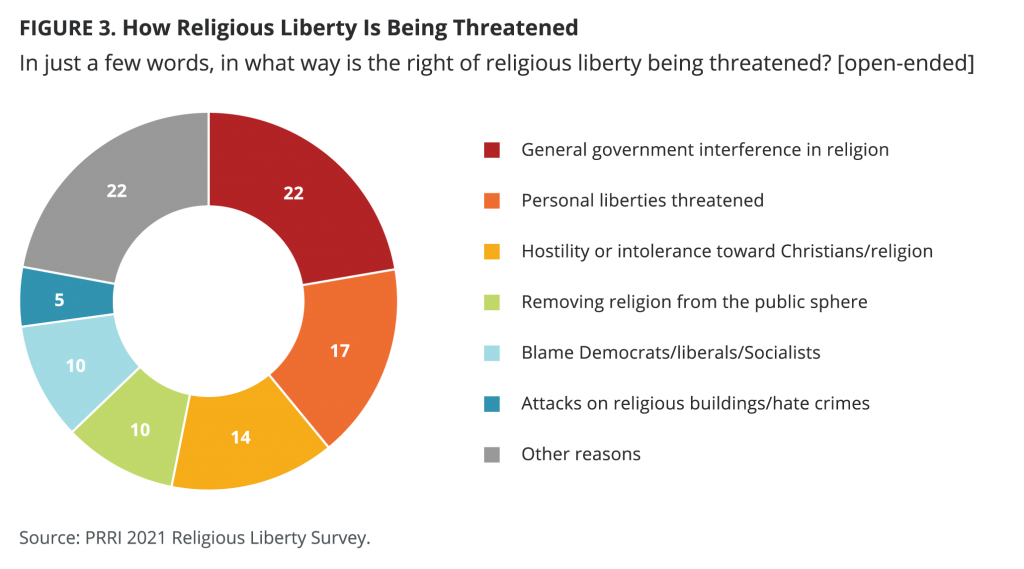
The survey asked an open-ended follow-up question of those who believe that the right of religious liberty is threatened in America today. When given the opportunity to say why they believe religious liberty is under threat, 22% cite general government interference in religion, 17% say their personal liberties are being threatened, 14% reference hostility or intolerance toward Christians or religion, 10% mention removing religion from the public sphere, and 10% cite threats from Democrats, liberals, or socialists. Five percent mention violence, such as attacks on religious buildings and hate crimes, and the remaining 22% listed other reasons.
Threats to Personal Religious Liberty
Nearly four in ten Americans (39%) agree with the statement that “In the U.S. today, I feel like my religious liberty is being threatened,” compared to six in ten (60%) who disagree with this statement.
As with religious liberty generally, white evangelical Protestants (71%) are most likely to agree with the concept that their personal religious liberty is threatened. Less than half of Protestants of color (43%), white mainline Protestants (42%), and white Catholics (42%) agree, and only 17% of religiously unaffiliated Americans think their religious liberty is threatened.
There are stark partisan divisions on this question. Six in ten Republicans (60%), four in ten independents (40%), and only 23% of Democrats agree that their personal religious liberty is being threatened.
White Americans (43%) are more likely than Black (33%) and Hispanic (33%) Americans to agree that their religious liberty is being threatened. White Americans without four-year college degrees are significantly more likely than those with at least a four-year college degree to agree with the idea that personal religious liberties are being threatened (46% vs. 37%).
Threats Arising From Others’ Religious Liberty Claims
More than four in ten Americans (44%) agree with the statement “In the U.S. today, I feel like my rights are being threatened by the claims others are making about their religious liberty,” compared to a majority (55%) who disagree.
A slim majority of white evangelical Protestants (51%) agree that others’ religious liberty claims threaten their rights. Less than half of other groups agree, including 45% of Protestants of color, 45% of religiously unaffiliated Americans, 44% of white Catholics, and 40% of white mainline Protestants.
There is little variation among partisans, although the reasons for agreeing that others’ claims to religious liberty are threatening likely differ. Similar proportions of Republicans (46%), independents (42%), and Democrats (46%) agree with the statement.
White Americans (46%) are more likely than Hispanic Americans (41%), Black Americans (38%), and Americans who identify as another race (36%) to agree that their rights are being threatened by the claims others are making about their religious liberty. There is no significant difference in opinions among white Americans by education.
The Power of Partisanship on White Christian Attitudes About Religious Liberty
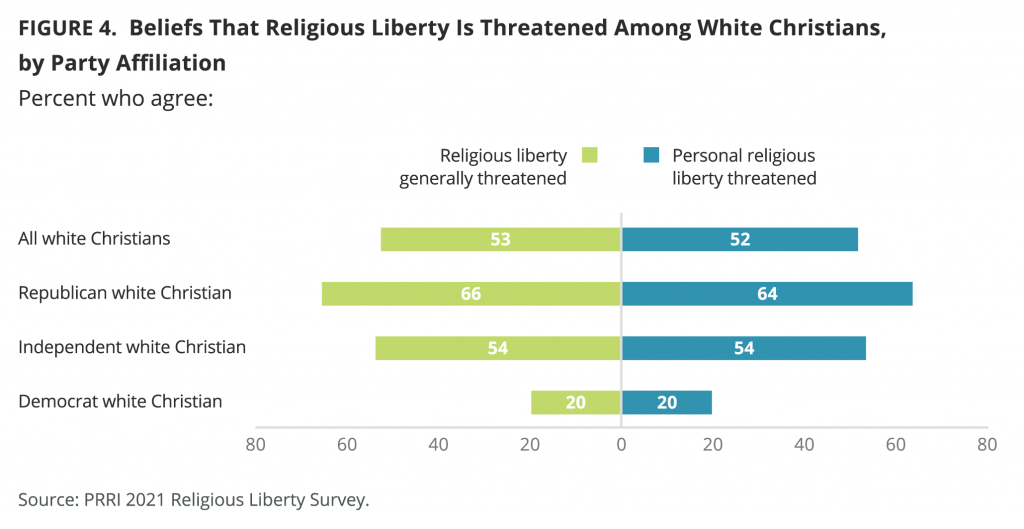
White Christians are notably more likely than other religious groups to believe that the right of religious liberty is being threatened in America today (53% vs. 33%), although partisan identity strongly structures the views of white Christians on this issue. White Christians who identify as Republicans are more than three times as likely as those who identify as Democrats to believe that the right of religious liberty is being threatened in America today (66% vs. 20%). White Christians who identify as independent are closer to the Republican side, with a majority (54%) who believe that the right of religious liberty is being threatened.
White Christians are divided on whether their religious liberty is being threatened in the U.S. (52% agree; 47% disagree), compared to only 29% of members of other religious groups who agree with this idea. While the majority of Republican white Christians (64%) believe their religious liberty is being threatened, only 20% of Democrat white Christians agree with this idea. Independent white Christians are divided on this question (54% agree; 45% disagree).
Perceptions of Discrimination
Perceptions of Discrimination Against Historically Marginalized Groups in the U.S.
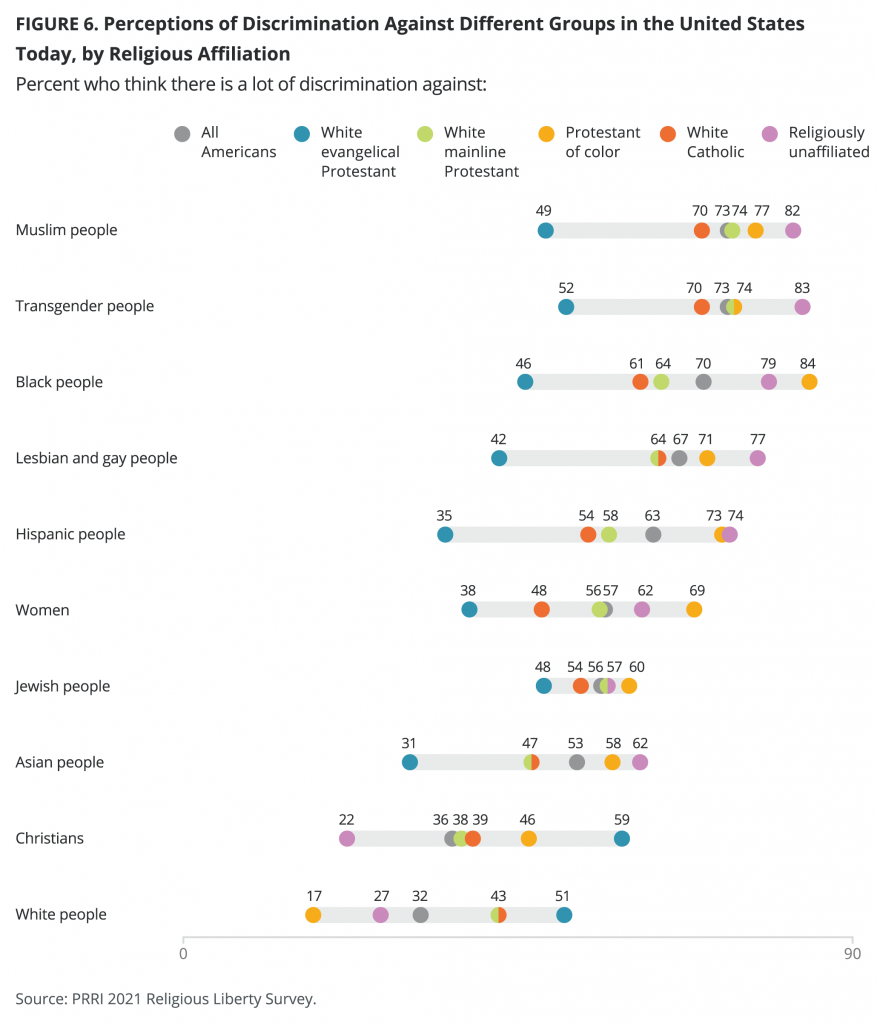
When Americans were asked if there is a lot of discrimination against groups that have been historically marginalized in the U.S. today, majorities say this is the case for Muslim people (73%), transgender people (73%), Black people (70%), lesbian and gay people (67%), Hispanic people (63%), women (57%), Jewish people (56%), and Asian people (53%).
Perceptions of discrimination faced by most of these groups has increased considerably over the last few years. The largest change has been in perceptions of the level of discrimination faced by Jews; only 30% of Americans believed Jews face a lot of discrimination in 2018, compared to 56% now. Compared to 2018, Americans are more likely to say each of the following groups face a lot of discrimination in the U.S.: Transgender people (59% to 73%), lesbian and gay people (55% to 67%), and women (45% to 57%). These increases have occurred across most religious and party affiliations, including upticks of more than 20 percentage points within every religious and party category for Jews. Perceptions of the level of discrimination faced by Black and Asian people have not changed significantly since 2018, while they have declined slightly for Hispanic people, from 69% in 2018 to 63% now.
There are strong perception differences across religious affiliations. White evangelical Protestants are the only religious group without majority agreement that there is a lot of discrimination against these groups. Less than half of white evangelical Protestants say that Muslims (49%), Jews (48%), Black people (46%), lesbian and gay people (42%), women (38%), Hispanic people (35%), and Asian people (31%) face a lot of discrimination. A slim majority of white evangelical Protestants (52%) say that there is a lot of discrimination against transgender people.
Majorities of white mainline Protestants and white Catholics say that there is a lot of discrimination against Muslims (74% and 70%, respectively), transgender people (74% and 70%, respectively), lesbian and gay people (64% for both), Black people (64% and 61%, respectively), Hispanic people (58% and 54%, respectively), and Jews (57% and 54%, respectively). The majority of mainline Protestants (56%) say there is a lot of discrimination against women, as do just under half of white Catholics (48%). The same is true for perceptions of discrimination against Asian people: Less than half of mainline Protestants (47%) and white Catholics (47%) say there is a lot of discrimination.
Majorities of Protestants of color say there is a lot of discrimination against all of these historically marginalized groups: Black people (84%), Muslims (77%), transgender people (74%), Hispanic people (73%), lesbian and gay people (71%), women (69%), Jews (60%), and Asian people (58%). Majorities of religiously unaffiliated Americans also say that there is a lot of discrimination against transgender people (83%), Muslims (82%), Black people (79%), lesbian and gay people (77%), Hispanic people (74%), women (62%), Asian people (62%), and Jews (57%).
Democrats are notably more likely than Republicans to say that there is a lot of discrimination against historically marginalized groups, including transgender people (92% vs. 55%), Black people (91% vs. 45%), Muslims (88% vs. 53%), lesbian and gay people (88% vs. 47%), Hispanic people (84% vs. 37%), women (77% vs. 35%), Asian people (70% vs. 34%), and Jews (68% vs. 44%). Independent attitudes fall in between and resemble closely Americans as a whole.
Perceptions of Discrimination Against White People and Christians
Americans were also asked if there is a lot of discrimination in the U.S. today against white people and Christians, two groups that have historically enjoyed majority status in the country but which sometimes claim that efforts to diversify society entail discrimination against them. Only about one-third of Americans think that there is a lot of discrimination against Christians (36%) and white people (32%). These numbers have not changed since 2018.
Perceptions of discrimination against white people and Christians vary significantly among white Christians. White evangelical Protestants (59%) are notably more likely than white Catholics (39%) and white mainline Protestants (38%) to say that there is a lot of discrimination against Christians. A slim majority of white evangelical Protestants (51%) say white people face a lot of discrimination, compared to 43% of both white mainline Protestants and white Catholics.[4]
More than four in ten Protestants of color (46%) say there is a lot of discrimination against Christians, while less than one in five say there is a lot of discrimination against white people (17%). About one in four religiously unaffiliated Americans say there is a lot of discrimination against Christians (22%) and white people (27%).
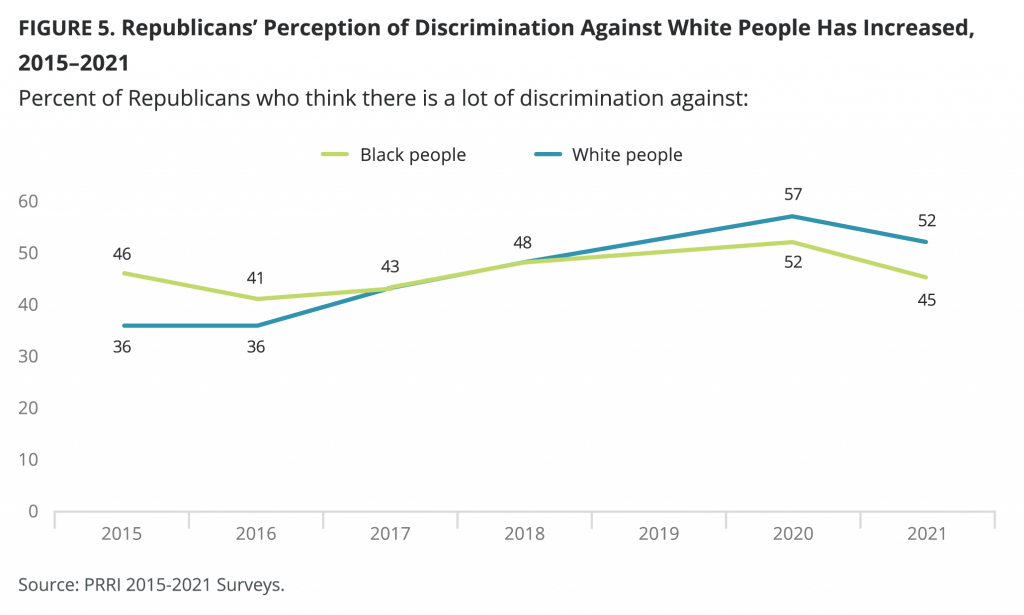
Not surprisingly, Republicans are notably more likely to say there is a lot of discrimination against Christians (53%) and white people (52%) than are Democrats (23% and 15%, respectively). Independents fall in between and resemble Americans as a whole (37% and 35%, respectively). Notably, Republicans are roughly as likely to say that Christians and white people face a lot of discrimination as they are to say this about historically marginalized groups. Republicans have also become more likely to say that white people face a lot of discrimination since 2015, when only 36% said the group faces a lot of discrimination.
While there are no notable differences in perceptions of discrimination against Christians among white Americans (38%), Black Americans (39%), and Hispanic Americans (35%), that number drops to one in five Americans who identify as another race (20%). White Americans are notably more likely to say that there is a lot of discrimination against white people (40%) than Hispanic Americans (20%), Americans who identify as another race (20%), and Black Americans (13%).
There are divides by education among white people. White people without a college degree are notably more likely than white people with a college degree to say there is a lot of discrimination against white people (45% vs. 31%) and against Christians (44% vs. 28%).
While there are no differences between men and women in their discrimination perceptions against Christians (38% vs. 34%), men are notably more likely than women to say that there is a lot of discrimination against white people (38% vs. 27%).
Allowing Adults and Children to Opt Out of Vaccinations for Religious Reasons
Americans are divided on whether people who would otherwise be required to receive a COVID-19 vaccination should be allowed to opt out for religious reasons. Just under half of Americans (48%) support religiously based exemptions to vaccine requirements, while 51% oppose such exemptions.
Majorities of white evangelical Protestants (65%) and Protestants of color (60%) favor religious exemptions for a COVID-19 vaccine. White mainline Protestants are more divided (51% favor exemptions; 49% oppose), while less than half of white Catholics (43%) and religiously unaffiliated Americans (34%) favor religiously based vaccine refusals.
More than six in ten Republicans (62%), compared to 53% of independents and 31% of Democrats, favor religiously based exemptions for the COVID-19 vaccine.
Americans are much less in favor of allowing religiously based exemptions to vaccines that are required for children to attend public schools. Only about one in four Americans (27%) favor allowing children to attend public school without receiving required vaccines if doing so violates their parents’ religious beliefs, while 73% are opposed. Just 7% of Americans strongly favor religious vaccine exemptions for public school students, while 34% strongly oppose them.
Less than half of all major religious groups favor allowing religious exemptions to vaccines for public school students. White evangelical Protestants are most likely to support religiously based vaccine exemptions (46%). About one in four white mainline Protestants (28%), Protestants of color (26%), white Catholics (23%), and religiously unaffiliated Americans (17%) support such exemptions.
Republicans (33%) and independents (32%) are both more likely than Democrats (14%) to favor allowing religiously based exemptions to vaccines that are required for public school students.
Allowing Professionals, Health Care Organizations, and Businesses to Refuse Services and Products Based on Religious Liberty Claims
Requiring Licensed Professionals to Provide Services to All People
Americans overwhelmingly oppose allowing licensed professionals like doctors, lawyers, teachers, and social workers to refuse to provide services to particular groups of people if doing so violates their religious beliefs (15% favor allowing refusals, 84% oppose them). Nearly half of Americans (47%) strongly oppose religiously based service refusals for licensed professionals. Support for religiously based service refusals has declined somewhat from 2019 (28%).
Large majorities of all major religious groups oppose religiously based service refusals for licensed professionals. White evangelical Protestants are least likely to oppose allowing licensed professionals to refuse service to specific groups, but even among this group, more than two-thirds (68%) oppose such religious exemptions. At least eight in ten members of other religious groups oppose these types of service refusals, including white Catholics (80%), Protestants of color (84%), white mainline Protestants (87%), and religiously unaffiliated Americans (93%).
Despite opposition to this policy from all major religious groups, there are some substantial differences in intensity in opposition. One in four white evangelical Protestants (25%) strongly oppose religiously based service refusals for licensed professionals, compared to just under half of Protestants of color (46%), white mainline Protestants (45%), and white Catholics (43%). Religiously unaffiliated Americans swing in the opposite direction of white evangelical Protestants, with more than six in ten (64%) who are strongly opposed.
Partisan groups express similar patterns in their attitudes. Most Republicans (76%), independents (83%), and Democrats (93%) oppose allowing religiously based service refusals for licensed professionals. However, strong opposition is much lower among Republicans (28%) than among independents (44%) or Democrats (65%).
Requiring Employers to Cover Contraception on Health Insurance Plans
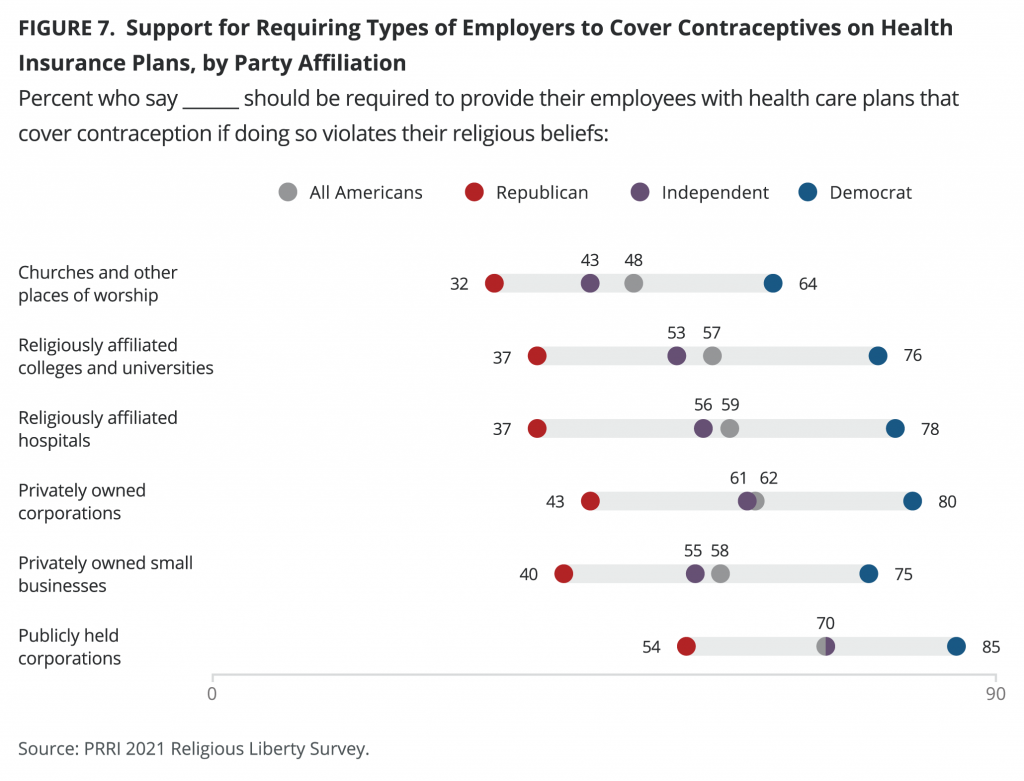
With the exception of churches and other places of worship, majorities of Americans believe that most employers should be required to provide health insurance policies that cover contraception. But there are major attitudinal differences by party.
Churches and Other Places of Worship
Americans are divided over whether churches and other places of worship should be required to cover contraception on health insurance plans for employees if doing so violates their religious beliefs, with 48% in support of forcing such coverage and 51% against it.
Religious groups vary in their support for requiring churches and other places of worship to require health care coverage to include contraception. A slim majority of Protestants of color (51%) and more than six in ten religiously unaffiliated Americans (62%) say churches and places of worship should be required to cover contraception, while less than half of white mainline Protestants (43%), white Catholics (42%), and white evangelical Protestants (27%) agree.
Just one-third of Republicans (32%), compared to 43% of independents and nearly two-thirds of Democrats (64%), favor requiring churches and places of worship to cover contraception for their employees.
Religiously Affiliated Colleges and Universities
A majority of Americans (57%) say that religiously affiliated colleges and universities should be required to provide their employees with coverage for contraception, even if it violates their religious beliefs.
With the exception of white evangelical Protestants (31%), majorities of all other major religious groups say that religiously affiliated colleges and universities should be required to cover birth control. This includes 51% of white Catholics, 54% of white mainline Protestants, 65% of Protestants of color, and 71% of religiously unaffiliated Americans.
Less than four in ten Republicans (37%), compared to a majority of independents (53%) and three in four Democrats (76%), say that religiously affiliated colleges and universities should be required to cover contraception for their employees.
Privately Owned Small Businesses
Just under six in ten Americans (58%) say that privately owned small businesses should be required to provide contraception coverage in their employees’ health care plans, even if doing so would violate their religious beliefs.
Just one-third of white evangelical Protestants (33%), compared to majorities of white Catholics (54%), white mainline Protestants (57%), Protestants of color (64%), and religiously unaffiliated Americans (72%), say that privately owned small businesses should be required to provide their employees with health care plans that cover contraception.
Four in ten Republicans (40%), compared to a majority of independents (55%) and three in four Democrats (75%), support contraception coverage requirements for privately owned small businesses.
Religiously Affiliated Hospitals
Around six in ten Americans (59%) favor requiring contraception coverage for employees of religiously affiliated hospitals even if it violates their religious beliefs, while 39% are opposed to these requirements.
Just one-third of white evangelical Protestants (33%) favor requiring religiously affiliated hospitals to cover contraception. However, solid majorities of other major religious groups support covering contraception for employees of religiously affiliated hospitals. This includes 55% of white Catholics, 56% of white mainline Protestants, 65% of Protestants of color, and 73% of religiously unaffiliated Americans.
Again, Republicans (37%) are at odds with independents (56%) and Democrats (78%) in their opposition to requiring coverage for contraception for employees of religiously affiliated hospitals.
Privately Owned Corporations
More than six in ten Americans (62%) believe that privately owned corporations should be required to cover contraception for their employees, even if it violates their religious beliefs, while 36% say they should not.
Again, white evangelical Protestants stand alone, with just 37% saying that privately owned corporations should be required to cover contraception in their employee health plans. Majorities of every other religious group agree with requiring contraception coverage for private corporations, including 56% of white Catholics, 61% of white mainline Protestants, 69% of Protestants of color, and 77% of religiously unaffiliated Americans.
Similar to attitudes toward requirements for other employers, Republicans (43%) are less likely than independents (61%) and Democrats (80%) to support requiring privately owned corporations to cover employees’ contraception.
Publicly Held Corporations
Americans are more supportive of contraception coverage requirements for publicly held corporations than they are for other types of employers. Seven in ten Americans (70%) support such requirements, even if they violate a company’s religious views, while just 28% oppose them. This is a slight increase in support from 2014, when 61% of Americans supported requirements for contraception coverage.
Half of white evangelical Protestants (50%) support contraception requirements for publicly held corporations, compared to two-thirds or more among white Catholics (66%), white mainline Protestants (71%), Protestants of color (72%), and religiously unaffiliated Americans (83%).
Majorities of all partisan groups support contraception coverage for publicly held corporations, including 54% of Republicans, 70% of independents, and 85% of Democrats.
Requiring Pharmacists to Provide Contraceptives
Only 13% of Americans favor allowing a pharmacist to refuse to provide contraceptives to women who have a prescription for them if doing so violates their religious beliefs, while 85% oppose this type of refusal. Notably, Americans are half as likely as they were in 2018 to favor allowing pharmacists to refuse to provide prescription contraceptives (26%).
Less than one in four members of any religious group favor allowing a pharmacist to refuse to provide contraceptives. White evangelical Protestants are most likely to favor allowing pharmacists to refuse to provide contraceptives (24%), compared to 15% of white Catholics, 14% of Protestants of color, 11% of white mainline Protestants, and 6% of religiously unaffiliated Americans.
Few Americans of any partisan affiliation favor allowing pharmacists to deny prescriptions for contraception. Around one in five Republicans (18%), 15% of independents, and just 6% of Democrats favor allowing pharmacists to refuse to provide contraceptives to women who have a prescription for them.
Requiring Hospitals or Medical Providers to Provide Abortion Services
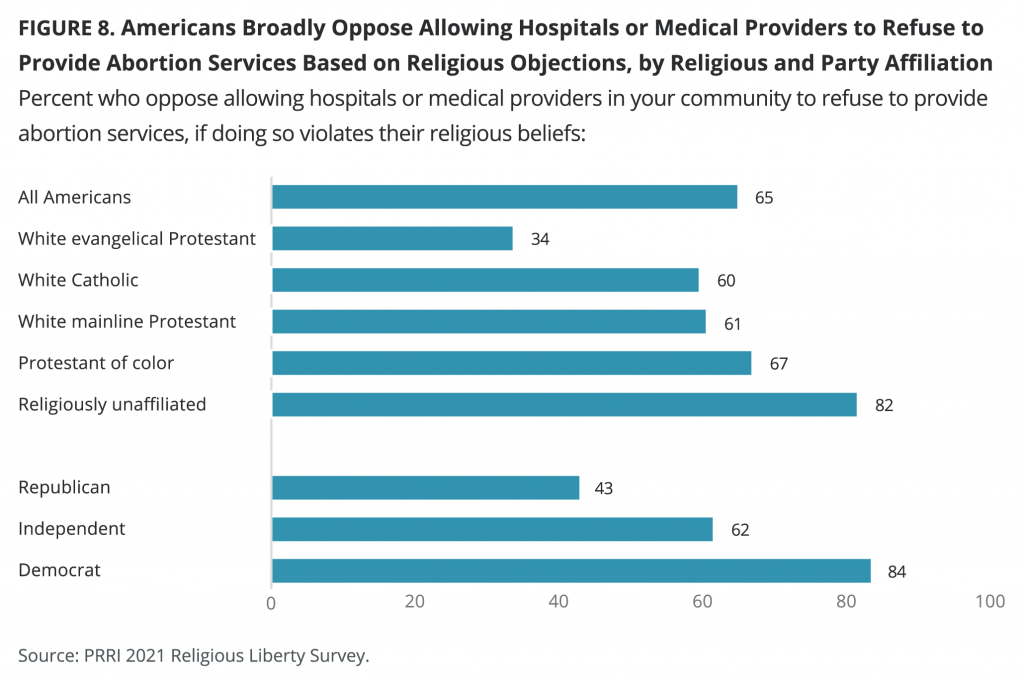
Americans are somewhat more divided over allowing hospitals or medical providers to refuse to provide abortion services if doing so violates their religious beliefs. Around one-third of Americans (34%) favor allowing hospitals or medical providers to refuse to provide abortion services on religious grounds, while nearly two-thirds (65%) are opposed.
A majority of white evangelical Protestants (63%) favor allowing hospitals and medical providers to refuse to provide abortion services. Less than four in ten white Catholics (39%), white mainline Protestants (38%), Protestants of color (30%), and religiously unaffiliated Americans (17%) agree.
A majority of Republicans (56%) favor allowing hospitals or other medical providers to refuse to provide abortion services if it violates their religious views. Nearly four in ten independents favor such refusals (37%), along with just 15% of Democrats.
A majority of Americans (63%) who believe abortion should be illegal in most or all cases say that they favor allowing hospitals or medical providers to refuse to provide abortion services, while a majority (35%) oppose refusals to provide abortions. Opinion is much more one-sided among Americans who believe abortion should be legal in most or all cases, among whom only one in ten say they favor allowing religiously based refusals to provide abortion services (16%), while nine in ten (83%) are opposed.
Religiously Based Refusals to Serve LGBTQ People
Most Oppose Allowing Small Businesses to Refuse Services and Products to Gay and Lesbian People Based on Religious Liberty Claims
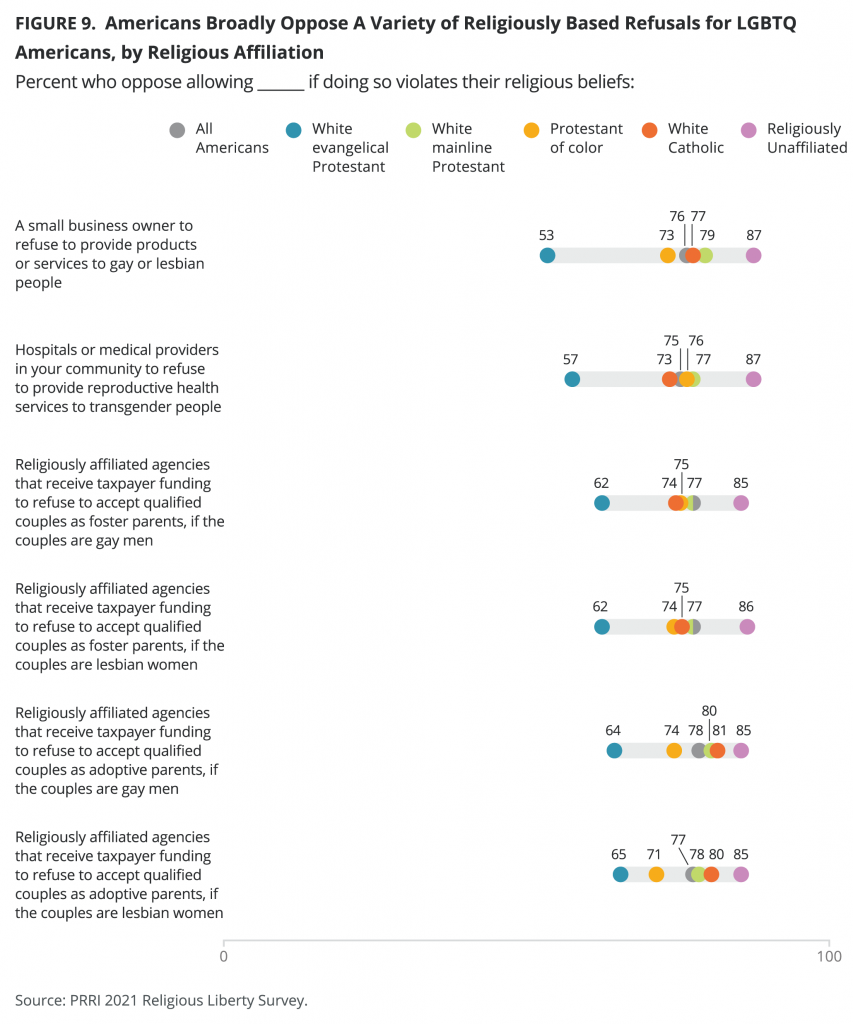
About one in five Americans (22%) say they favor allowing small business owners to refuse to provide products or services to gay or lesbian people if doing so would violate their religious beliefs. Three in four Americans (76%) oppose religiously based refusals to serve gay and lesbian people.
Not surprisingly, Americans who support nondiscrimination protections for LGBTQ people are less likely to favor religiously based service refusals for gay and lesbian people. Just 18% of Americans who support nondiscrimination laws, compared to 46% of Americans who oppose LGBTQ nondiscrimination laws, favor religiously based refusals to serve gay and lesbian people.
Among religious groups, support for allowing small businesses to refuse to serve gay and lesbian people on religious grounds is highest among white evangelical Protestants (43% favor, 53% oppose) and significantly lower among Protestants of color (24%), white Catholics (23%), white mainline Protestants (20%), and religiously unaffiliated Americans (11%). Much of the recent decline in support for this type of service refusal has been among white evangelical Protestants.
Currently one-third of Republicans (33%), compared to 24% of independents and 11% of Democrats, favor allowing religiously based refusals to serve gay and lesbian people.
Allowing Small Businesses to Refuse Services and Products to Other Groups Based on Religious Liberty Claims
Americans are about as likely to favor religiously based service refusals for gay and lesbian people as they are to favor service refusals to Black people (15%), Asian people (15%), Hispanic people (16%), Jews (16%), Muslims (17%), atheists (18%), and transgender people (20%).
When all of the above groups of people are combined, around one in four Americans (26%) favor religiously based service refusals to at least one of them, while 12% favor allowing small businesses to refuse service to all of the groups tested on religious grounds. About half of white evangelical Protestants (50%) favor allowing religiously based refusals to serve at least one group, compared to less than three in ten Protestants of color (29%), white Catholics (27%), white mainline Protestants (25%), and religiously unaffiliated Americans (13%). Approximately four in ten Republicans (39%), compared to significantly fewer independents (28%) and Democrats (15%), favor allowing businesses to refuse service to at least one group.
Requiring Hospitals and Medical Providers to Provide Reproductive Health Care for Transgender Americans
Most Americans oppose allowing hospitals or medical providers to refuse to provide reproductive health services like contraception or sterilization to transgender people, if doing so would violate their religious beliefs. Less than one in four Americans (23%) favor religiously based refusals to provide reproductive health services for transgender people, while three in four (75%) oppose this type of refusal.
No more than four in ten of any major religious group favor religiously based refusals to provide reproductive health services for transgender people. This includes 40% of white evangelical Protestants, 25% of white Catholics, 23% of white mainline Protestants, 22% of Protestants of color, and 10% of religiously unaffiliated Americans.
Around four in ten Republicans (38%), compared to 25% of independents and 8% of Democrats, favor religiously based refusals to provide reproductive health services for transgender people.
Requiring Publicly Funded Agencies to Accept Gay or Lesbian Couples as Foster Parents
More than three in four Americans oppose allowing religiously affiliated agencies that receive taxpayer funding to refuse to accept qualified couples as foster parents if the couples are gay men (77%) or lesbian women (77%). Just one in five Americans favor allowing publicly funded agencies to refuse to accept gay men (21%) or lesbian women (20%) as foster parents.
Americans who support same sex marriage are less likely to favor allowing religiously affiliated agencies who receive taxpayer money to reject qualified gay (13%) or lesbian couples (13%) than Americans who oppose marriage equality (40% and 39%, respectively).
White evangelical Protestants are most likely to favor allowing religiously affiliated agencies who receive taxpayer money to refuse to accept qualified couples who are gay men (35%) or lesbian women (35%) as foster parents; solid majorities of white evangelicals oppose such a policy (62% for gay men and 62% for lesbian women). White Catholics (24% for gay men; 22% for lesbian women), Protestants of color (23% for gay men; 22% for lesbian women), white mainline Protestants (20% for gay men; 20% for lesbian women), and religiously unaffiliated Americans (13% for gay men; 12% for lesbian women) are all less likely to favor allowing agencies to refuse gay or lesbian couples.
One-third of Republicans favor allowing religiously affiliated organizations who receive taxpayer funds to refuse to accept qualified gay men (33%) or lesbian women (33%) as foster parents; solid majorities of Republicans oppose such a policy (65% for gay men; 65% for lesbian women). Independents (22% for gay men; 21% for lesbian women) and Democrats (12% for gay men; 11% for lesbian women) are both less likely to favor allowing refusals.
The share of Americans who favor allowing religiously affiliated agencies to reject gay or lesbian couples as foster parents is similar to the share of Americans who feel the same about rejecting other groups. Around one in five Americans favor allowing these agencies to reject atheists (19%) or people who follow a different religion than the one with which the agency is affiliated (17%).
Requiring Publicly Funded Agencies to Accept Gay or Lesbian Couples as Adoptive Parents
Most Americans also oppose allowing religiously affiliated agencies that receive taxpayer money to refuse to accept qualified gay or lesbian couples as adoptive parents. Just one in five Americans favor allowing agencies to refuse to accept gay men (19%) or lesbian women (20%) as adoptive parents, while nearly eight in ten oppose refusing to accept gay or lesbian couples (78% and 77%, respectively).
Americans who are in favor of same sex marriage are also less likely to favor allowing religiously affiliated organizations that receive taxpayer funding to reject qualified gay (13%) or lesbian (12%) couples as adoptive parents. Those who oppose same sex marriage are more likely to favor rejections for gay (37%) and lesbian (38%) couples.
Around one-third of white evangelical Protestants favor allowing publicly funded, religiously affiliated agencies to reject gay men (33%) or lesbian women (32%) as adoptive parents; solid majorities of white evangelicals oppose such a policy (64% for gay men; 65% for lesbian women). Members of other religious groups are somewhat less in favor of rejecting gay or lesbian couples, including Protestants of color (23% for gay men; 25% for lesbian women), white mainline Protestants (18% for gay men; 19% for lesbian women), white Catholics (17% for gay men; 16% for lesbian women), and religiously unaffiliated Americans (13% for gay men; 13% for lesbian women).
Republicans (30% for gay men; 29% for lesbian women) are somewhat more likely than Democrats (13% for gay men; 14% for lesbian women) to favor allowing religiously affiliated agencies that receive taxpayer funding to reject qualified gay or lesbian couples as adoptive parents; solid majorities of Republicans oppose such a policy (69% for gay men; 67% for lesbian women). Independents (21% for gay men; 22% for lesbian women) are about as likely as all Americans to favor rejecting eligible gay or lesbian couples.
Similar shares of Americans favor allowing religiously affiliated organizations that receive taxpayer funding to reject qualified atheist couples (18%) or couples who follow a different religion than the agency’s affiliation (17%).
Methodology and Footnotes
METHODOLOGY
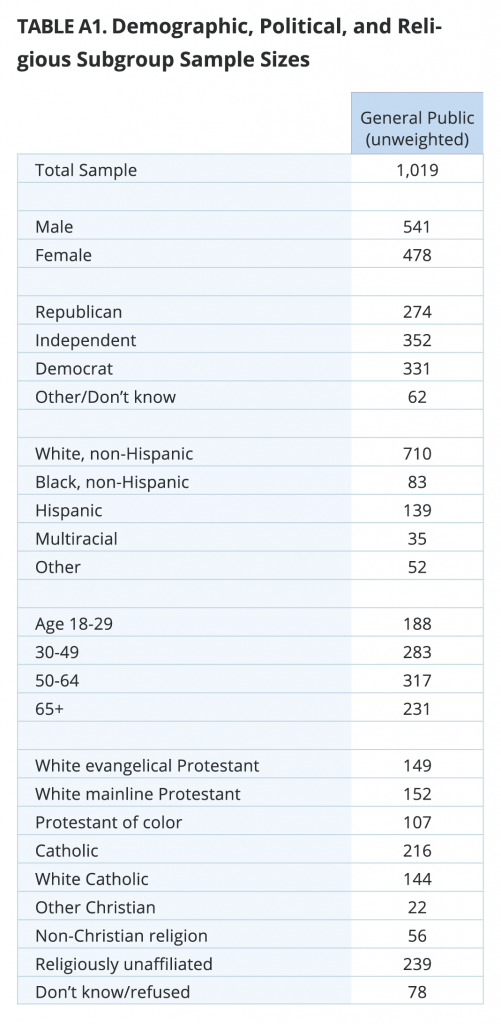
The survey was designed and conducted by PRRI among a random sample of adults (age 18 and up) living in the United States and who are part of Ipsos’s Knowledge Panel. The survey included a national sample (N=1,019) representing all 50 states. Interviews were conducted online between January 15 and 18, 2021. The survey was made possible by a generous grant from The Gill Foundation. The margin of error for the national survey is +/- 3.2 percentage points at the 95% level of confidence. The design effect for the survey is 1.1.
[1]The Republican change, from 31% in 2020 to 37% in 2021, is not statistically significant at the p<0.05 level.
[2]Sample sizes for Black Americans (N=83) and Americans who identify as another race (N=87) are <100.
[3] The difference between white and Hispanic Americans is not statistically significant.
[4] Due to small sample sizes, these differences between white evangelical Protestants, white mainline Protestants, and white Catholics are not statistically significant.


