Immigration After Trump: What Would Immigration Policy That Followed American Public Opinion Look Like?
Immigration Policy and Public Opinion
The last four years of U.S. immigration policy have been driven by the Trump administration’s aggressive stance against all types of immigration, legal and illegal.[1] President Joe Biden has promised to reverse many restrictive immigration policies from the Trump era by reforming the asylum system, raising the cap on refugee admissions, revoking the travel ban on immigrants from several Muslim-majority countries, halting the construction of a wall along the U.S. border with Mexico, suspending all deportations for the first 100 days of his presidency, making the DACA program permanent, and sending a comprehensive immigration reform bill to Congress.[2]
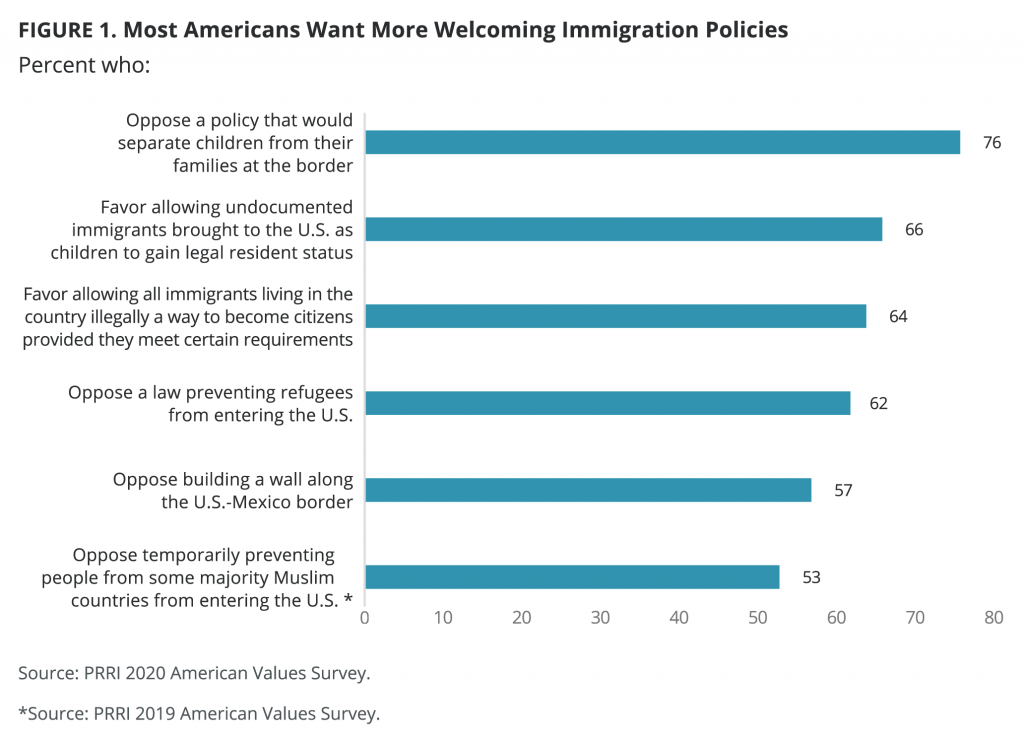
The Republican and Democratic parties offer starkly different perspectives on immigration-related issues. But what would an immigration policy that followed American public opinion look like? The short answer: American public sentiment is much closer to the policies the Biden administration is likely to implement than those put in place by the Trump administration. Sizable majorities of Americans:
- Favor allowing undocumented immigrants brought to the U.S. as children to gain legal resident status (66%)
- Favor allowing all immigrants living in the country illegally a path to citizenship provided they meet certain requirements (64%)
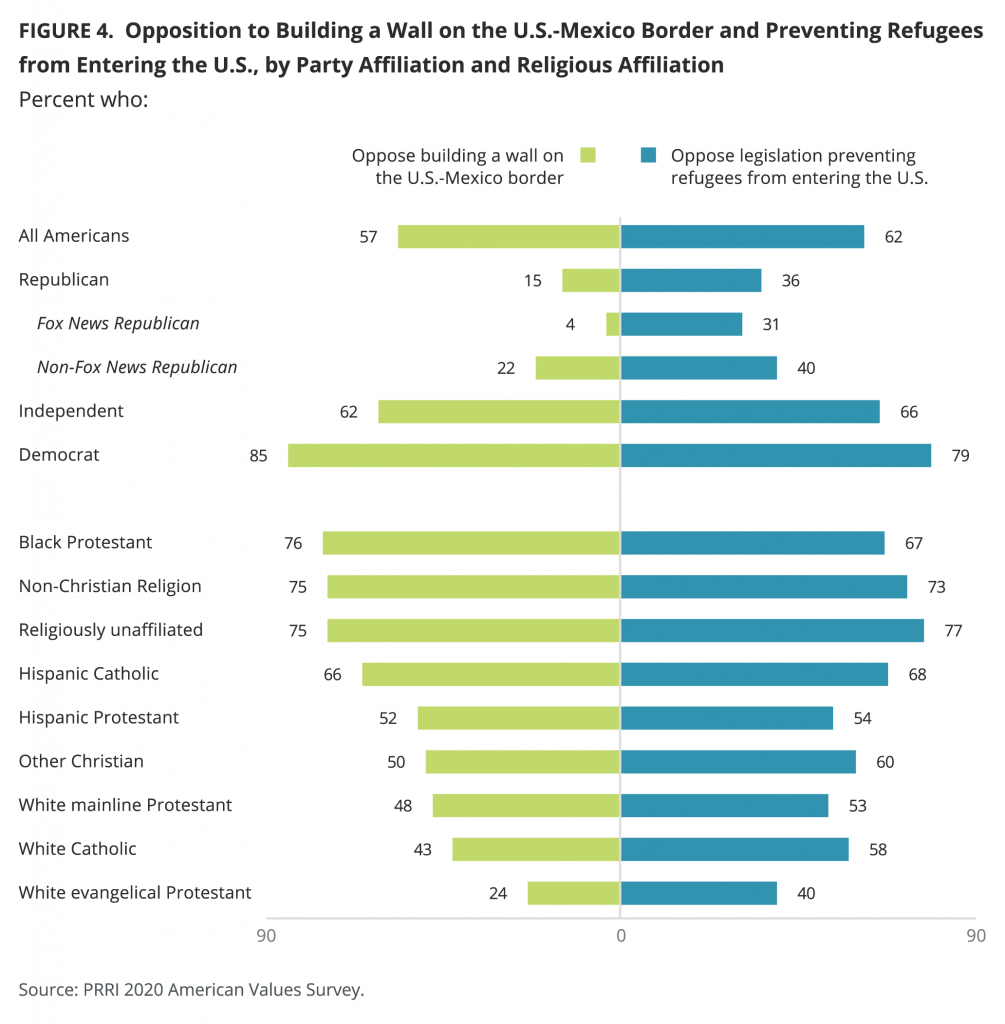
- Oppose a law preventing refugees from entering the U.S. (62%)
- Oppose building a wall along the U.S.-Mexico border (57%)
- Oppose travel bans that temporarily prevent people from some Muslim-majority countries from entering the U.S. (53%)
- Oppose a policy that would separate children from their families at the border, which was in place briefly during Trump’s term in office (76%)
DACA: Legal Resident Status for Dreamers
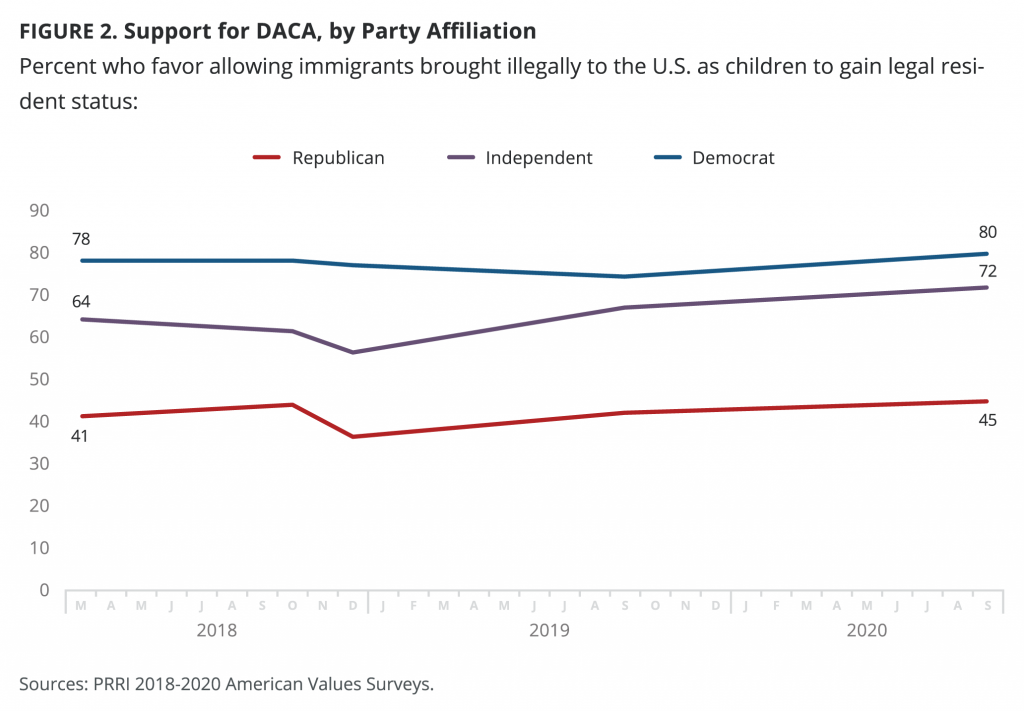
By a margin of two to one, Americans support allowing undocumented immigrants brought to the U.S. as children to gain legal resident status, the central tenet of the Deferred Action for Childhood Arrivals (DACA) policy (66% favor; 33% oppose). Support for this policy has steadily increased since March 2018 (62%), with the exception of a brief downturn in late 2018.
Democrats (80%) are notably more likely than independents (72%) and Republicans (45%) to favor this policy. Republicans have grown more supportive of DACA today (45%) than they were in March 2018 (41%), but the change is not statistically significant. Democrats are more supportive of this policy today than they were in 2019 (74%), but today’s level of support is similar to that of 2018 (78%). Support for this policy has steadily increased among independents, from 64% in 2018 to 67% in 2019 and 72% today.
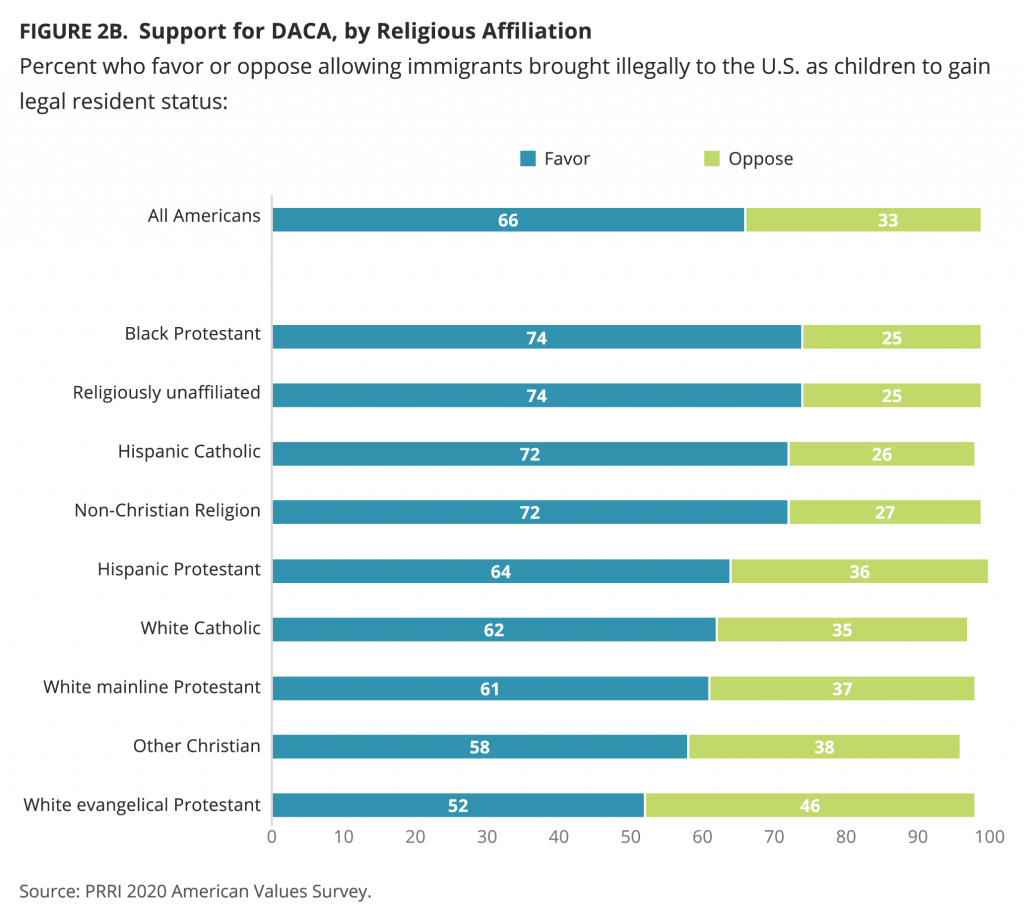
Majorities of every religious group favor DACA, including more than seven in ten religiously unaffiliated Americans (74%), Hispanic Catholics (72%), and members of non-Christian religions (72%). About six in ten Hispanic Protestants (64%), white Catholics (62%), white mainline Protestants (61%), and other Christians (58%) favor DACA, as do 52% of white evangelical Protestants.
Majorities of Hispanic Americans (70%), Black Americans (69%), white Americans (65%), and Americans who are multiracial or identify with another race (62%) favor allowing immigrants brought illegally to the United States as children to gain legal resident status. White Americans without college degrees are less likely than white Americans with college degrees to favor this policy (60% vs. 74%).
Young Americans ages 18–29 (72%) are more supportive of DACA than other age groups, including Americans ages 30–49 (64%), ages 50–64 (63%), and senior Americans ages 65 or over (67%).
A Path to Citizenship for Those Living in the U.S. Illegally
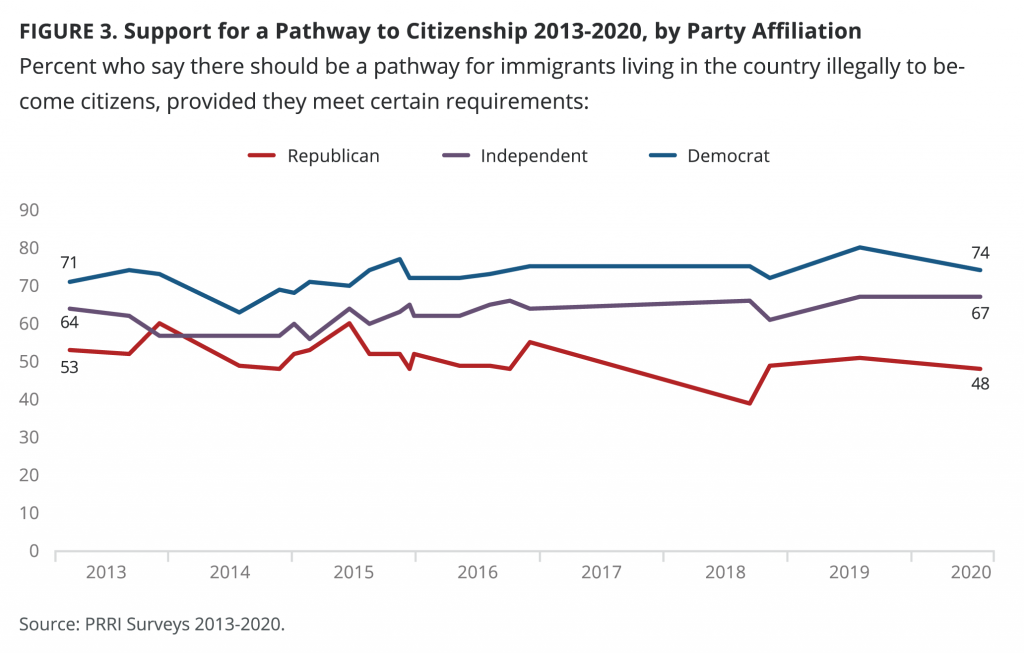
More than six in ten Americans (64%) say that immigrants living in the U.S. illegally should be allowed a way to become citizens provided they meet certain requirements, compared to 16% who say immigrants living in the U.S. illegally should be eligible for permanent resident status but not citizenship and 19% who think they should be identified and deported. These numbers have been remarkably steady since PRRI began asking the question, in 2013.
Democrats (74%) are more likely than independents (67%) and Republicans (48%) to say that immigrants living in the U.S. illegally should be allowed a way to become citizens. Partisan attitudes on this question have remained mostly stable over the last eight years. Republicans have grown slightly less supportive of this policy, from 53% in February 2013, when the question was first asked, to 48% today. There are no significant changes among Democrats and independents during this period.
Majorities of every religious group believe undocumented immigrants should have an opportunity to become U.S. citizens, including about three in four religiously unaffiliated Americans (73%) and about two-thirds of members of non-Christian religions (66%), white mainline Protestants (65%), and Black Protestants (63%). Majorities of Hispanic Catholics (61%), white Catholics (59%), white evangelical Protestants (58%), and other Christians (56%) also support a path to citizenship. Among religious groups, Hispanic Protestants (50%) are least supportive of this policy. Support for this policy among both Hispanic Protestants and Hispanic Catholics has steadily declined since February 2013, when the question was first asked (71% and 74%, respectively). Support among other religious groups has remained stable over time.
About two-thirds of white Americans (65%), Americans who are multiracial or identify as another race (64%), Black Americans (63%), and Hispanic Americans (61%) favor a policy that would offer undocumented immigrants a pathway to citizenship. Notably, Hispanic Americans declined in their support for this policy since 2019 (74%). White Americans (22%) are more likely than Black Americans (15%) and Hispanic Americans (12%) to say all immigrants living in the U.S. illegally should be deported. Among whites, those without a college degree are significantly more likely than those with a four-year college degree to say undocumented immigrants should be deported (26% vs. 15%). White men are also more likely than white women to favor deportation (25% vs. 18%).
Opposition to Preventing Refugees From Entering the U.S.
A majority of Americans oppose passing a law to prevent refugees from entering the United States (62%), compared to just over one-third who support it (36%). Opposition to and support for this policy has remained stable since 2017 (59% vs. 36%).
There are stark partisan divisions. Republicans (36%) are about half as likely as independents (66%) and Democrats (79%) to oppose the passage of a law that would prevent refugees from entering the United States; 61% of Republicans favor such a policy. Democrats are notably more likely to oppose this policy today than they were in 2017 (72%), while opposition among Republicans and independents remains stable (39% and 63%, respectively).
White evangelical Protestants stand out as the only religious group among whom a majority favor this policy (40% oppose; 58% favor). Majorities of almost all religious groups oppose passing legislation that prevents refugees from entering the United States, including large shares of the religiously unaffiliated (77%), members of non-Christian religions (73%), Hispanic Catholics (68%), Black Protestants (67%), other Christians (60%), and Hispanic Protestants (54%). Majorities of white Catholics (58%) and white mainline Protestants (53%) also oppose legislation banning refugees.
Even though a majority of white Americans (59%) oppose a ban on refugees entering the U.S., they are less likely to oppose it than Americans who are multiracial or identify as another race (69%), Hispanic Americans (67%), and Black Americans (66%). White Americans with college degrees are more likely than white Americans without college degrees to oppose this policy (71% vs. 52%).
A substantial majority of Americans ages 18–29 (73%) oppose passing a law to prevent refugees from entering the United States, compared to two-thirds of Americans ages 30–49 (66%) and 54% of Americans ages 50–64. A majority of Americans ages 65 and over (54%) also oppose the policy, but this is less than the share of people in this age group who opposed it in 2019 (63%).
Americans living in states that border Mexico are more likely to oppose this policy than Americans living elsewhere (67% vs. 61%).
Building a Wall on America’s Southern Border
Nearly six in ten Americans (57%) oppose building a wall along the U.S. border with Mexico , while about four in ten support this policy (42%). Opinion about this policy has remained stable since 2016 (58% opposed; 41% supported).
Not surprisingly, more than eight in ten Republicans support Trump’s border wall idea (84%), while a similar number of Democrats oppose it (85%). Independents roughly mirror Americans in general (62% oppose; 38% support).
Majorities of Christians of color and non-Christian religious groups oppose building a wall along the U.S.-Mexico border, including Black Protestants (76%), members of non-Christian religions (75%), religiously unaffiliated Americans (75%), Hispanic Catholics (66%), and approximately half of Hispanic Protestants (52%) and other Christians (50%). Opposition dips below half among white Christian groups, including white mainline Protestants (48%), white Catholics (43%), and white evangelical Protestants (24%).
White Americans are almost evenly divided between opposition and support for building the wall (51% vs. 48%). Majorities of all other racial and ethnic groups oppose building a wall along the U.S.-Mexico border, including Black Americans (74%), Americans who are multiracial or identify as another race (70%), and Hispanic Americans (65%). White Americans’ opposition to this policy varies by education and gender: 63% with a college degree and 44% without a college degree oppose this policy, as do 46% of white men and 55% of white women.
More than six in ten young adults ages 18–29 (64%) and Americans ages 30–49 (61%) oppose the construction of a wall along the U.S.-Mexico border, compared to about half of middle-aged Americans ages 50–64 (50%) and senior Americans ages 65 and over (53%).[3]
Ban on Travel From Select Muslim-Majority Countries
Shortly after his inauguration in 2017, Trump signed an executive order that temporarily banned travel from seven predominantly Muslim countries. In 2019, Americans were divided over the travel ban, with 45% favoring such a policy and 53% opposing it.
Republicans predominantly favor a Muslim travel ban (74%), while Democrats are much less supportive (27%) and independents fall in the middle (41%). Republicans who most trust Fox News (84%) overwhelmingly favor the travel ban, compared to two-thirds (67%) of Republicans who get their news elsewhere.
Religious groups are also deeply divided over the travel ban. White evangelical Protestants (69%) are most supportive, followed by other Christians (58%), white mainline Protestants (54%), and white Catholics (52%). Less than half of Hispanic Protestants (49%), non-Christian religious Americans (40%), Black Protestants (39%), Hispanic Catholics (32%), and religiously unaffiliated Americans (25%) favor a Muslim travel ban.
Black Americans (40%) and Hispanic Americans (37%) are less likely than white Americans (49%) to favor Trump’s Muslim travel ban.
Separating Children From Their Families
The short-lived Trump administration policy of separating children from their families at the border receives little support among Americans. More than three-quarters of Americans (76%) oppose an immigration border policy that separates children from their parents and charges parents as criminals when they enter the country without permission, compared to less than one in four (23%) who favor such a policy. Such strong opposition to this policy has remained stable since it was introduced, in 2018.
Americans across the partisan spectrum oppose this family separation policy, including majorities of Republicans (53%), independents (79%), and nearly all of Democrats (91%). This is also true among majorities of members of all religious groups, including white evangelical Protestants (63%). Notably, the only group in which the majority supports immigrant family separations are Republicans who trust Fox News the most to provide accurate information about politics and current events (53%).
Most Black Americans (85%), Hispanic Americans (75%), white Americans (75%), and Americans who are multiracial or identify as another race (73%) oppose such family separations. Notably, white women (80%) are more opposed to this policy than white men (69%).
Immigration as a Critical Issue
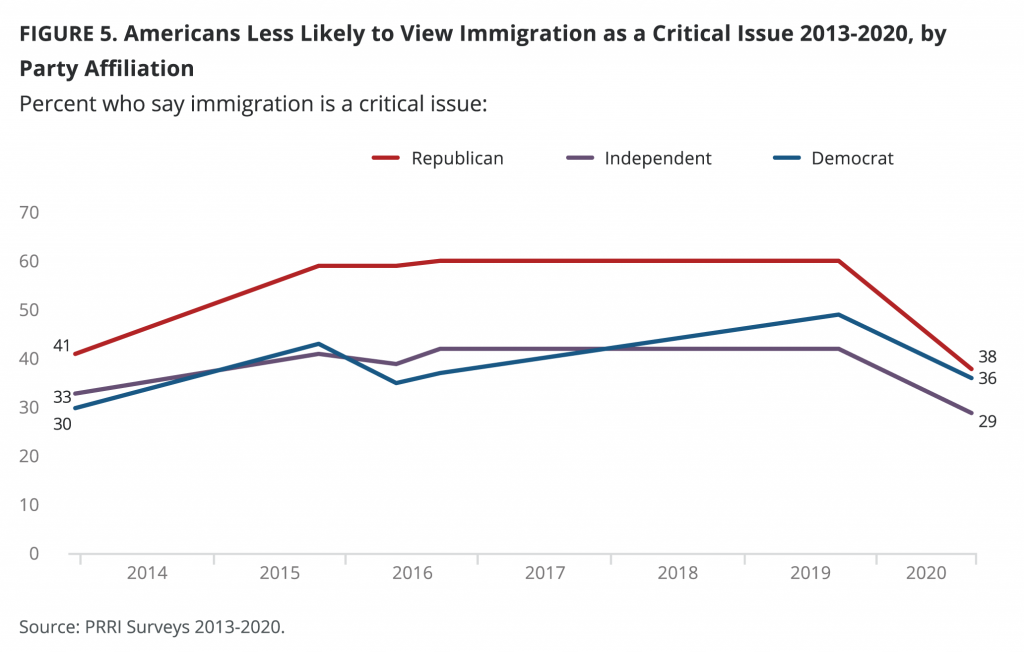
Today, one-third of Americans (33%) rate immigration as a critical issue, 52% say it is one of many important issues, and only 14% say it is not important at all. The importance of immigration has declined significantly since 2019, when nearly half of Americans (49%) said immigration was a critical issue. Moreover, the 2020 number represents the lowest proportion of Americans who see immigration as a critical issue since PRRI first asked this question, in 2013.
For most of the last decade, by double-digit margins, Republicans have been more likely than Democrats to say immigration is a critical issue. But today, about four in ten of both Republicans (38%) and Democrats (36%) say that immigration is a critical issue, compared to nearly three in ten independents (29%). Republicans who most trust Fox News to provide accurate information about politics and current events are notably more likely than Republicans who most trust other media sources to say that immigration is a critical issue (48% vs. 31%).
About four in ten Hispanic Americans (42%) and Americans who are multiracial or identify as another race (38%), as well as about one-third of Black (34%) and white Americans (31%), say immigration is a critical issue.
Americans living in states that share a border with Mexico, including California, Texas, New Mexico, and Arizona, are more likely than Americans living elsewhere to say that immigration is a critical issue (38% vs. 32%).
Perceptions of Immigrants as a Threat to American Culture
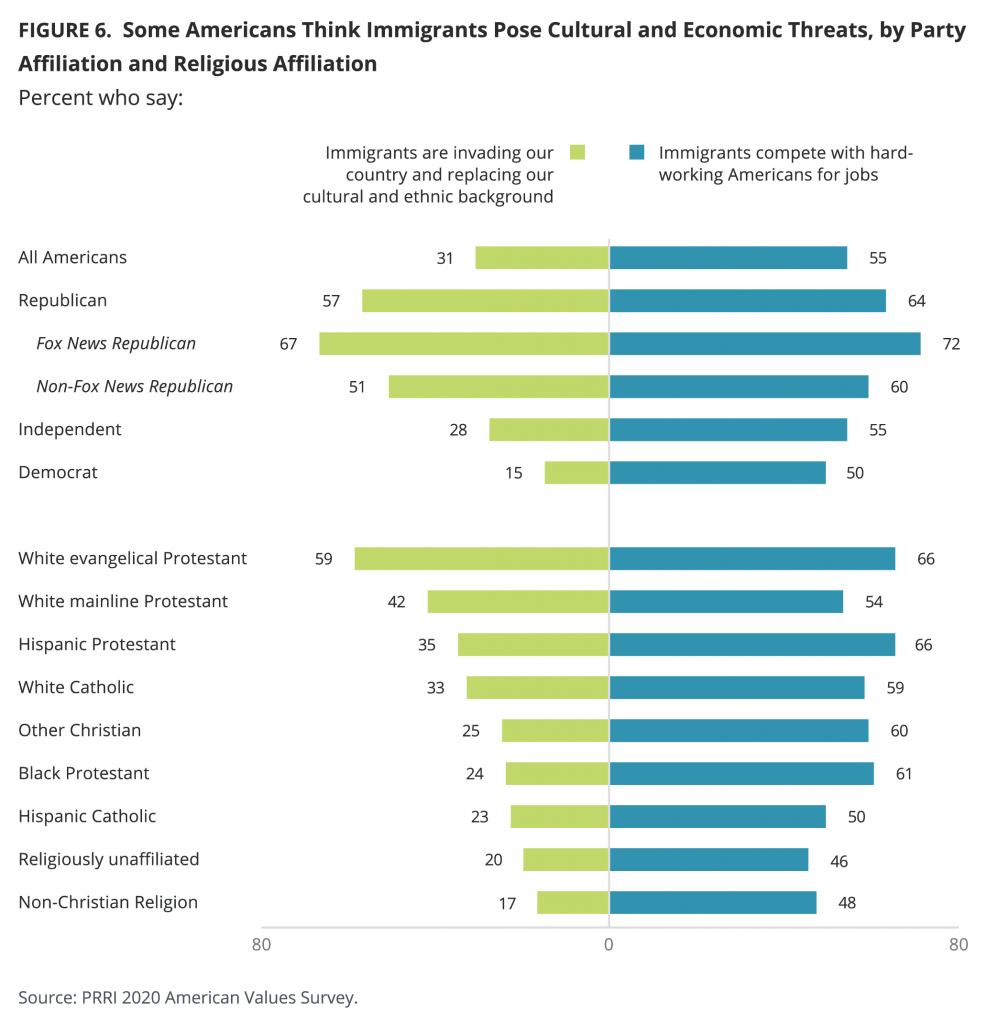
About three in ten Americans agree with the statement “immigrants are invading our country and replacing our cultural and ethnic background” (31%), compared to two-thirds who disagree (68%).
There are stark partisan divides on this question. While a majority of Republicans agree with the statement that immigrants are invading America (57%), only 15% of Democrats and 28% of independents think the same. Republicans who trust Fox News most to provide accurate information about politics and current events are particularly more likely to agree with this statement than Republicans who trust different sources (67% vs. 51%).
White evangelical Protestants stand out as the most likely religious group to say that immigrants are invading the United States (59%). Fewer members of other religious groups agree, including white mainline Protestants (42%), Hispanic Protestants (35%), white Catholics (33%), other Christians (25%), Black Protestants (24%), Hispanic Catholics (23%), religiously unaffiliated Americans (20%), and members of non-Christian religions (17%).
White Americans (36%) are notably more likely than Black Americans (24%), Hispanic Americans (24%), and Americans who are multiracial or identify with another race (18%) to agree that immigrants are invading the country and replacing cultural values. Educational attainment separates whites, as those without college degrees are about twice as likely as those with college degrees to agree that immigrants are invading the United States (44% vs. 23%).
Agreement with the statement that immigrants are invading and replacing American culture increases as age increases: 22% of Americans ages 18–29, 26% of Americans ages 30–49, 37% of Americans ages 50–64, and 41% of Americans ages 65 and over agree with this statement.
Americans living in states that share a border with Mexico are less likely to agree with the statement that immigrants are invading and replacing American culture than those who live elsewhere (25% vs. 33%)..
Perceptions of Immigrants a Threat to American Workers
A majority of Americans (55%) say that the phrase “compete with hardworking Americans for jobs” describes immigrants who are coming to the United States today either somewhat or very well, compared to 44% who say this phrase describes immigrants not too well or not at all well.
Even though more Republicans (64%) say that immigrants compete with hardworking Americans for jobs, half of Democrats (50%) and a majority of independents (55%) also agree. Republicans who trust Fox News the most are notably more likely to say the statement describes immigrants somewhat or very well than Republicans who trust other sources most (72% vs. 60%).
There are no strong patterns among religious groups. With the exceptions of Hispanic Catholics (50%), members of non-Christian religions (48%), and religiously unaffiliated Americans (46%), majorities of members of other religious groups agree with the idea that immigrants compete with hardworking Americans for jobs.
Majorities of Americans across all racial groups say that immigrants compete with hard working Americans for jobs: 61% of Black Americans, 56% of Hispanic Americans, 54% of Americans who are multiracial or identify as another race, and 53% of white Americans. White Americans without college degrees are notably more likely than those with college degrees to agree that immigrants compete with hardworking Americans for jobs (60% vs. 42%). White men are also more likely than white women to agree with this statement (58% vs. 50%).
Americans who live in states that share a border with Mexico are notably less likely to say that immigrants compete with hardworking Americans for jobs than Americans living elsewhere (50% vs. 57%).
Survey Methodology and Footnotes
The survey was designed and conducted by PRRI. The survey was made possible by a generous grant from the Carnegie Corporation of New York, with additional support from the Ford Foundation, the Wilbur and Hilda Glenn Family Foundation, and the Unitarian Universalist Veatch Program at Shelter Rock. Interviews were conducted among a random sample of 2,538 adults (ages 18 and older) living in the United States, including all 50 states and the District of Columbia. Interviews were conducted both online using a self-administered design and by telephone using live interviewers. All interviews were conducted among participants in AmeriSpeak, a probability-based panel designed to be representative of the national U.S. adult population, run by NORC at the University of Chicago. Interviewing was conducted in both Spanish and English between Sept. 9 and Sept. 22, 2020. The margin of error, including the design effect, for the survey is +/- 2.6 percentage points at the 95% level of confidence.
A supplemental survey of 1,070 adults using the same methodology was conducted Oct. 9–12, 2020, to assess likely turnout, presidential candidate choice, and motivation for voting (for/against the candidate). The margin of error, including the design effect, for that survey is +/- 4.0 percentage points at the 95% level of confidence.
[1] https://www.prri.org/research/a-nation-of-immigrants-diverging-perceptions-of-immigrants-increasingly-marking-partisan-divides//
[2] https://www.washingtonpost.com/graphics/2020/politics/biden-immigration/?itid=sn_transfer%20of%20power_2/
[3] Data for this question is from the PRRI 2019 American Values Survey; all others are from the PRRI 2020 American Values Survey.


