More Acceptance but Growing Polarization on LGBTQ Rights: Findings From the 2022 American Values Atlas
Introduction
For the past several years, PRRI’s American Values Atlas survey has asked a series of questions to assess the attitudes of Americans regarding three key policy areas related to LGBTQ rights:
- Laws that would protect gay, lesbian, bisexual, and transgender people against discrimination in jobs, public accommodations, and housing
- Allowing a small business owner in your state to refuse to provide products or services to gay or lesbian people if doing so would violate their religious beliefs
- Allowing gay and lesbian couples to marry legally
The issue of same-sex marriage has been included in the survey since 2014, and the other two have been included since 2015. Currently, despite a complicated policy landscape, support for nondiscrimination protections and support for same-sex marriage, along with opposition to allowing religiously based service refusals, are at or near all-time highs. In December 2022, President Joe Biden signed the Respect for Marriage Act, which legally recognizes same-sex marriage at the federal level.[1] This legislation was drafted after Supreme Court Justice Clarence Thomas argued in a concurring opinion that the Supreme Court should “reconsider” the 2015 Obergefell v. Hodges decision, which struck down state-level bans on same-sex marriage.[2] Meanwhile, however, there have been more than 300 bills introduced in state legislatures across the country that seek to roll back the rights of LGBTQ Americans.[3]
Profile of LGBTQ Americans
Demographics
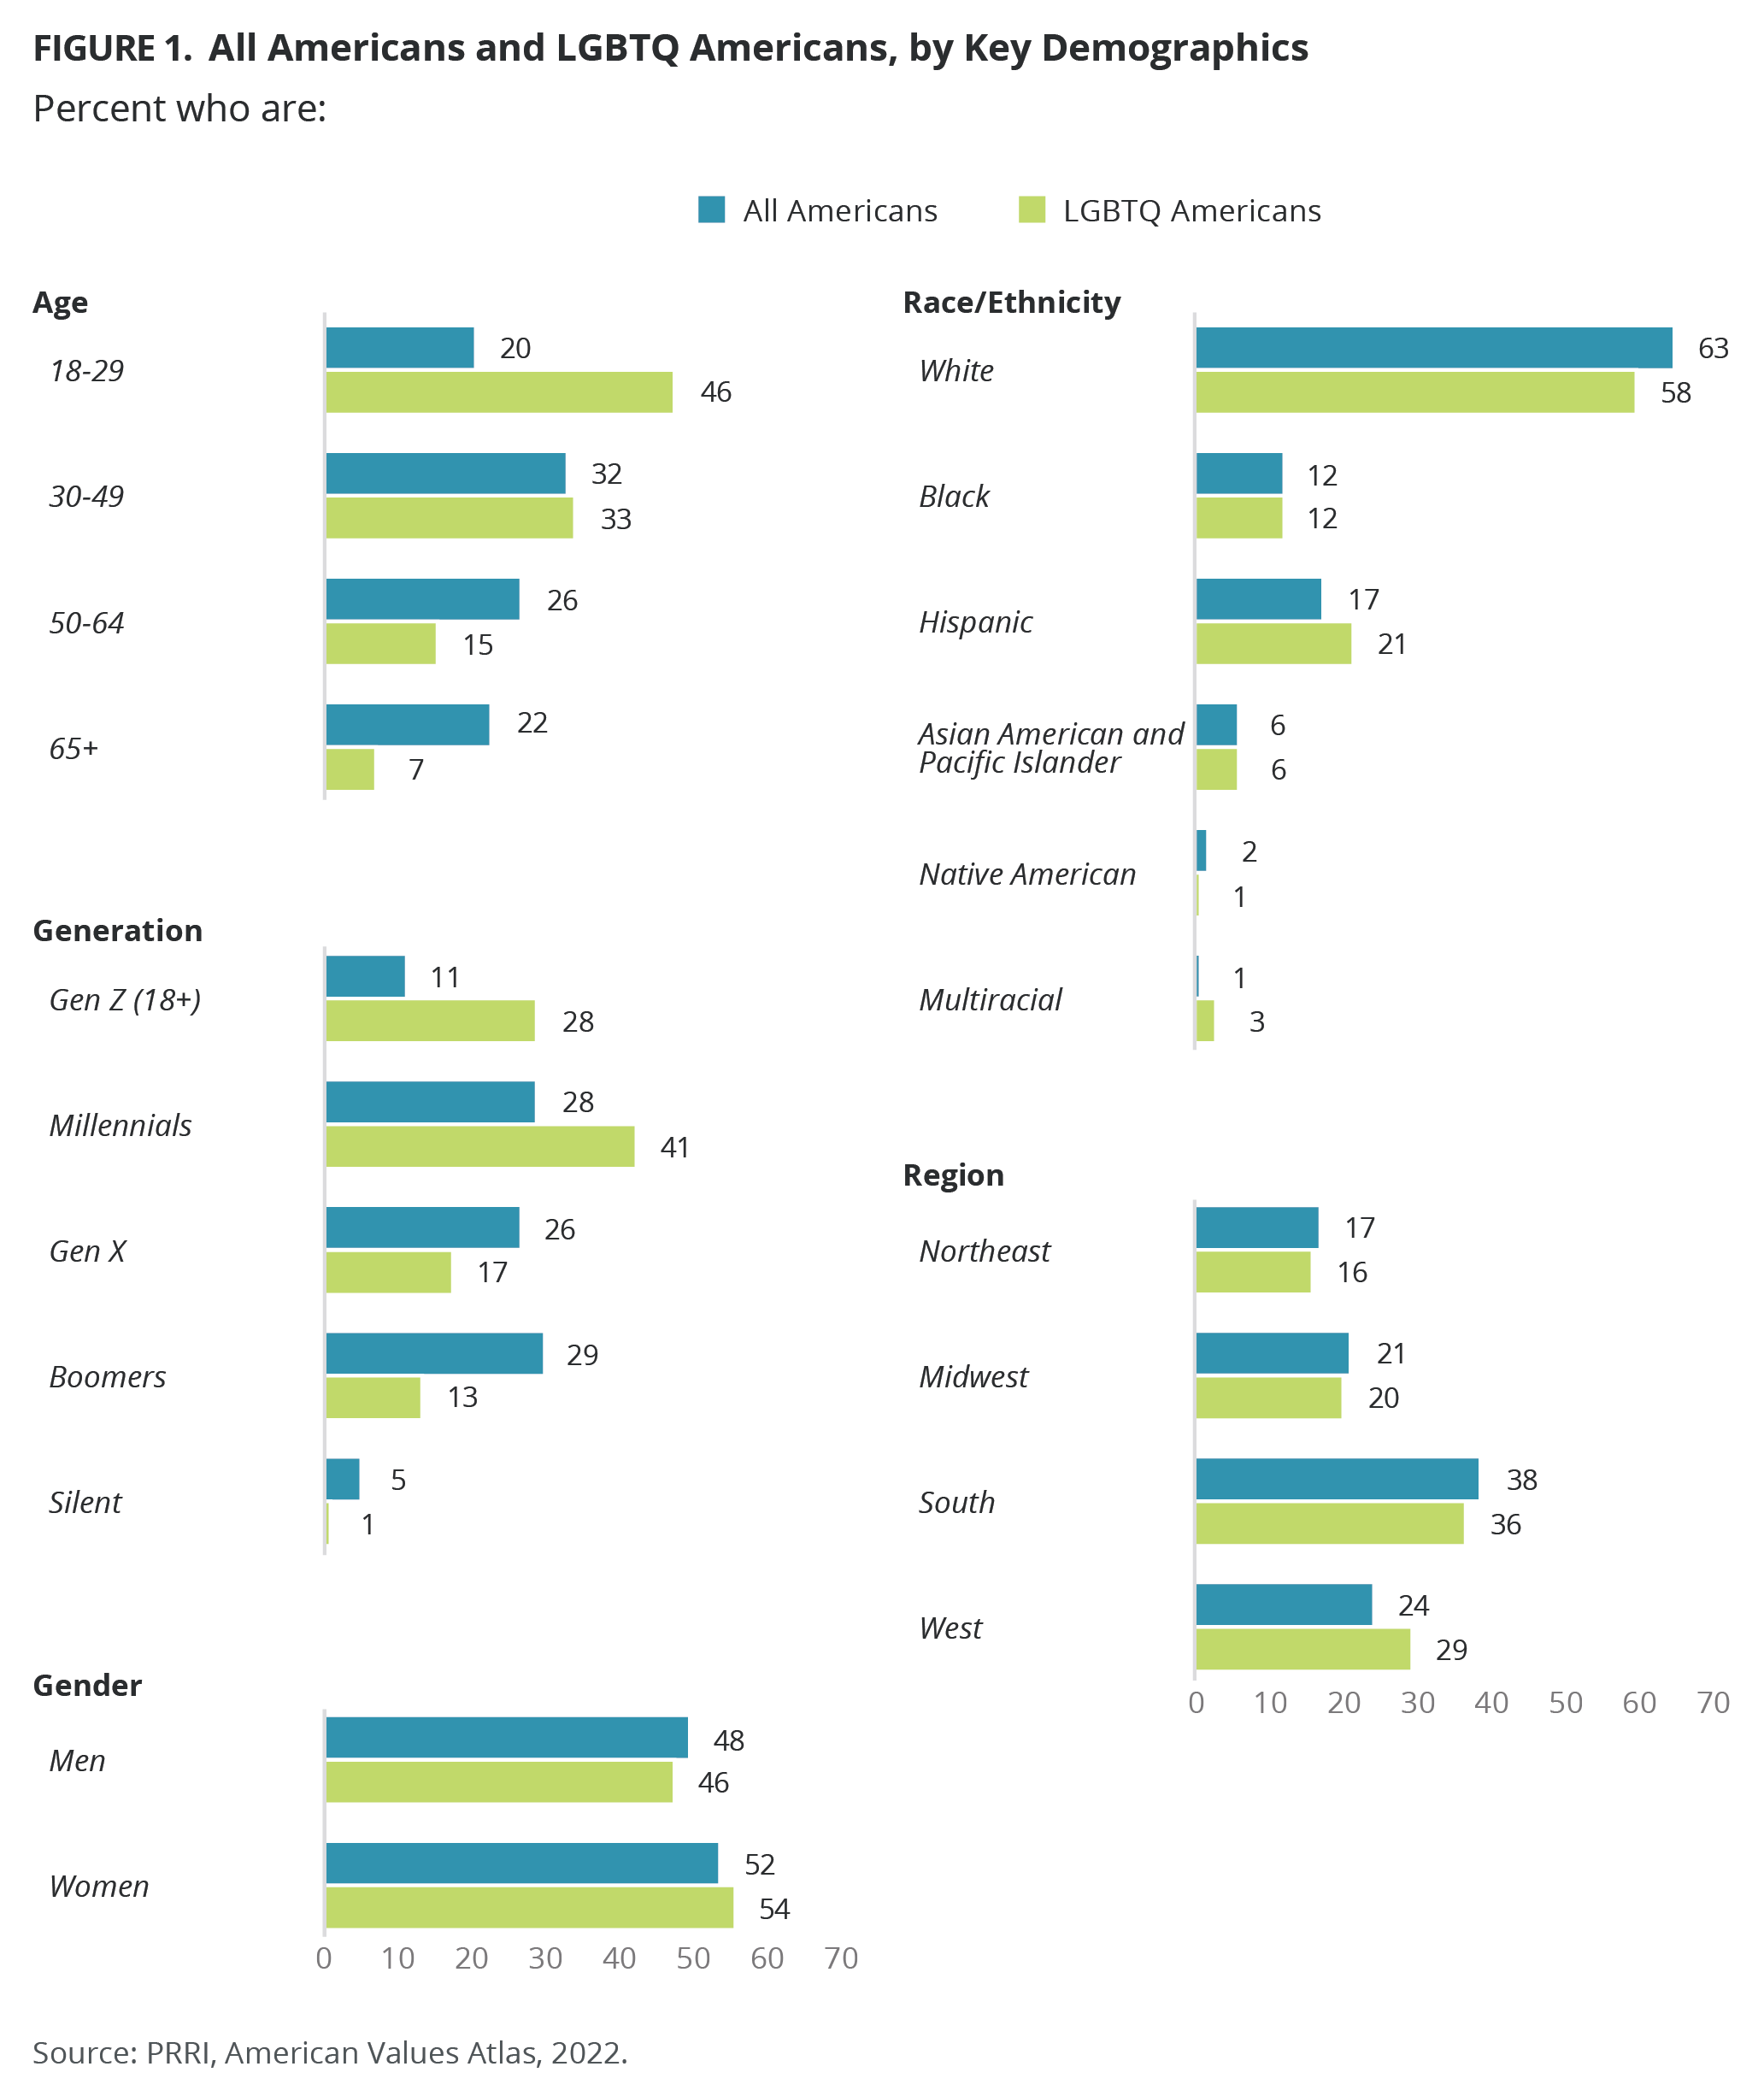
According to the 2022 American Values Atlas, 10% of Americans identify as LGBTQ, including 3% who identify as gay or lesbian, 4% who identify as bisexual, and 2% who identify as something else.
Americans who identify as LGBTQ mirror the American population on many demographics. However, they are more likely to be Democrat, liberal, and religiously unaffiliated. They also tend to be younger and have a lower income.
Age and Generation
LGBTQ Americans are more than twice as likely as the general population to be under age 30 and to belong to Generation Z. Among Americans who identify as LGBTQ, nearly half (46%) are young adults (ages 18–29), one-third (33%) are ages 30–49, 15% are ages 50–64, and 7% are seniors (ages 65 and older), compared with 20%, 32%, 26%, and 22%, respectively, of all Americans. In addition, nearly three in ten LGBTQ Americans belong to Generation Z (28%), around four in ten are millennials (41%), 17% are Generation X, 13% are baby boomers, and only 1% belong to the Silent Generation, compared with 11%, 28%, 26%, 29%, and 5%, respectively, of all Americans.[4]
Young Americans (23%) are more than twice as likely to identify as LGBTQ as Americans of any other age group, including those ages 30–49 (10%), those ages 50–64 (6%), and seniors (3%). Similarly, 25% of Generation Z Americans identify as LGBTQ, a significantly higher proportion than among millennials (15%), Generation X (7%), boomers (4%), and the Silent Generation (2%).
Race and Ethnicity
Compared to all Americans, LGBTQ Americans are more likely to be Hispanic (21% vs. 17%) and are less likely to be white (58% vs. 63%), though whites do make up the majority of the LGBTQ community. While 12% of LGBTQ Americans identify as Black, less than ten percent are Asian American and Pacific Islander (AAPI) (6%), multiracial (3%), or Native American (1%).
Meanwhile, about one in ten Hispanic Americans (13%), Black Americans (10%), AAPI (10%), and white Americans (9%) identify as LGBTQ, as do 6% of Native Americans. Among multiracial Americans, 22% identify as LGBTQ.
Geography
More than a third of LGBTQ Americans live in the South (36%), while 29% live in the West. A smaller proportion of LGBTQ Americans live in the Midwest (20%) and in the Northeast (16%). The five states that are home to the largest shares of LGBTQ Americans are California (14%), Texas (8%), Florida (6%), New York (6%), and Illinois (4%).
Party Affiliation and Political ideology
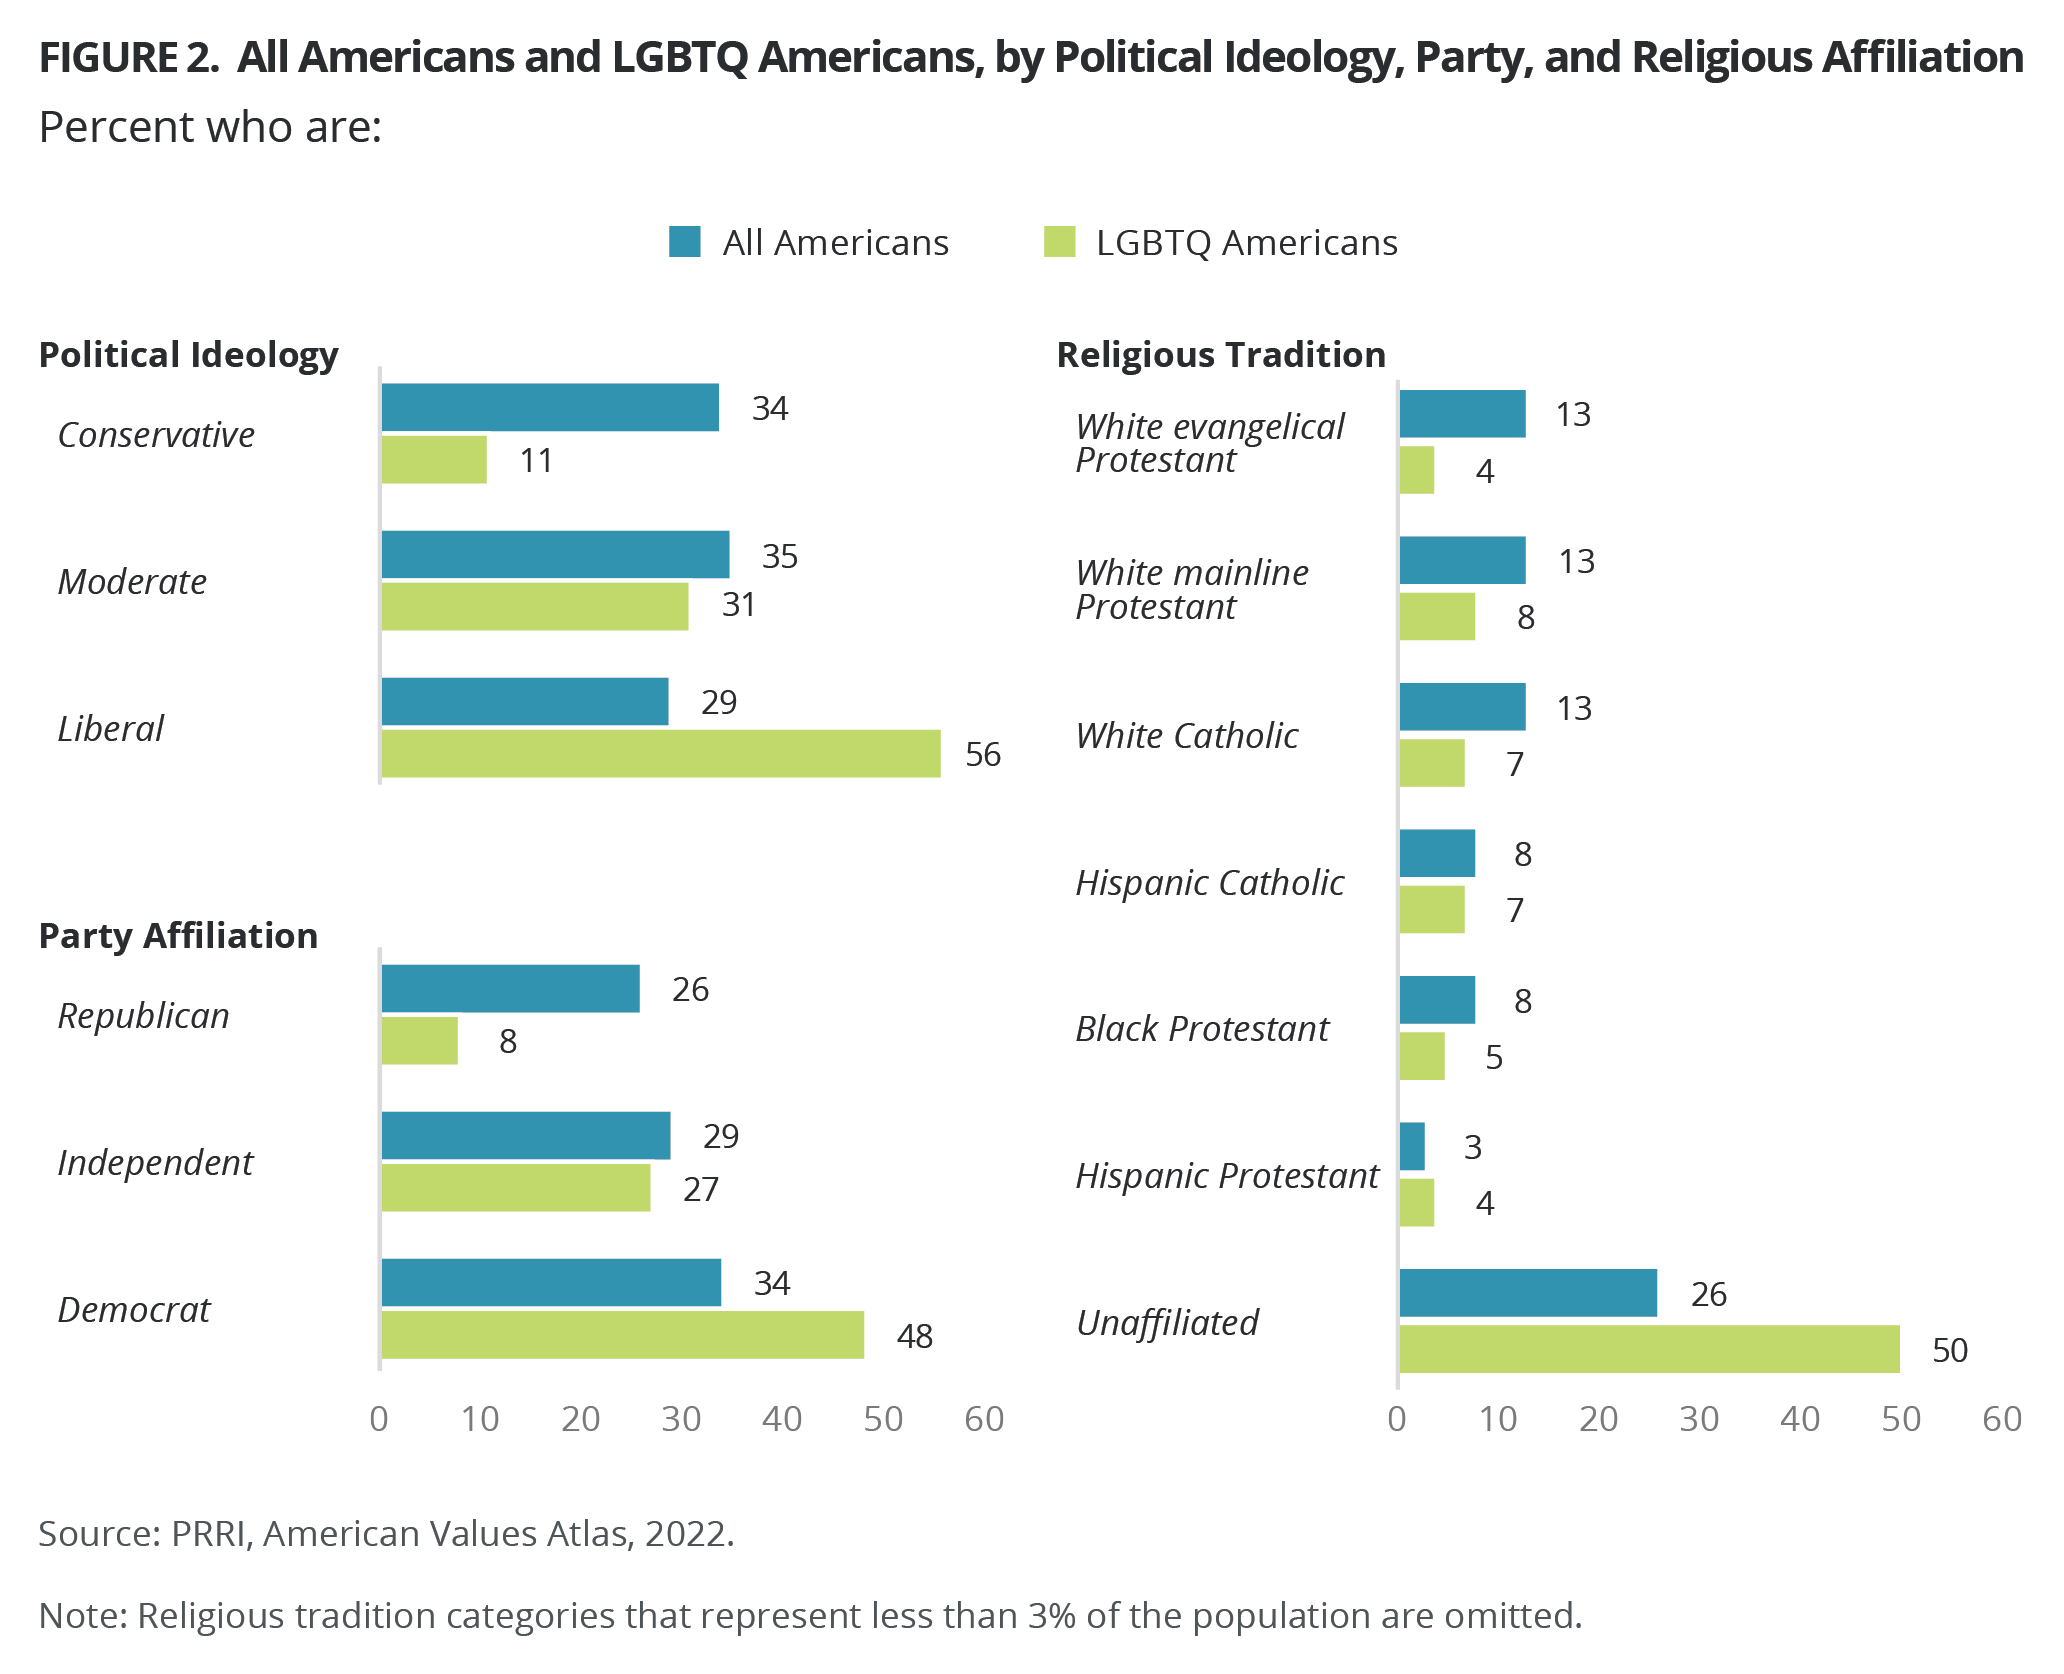
LGBTQ Americans are six times as likely to identify as Democrats (48%) as they are to identify as Republicans (8%). By contrast, 34% of all Americans identify as Democrats and 26% identify as Republicans. About one in three Americans identify as independents (29%), as do a similar proportion of LGBTQ Americans (27%). Only 3% of Republicans identify as LGBTQ, compared with 9% of independents and 14% of Democrats.
The majority of LGBTQ Americans (56%) identify as liberal, compared with 31% who identify as moderate, and only 11% who identify as conservative. By contrast, among all Americans, more than one-third identify as conservative (34%) or moderate (35%), while 29% identify as liberal. Only 3% of conservatives identify as LGBTQ, compared with 9% of moderates and 19% of liberals.
Religious Affiliation
LGBTQ Americans are nearly twice as likely as the general population to identify as religiously unaffiliated (50% vs. 26%). Likewise, compared to all Americans, LGBTQ Americans are half as likely to identify as white mainline Protestant (8% vs. 13%) or white Catholic (7% vs. 13%) and one-third as likely to identify as white evangelical Protestant (4% vs. 13%). The religious affiliation gap between LGBTQ Americans and all Americans is much less pronounced among nonwhite Christian groups.
About two in ten non-Christians identify as LGBTQ. This includes 19% of Unitarian Universalists, 19% of the religiously unaffiliated, 15% of Buddhists, 11% of Jews, 9% of Muslims, 5% of Hindus, and 32% of members of other non-Christian religions. Members of Christian religious traditions are less likely to identify as LGBTQ, with the exception of Hispanic Protestants (12%).
Support for Nondiscrimination Protections for LGBTQ People
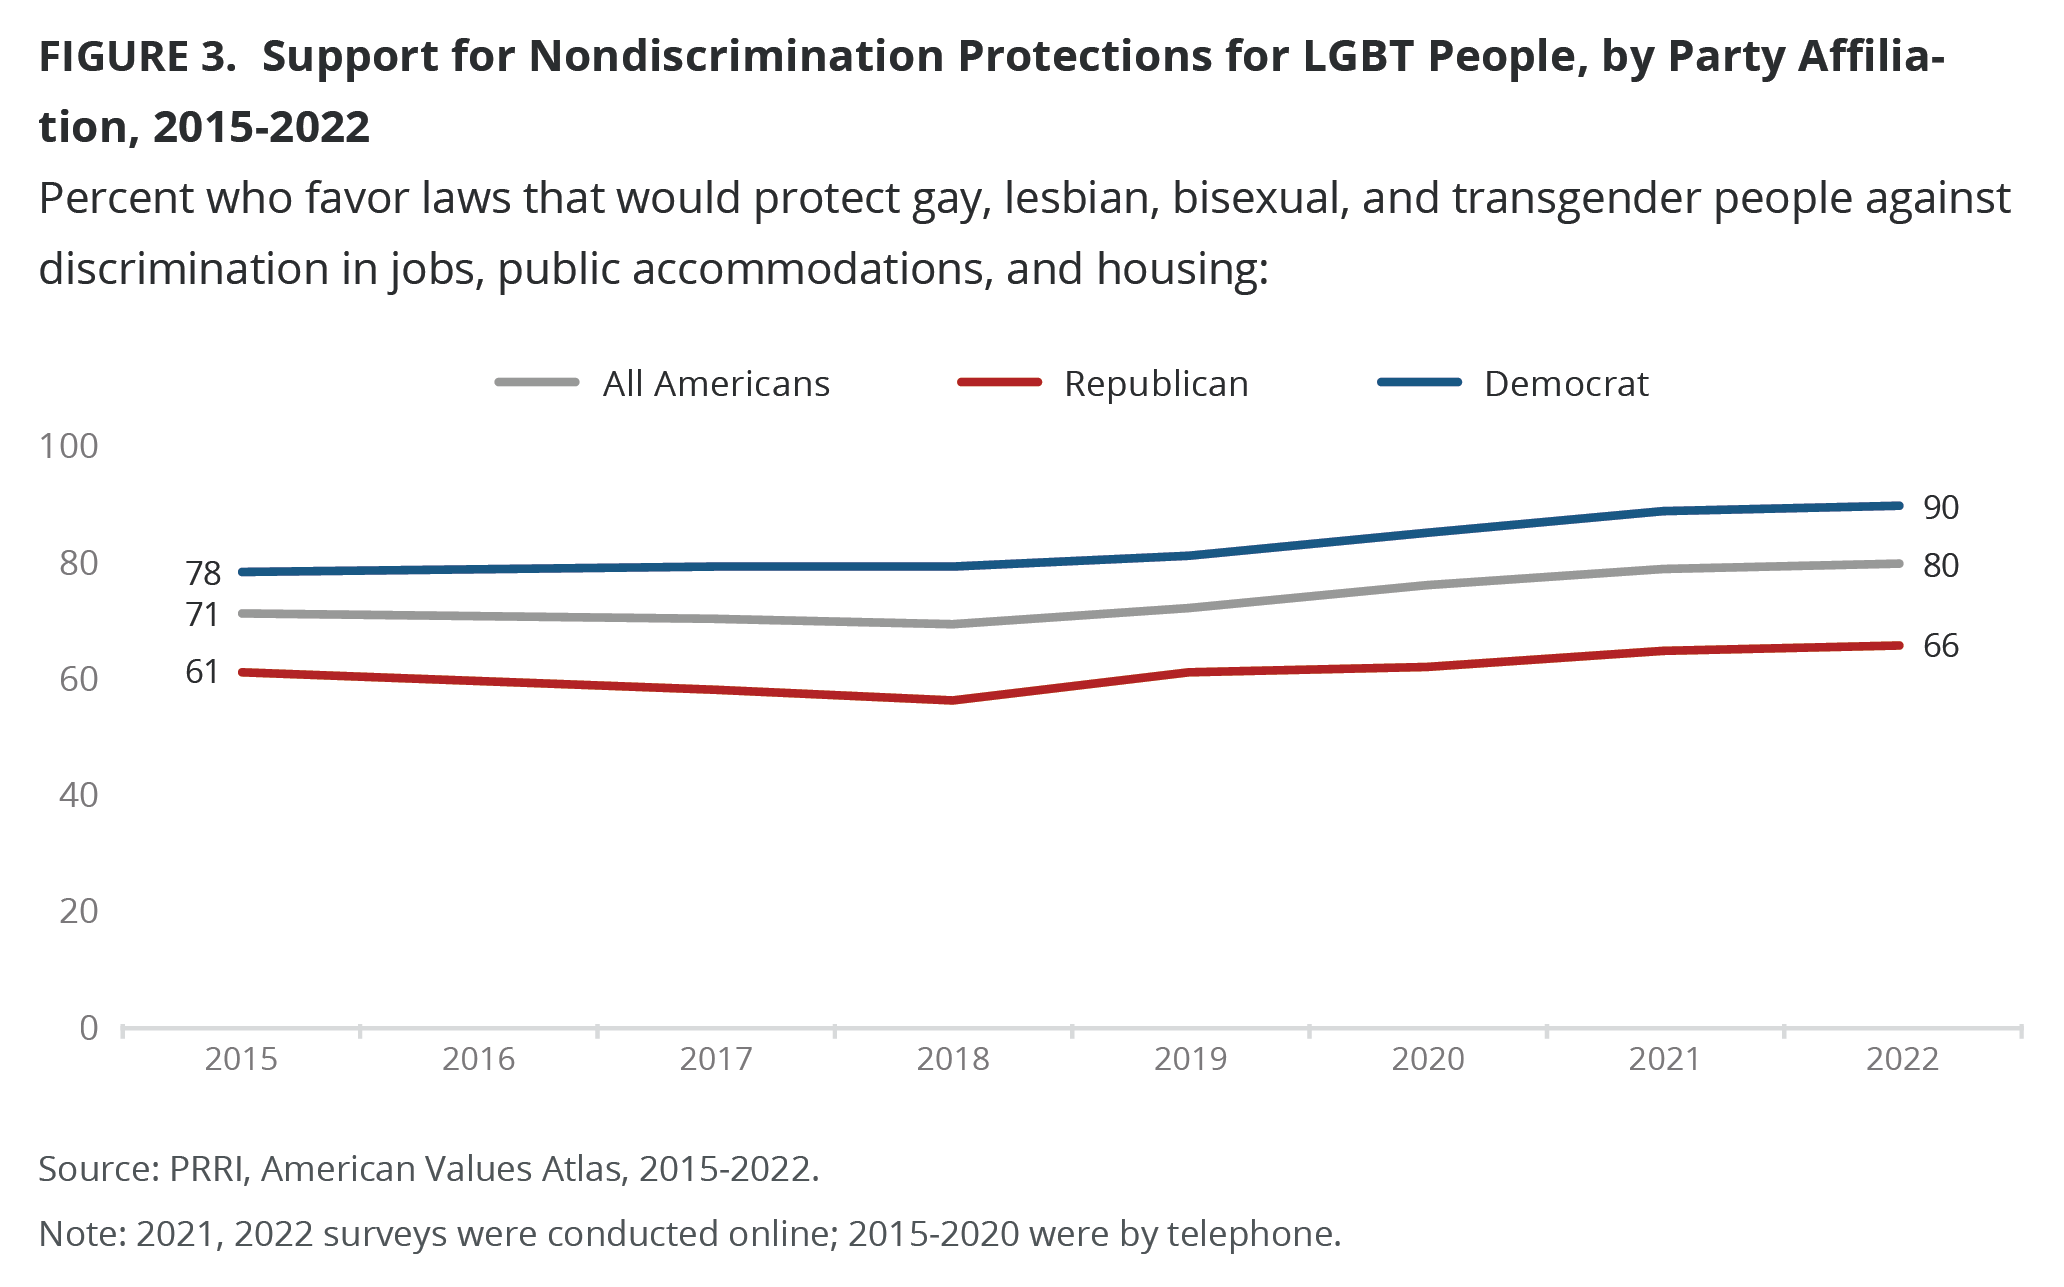
Eight in ten Americans (80%) favor laws that would protect gay, lesbian, bisexual, and transgender people against discrimination in jobs, public accommodations, and housing. This includes 48% who strongly support such laws. About one in five Americans (18%) oppose these laws, including 7% who strongly oppose them. Support for these protections has increased over the past few years: around seven in ten Americans favored nondiscrimination provisions in 2015 (71%), 2017 (70%), 2018 (69%), and 2019 (72%), before rising to 76% in 2020 and 79% in 2021.[5]
Overwhelming shares of Democrats (90%) and independents (82%), as well as two-thirds of Republicans (66%), favor nondiscrimination provisions for LGBTQ people. Since 2015, support has increased by 12 percentage points among Democrats (78% to 90%) and nine percentage points among independents (73% to 82%). Support among Republicans has increased by five percentage points (61% to 66%).
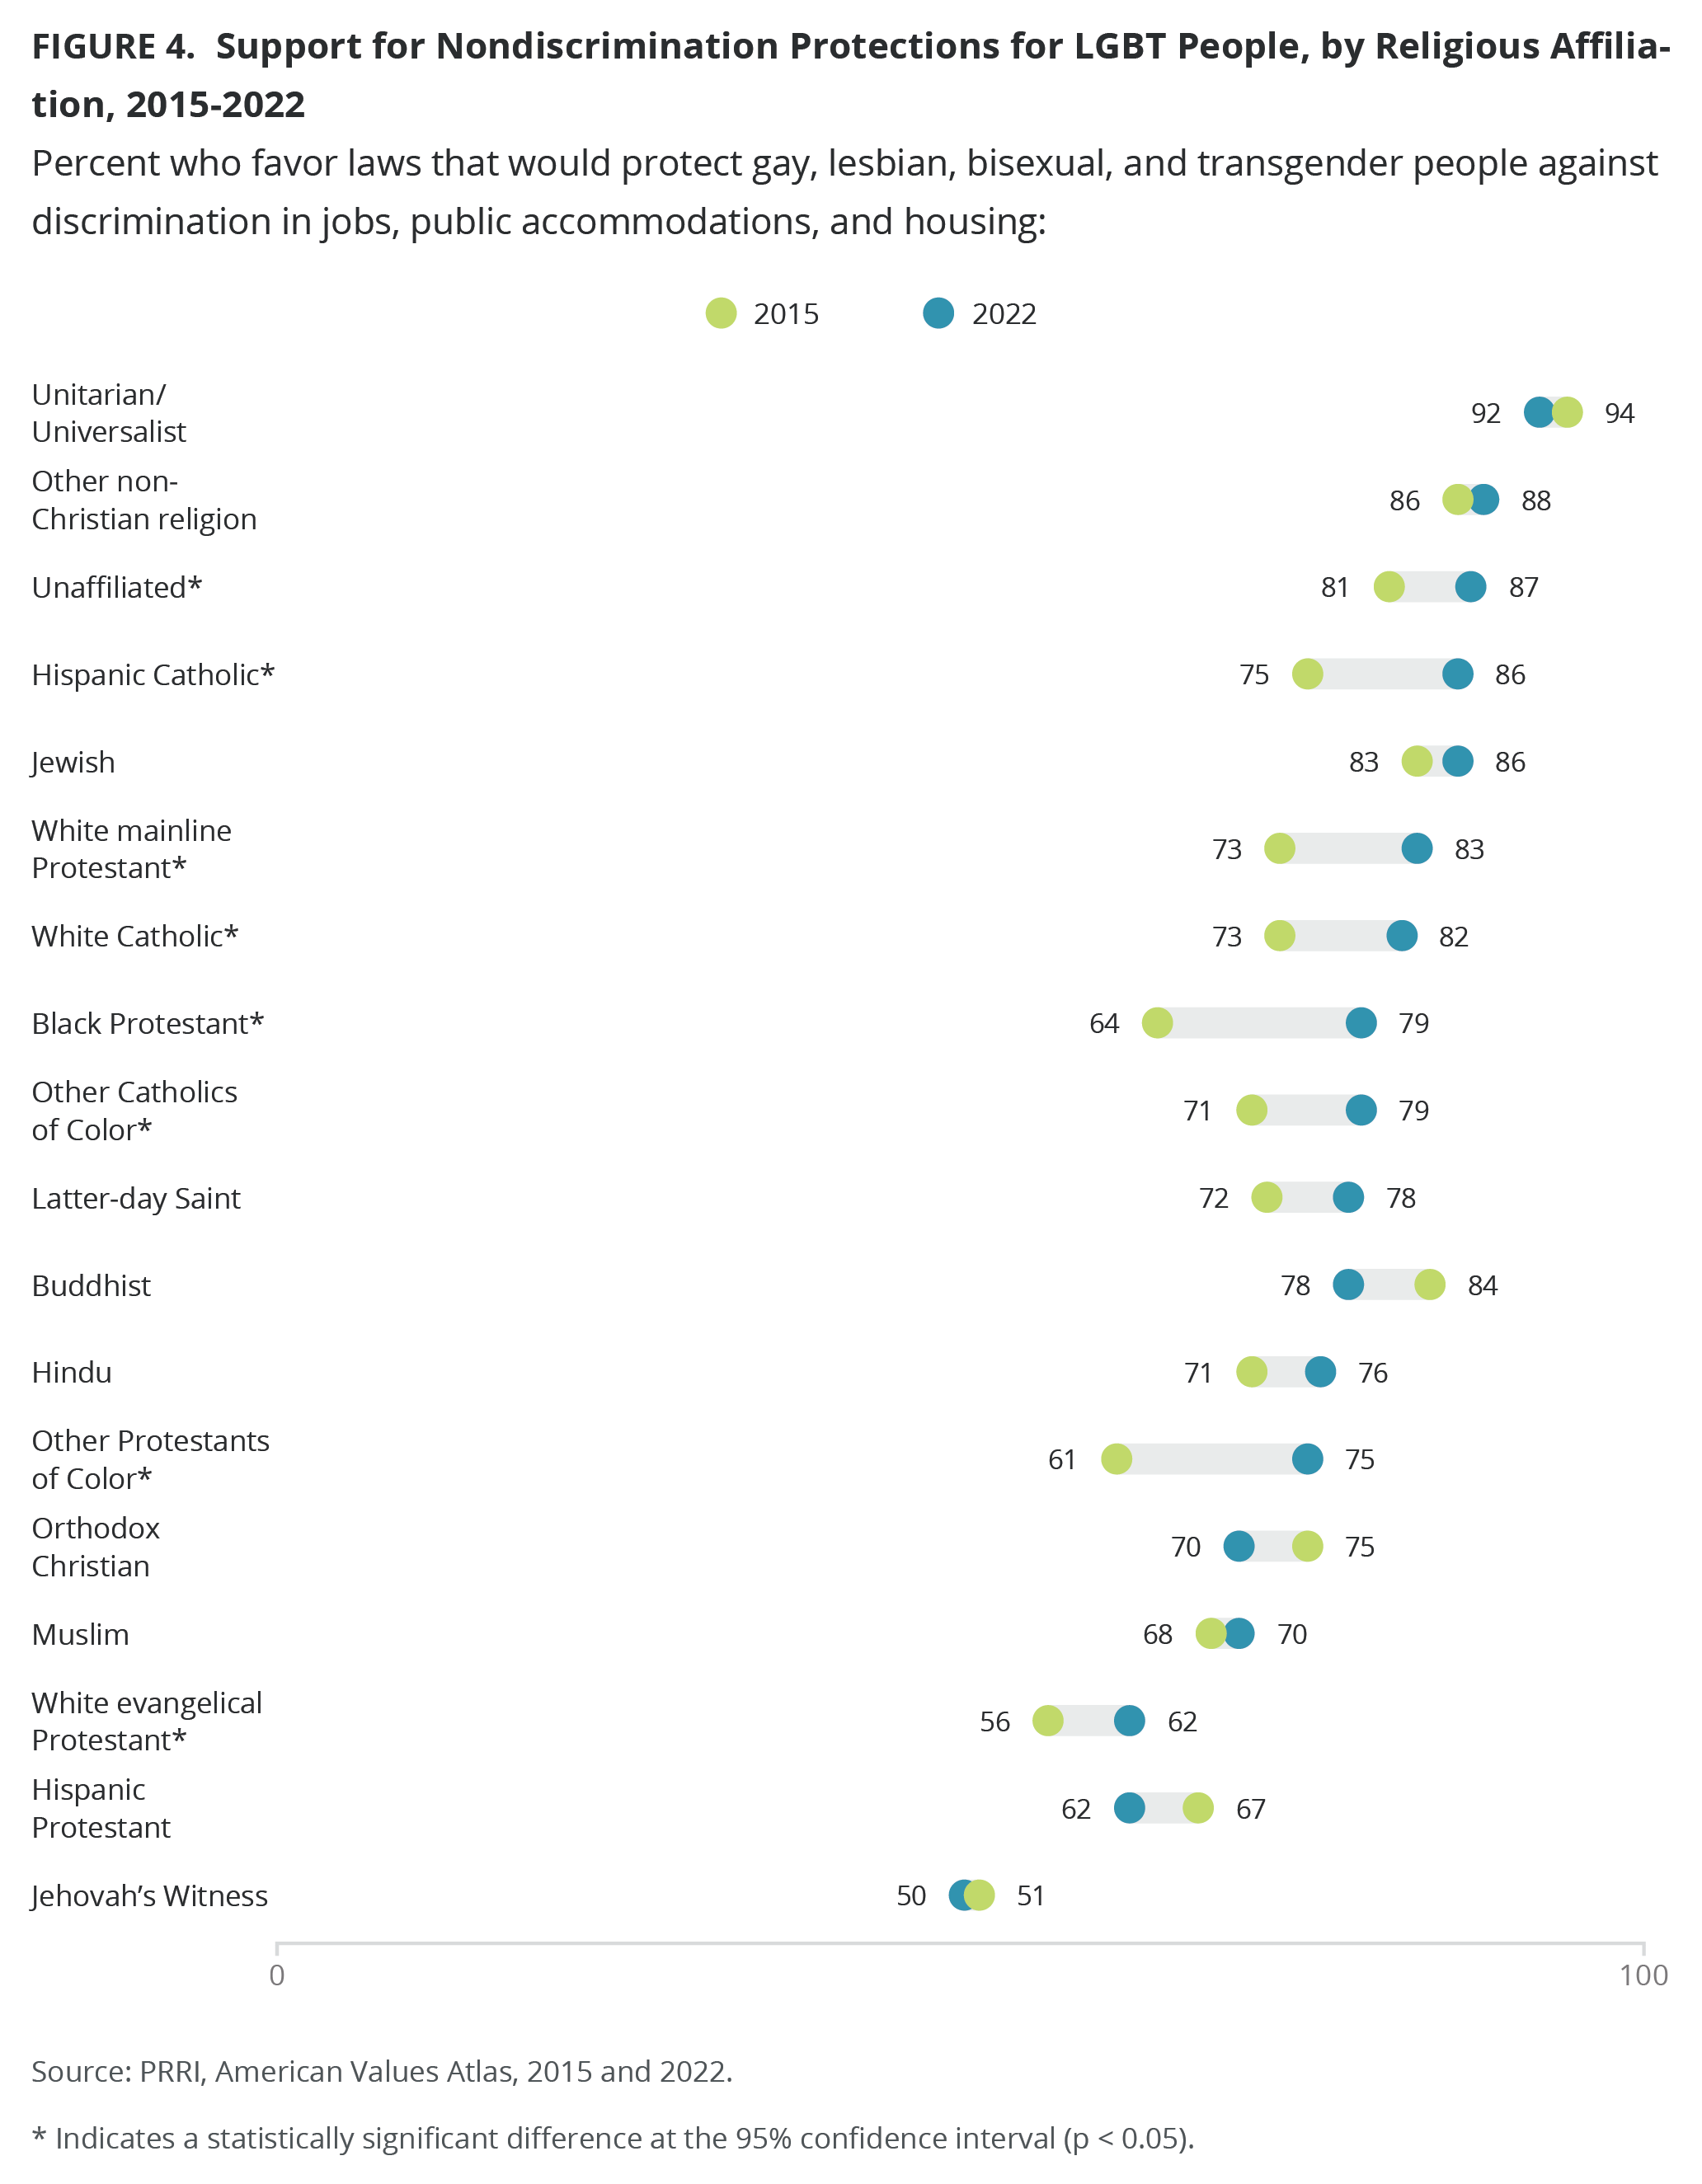
Vast majorities of most major religious groups support nondiscrimination protections for LGBTQ people. This includes nearly all Unitarian Universalists (92%), members of other non-Christian religions (88%), religiously unaffiliated Americans (87%), Hispanic Catholics (86%), Jewish Americans (86%), white mainline Protestants (83%), and white Catholics (82%). At least three in four Black Protestants (79%), other Catholics of color (79%), Latter-day Saints (78%), Buddhists (78%), Hindus (76%), and other Protestants of color (75%) support nondiscrimination laws to protect LGBTQ people. In addition, seven in ten Orthodox Christians (70%) and Muslims (70%) support such laws.[6] A smaller majority of Hispanic Protestants (62%) and white evangelical Protestants (62%) also support nondiscrimination protections for LGBTQ people. Jehovah’s Witnesses are the religious group whose members are the least likely to support such protections, with support at 50%. Among almost all these groups, support has either increased or not seen a substantial change since 2015. Only Hispanic Protestants have decreased in support since 2015.
Majorities of almost every major racial and ethnic group support nondiscrimination protections for LGBTQ people. This includes AAPI (82%), white Americans (80%, up from 71% in 2015), Hispanic Americans (79%, up from 74% in 2015), Black Americans (75%, up from 65% in 2015) and multiracial Americans (79%, up from 72% in 2015).[7] Majorities of white Americans across educational lines support nondiscrimination protections for LGBTQ people, though whites with a college degree (87%, up from 80% in 2015) are more likely than whites without a degree (76%, up from 67% in 2015) to support these provisions.
While the majority of Americans support nondiscrimination policies protecting LGBTQ people, the percentage increases with the level of formal education: 73% of Americans with a high school diploma or less favor protections (up from 63% in 2015), as do 79% of Americans with some college education (up from 73% in 2015), 86% of Americans with a college degree (up from 78% in 2015), and 88% of Americans with postgraduate education (up from 82% in 2015).
While there are not substantial differences by age overall, Republicans ages 18–29 (63%) are notably less likely than Republicans ages 65 and over (68%) to support nondiscrimination provisions for LGBTQ people.
Women (81%) are slightly more likely than men (77%) to support these policies. While there are no differences between Democratic men (90%) and Democratic women (91%), Republican women (70%) are notably more likely than Republican men (63%) to support nondiscrimination protections for LGBTQ people. Independent women (84%) are slightly more likely to be supportive than independent men (81%).
Although residents of states in the South are slightly less likely to support nondiscrimination laws than the rest of the country, there are significant increases across regions since 2015. Most Americans who reside in the Northeast support these protections (82%, up from 76% in 2015), as do a majority of people in the West (81%, up from 75%), the Midwest (80%, up from 71%), and the South (77%, up from 66%).
In the five states with the highest rates of support for nondiscrimination protections, well above eight in ten people express support. And the support has increased significantly since 2015 in these states: District of Columbia (89%, up from 73% in 2015), New Hampshire (88%, up from 80%), Virginia (88%, up from 68%), Vermont (87%, up from 76%), and Connecticut (86%, up from 78%).
Notably, in the five states with the lowest levels of support for nondiscrimination laws, about two-thirds of people still favor such laws. These states include Alabama (69% support), South Carolina (68%), Nebraska (67%), South Dakota (67%), and Oklahoma (65%). Among these states, only Alabama has significantly shifted since 2015, when support was at 56%.
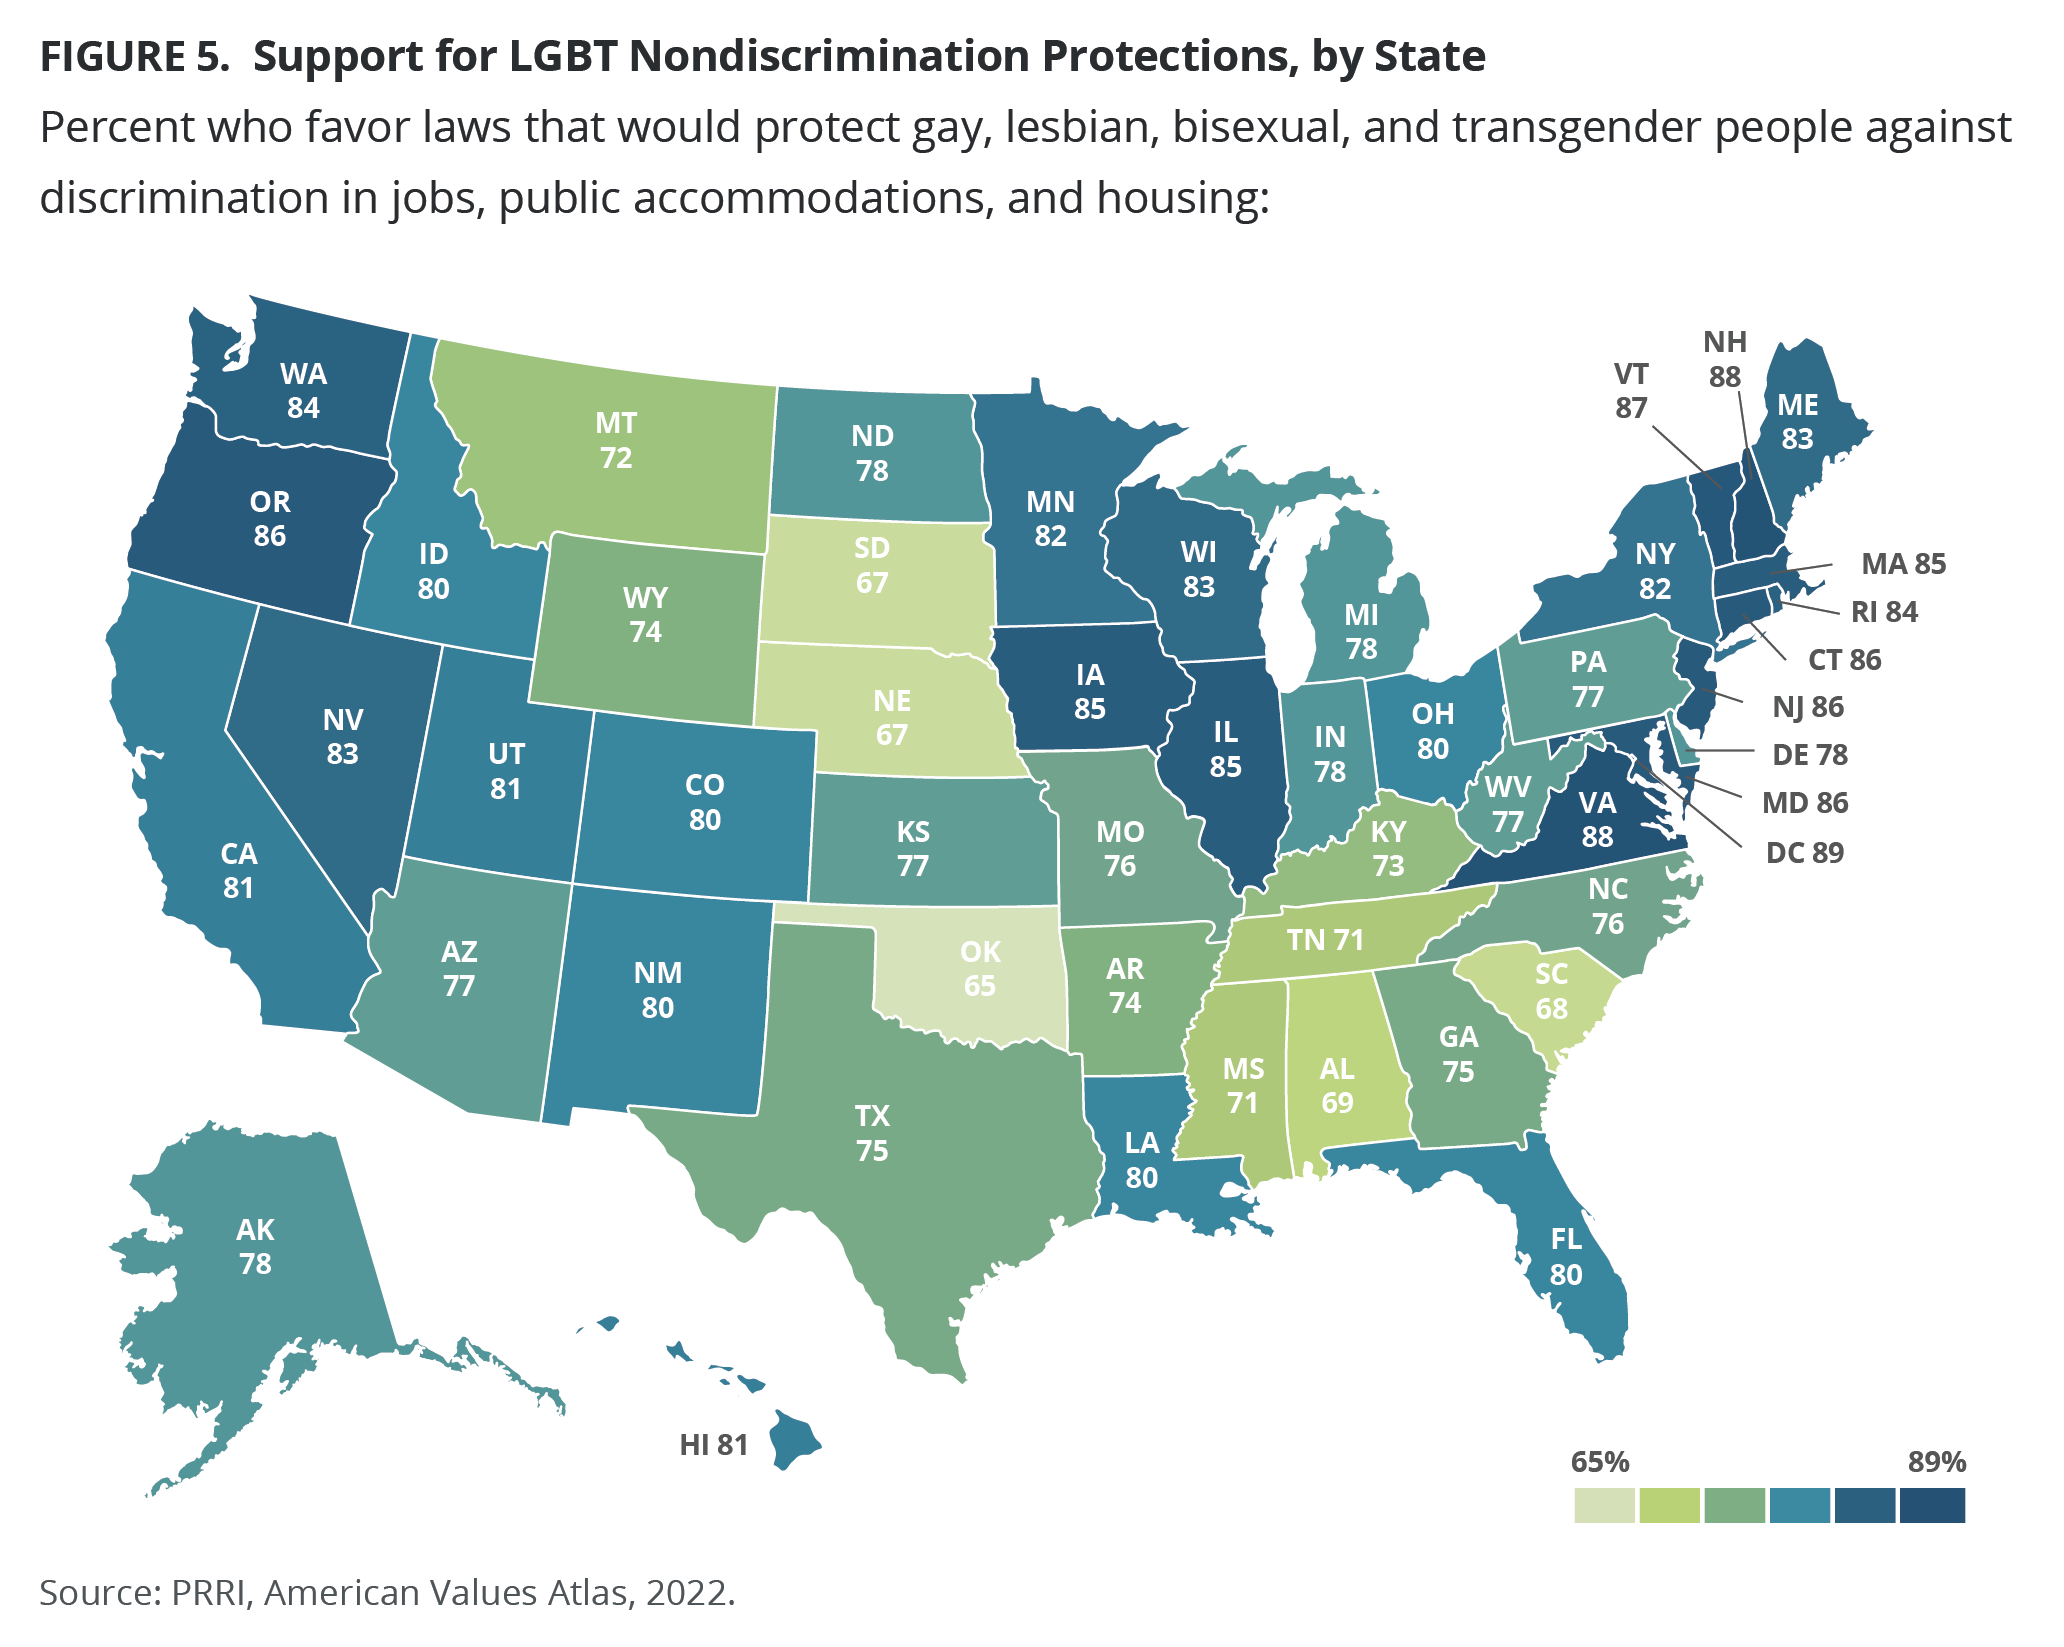
Americans who reside in states with nondiscrimination protections in place for LGBTQ people are more likely than those who reside in states without those protections to favor such laws (82% vs. 76%).[8]
Religiously Based Service Refusals
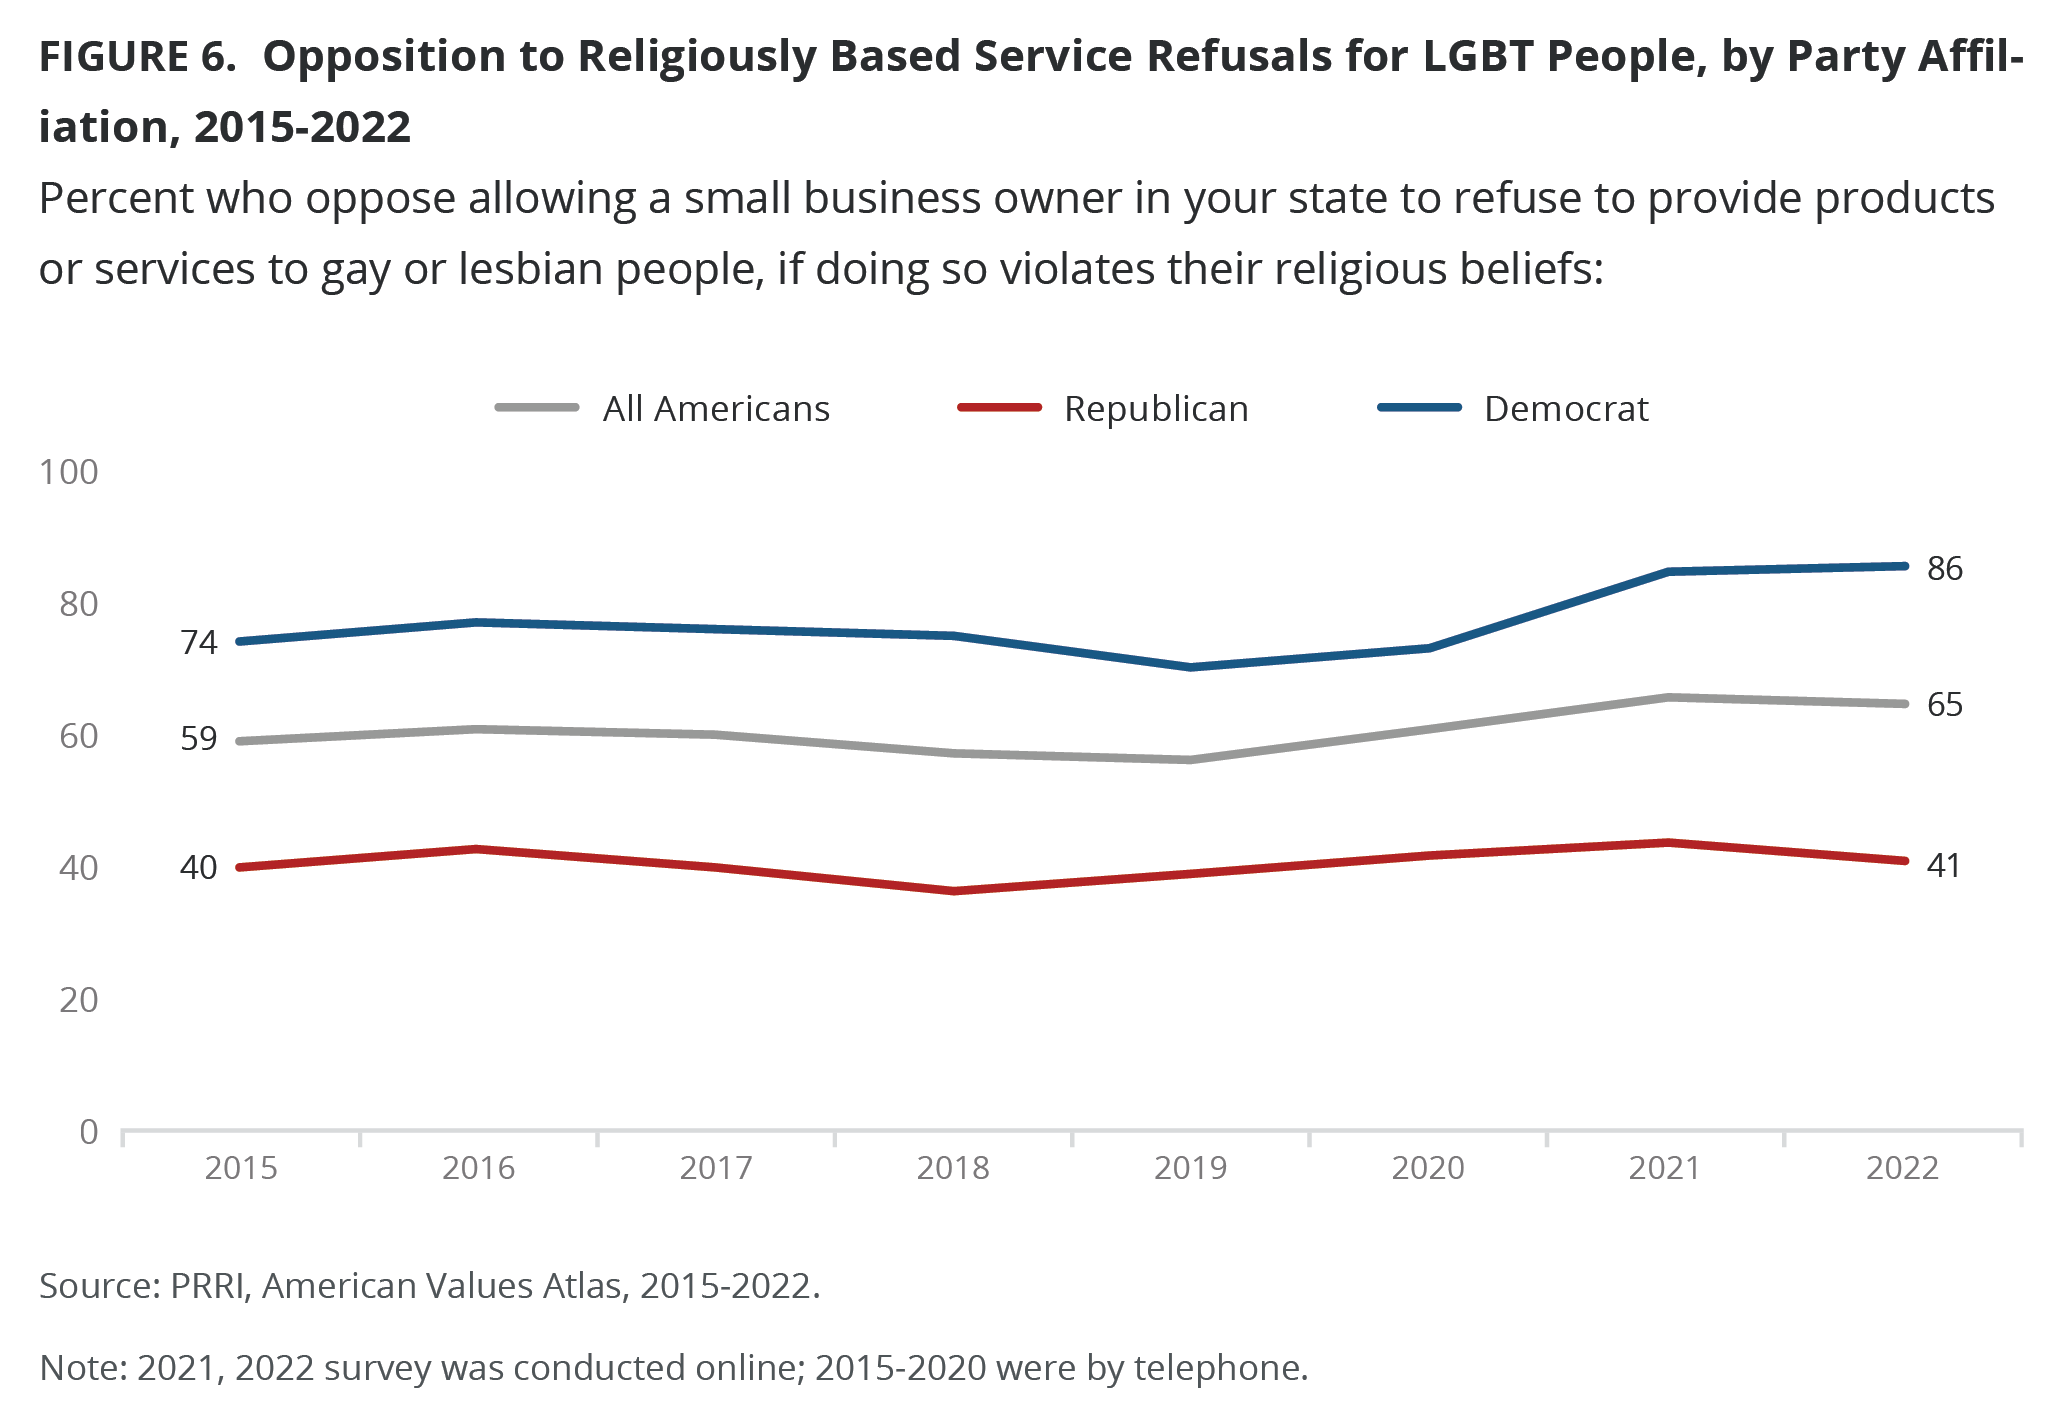
A majority of Americans have consistently opposed permitting businesses to refuse service to LGBTQ people on religious grounds, and in 2022 nearly two-thirds of Americans (65%) oppose allowing such refusals. One-third of Americans (33%) support allowing religiously based service refusals, including 15% who strongly favor allowing them. Opposition to allowing religiously based service refusals has fluctuated since 2015, when 59% of Americans opposed this policy. Opposition stayed about the same in 2016 (61%) and 2017 (60%), then ticked slightly down, to 57% in 2018 and 56% in 2019. In 2020, opinion shifted back to the 2016 level (61%), and then up again in 2021 (66%).
Nearly nine in ten Democrats (86%) and about two-thirds of independents (64%) oppose allowing religiously based refusals to serve gay and lesbian people. About four in ten Republicans (41%) oppose allowing such service refusals, while a majority of Republicans (57%) support allowing them. Opposition to religiously based service refusals has increased among Democrats (from 74% in 2015) and independents (from 59% in 2015) but has remained relatively consistent among Republicans (40% in 2015).
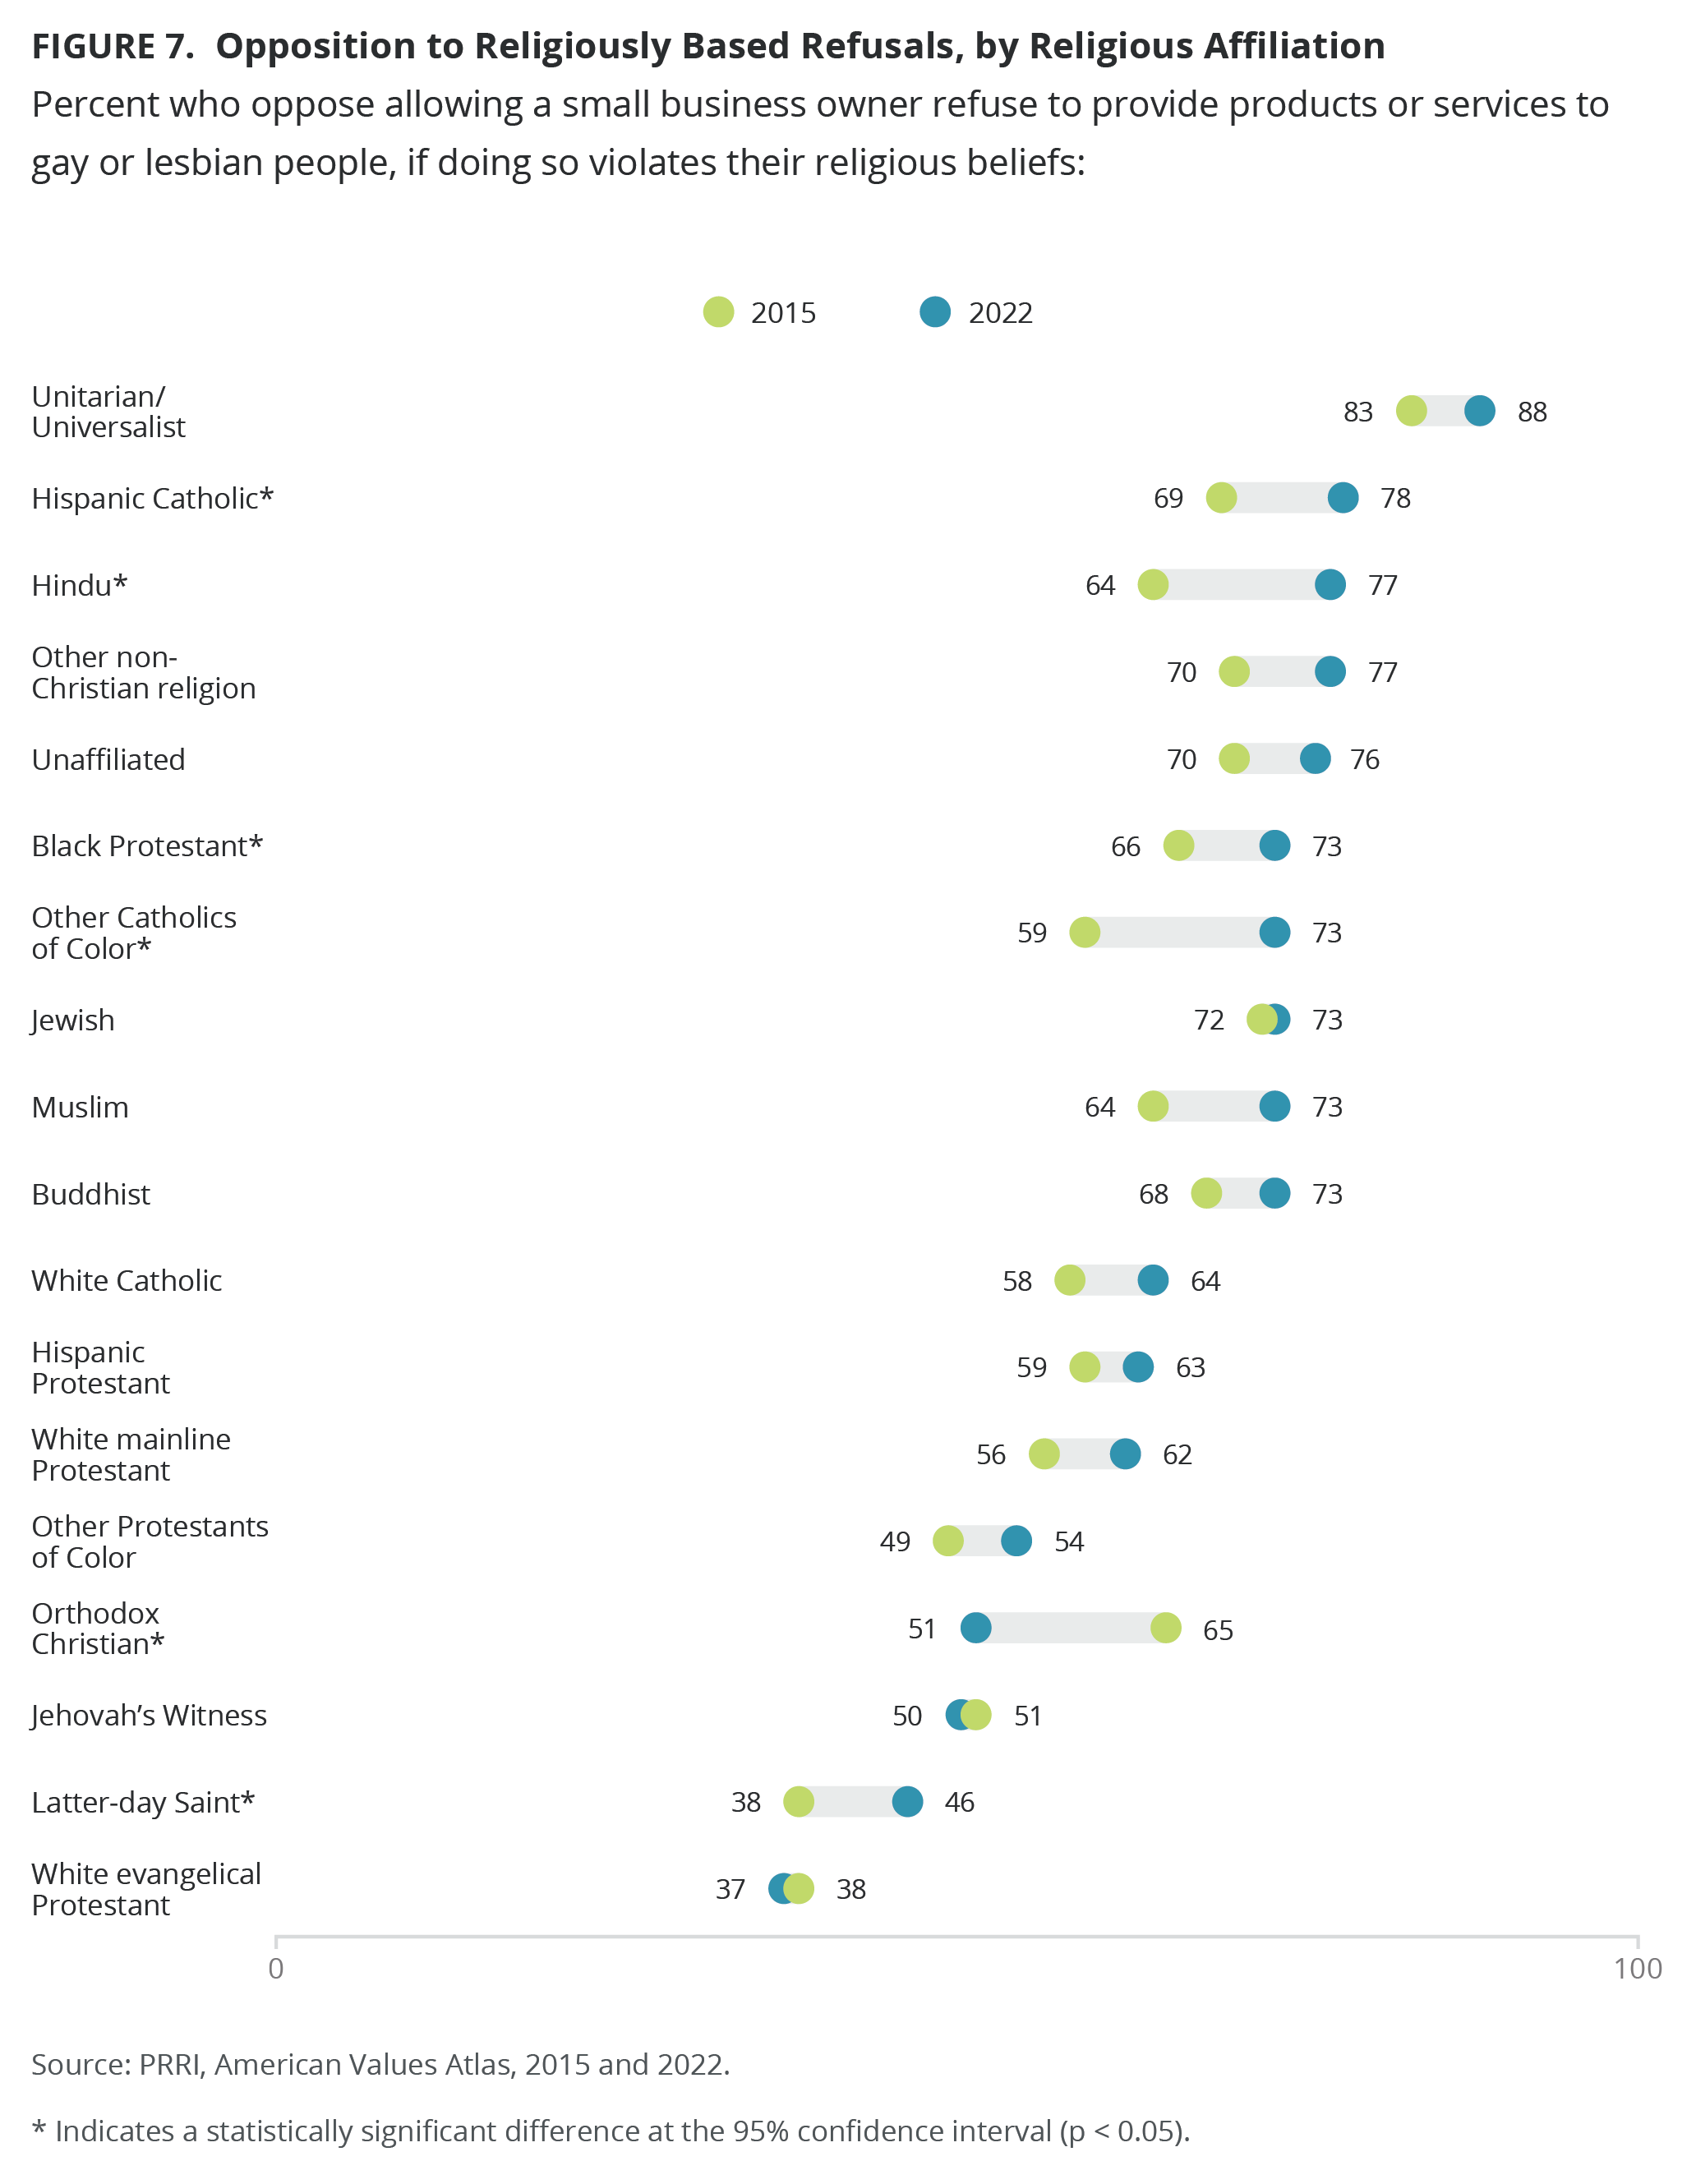
Majorities of almost every major religious group oppose allowing religiously based service refusals, including 88% of Unitarian Universalists, 78% of Hispanic Catholics, 77% of Hindus, 77% of members of other non-Christian religions, 76% of religiously unaffiliated Americans, 73% of Black Protestants, 73% of other Catholics of color, 73% of Muslims, 73% of Jewish Americans, 73% of Buddhists, 64% of white Catholics, 63% of Hispanic Protestants, 62% of white mainline Protestants, and 54% of other Protestants of color. Half of Orthodox Christians (51%) and Jehovah’s Witnesses (50%), less than half of Latter-Day Saints (46%), and only 37% of white evangelical Protestants also oppose allowing religiously based service refusals.[9] The level of opposition has increased among every group except Orthodox Christians, Jehovah’s Witnesses, Latter-day Saints, and white evangelical Protestants.
White Americans (61%) are less likely than Hispanic Americans (73%), Black Americans (73%), and AAPI (73%) to oppose allowing religiously based refusals to serve LGBTQ people. However, white Americans with a college degree (64%) are more likely than whites without a college degree (59%) to oppose religiously based service refusals.
Majorities of Americans across educational lines oppose allowing religiously based service refusals. Opposition is highest among Americans with a postgraduate degree (68%), followed by those with a four-year college degree (66%), those with a high school degree or less (65%) and those with some college experience (64%).
Young Americans ages 18–29 (70%) are notably more likely to oppose allowing religiously based service refusals than Americans ages 30–49 (65%), ages 50-64 (65%), and ages 65 and over (61%). Senior Republicans (37%) are notably less likely than to oppose allowing religiously based service refusals than are Republicans of other ages, including those ages 18–29 (42%), ages 30–49 (44%) and ages 50–64 (43%). Interestingly, even though the vast majority of Democrats oppose allowing religiously based service refusals, Democrats ages 30–49 are the least likely to be opposed (82%), compared to Democrats ages 18–29 (89%), ages 50–64 (86%) and ages 65 and over (86%).
Seven in ten women (70%) oppose allowing religiously based refusals to serve LGBTQ people, compared with 59% of men. While there are no differences between Democratic men (84%) and Democratic women (87%), Republican women (47%) are notably more likely than Republican men (35%) to oppose allowing religiously based service refusals. Independent women and men mirror women and men overall (71% and 59%).
Americans who reside in the South (61%) are less likely than Americans who reside in the Northeast (71%), the Midwest (65%) or the West (66%) to oppose allowing religiously based refusals to serve gay and lesbian people.
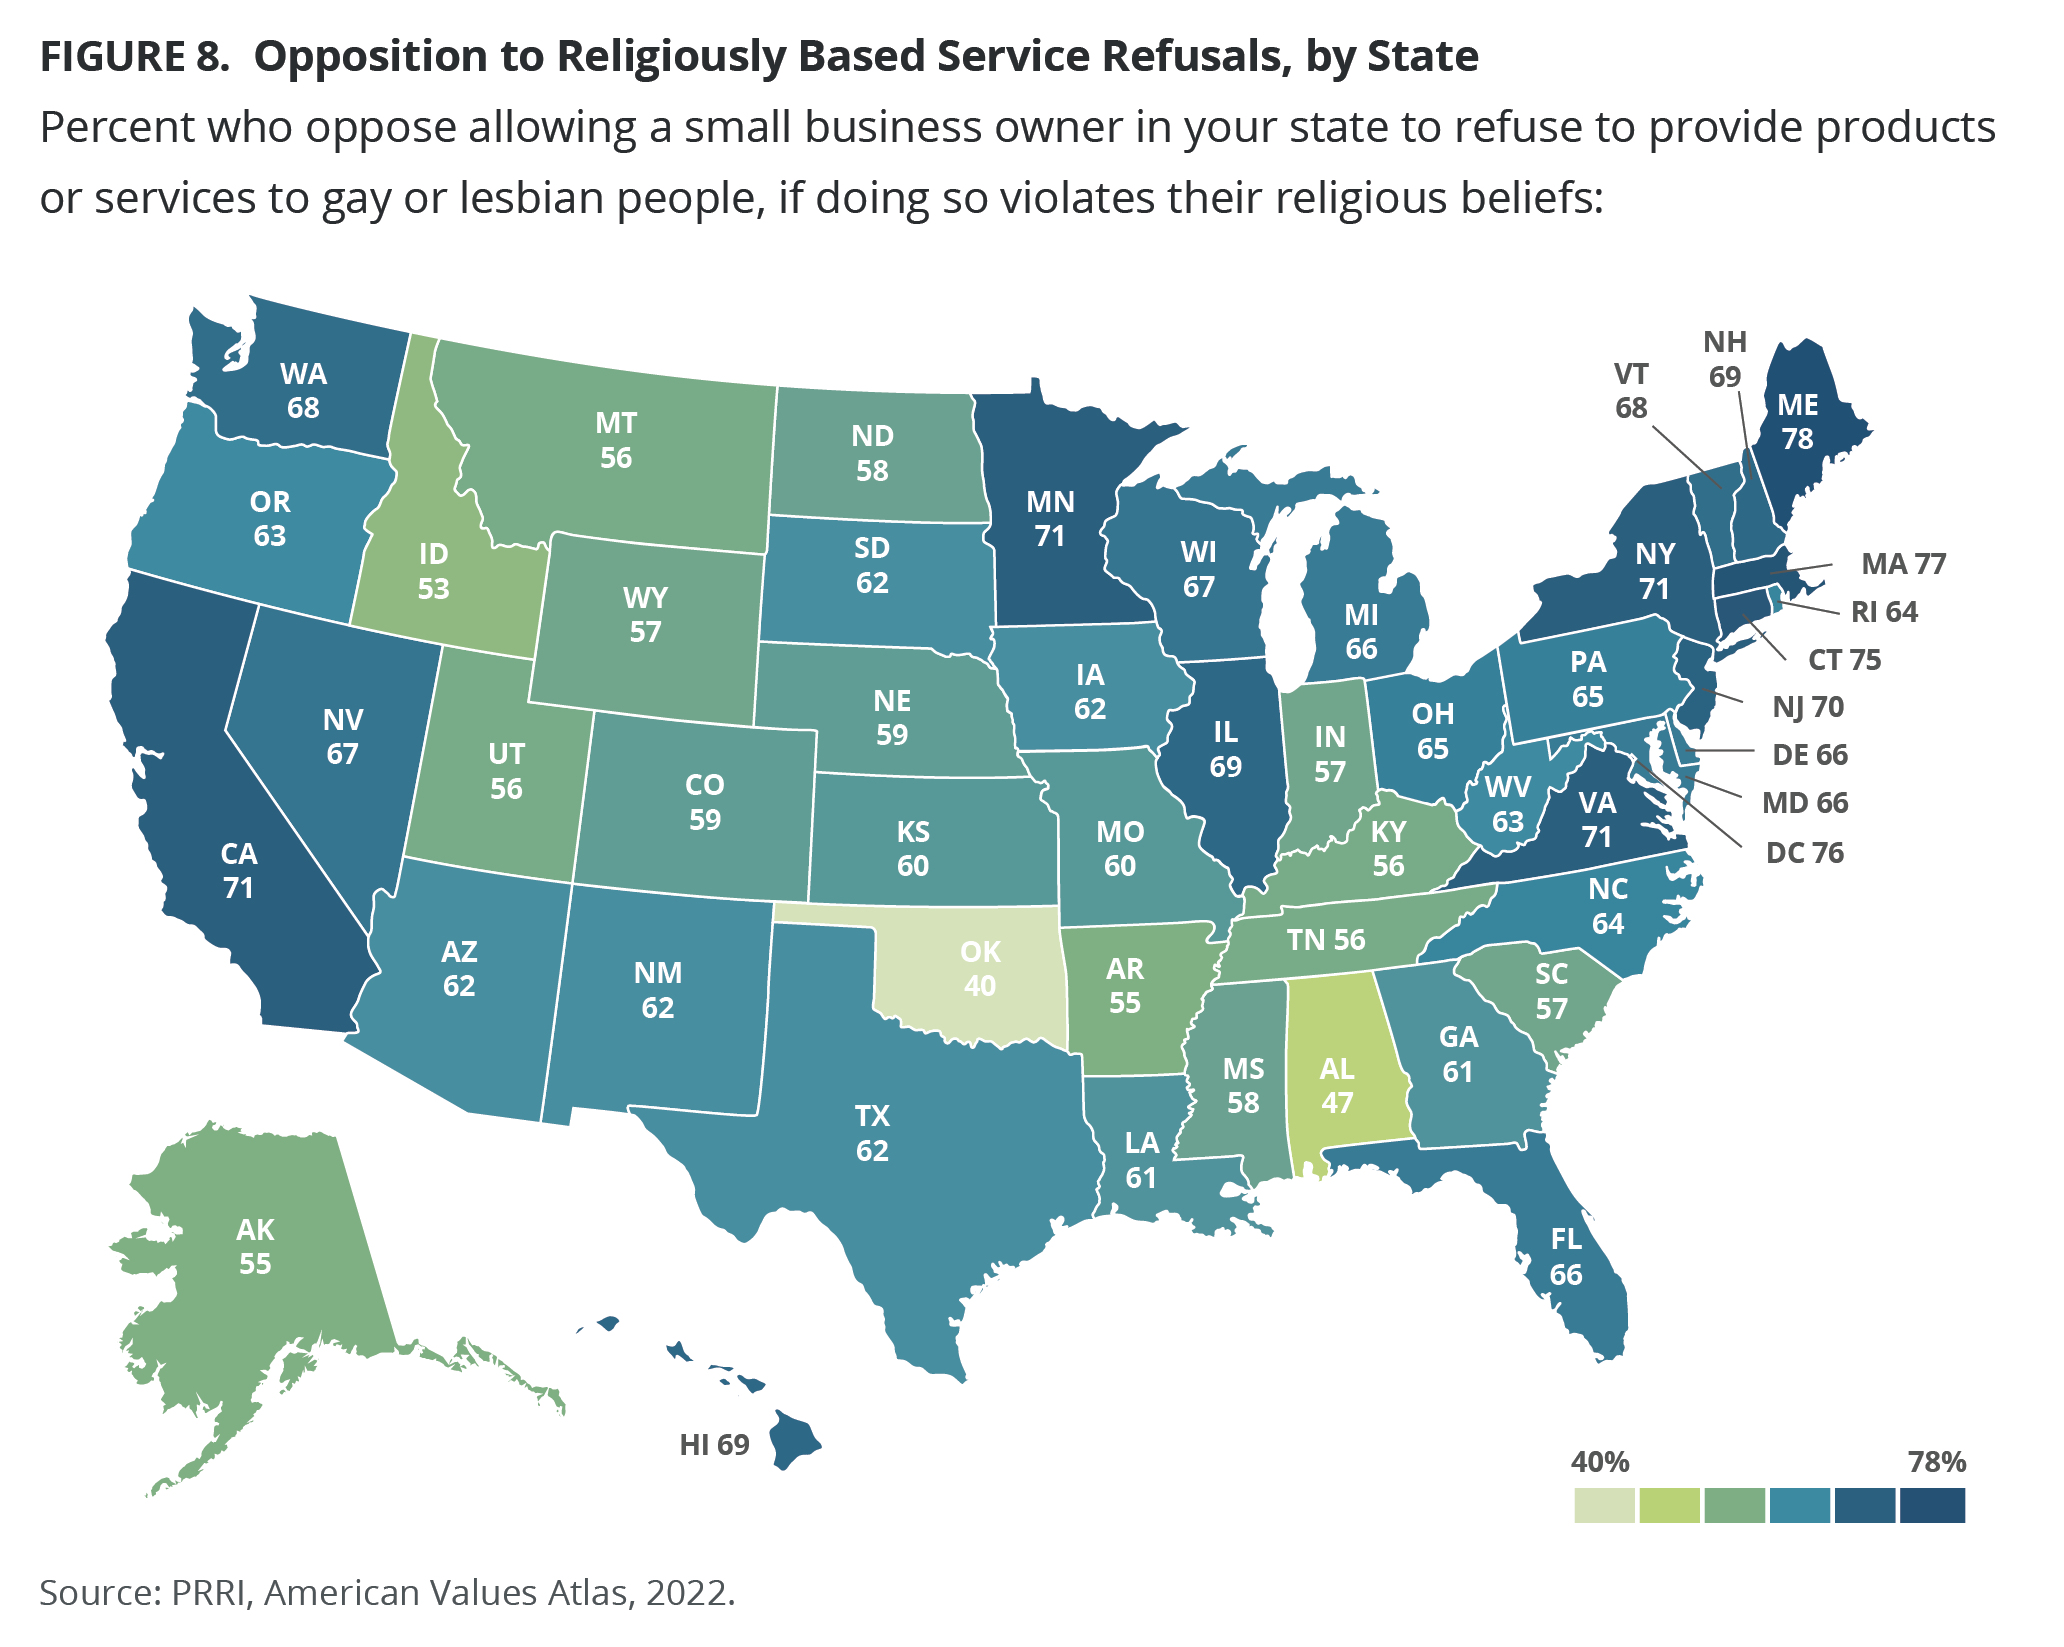
The five states with the highest rates of opposition are Maine (78%, up from 63% in 2015), Massachusetts (77%, up from 71%), the District of Columbia (76%, unchanged from 74% in 2015), Connecticut (75%, up from 68%), and California (71%, up from 63%).
Oklahoma (40%) and Alabama (47%) are the only states in which less than half of residents oppose allowing religiously based refusals, and both states declined in opposition compared to 2015, when their rates of opposition were 48% and 52%, respectively. Idaho (53%), Alaska (55%), and Arkansas (55%) round out the five states with the lowest levels of opposition to allowing religiously based service refusals.
Same-Sex Marriage
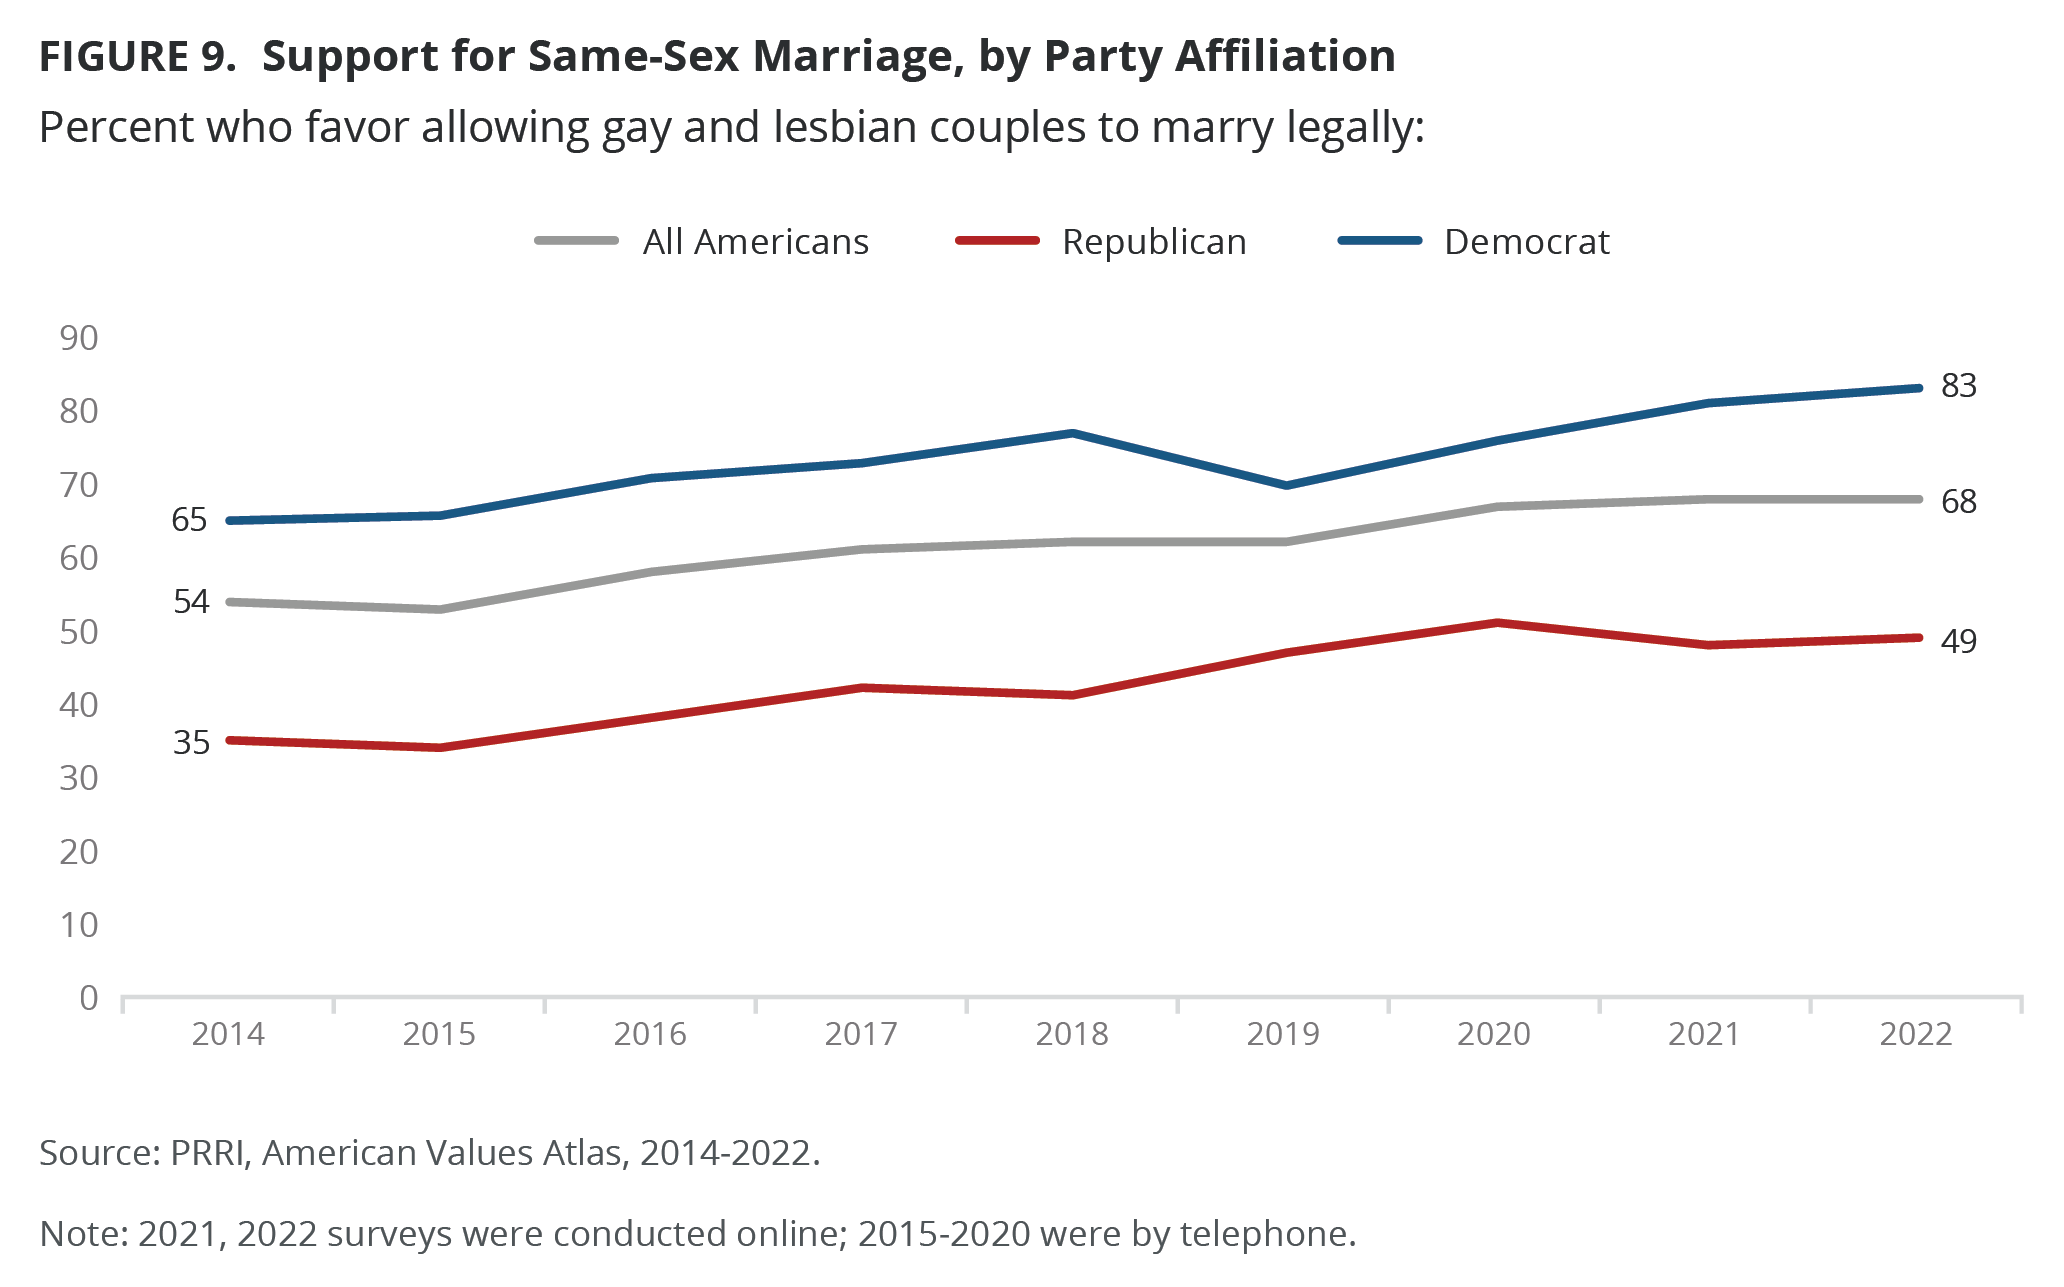
Support for legal same-sex marriage has steadily increased in the United States for nearly a decade. The majority of Americans were in support of allowing gay and lesbian couples to marry legally in 2014 and 2015 (54% and 53%, respectively). Support increased to around six in ten Americans in subsequent years (58% in 2016, 61% in 2017, and 62% in 2018 and 2019), and then to around seven in ten in 2020, 2021, and 2022 (67%, 68%, and 69%, respectively). PRRI finds that support for same-sex marriage has consistently grown across virtually all demographics and affiliations, even within groups in which supporters are not the majority.
About half of Republicans (49%) support same-sex marriage, compared to about one-third in 2014 (35%). The level of support among independents has aligned with the level among all Americans, with 73% expressing support in 2022 (up from 58% in 2014). Support has increased among Democrats, going from around two-thirds in 2014 (65%) to more than eight in ten in 2022 (83%).
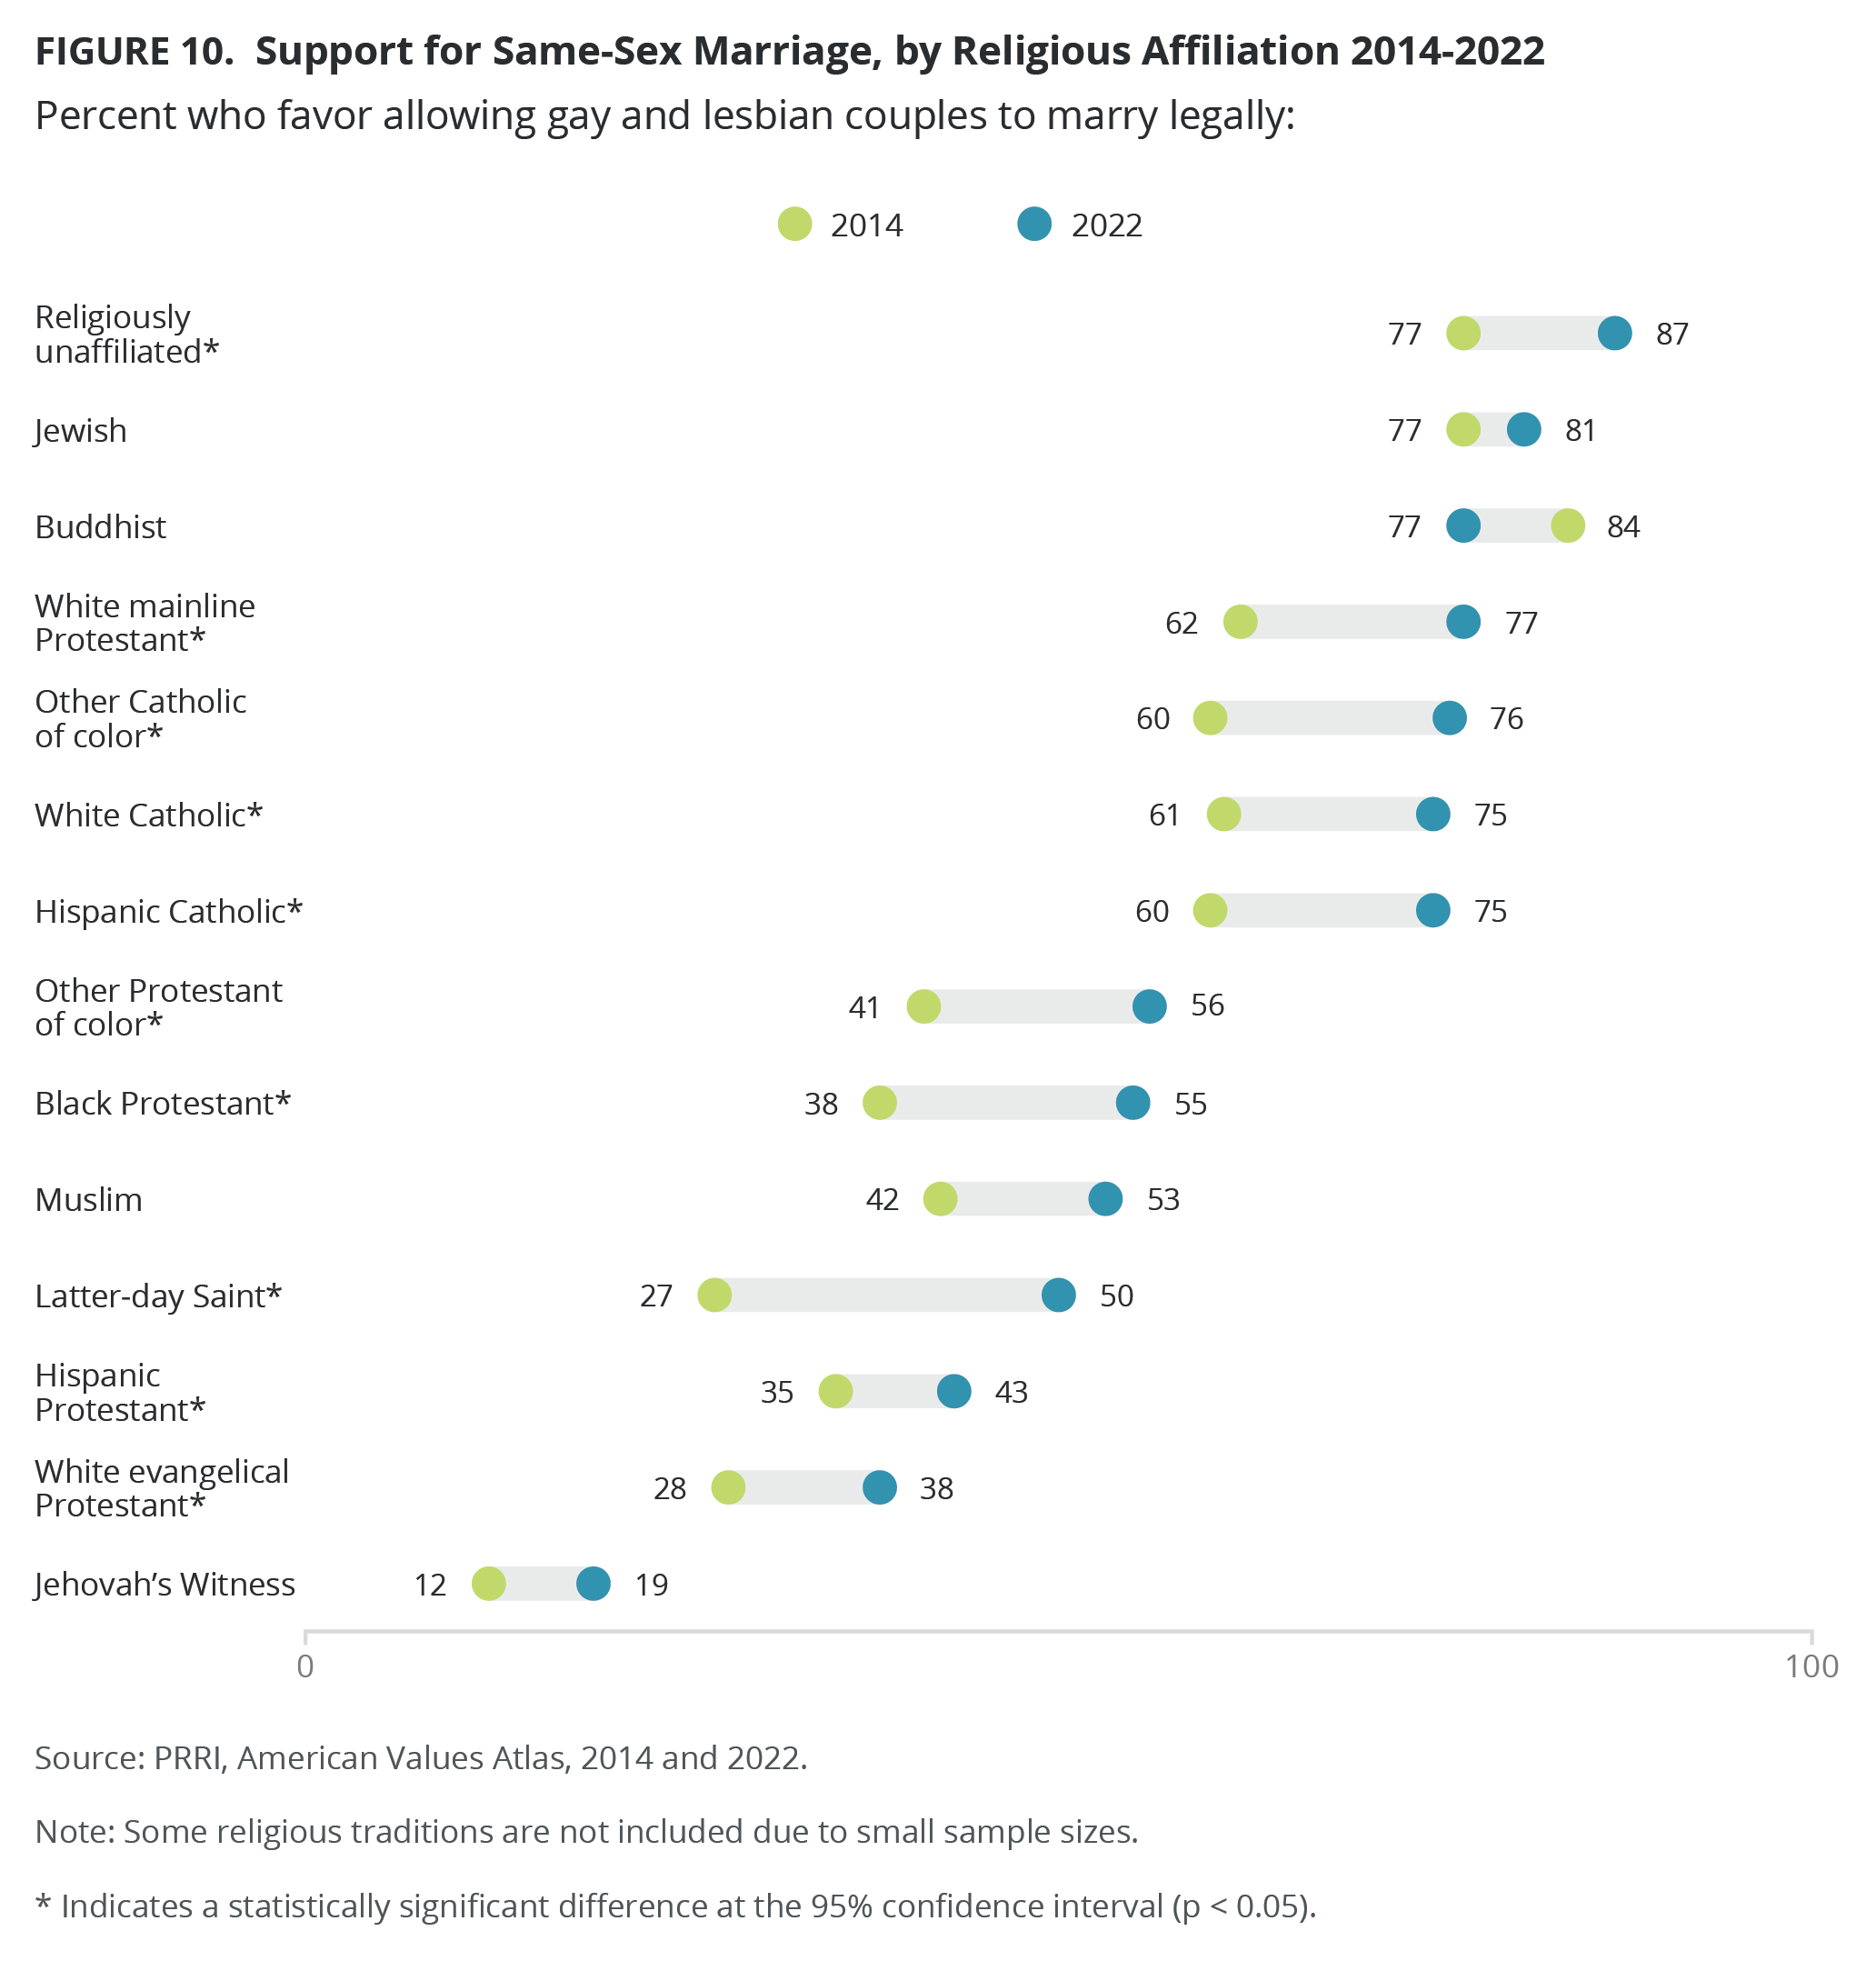
Only a minority of white evangelical Protestants support allowing same-sex marriage, but their level of support has grown from around three in ten in 2014 (28%) to four in ten in 2022 (38%). Majorities of both white mainline Protestants and white Catholics support of allowing gay and lesbian couples to marry legally, and support has risen in recent years, going from around six in ten in 2014 (62% and 61%, respectively) to around three-fourths in 2022 (77% and 75%, respectively).
Most other major religious groups have also become more likely to support same-sex marriage since 2014. Nearly nine in ten religiously unaffiliated Americans (87%), eight in ten Jewish Americans (81%), 76% of other Catholics of color, and 75% of Hispanic Catholics express support.
Since 2014, some groups have reached majority support for same-sex marriage, including other Protestants of color (with support going from 41% in 2014 to 56% in 2022), Black Protestants (38% to 55%), and Muslims (42% to 53%). Latter-day Saints have gone from around one-fourth (27%) supporting same-sex marriage in 2014 to half (50%) being in support in 2022. Hispanic Protestants (43%, up from 35% in 2014) and Jehovah’s Witnesses (19%, up from 12% in 2014) show the lowest levels of support among religious groups.
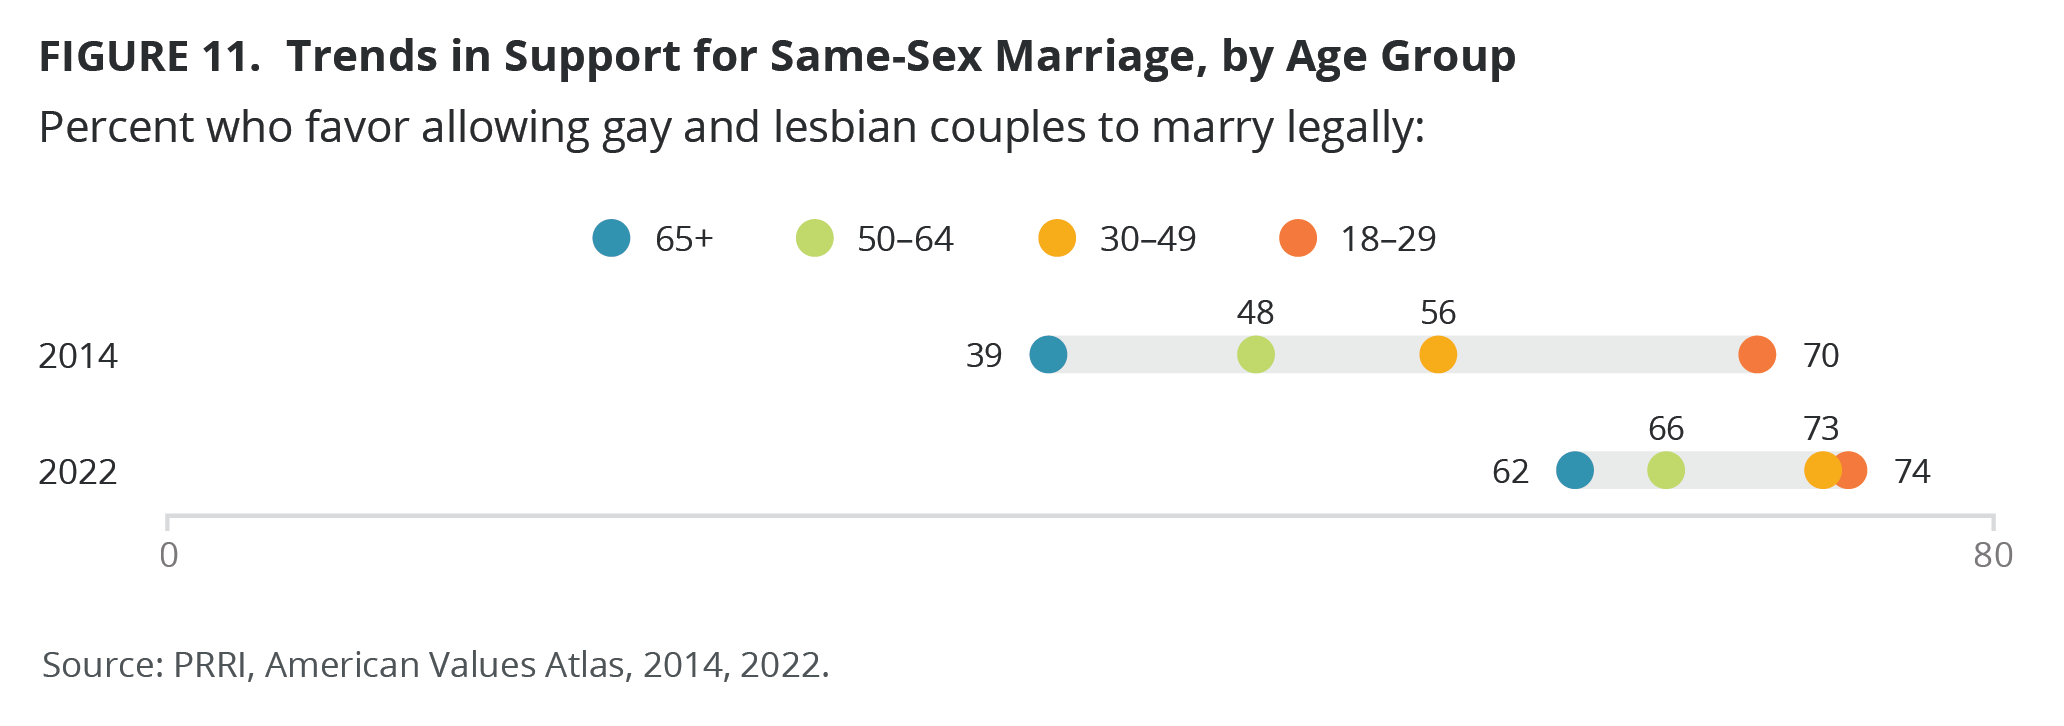
Support for legal same-sex marriage has been consistently higher among Americans ages 18–29 than among those in older age groups. Support among Americans ages 18–29 has gone from 70% in 2014 to 74% in 2022. Although a smaller percentage of Americans ages 30–49 favored same-sex marriage in 2014 compared to the 18–29 age group, their support grew to 73% in 2022, nearly matching the younger age group. Slightly less than half of Americans ages 50–64 (48%) supported allowing gay and lesbian couples to marry legally in 2014, but that percentage increased to around two-thirds (66%) in 2022. Similarly, four in ten Americans over the age of 65 (39%) supported the legality of same-sex marriage in 2014, but more than six in ten (62%) expressed support in 2022, putting older Americans closer in line with those ages 50–64.
Among both Democrats and Republicans, there is a distinct break in support for same-sex marriage around middle age. Republicans ages 18 –29 and 30–49 express similar levels of support (52% and 53%, respectively). However, less than half of Republicans ages 50–64 (50%) and age 65 or older (42%) express support. A similar pattern is present among Democrats. Among the 18–29 and 30–49 age groups, support for same-sex marriage is at 86%, compared to 79% among Democrats ages 50–64 and 80% among those age 65 or older.
Support for legal same-sex marriage increased among all racial groups between 2014 and 2022, though the growth has been more pronounced in some groups than in others. AAPI Americans have consistently been the most supportive of same-sex marriage, and their rate of support increased from around two-thirds in 2014 (65%) to around three-fourths in 2022 (76%). Both white and Hispanic Americans have seen similar trends, with support growing from 56% to 71% between 2014 and 2022 for white Americans and from 55% to 68% for Hispanic Americans. Black Americans had the most growth in support for same-sex marriage, going from 41% in 2014 to 59% in 2022. Support among multiracial Americans and Native Americans increased by less than ten percentage points from 2014 to 2022 (going from 62% to 71% and from 53% to 57%, respectively).
Although support for same-sex marriage has increased among all education groups, it is higher among groups with more education. Among Americans with a high school education or less, supporters made up less than half the group (46%) in 2014 but accounted for 60% in 2022. Meanwhile, support has gone from 55% to 68% among those with some college education, from 61% to78% among college graduates, and from 65% to 80% among those with a postgraduate degree.
There is not a substantial divide between men and women on the issue of same-sex marriage, though women have generally been slightly more supportive. Women’s support increased from 57% in 2014 to 70% in 2022, and men’s support grew from 50% to 67%.
In 2014, the four regions of the United States varied in their support for same-sex marriage (64% in the Northeast, 59% in the West, 54% in the Midwest, and 46% in the South). Although all regions have increased in support, in 2022 support is notably lower in the South than in the other three regions. More than seven in ten of Americans in the Northeast, West, and Midwest (75%, 73%, and 71%, respectively) support allowing same-sex couples to marry legally, while 63% of Americans in the South share that sentiment.
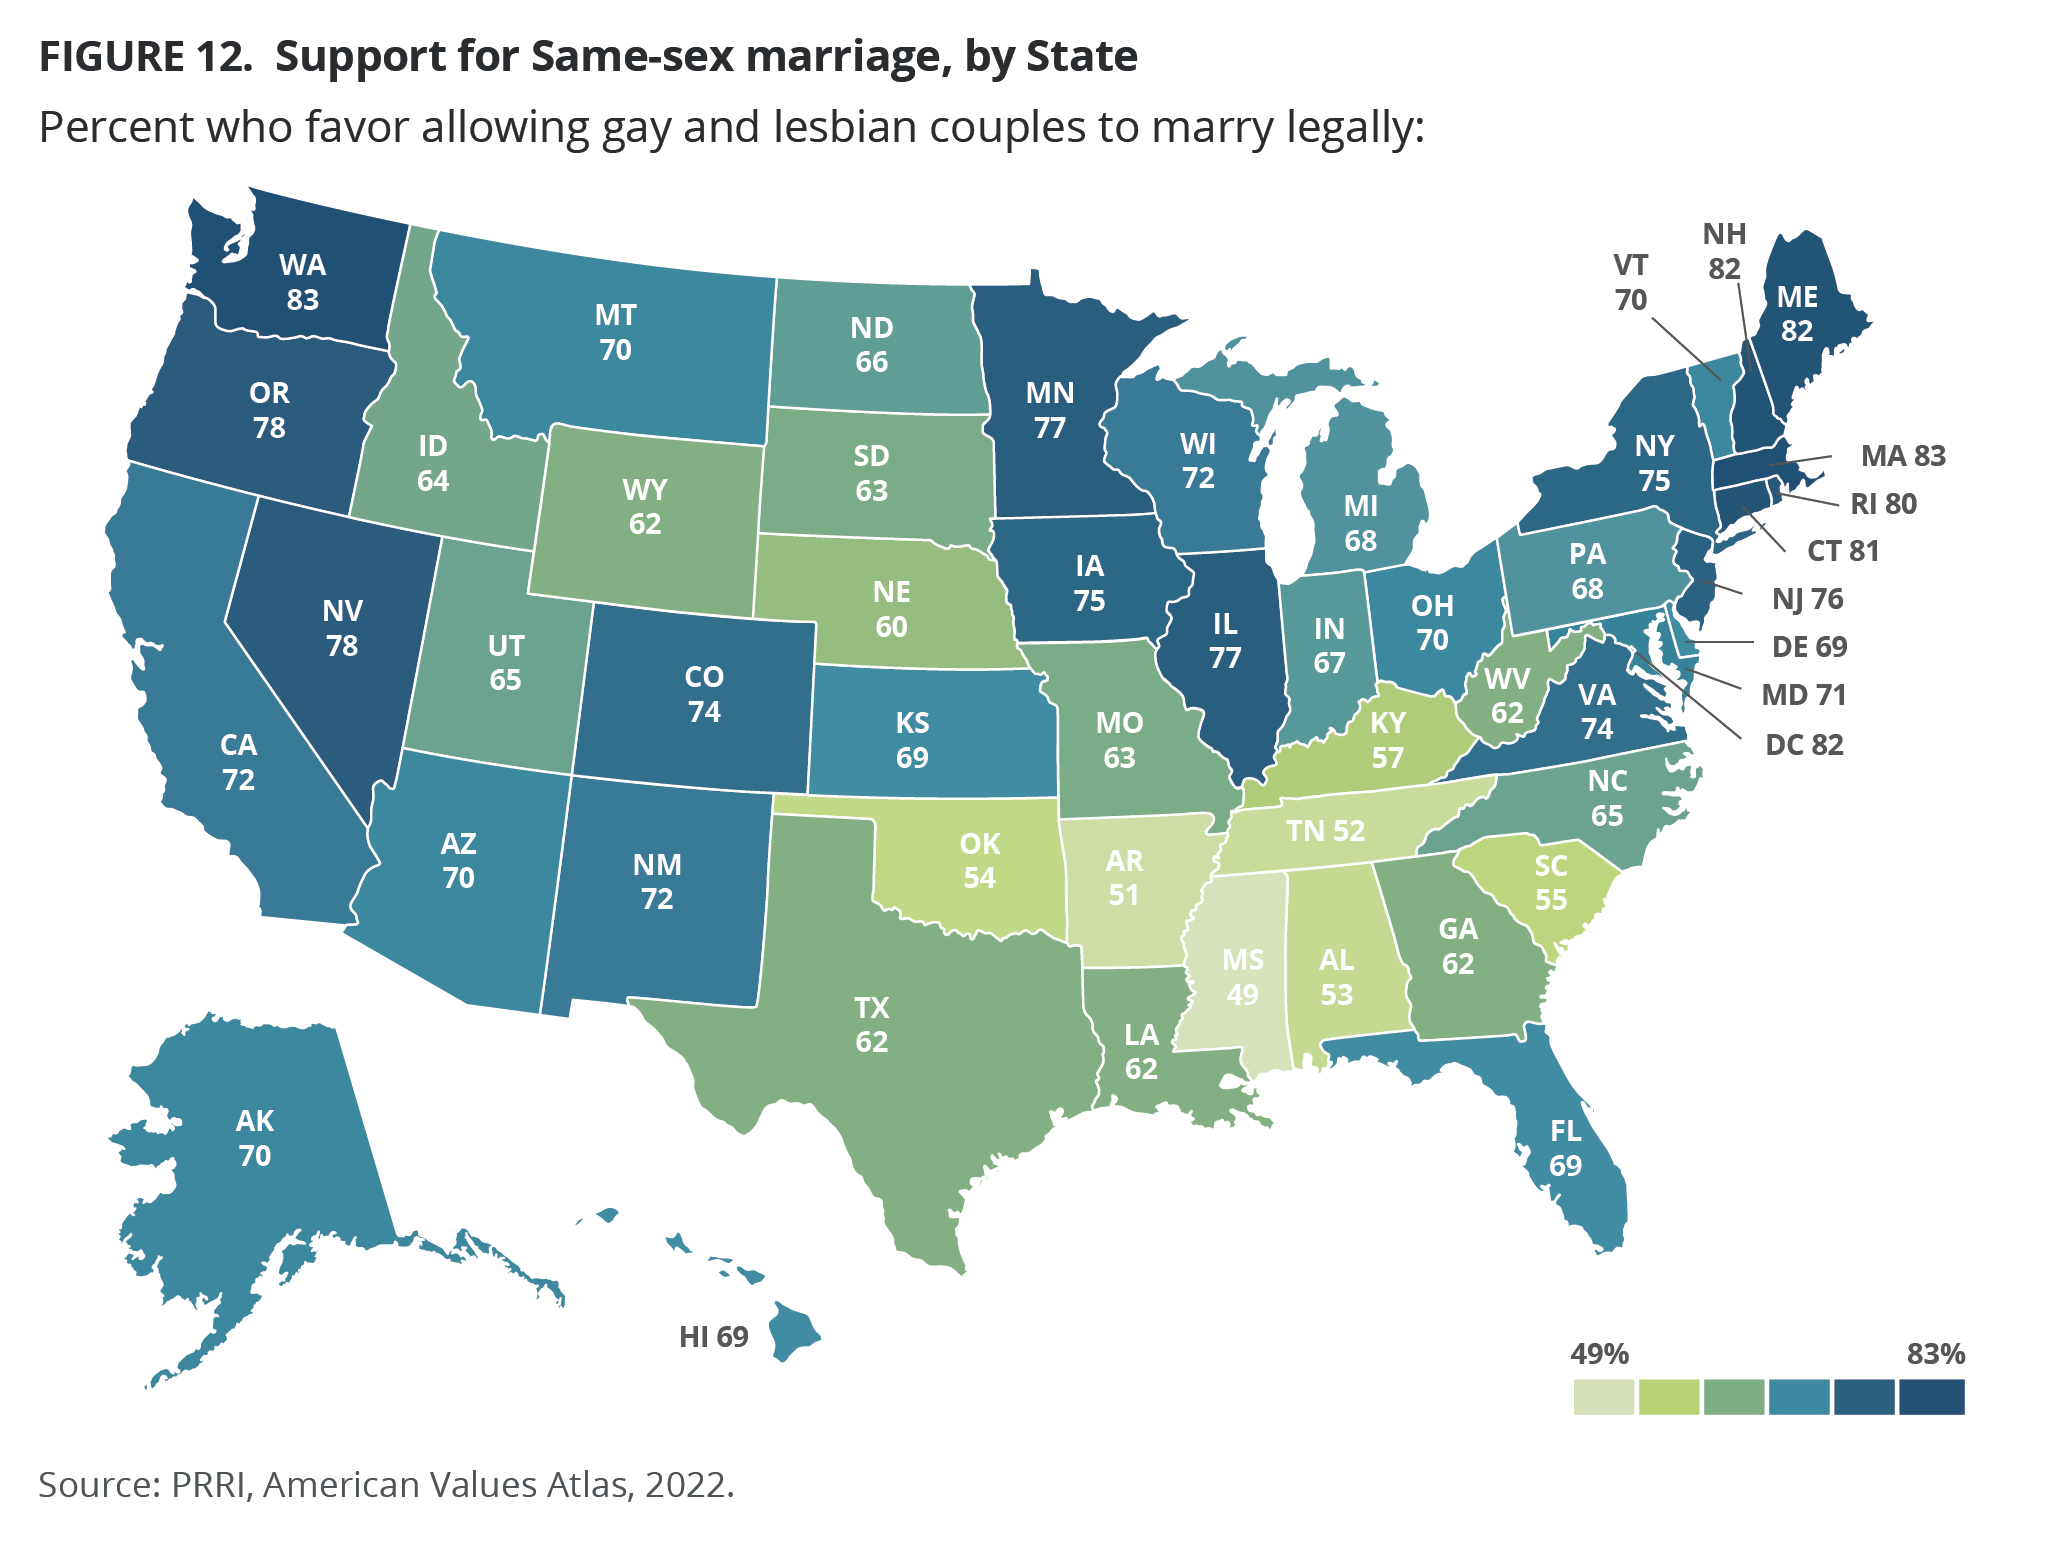
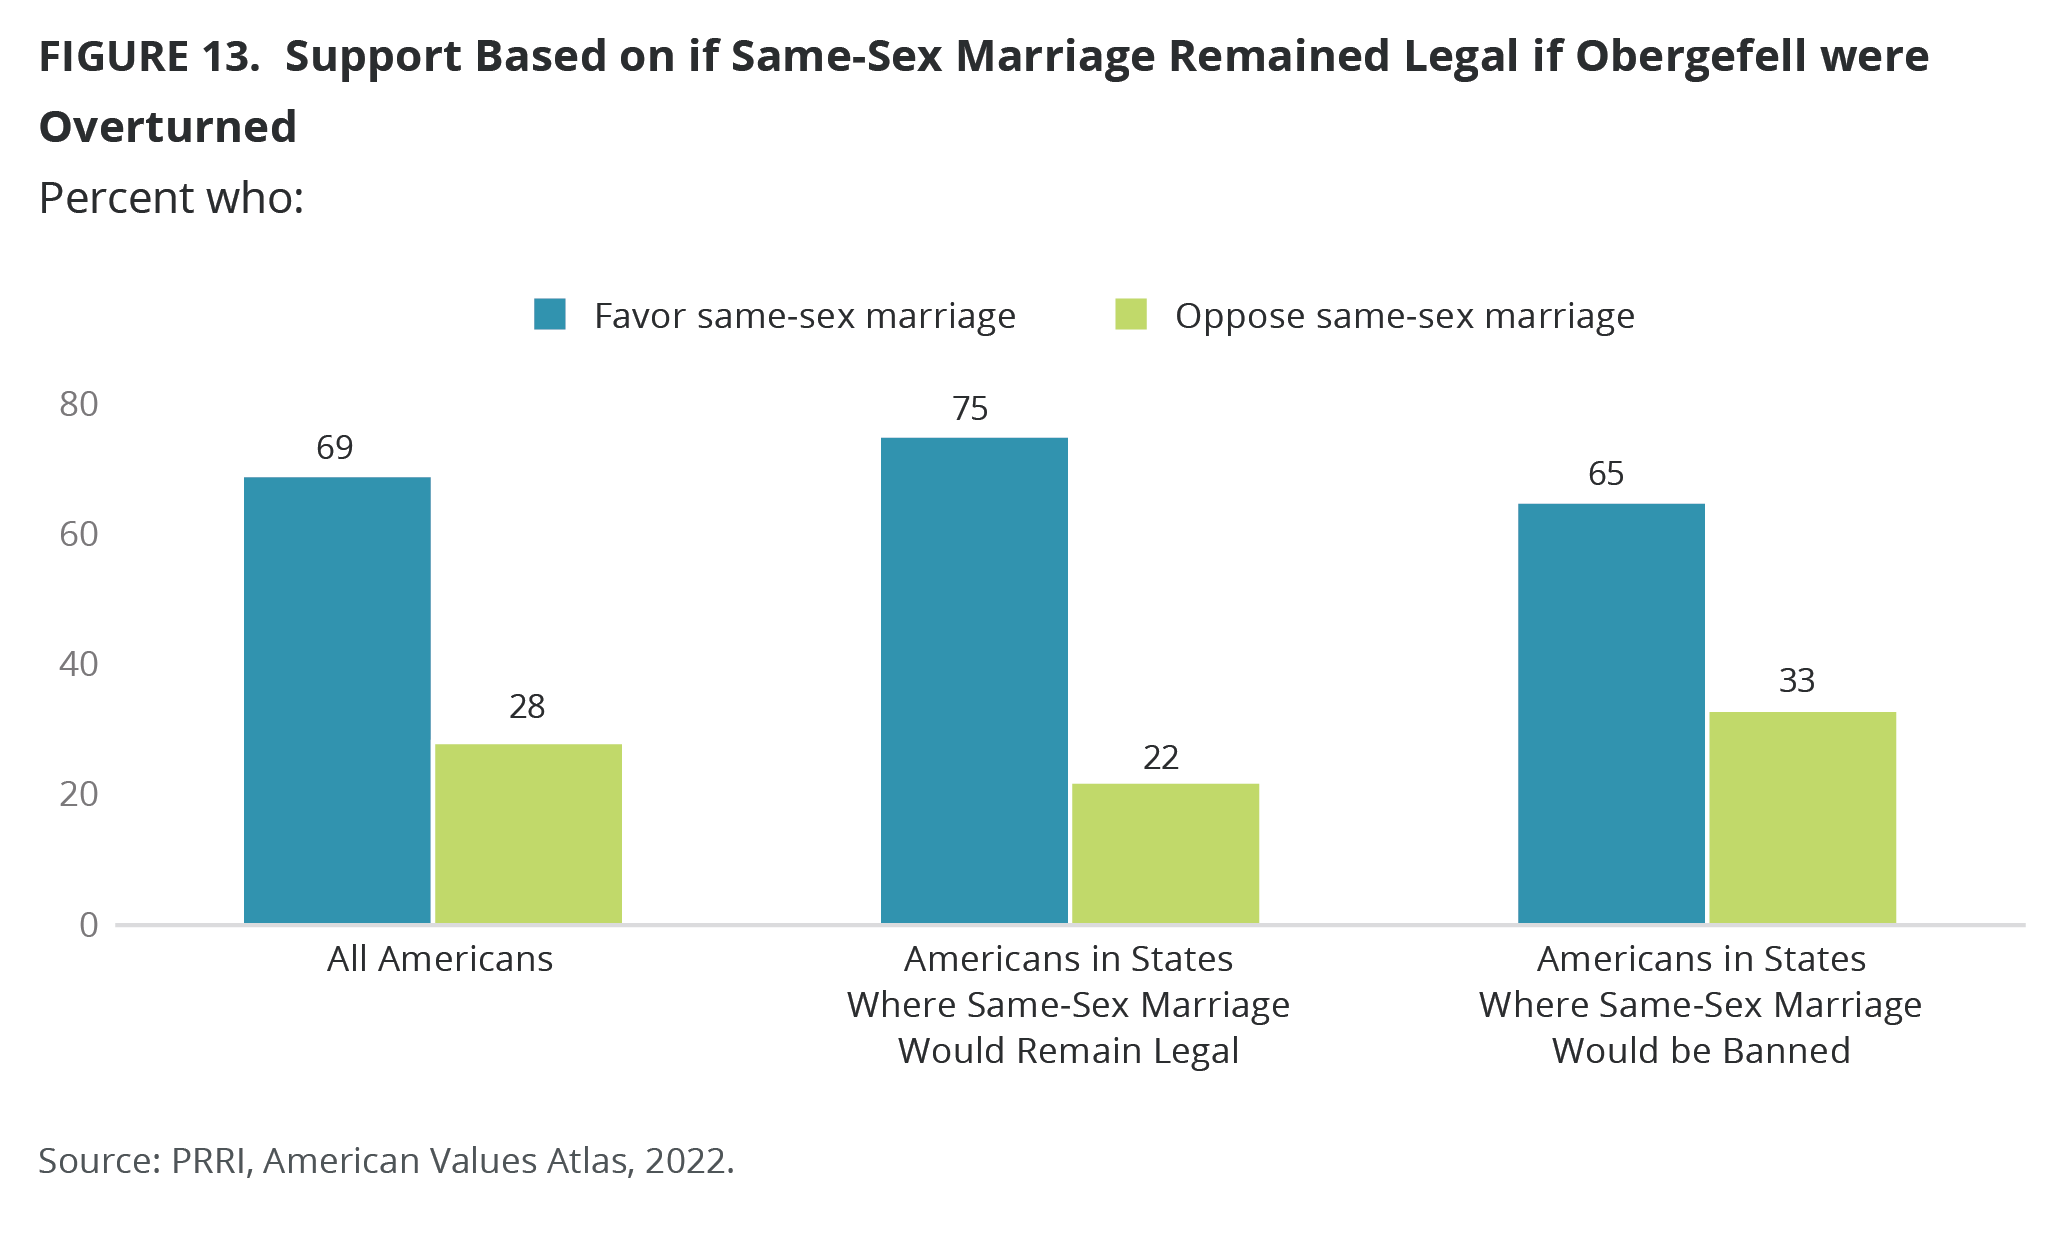
On June 26, 2015, the U.S. Supreme Court’s decision in Obergefell v. Hodges determined that same-sex marriage was legal at the federal level. However, in the wake of the Court’s June 2022 decision to overturn Roe v. Wade, which had protected abortion access federally, some believe that the Obergefell decision may also be under threat. If it were to be overturned, same-sex marriage would not be legal in most states under current laws.[10] Support for same-sex marriage is higher in those states where it is legal at the state level than in those where it would be banned if Obergefell v. Hodges were overturned (75% vs. 65%, respectively).
Intersections of Views on LGBTQ Rights and Views on Race, Christian Nationalism, Gender, and Patriarchy
PRRI’s 2022 American Values Atlas included various measures to assess Americans’ attitudes toward the role of race and gender norms in the country, along with a new measure of Christian nationalist beliefs. While not all of these measures were included across the entire year, sample sizes for each of the quarterly surveys are large enough to examine how views on these issues intersect with views on LGBTQ rights.
The Structural Racism Index and LGBTQ Rights
In June 2022, PRRI asked 11 questions on a range of race-related topics, including white supremacy, racial inequality, the impact of discrimination on African American economic mobility, the treatment of African Americans in the criminal justice system, general perceptions of race, and whether racism is still a significant problem today.[11]
The answers across all 11 questions, which are highly correlated, were combined to create our Structural Racism Index scale. A full description of the scale can be found in the appendix.
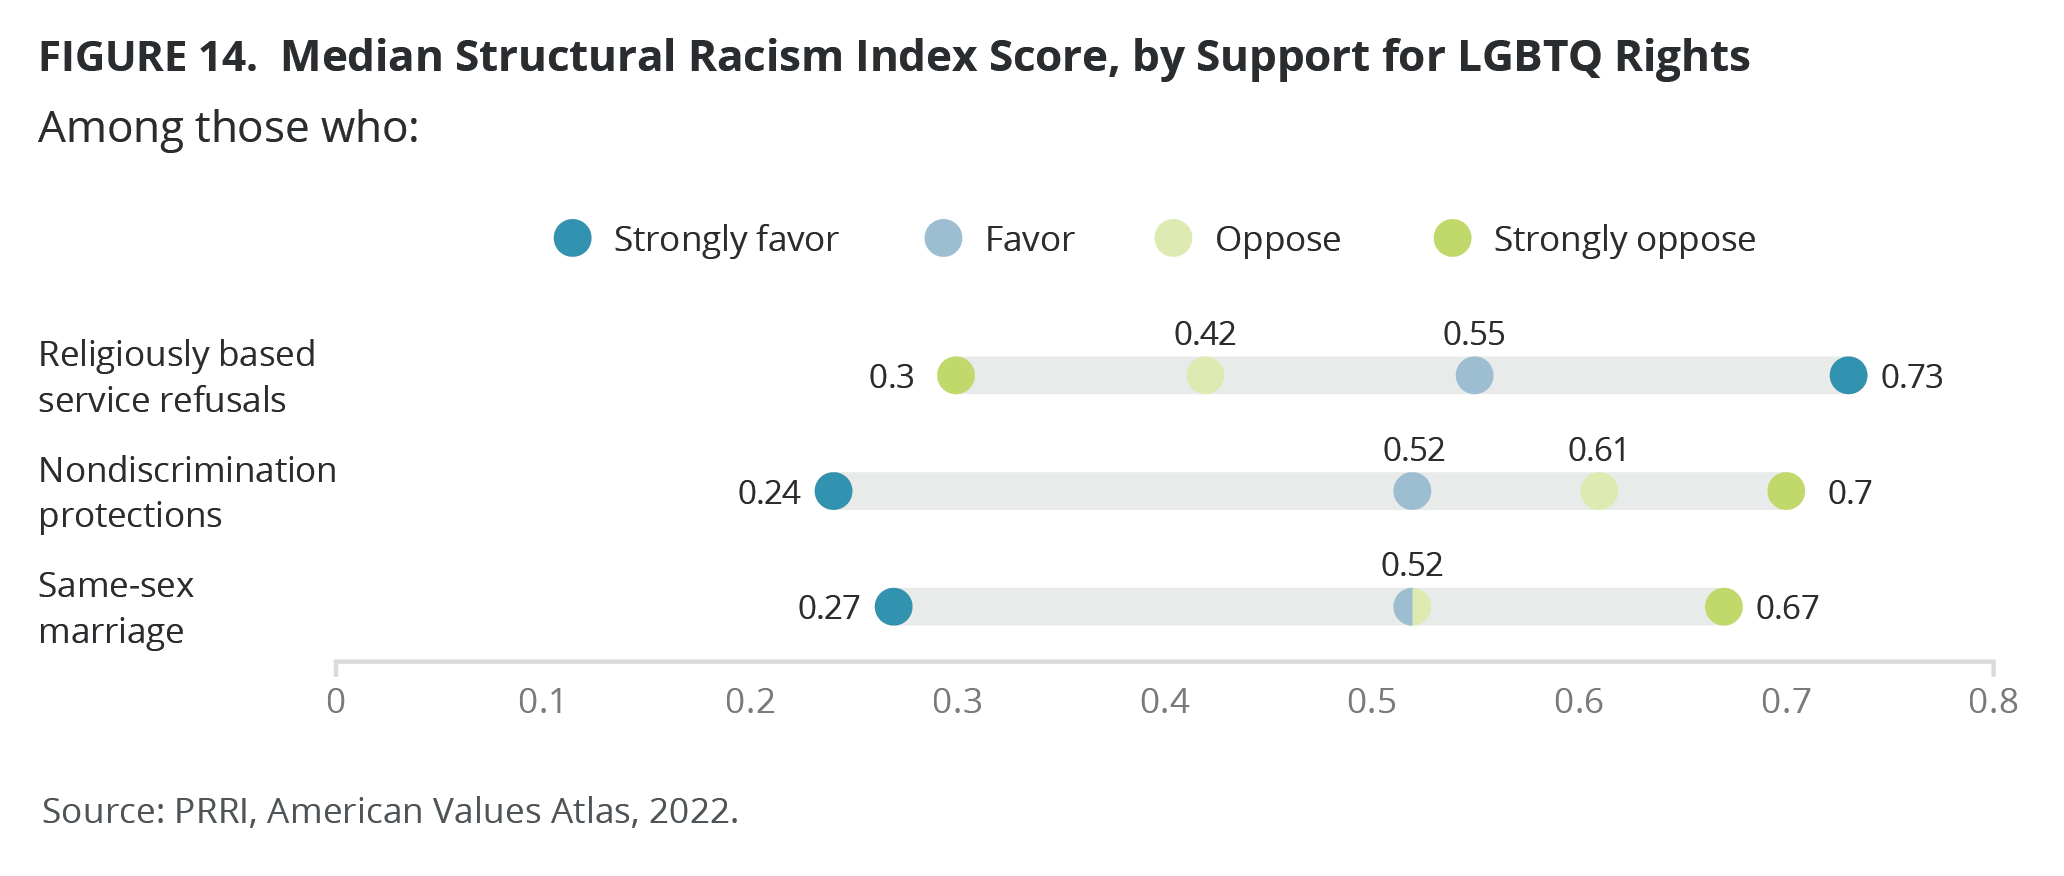
The Structural Racism Index combines the answers to these 11 questions and rescales the scores to values from 0 (low, less racism) to 1 (high, more racism). Among all Americans, the median score on the Structural Racism Index is 0.45, near the center of the scale.
Attitudes toward structural racism correlate closely with attitudes toward LGBTQ rights. Americans who strongly favor protections for LGBTQ people score lower on the Structural Racism Index. This correlation is likely related to Americans’ partisan and ideological views.
The median scores on the Structural Racism Index are lower for Americans who favor or strongly favor nondiscrimination protections for LGBTQ people (0.52 and 0.24, respectively) than for those who oppose or strongly oppose these protections (0.61 and 0.70, respectively). Overall, the median score for those who support nondiscrimination protections is 0.39, compared to 0.64 among those who oppose such protections.
Americans who favor or strongly favor allowing businesses to refuse service to LGBTQ people on religious grounds have higher median Structural Racism Index scores (0.55 and 0.73, respectively) than those who oppose or strongly oppose allowing such service refusals (0.42 and 0.30, respectively). In total, Americans who favor allowing service refusals have a higher median score (0.61) than those who oppose them (0.36).
Americans who favor the legality of same-sex marriage have a lower median score on the structural racism scale than those who oppose same-sex marriage (0.39 vs. 0.57). Those who strongly favor same-sex marriage (0.27) have a much lower median score than those who strongly oppose it (0.67). However, Americans who say they favor or oppose same-sex marriage but don’t say they feel strongly about it have identical median scores (0.52).
Christian Nationalism and LGBTQ Rights
PRRI’s recent Christian nationalism survey used a series of five questions to measure adherence to Christian nationalism. These questions addressed the relationship between Christianity, American identity, and the U.S. government. The resulting scale is used to classify Americans into one of four groups: Christian nationalism adherents, sympathizers, skeptics, and rejecters.
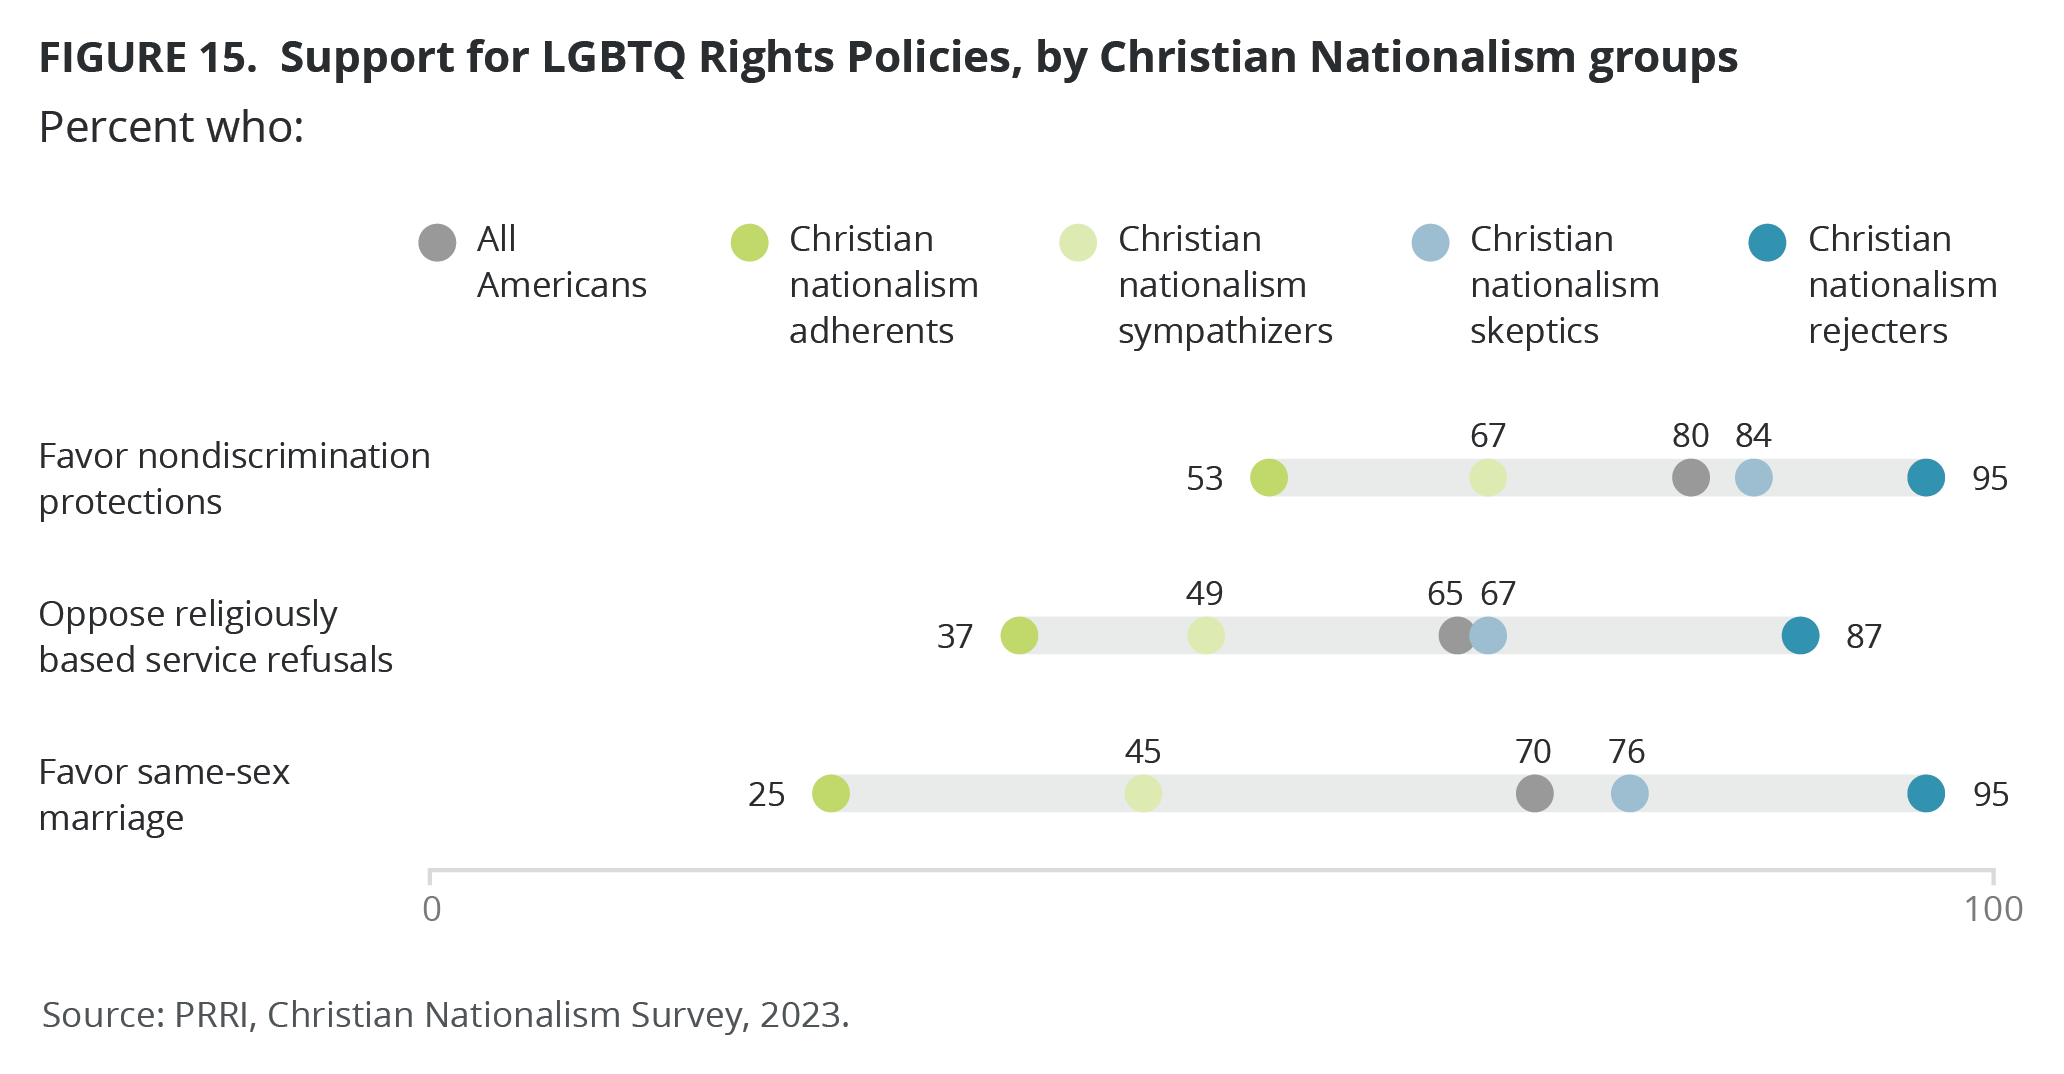
A majority of Christian nationalism adherents (53%) favor nondiscrimination protections for LGBTQ people. However, much larger shares of Christian nationalism sympathizers (67%), skeptics (83%), and rejecters (96%) support such protections.
Among Christian nationalism adherents, views on nondiscrimination protections for LGBTQ people vary significantly according to partisan affiliation. Less than half of Republican Christian nationalism adherents support nondiscrimination protections (48%), compared to 56% of independents who are adherents, and 71% of Democrats who are adherents. LGBTQ nondiscrimination protections are supported by broad majorities across the party spectrum among those who are not Christian nationalist adherents, including 70% of Republicans, 85% of independents, and 92% of Democrats.
The clearest correlation between Christian nationalist beliefs and views on LGBTQ rights is on the question of whether business owners should be allowed to refuse to serve gay and lesbian customers because of religious beliefs. Christian nationalism adherents are about five times as likely as Christian nationalism rejecters to support allowing religiously based service refusals (61% and 12%, respectively). About half of Christian nationalism sympathizers (51%) and one-third of skeptics (33%) support allowing religiously based service refusals.
Among all the groups included in PRRI’s survey, Christian nationalism adherents have one of the lowest rates of support for same-sex marriage. Just one-fourth of Christian nationalism adherents (25%) say same-sex marriage should be legal, compared to significantly more sympathizers (45%), three-fourths of skeptics (76%), and nearly all rejecters (95%).
Patriarchal Attitudes and LGBTQ Rights
PRRI asked a series of questions to measure attitudes toward gender norms and patriarchal views of society. One-third of Americans (33%) completely or mostly agree with the following statement: “In a truly Christian family, the husband is the head of the household, and the woman submits to his leadership.” Similarly, 34% agree that “these days, society seems to punish men just for acting like men,” and 38% agree that “society has become too soft and feminine.” Agreement with these patriarchal views correlates closely with attitudes toward LGBTQ rights.
Around two-thirds of Americans who agree that women should submit to a man’s leadership (68%) favor nondiscrimination protections for LGBTQ people, compared to 88% of those who do not agree with that statement. Likewise, 68% of Americans who agree that society has become too soft and feminine support nondiscrimination protections, compared to 90% of those who disagree. Finally, 67% of those who agree that society punishes men for acting like men support nondiscrimination protections, compared to 88% of those who disagree.
Americans who agree that in truly Christian households women must submit to a man’s leadership are about twice as likely to favor allowing religiously based service refusals as those who disagree with this idea (49% vs. 25%). A majority of Americans who believe that society has become too soft and feminine favor allowing service refusals (53%), compared to 21% of those who disagree with the notion that society is too feminine. Finally, 55% of those who agree that society punishes men for acting like men support service refusals, compared to 22% of Americans who disagree with that statement.
Around half of Americans who hold patriarchal views of society support the legality of same-sex marriage, including 47% of those who agree that women should submit to a man’s leadership, 53% of those who agree that society has become too soft and feminine, and 53% of those who say society punishes men for acting like men. At least eight in ten Americans who disagree with these statements favor legal same-sex marriage (83%, 82%, and 80%, respectively).
Appendix 1: Survey Methodology
Appendix 2: The Structural Racism Index
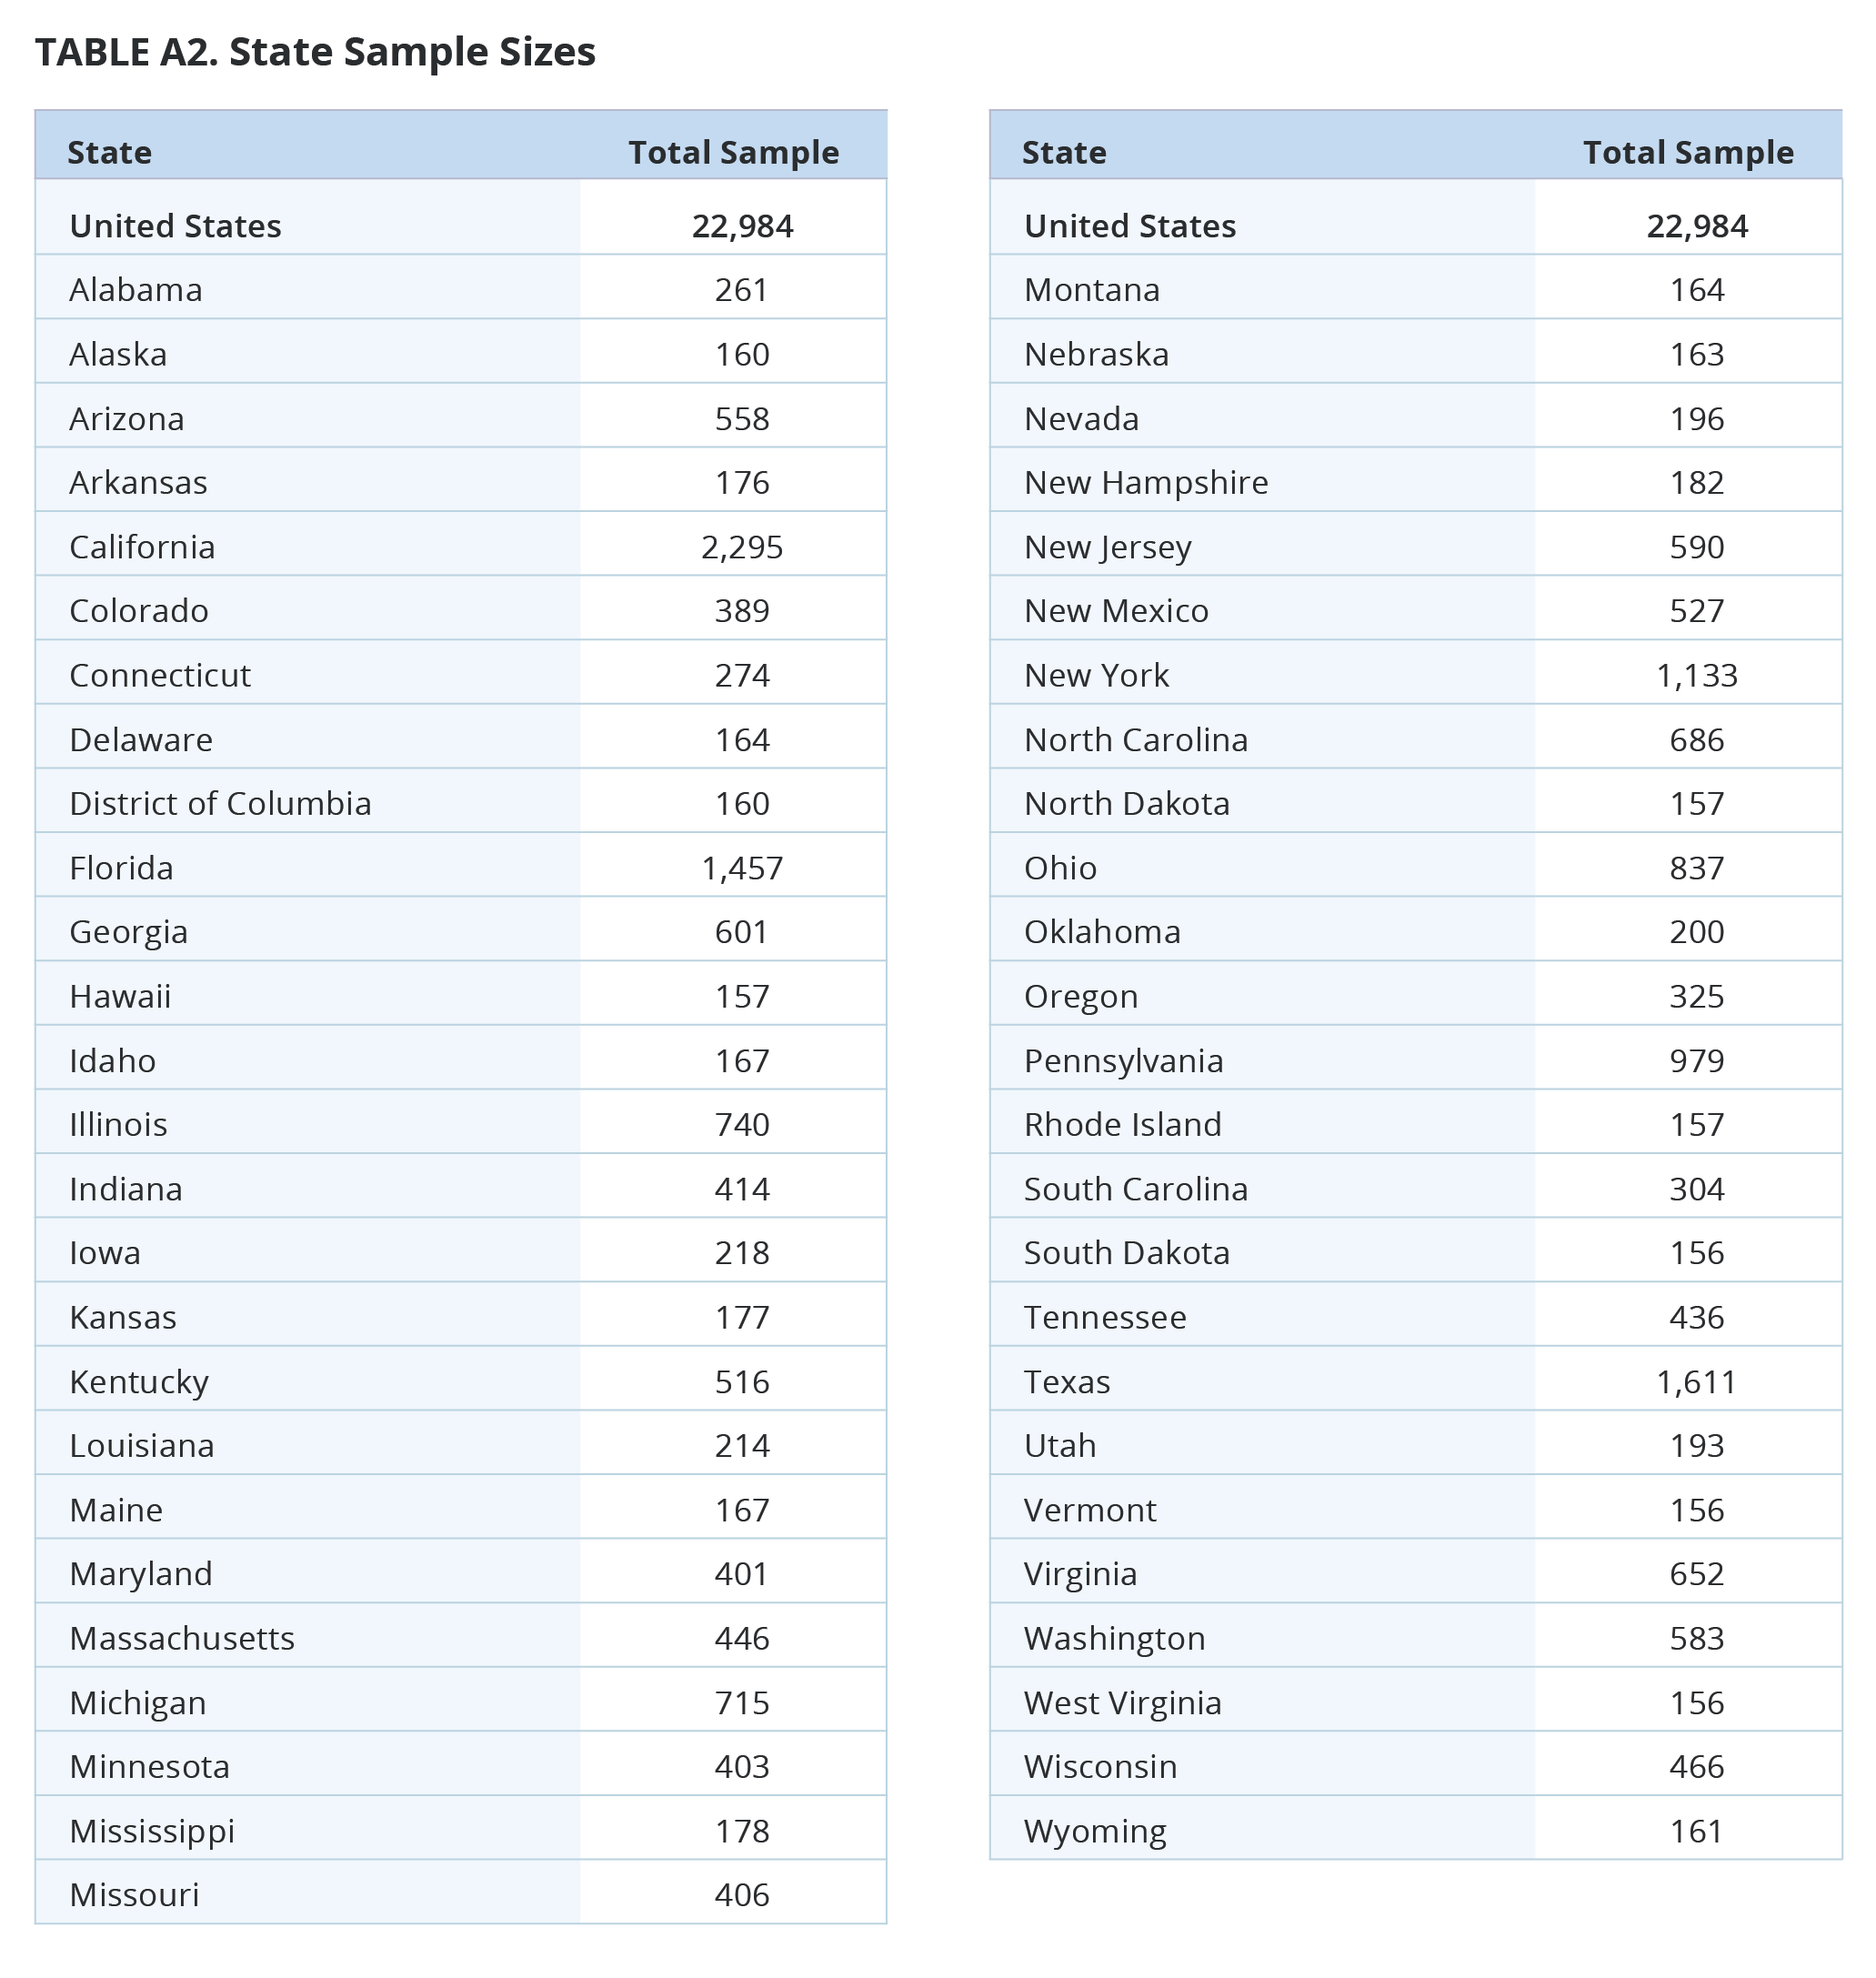
Appendix 3: The Christian Nationalism Scale
To develop the Christian nationalism scale, respondents were asked whether they completely agree, mostly agree, mostly disagree, or completely disagree with each of the following statements:
- The U.S. government should declare America a Christian nation.
- S. laws should be based on Christian values.
- If the U.S. moves away from our Christian foundations, we will not have a country anymore.
- Being Christian is an important part of being truly American.
- God has called Christians to exercise dominion over all areas of American society.
The answers across all five questions are highly correlated, with a Cronbach’s alpha of 0.92, and they were combined to create the Christian nationalism scale. The scale combines answers to these questions using an additive scale and recalibrates the scores to values from 0 (low) to 1 (high).
Each respondent is given a composite score based on their answers to the five questions and is then assigned into one of four key groups:
- Christian Nationalism Adherents (Score 0.75–1): These Americans overwhelmingly either agree or completely agree with the statements in the scale. This group includes 10% of Americans.
- Christian Nationalism Sympathizers (Score 0.5–0.74): A majority of these Americans agree with the statements in the scale but they are less likely than adherents to completely agree. This group includes 19% of Americans.
- Christian Nationalism Skeptics (Score 0.01-0.49): A majority of these Americans disagree with the statements in the scale but are less likely than rejecters to completely disagree. This group includes 39% of Americans.
- Christian Nationalism Rejecters (Score 0): These Americans completely disagree with all five statements in the scale. This group includes 29% of Americans.
Endnotes
[1] https://www.congress.gov/bill/117th-congress/house-bill/8404
In late 2022, Congress passed the Respect for Marriage Act, which protects statutory recognition of same-sex and interracial marriage federally. The bill also requires that states recognize the sovereignty of marriages performed in other states but stops short of requiring states to legalize same-sex marriage.
[2] https://www.cnn.com/2022/06/24/politics/abortion-ruling-gay-rights-contraceptives/index.html
[3] https://www.aclu.org/legislative-attacks-on-lgbtq-rights
[4] Generation Z (born 1997-2004), millennials (born 1981-1996), Generation X (born 1965-1980), baby boomers (born 1946-1964), Silent Generation (born before 1946).
[5] PRRI’s American Values Atlas was conducted by random-digit-dial telephone (calling both landlines and cell phones) from 2014 to 2020. In 2021, the project transitioned to a probability-based online panel. In the transition, demographic and religious metrics were compared to ensure the two sources were comparable; however, it is possible that the change in survey mode from telephone to internet caused some small additional changes to the data beyond the usual sampling error that accompanies all surveys. A full methodological description is available in the appendix.
[6] Orthodox Christians (N=89), Muslims (N=96), and Hindus (N=98) are the only religious groups for which the number of respondents was lower than 100. Results need to be interpreted with caution.
[7] Support among AAPI is not available in the 2015 dataset.
[8] The States with nondiscrimination protections for LGBTQ people are California, Colorado, Connecticut, Delaware, the District of Columbia, Hawaii, Illinois, Iowa, Maine, Maryland, Massachusetts, Michigan, Minnesota, Nevada, New Hampshire, New Jersey, New Mexico, New York, Oregon, Rhode Island, Utah, Vermont, Virginia, and Washington. States were determined to fall into this category if they had laws explicitly protecting LGBTQ people from housing, employment, and public accommodations discrimination, https://www.lgbtmap.org/equality-maps/non_discrimination_laws
[9] Orthodox Christians (N=89), Muslims (N=96), and Hindus (N=98) are the only religious groups for which the number of cases was lower than 100. Because of the low number of cases, the results for these groups need to be interpreted with caution.
[10] Same-sex couples would be legally allowed to marry in the District of Columbia and 18 states: California, Connecticut, Delaware, Hawaii, Illinois, Iowa, Maine, Maryland, Massachusetts, Minnesota, Nevada, New Hampshire, New Jersey, New Mexico, New York, Rhode Island, Vermont, and Washington. In the rest of the states, same-sex marriage would become banned.
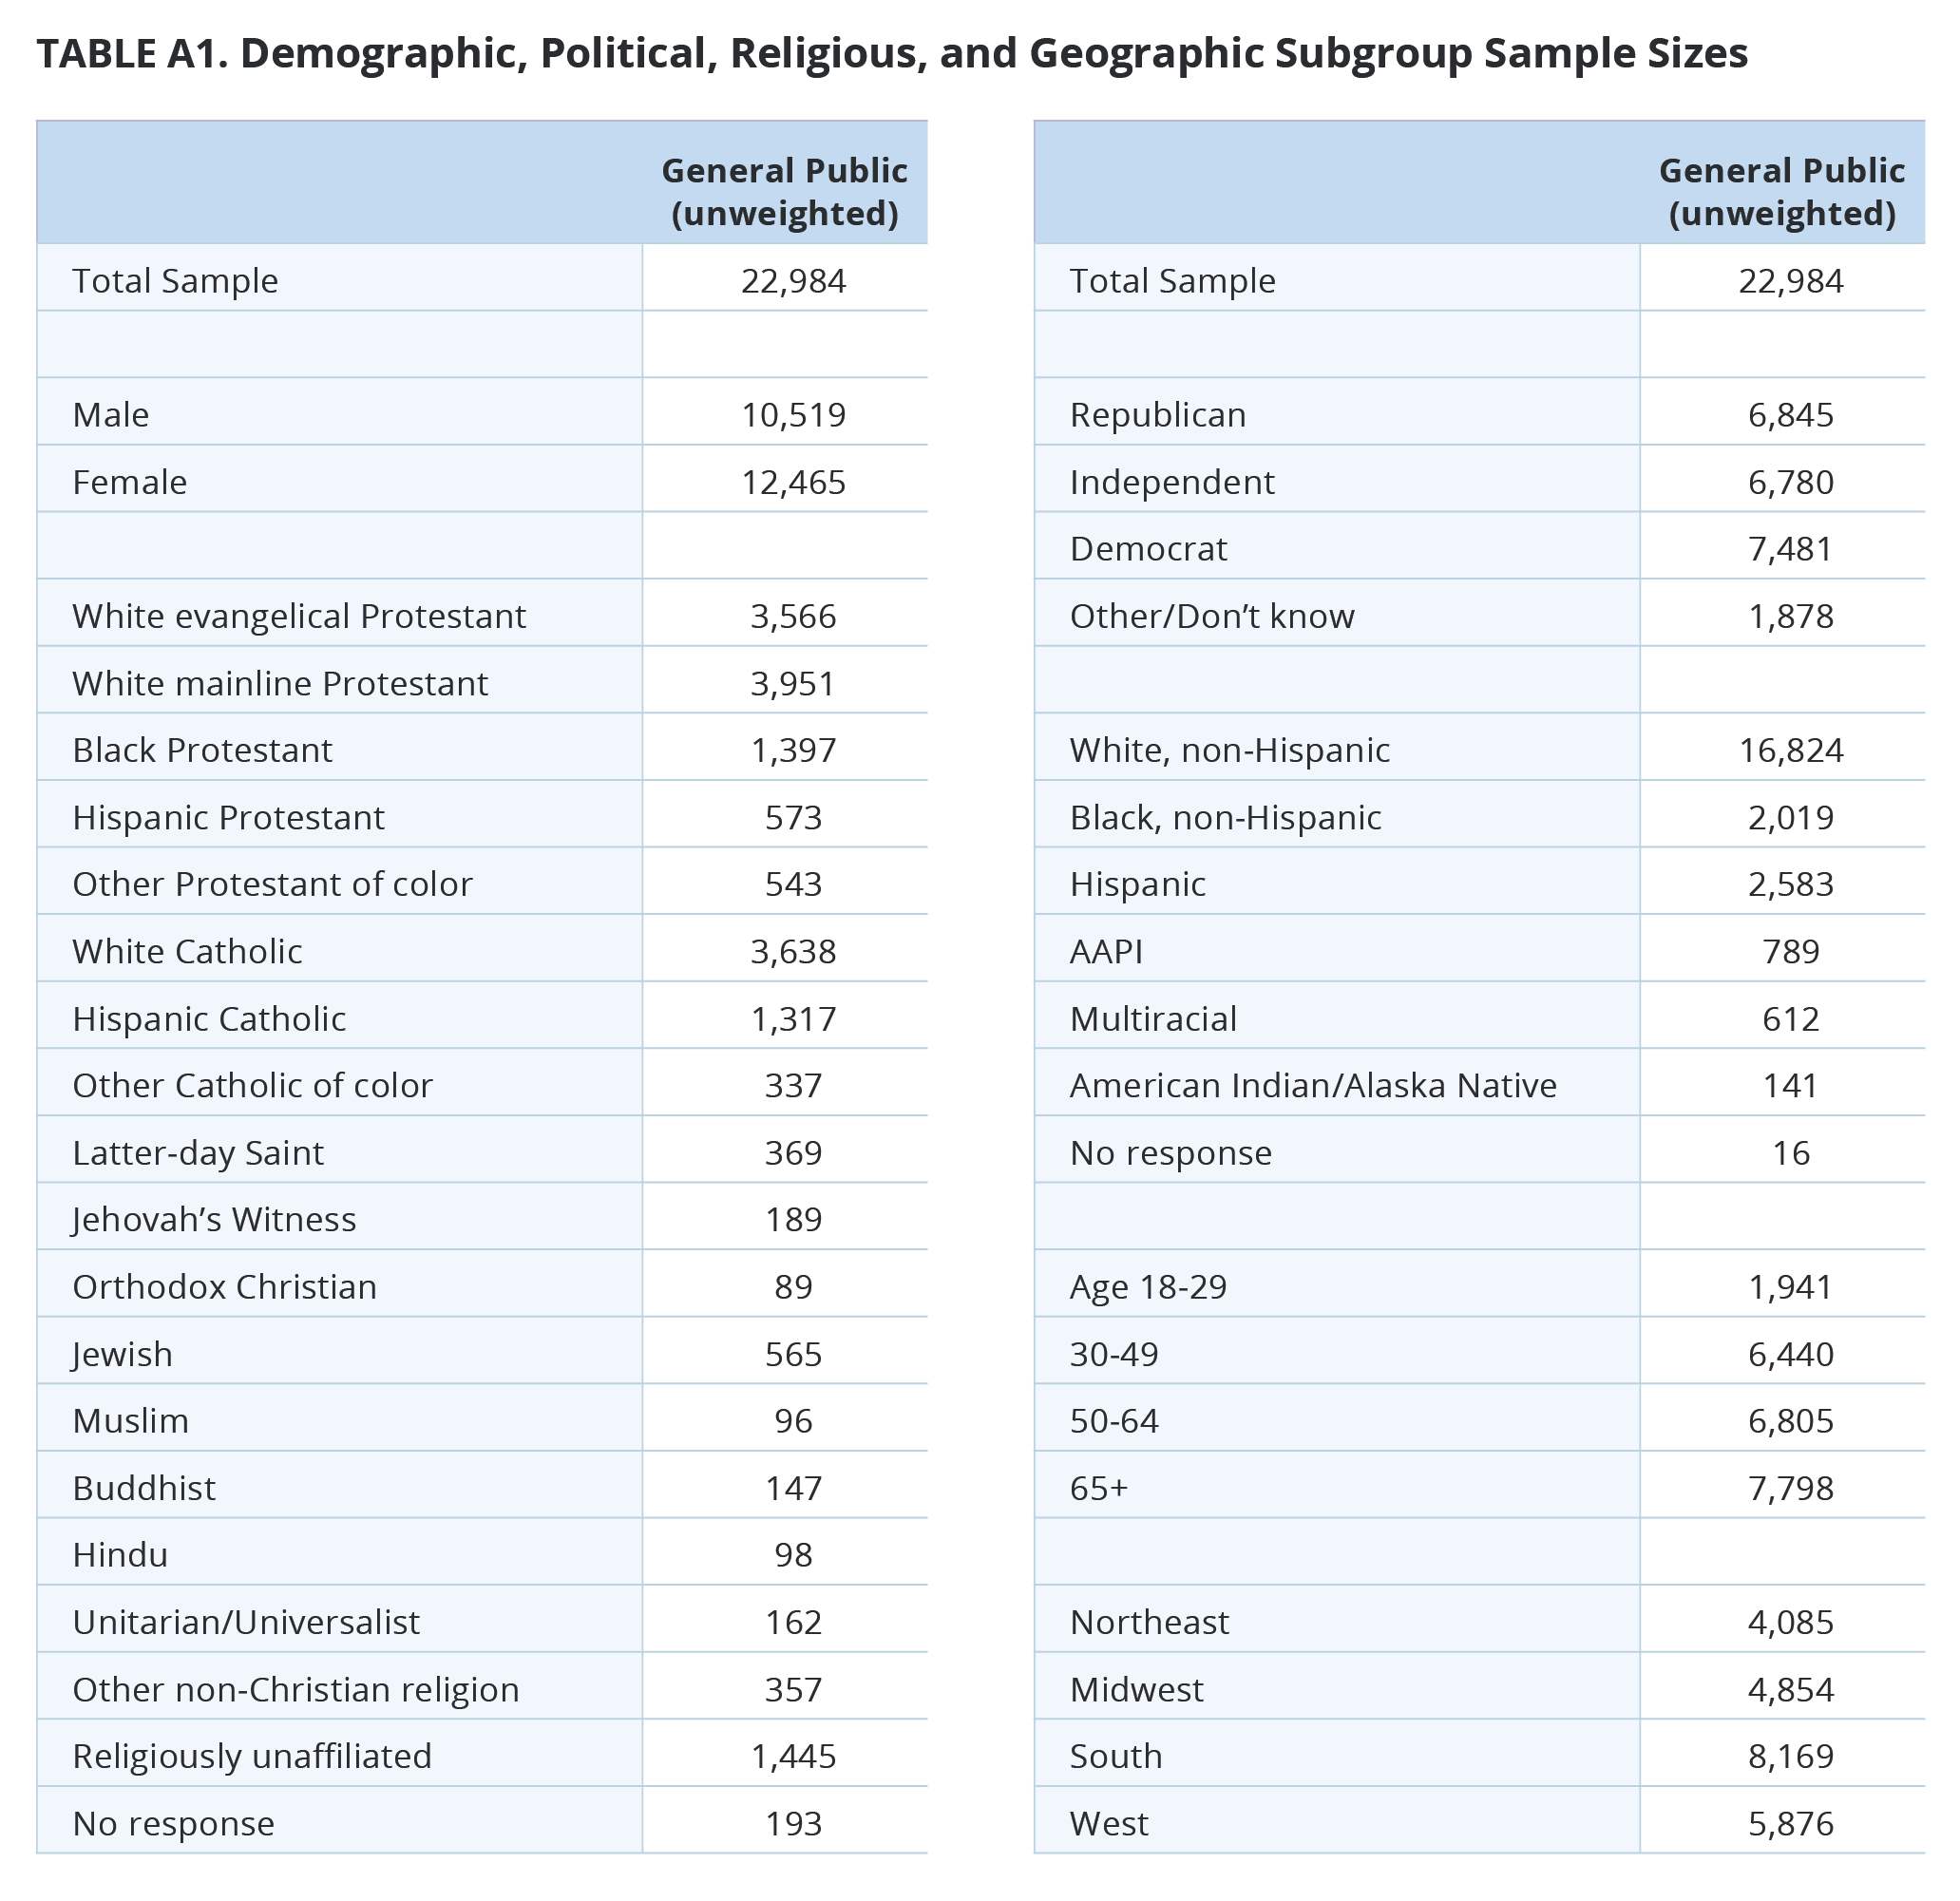
[11] The methodology for creating the Structural Racism Index was first developed in PRRI President Robert P. Jones’s 2020 book “White Too Long: The Legacy of White Supremacy in American Christianity,” using data collected in PRRI’s 2018 American Values Survey. The Structural Racism Index discussed here uses seven of the original fifteen questions, plus four new questions. Because the question battery has changed over time, trends are not directly comparable. Only respondents who completed at least six of the 11 items are included in the scale, n=5,317. The 11 questions have a Cronbach’s alpha of 0.93, indicating that responses are highly correlated and scaling is appropriate.


