Findings from the 2024 American Values Survey: Executive Summary
Introduction
State of the Country
Critical Issues
“Litmus Test” Issues That Drive Voting Choices
The State of the Economy in America
Favorability Ratings of 2024 Candidates
The 2024 Election: The Horse Race, Nominee Traits, and Perceptions of Trump and Harris as Threats to Democracy
Political Violence and Concerns About 2024 Election
Beliefs About Trump, the 2020 Election, and the Jan. 6 Insurrection
Specific Issues
Survey Methodology
To view a PDF of findings presented October 16, 2024, click here. To view the release event featuring a panel discussion of the survey’s findings, click here.
Findings from the 2024 American Values Survey: Executive Summary
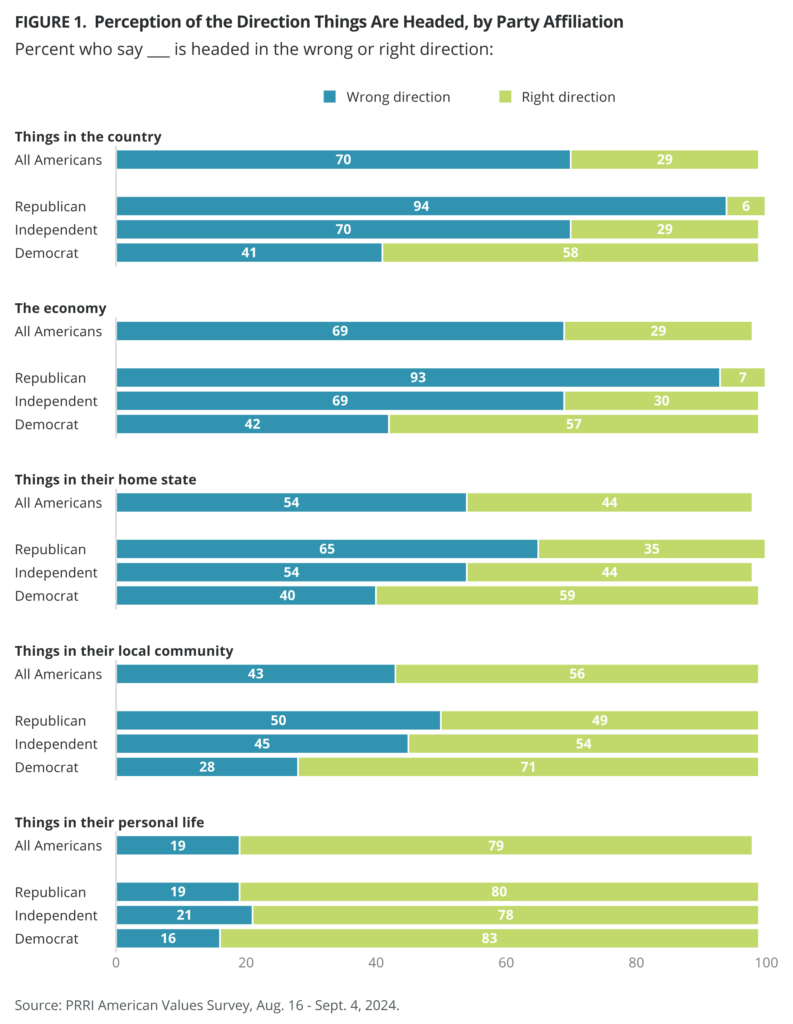
While most Americans believe the country is headed in the wrong direction, they have more positive assessments of how things are going in their communities and personal lives.
- Seven in ten Americans (70%) believe things in the country are going in the wrong direction, including most Republicans (94%) and independents (70%), compared with 41% of Democrats.
- While a majority of Americans (54%) also believe that things in their home state are going in the wrong direction, 56% of Americans believe things in their local communities are going in the right direction. Roughly eight in ten Americans, across party lines, believe that things in their personal lives are going in the right direction.
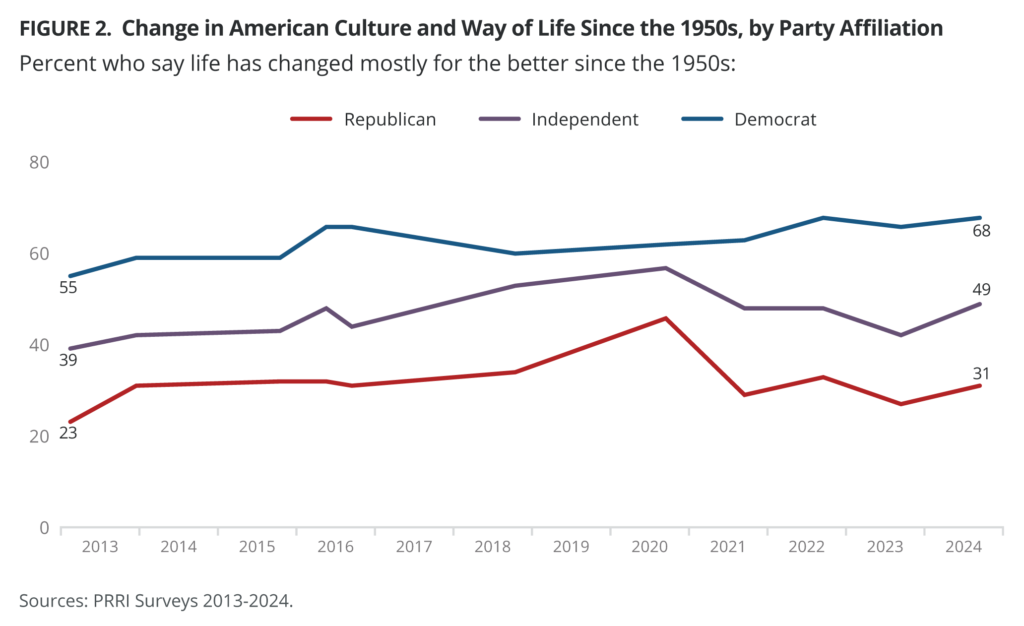
Americans are divided on whether American culture and way of life since the 1950s has changed for the better, with Republicans and Democrats holding opposite views.
- Republicans (68%) are more likely than independents (48%) and Democrats (31%) to say that American culture and way of life has mostly changed for the worse since the 1950s.
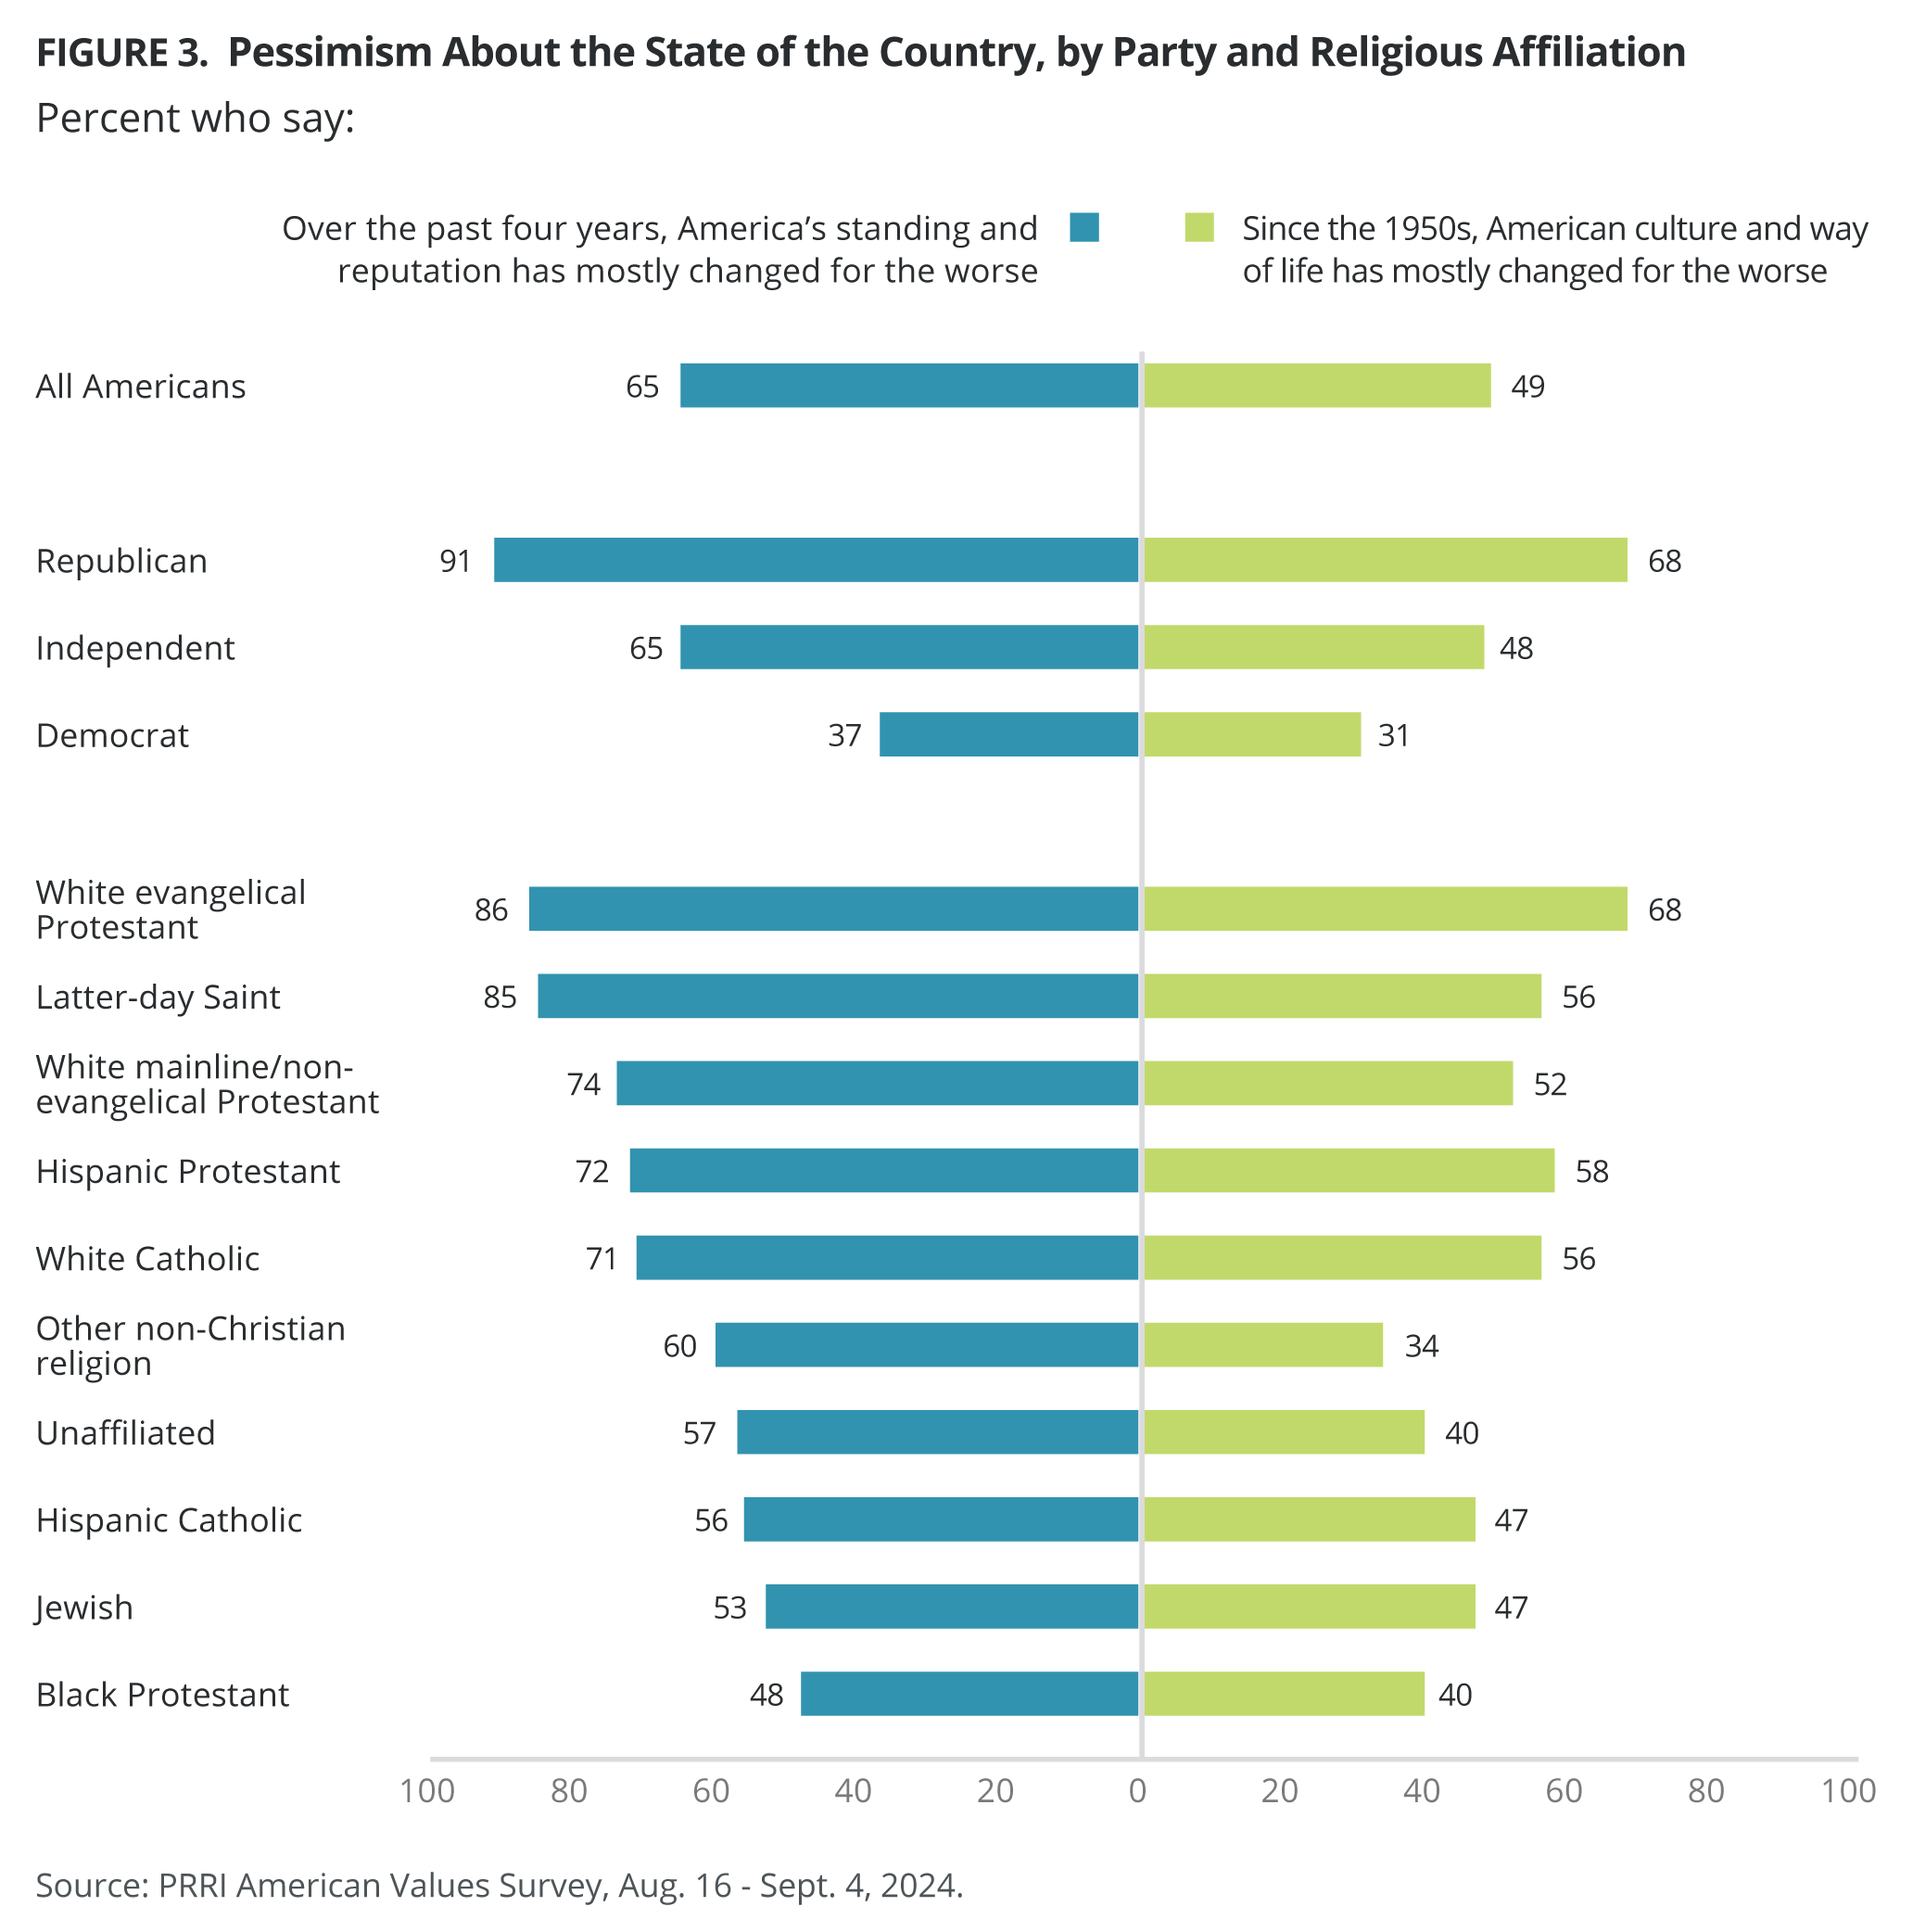
- White Christian groups and Hispanic Protestants are the most likely to say American culture and way of life has changed for the worse since the 1950s.
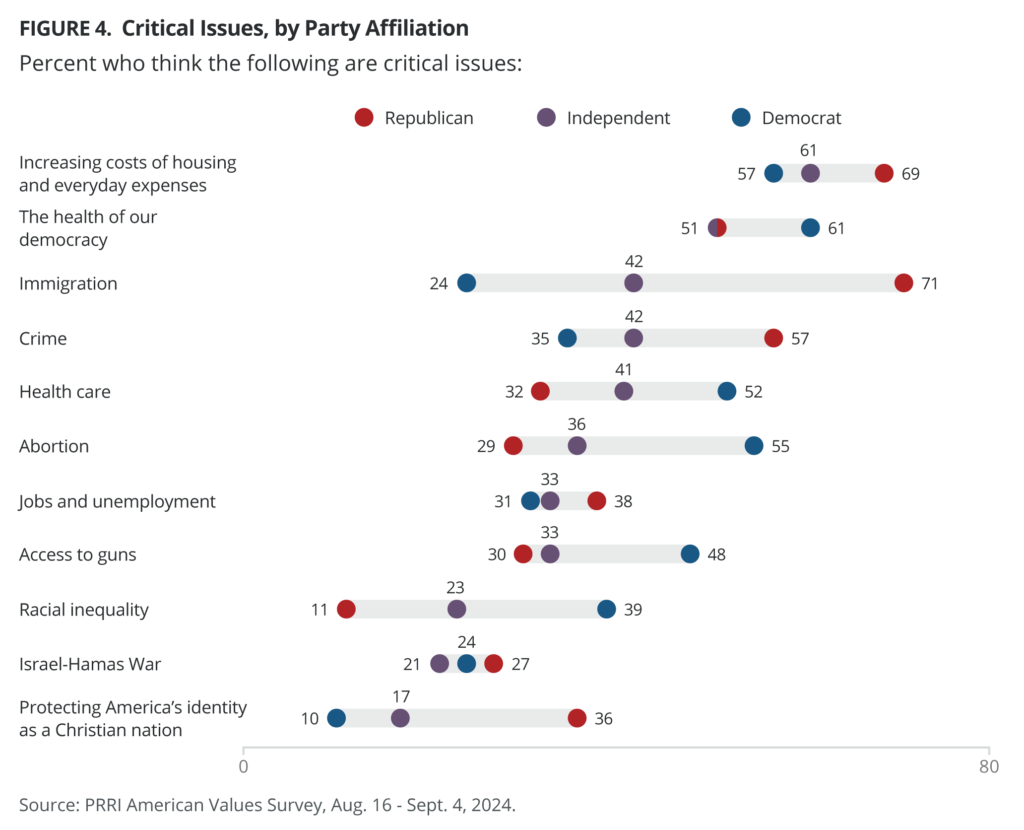
Inflation remains a predominant concern among all Americans; among Republicans, immigration and crime are top critical issues while abortion and the health of democracy rank higher for Democrats.
- More than six in ten Americans rate increasing costs of housing and everyday expenses as a critical issue to their vote in November. A slim majority of Americans (53%) also rate the health of our democracy as a critical issue. Around four in ten Americans say that immigration (44%), crime (43%), health care (42%), and abortion (40%) are critical issues to their vote.
- Republicans are most likely to rank immigration as a critical issue (71%), followed by inflation (69%) and crime (57%). Around six in ten Democrats (61%) rank the health of our democracy as a critical issue, followed by inflation (57%) and abortion (55%).
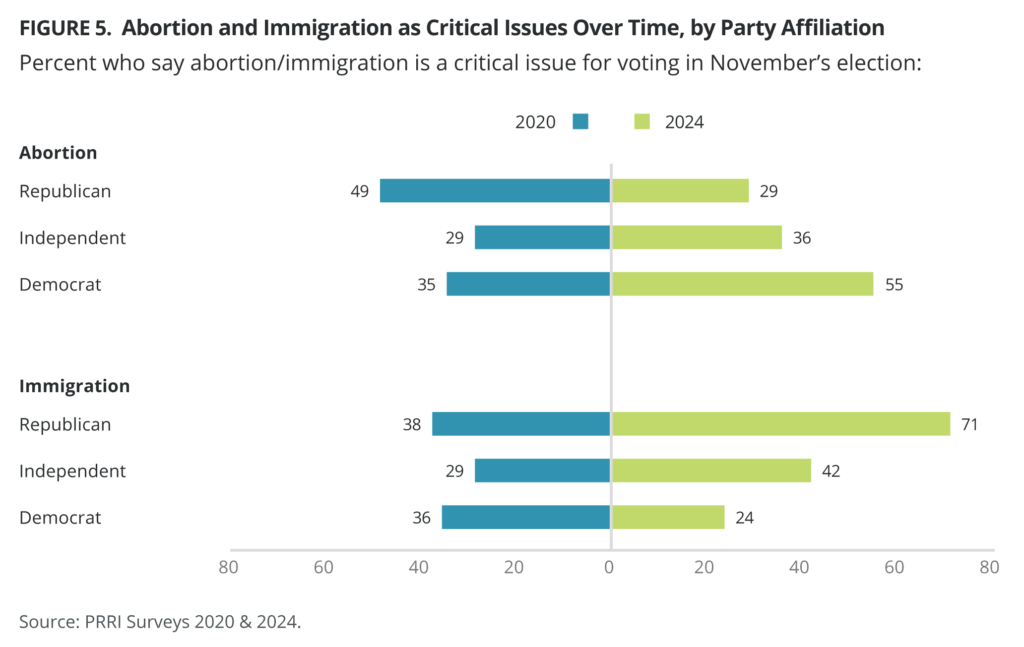
- Among Republicans, abortion has declined as a critically important issue since the last presidential election, from 49% in 2020 to 29% in 2024. Abortion has increased in salience among Democrats, from 35% in 2020 to 55% in 2024.
- Since the last presidential election, immigration has become far more salient for Republicans, with the percentage considering it a critical issue rising from 38% in 2020 to 71% in 2024. While 36% of Democrats viewed immigration as a critical issue in 2020, that figure drops to 24% today. However, immigration has risen in significance for independents, from 29% in 2020 to 42% in 2024.
The role of abortion and immigration among voters as “litmus test” voting issues differ along partisan and religious lines.
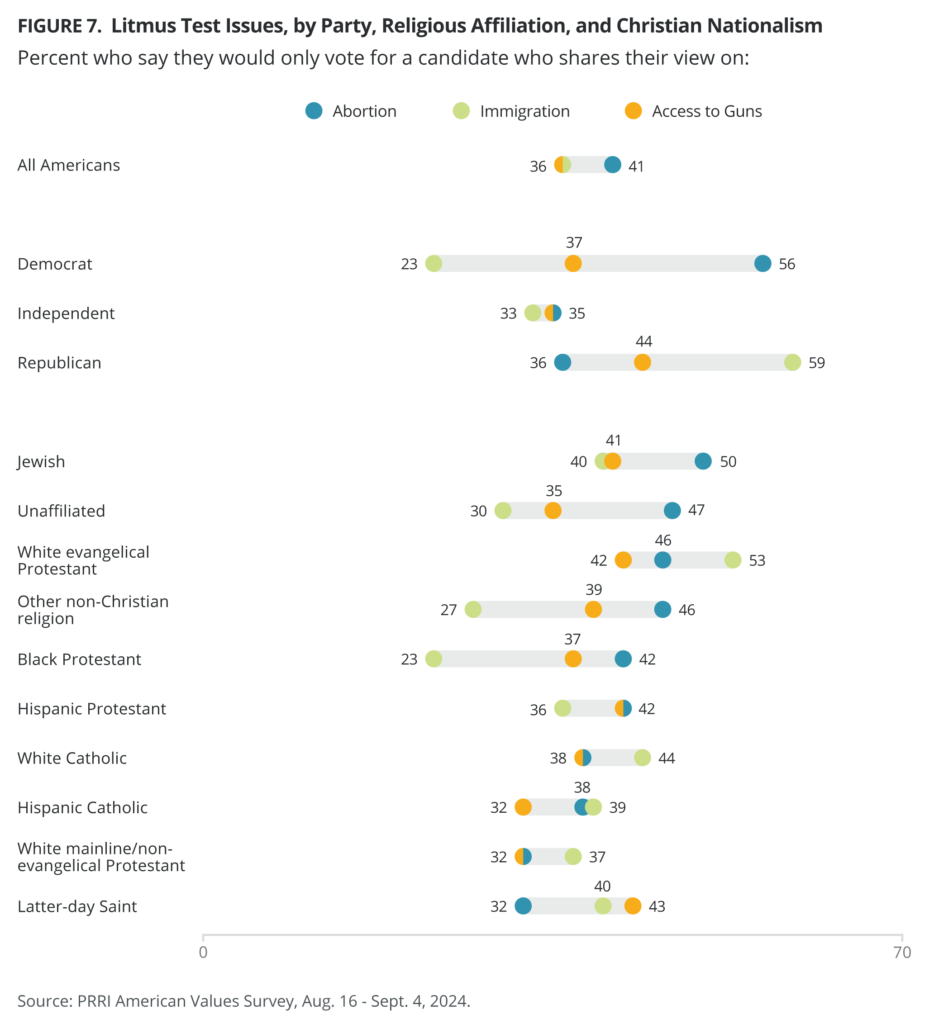
- Four in ten Americans (41%) say they will only vote for a candidate who shares their views on abortion, with Democrats (56%) being far more likely than either Republicans (36%) and independents (35%) to say so.
- While more than one-third of Americans (36%) say they will only vote for a candidate who shares their views on immigration, nearly six in ten Republicans (59%) say so, compared with 23% of Democrats and 33% of independents.
Most Americans express high levels of concern about economic stress.
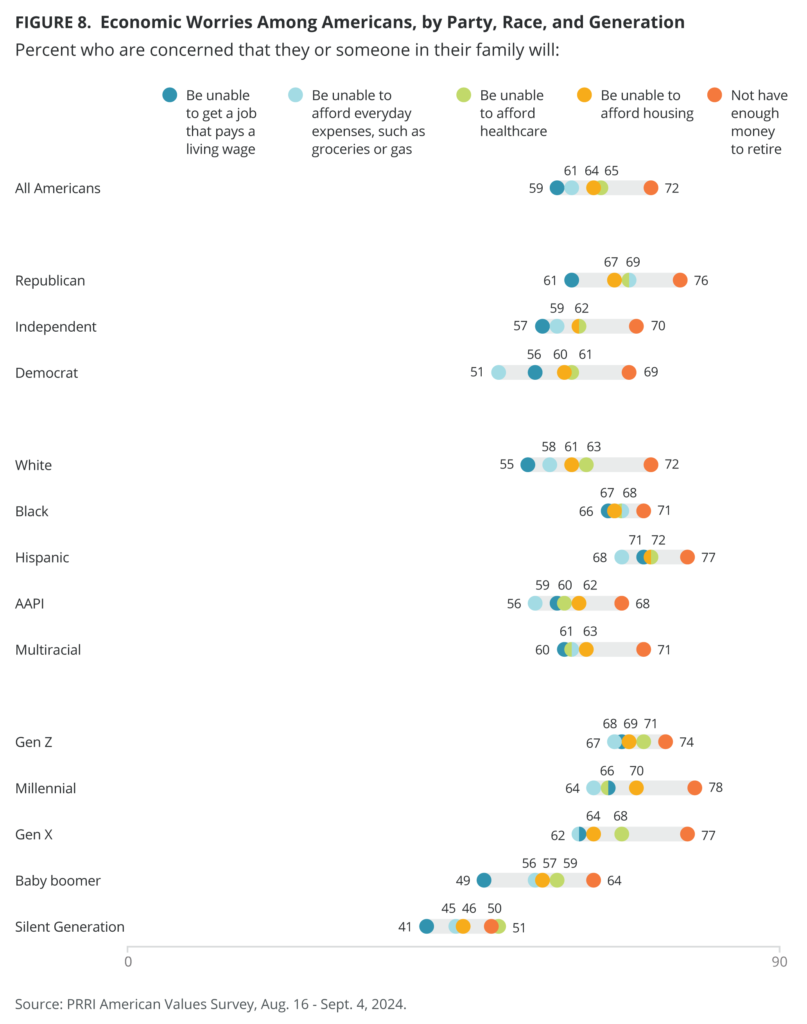
- Seventy-two percent of Americans say they are worried about not having enough money to retire, while more than six in ten say they are worried about being unable to afford health care (65%), housing (64%), everyday expenses such as groceries or gas (61%), or getting a job that pays a living wage (59%).
- Hispanic Americans consistently show the highest levels of concern about all five of these indicators; older Americans, including baby boomers and those from the Silent Generation, are significantly less worried about these issues than younger Americans.
Vice President Kamala Harris enjoys a small lead over former President Donald Trump nationally among registered voters.
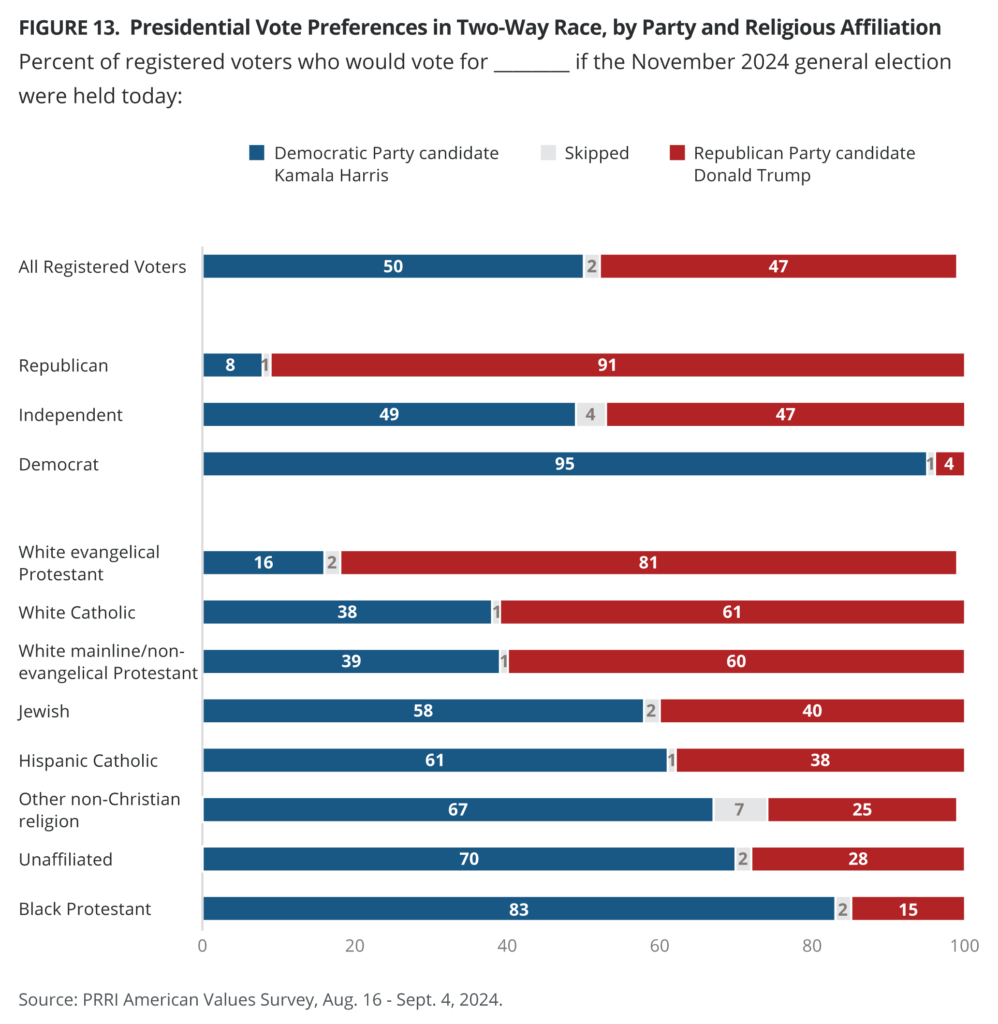
- In a two-way matchup among registered voters, Harris leads Trump (50% vs. 47%).
- In a two-way race, white evangelical Protestants remain the strongest backers of Trump (81%), followed by white Catholics (61%) and white mainline/non-evangelical Protestants (60%). By contrast, more than eight in ten Black Protestants back Harris (83%), as do 70% of religiously unaffiliated Americans and 61% of Hispanic Catholics.
- Among white Americans, church attendance is strongly linked to preference for Trump. Three-quarters of white Americans who attend church weekly support Trump, compared with 43% of white Americans who seldom or never attend church. This pattern is also true for Hispanic Americans, though it is less pronounced. Black Americans back Harris at high rates regardless of church attendance levels.
Americans who prioritize economic factors and immigration are more likely to vote for Trump, while those who prioritize abortion and the health of democracy are more likely to vote for Harris. Those with more optimistic views on culture, the economy, and their personal lives back Harris over Trump.
- Three-quarters of voters (75%) who say that immigration is a critical issue prefer Trump over Harris (23%).
- Voters who say that jobs and unemployment are a critical issue prefer Trump (58%) over Harris (41%); similarly, voters who prioritize increasing costs of housing and everyday expenses slightly prefer Trump instead of Harris (53% vs. 45%).
- Voters who say that the health of our democracy is a critical issue are more likely to back Harris over Trump (58% vs. 41%); voters who say that abortion is a critical issue are substantially more likely to prefer Harris (69%) over Trump (29%).
- Voters who say that American culture since the 1950s has changed for the worse, that the economy is headed in the wrong direction, and that their personal lives are headed in the wrong direction back Trump widely over Harris.
Republicans are far more likely than Democrats to support their candidate assuming office by force after an election loss.
- Nearly one in five Republicans (19%), including 23% of Republicans who hold a favorable view of Trump, say that if Trump loses the election, he should declare the results invalid and do whatever it takes to assume office.
- About one in ten Democrats (12%), including 12% of Democrats who hold a favorable view of Harris, say that if Harris loses the election, she should declare the results invalid and do whatever it takes to assume office.
- Nearly half of Americans (49%) agree that there is a real danger that Trump will use the presidency to become a dictator, compared to only 28% who hold similar concerns about Harris.
Although most Americans reject political violence, Republicans remain more likely than Democrats to support potential political violence.
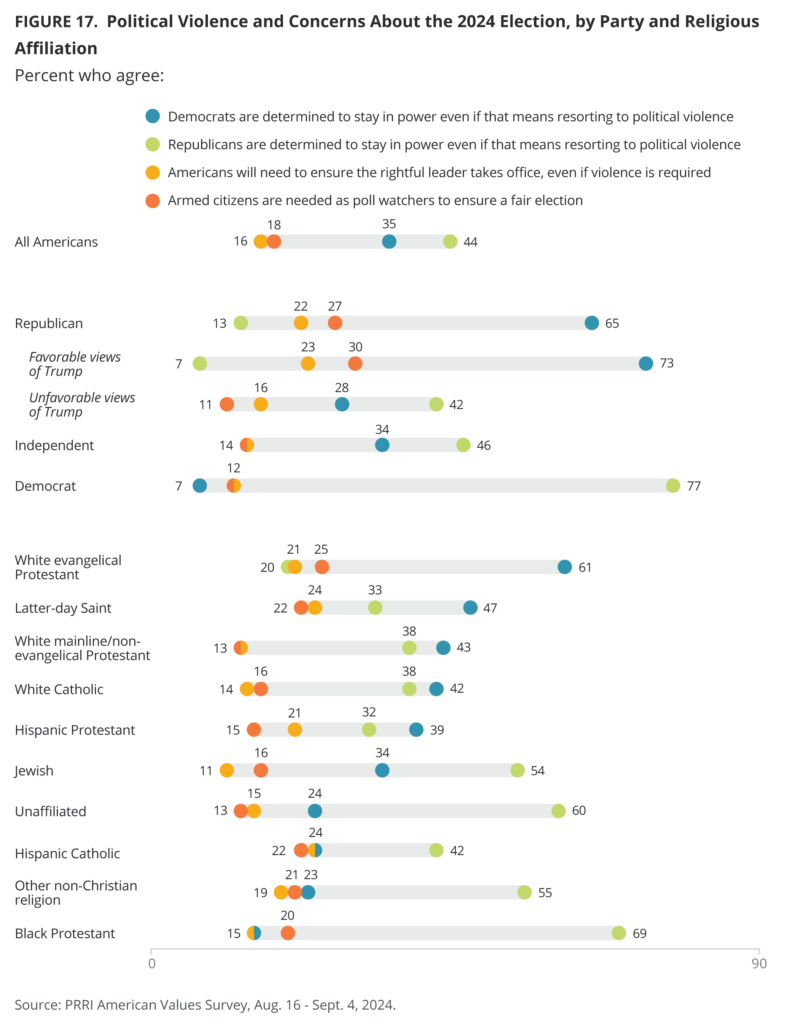
- Nearly half of Americans (45%) believe Republicans are determined to stay in power, even if that means resorting to political violence, compared with about one-third (35%) who think the same about Democrats.
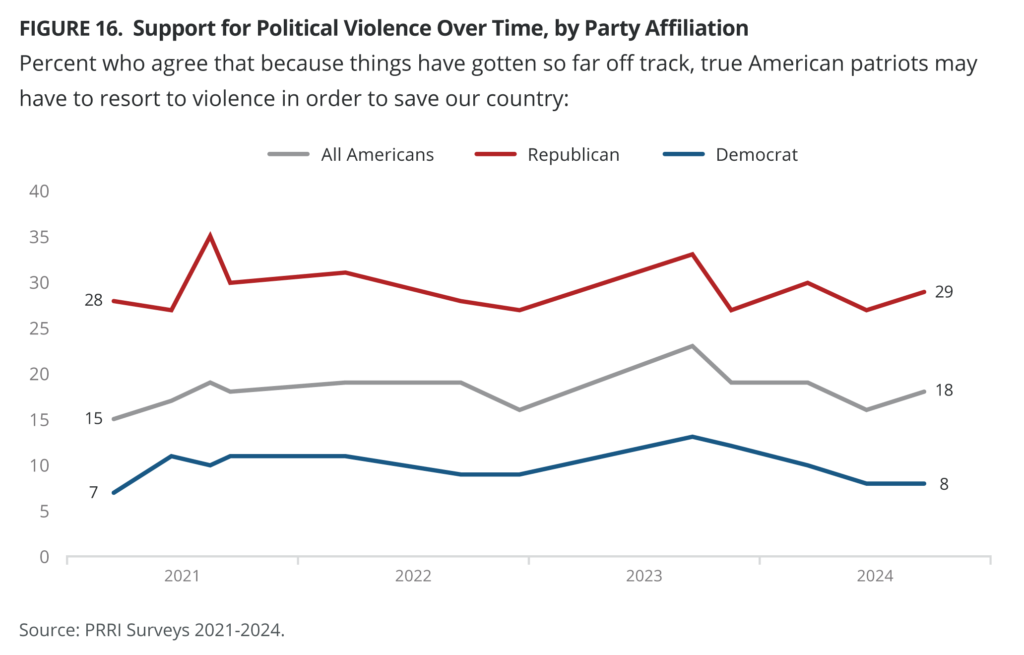
- Nearly three in ten Republicans (29%) believe that true American patriots may have to resort to violence to save the country, compared with 16% of independents and 8% of Democrats.
- Republicans are twice as likely (27%) as independents (14%) or Democrats (12%) to agree that armed everyday citizens should be poll watchers, even if this makes some voters uncomfortable.
- While most Americans (80%) disagree that “if the 2024 presidential election is compromised by voter fraud, everyday Americans will need to ensure the rightful leader takes office, even if it requires taking violent actions,” Republicans (22%) are more likely to agree than independents (14%) or Democrats (12%).
Views on whether Trump broke the law trying to stay in power after losing the 2020 election, whether the election was stolen from Trump, and whether those convicted in the Jan. 6 insurrection are being held hostage by the government are strongly shaped by partisanship and news viewership.
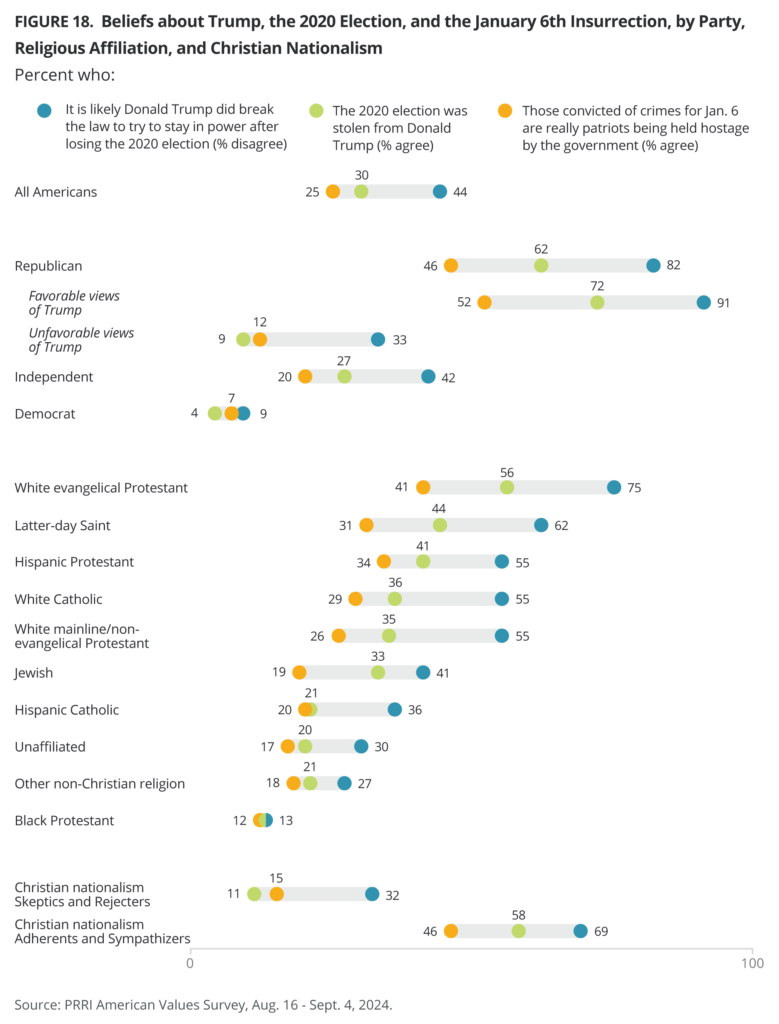
- A slim majority of Americans (53%) agree it is likely that Trump broke the law to try to stay in power after losing the 2020 election, though just 17% of Republicans agree. Americans who most trust Fox News (12%) or far-right news outlets (4%) are the least likely to believe Trump broke the law to stay in power after losing the election.
- More than six in ten Republicans (62%), compared with 27% of independents and 4% of Democrats, believe the 2020 election was stolen from Trump. Americans who most trust far-right TV news outlets (84%) and Fox News (64%) are the most likely to agree with the statement that the 2020 election was stolen from Trump.
- Only one in four Americans (25%) agree with Trump’s frequent claim that “the people convicted for their role in the violent Jan. 6 attacks on the U.S. Capitol are really patriots who are being held hostage by the government.” Republicans (46%) are more than twice as likely as independents (20%) and about seven times as likely as Democrats (7%) to agree with this statement.
There are deep partisan divides about the value of a college education.
- Americans are slightly less likely to say a college education is a smart investment in the future (47%) than to say it is a risky gamble that might not pay off (51%). Republicans (39%) are far less likely than Democrats (62%) to believe a college education is a wise investment.
- Two-thirds of Americans say that the college education system broadens the worldview of young people (67%) rather than radicalizes them (30%); Democrats are twice as likely as Republicans to say college broadens the worldview of young people (90% vs. 46%).
Strong majorities of Americans support Supreme Court reform and oppose limiting access to in vitro fertilization (IVF).
- Nearly three-quarters of Americans (73%) favor requiring Supreme Court justices to retire at a certain age or after a certain number of years instead of serving for life, including 88% of Democrats, 72% of independents, and 59% of Republicans.
- The vast majority of Americans (85%) oppose laws that make it illegal for people to seek out IVF to have a child; there are little differences between Democrats (88%), independents (86%), and Republicans (85%). Strong majorities of Americans across faith traditions also oppose such laws.
Approximately two-thirds of Americans today support abortion rights and same-sex marriage.
- About six in ten Americans (62%) say abortion should be legal in most or all cases, including 86% of Democrats, 65% of independents, and 40% of Republicans. While most religious Americans support abortion legality, just 41% of Hispanic Protestants, 29% of white evangelical Protestants, and 27% of Latter-day Saints do.
- Two-thirds of Americans (65%) favor ensuring at least some health care professionals in their community provide legal abortions (65%) and oppose laws that make it illegal to use or receive through the mail FDA-approved drugs for a medical abortion (68%).
- Two-thirds of Americans (66%) support allowing same-sex couples to marry legally, a 12-percentage-point increase from 2014 (54%).
While most Americans are broadly supportive of LGBTQ rights, views on issues related to transgender rights are more divided.
- Most Americans (57%) support laws that require driver’s licenses or government IDs to display a person’s sex at birth rather than their gender identity, while fewer than four in ten Americans (38%) oppose them. More than eight in ten Republicans (83%) support such laws, compared with 59% of independents and 34% of Democrats.
- Americans are divided on whether they favor (47%) or oppose (49%) laws that would prevent parents from allowing their child to receive medical care for a gender transition. Republicans are more than twice as likely as Democrats to favor such laws (68% vs. 26%).
While most Americans express concern about the economic burdens immigrants place on communities, fewer Americans believe that immigrants increase crime rates in local communities or believe immigrants are invading or poisoning the blood of our country.
- Nearly six in ten Americans (57%) say the growing number of newcomers from other countries burdens local communities by using more than their share of social services, including 86% of Republicans, 57% of independents, and 36% of Democrats.
- Around four in ten Americans (43%) say that immigrants increase crime rates in local communities; Republicans are more than four times as likely as Democrats to agree (73% vs. 17%).
- While few Americans (35%) agree that “immigrants are invading our country and replacing our cultural and ethnic background,” this view is held by 65% of Republicans, as well as most viewers of far-right news (83%) and Fox News viewers (66%). White evangelical Protestants (62%) are the only religious group among whom a majority agree that immigrants are invading our country and replacing our cultural and ethnic background.
- One-third of Americans (34%) say that immigrants entering the country illegally today are “poisoning the blood of our country,” including six in ten Republicans (61%), 30% of independents, and only 13% of Democrats. White evangelical Protestants (60%) are the only religious group among whom a majority agree that immigrants entering the country illegally are poisoning the blood of the country.
American attitudes about immigration policies have grown more conservative; nationally, those trends are driven primarily by Republicans and independents adopting more conservative views in recent years.
- Most Americans (56%) say that immigrants living in the United States illegally should be given a pathway to become citizens, provided they meet certain requirements, a decline from 63% in 2013. Among Republicans, support for a pathway to citizenship has dropped from 53% in 2013 to 36% in 2024. Support for a pathway to citizenship has also declined among independents, from 64% in 2013 to 55% today.
- A slim majority of Americans (52%) favor allowing immigrants brought illegally to the U.S. as children to gain legal resident status, while 44% oppose this. Support for this policy has decreased since the first time PRRI asked the question in 2018 (62%). More than three-quarters of Democrats (77%) favor allowing children brought to the U.S. illegally to gain resident status, compared with 56% of independents and 27% of Republicans.
- Support for building a wall along the U.S. border with Mexico has grown from 41% in 2016 to 51% today. Republicans (88%) are more than four times as likely as Democrats (21%) to support building such a wall.
- Americans are divided on whether they favor (47%) or oppose (50%) rounding up and deporting immigrants who are in the country illegally, even if it takes setting up encampments guarded by the U.S. military. Nearly eight in ten Republicans (79%) favor putting undocumented immigrants in encampments, compared with 47% of independents and 22% of Democrats.
Introduction
With the 2024 presidential election around the corner, the 15th annual American Values Survey of more than 5,000 Americans, conducted by PRRI in partnership with the Brookings Institution, takes a closer look at Americans’ attitudes toward Vice President Kamala Harris and former President Donald Trump, as well as the issues that define their preferences for either candidate. The survey also illuminates Americans’ concerns regarding the 2024 election, the overall direction of the country, the state of the economy, and the broader health of our democracy. Additionally, the survey highlights attitudes about college education, women’s reproductive rights, gender and LGBTQ issues, systemic racism and the state of race relations in the U.S., immigration, and foreign policy.
State of the Country
The Right or Wrong Direction?
The Country
Seven in ten Americans (70%) believe things in the country are going in the wrong direction, compared with three in ten (29%) who believe the country is headed in the right direction . These opinions are less pessimistic than last year (77% and 22%, respectively). Most Republicans (94%), seven in ten independents (70%), and four in ten Democrats (41%) say the country is going in the wrong direction.
Among partisans, perceptions of the direction of the country are colored by which party controls the White House. In September 2020, two months before the last presidential election when Trump was president, only one-third of Republicans (33%) felt the country was going in the wrong direction, compared with nearly nine in ten Democrats (89%). Roughly seven in ten independents (73%) believed the country was going in the wrong direction in September 2020, which mirrors findings from this year’s survey.
The Economy
A majority of Americans say the economy is headed in the wrong direction (69%), while three in ten say the economy is headed in the right direction (29%). Nearly all Republicans (93%) say the economy is headed in the wrong direction, compared with 69% of independents and 42% of Democrats.
Home State
A majority of Americans (54%) believe that things in their home state are going in the wrong direction, including 65% of Republicans, 54% of independents, and 40% of Democrats. By contrast, slightly more than four in ten Americans (44%) say their home state is going in the right direction.
Local Community
Only 43% of Americans say things in their local community are headed in the wrong direction, compared with 56% who say things are headed in the right direction. Half of Republicans (50%) say things in their local community are headed in the wrong direction, compared with 45% of independents and about three in ten Democrats (28%).
Personal Life
Around eight in ten Americans believe that things in their personal lives are headed in the right direction (79%), while under two in ten say things are headed in the wrong direction (19%). Solid majorities across all key demographic groups say their personal lives are headed in the right direction.
Change Since the 1950s
Americans are split on whether American culture and way of life have mostly changed for the better (48%) or mostly changed for the worse (49%) since the 1950s. This represents a 6-percentage-point shift from last year when 44% of Americans said life had changed for the better, compared with 55% who said it changed for the worse. Republicans (68%) are more likely than independents (48%) and Democrats (31%) to say that American culture and way of life has mostly changed for the worse since the 1950s.
Over the past decade, Republicans have been consistently less likely than independents or Democrats to say that American culture and way of life has changed mostly for the better since the 1950s; on average, around three in ten Republicans agree. By contrast, the percentage of Democrats who agree that American culture and way of life since the 1950s has changed mostly for the better has steadily increased, from 55% in 2013 to 68% in 2024.
 White Christian groups and Hispanic Protestants are the most likely to say American culture and way of life has changed for the worse since the 1950s: 68% of white evangelical Protestants, 58% of Hispanic Protestants, 56% of white Catholics, 56% of Latter-day Saints, and 52% of white mainline/non-evangelical Protestants hold this view. Non-white Christian groups — including Hispanic Catholics (47%) and Black Protestants (40%) — along with Jewish Americans (47%), other non-Christian groups (34%), and religiously unaffiliated Americans (40%) are less likely to say things have changed for the worse since the 1950s.1
Change in America’s Reputation in the Past Four Years
Two-thirds of Americans (65%) say that over the past four years, America’s standing and reputation has mostly changed for the worse, while one-third of Americans say it has mostly changed for the better (33%). Republicans (91%) are significantly more likely than independents (65%) and Democrats (37%) to say that America’s reputation has changed mostly for the worse over the past four years.
With the exception of Black Protestants (48%), majorities of Christian groups say that over the last four years, America’s standing and reputation have mostly changed for the worse: 86% of white evangelical Protestants, 85% of Latter-day Saints, 74% of white mainline/non-evangelical Protestants, 71% of white Catholics, 72% of Hispanic Protestants, and 56% of Hispanic Catholics share this view. Majorities of other non-Christians (60%), religiously unaffiliated (57%), and Jewish Americans (53%) also think the same.
Critical Issues
Among 11 political issues, Americans are most likely to rate increasing costs of housing and everyday expenses (62%) and the health of our democracy (53%) as critical issues to their vote in November’s election. Fewer than half of Americans say immigration (44%), crime (43%), health care (42%), abortion (40%), and access to guns (38%) are critical issues. One-third of Americans say jobs and unemployment (34%), racial inequality (25%), the Israel-Hamas war (24%), and protecting America’s identity as a Christian nation (20%) are critical issues.
Party Affiliation
Majorities of Republicans (69% and 51%), independents (61% and 51%), and Democrats (57% and 61%) consider the increasing cost of housing and everyday expenses and the health of our democracy to be critical issues. While majorities of Democrats also rate abortion (55%) and health care (52%) as critical issues, majorities of Republicans rate crime (57%) and immigration (71%) as critical issues.
The salience of two key issues dominating political discussions this election year has shifted dramatically among Republicans, independents, and Democrats since the last presidential election. In 2020, roughly half of Republicans said abortion was a critical issue for voting (49%), compared with about one in three Republicans today (29%). However, immigration has become far more salient to Republicans, with seven in ten indicating that it is a critical voting issue this November (71%), compared with 38% in 2020. In contrast, Democrats in 2024 are less likely to say immigration is a critical issue for voting this fall than they were in 2020 (36% vs. 24%). Notably, the salience of both abortion (29% vs. 36%) and immigration (29% vs. 42%) has also increased among independents from 2020 to 2024. In contrast, in 2024, more than half of Democrats (55%) indicated that abortion is a critical issue.
Religious Tradition
Aside from Jewish Americans, majorities of all religious groups rate increasing costs of housing and everyday expenses as a critical issue. At least half of white mainline/non-evangelical Protestants also rate the health of our democracy (56%) and immigration (50%) as their top critical issues. Similarly, majorities of white Catholics say immigration (55%) is a critical issue, but they also rate the health of our democracy (52%) and crime (51%) as critical. Majorities of Latter-day Saints also report the health of our democracy (61%) and immigration (58%) as critical issues. White evangelical Protestants have grown consistently more likely to say that immigration is a critical issue, from 36% in 2020 to 65% in 2024, while they have become less likely to rate abortion as a critical issue during the same period (63% in 2020 to 36% in 2024).
The majority of Black Protestants rate racial inequality (64%), health care (59%), the health of our democracy (57%), crime (55%), and access to guns (54%) as critical issues. Similarly, most Hispanic Catholics rate crime (56%), health care (55%), and access to guns (53%) as critical issues.
Majorities of all non-Christian groups rate the health of our democracy as a critical issue: 57% of other non-Christians, 56% of Jewish Americans, and 53% of religiously unaffiliated Americans. Additionally, most other non-Christians also rate health care (59%) and abortion (50%) as critical issues.
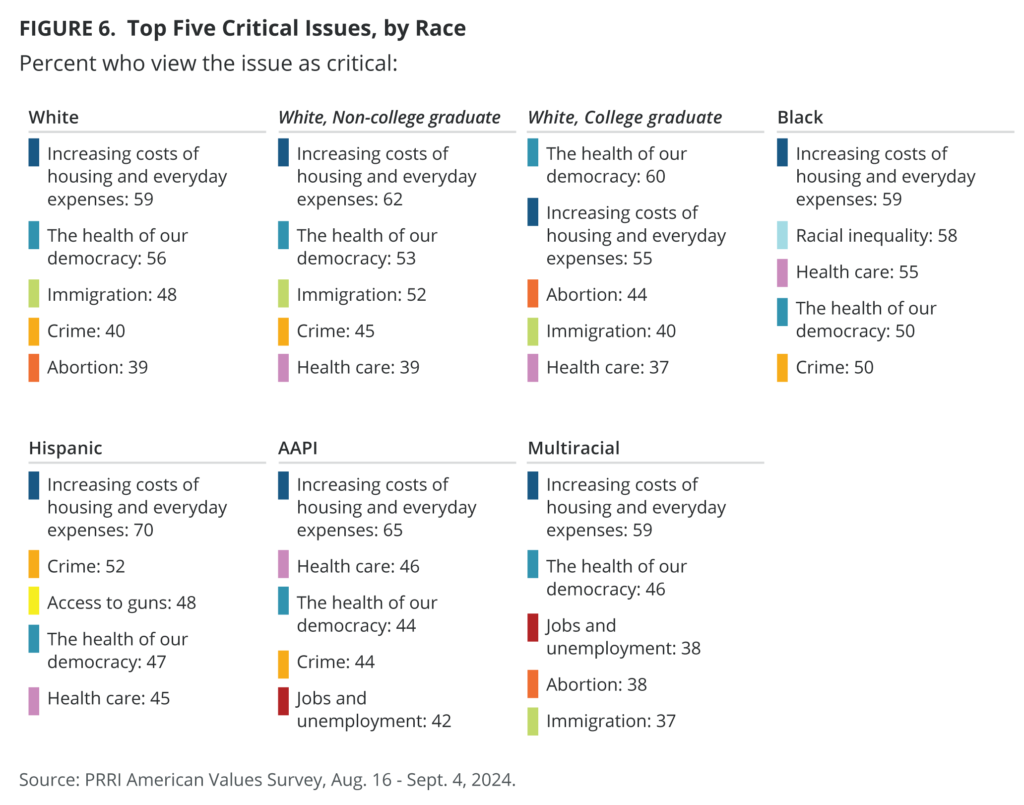
Race
Majorities across all racial groups say increasing costs of housing and everyday expenses is a critical issue. Majorities of Black Americans also report racial inequality (58%), health care (55%), the health of our democracy (50%), and crime (50%) as critical issues. The only other critical issue reported by most white Americans is the health of our democracy (56%); the only other critical issue reported by most Hispanic Americans is crime (52%). No other issues were rated as critical by the majority of Asian American and Pacific Islanders (AAPI) or multiracial Americans. Majorities of white Americans without a college degree and with a college degree report increasing costs of housing and everyday expenses (62% and 55%, respectively) and the health of our democracy (53% and 60%, respectively) as their top critical issues. Immigration is also a top critical issue for a slim majority of white Americans without a college degree (52%).
“Litmus Test” Issues That Drive Voting Choices
Abortion
Four in ten Americans (41%) say they will only vote for a candidate who shares their views on abortion. A similar percentage (40%) say they consider a candidate’s position on abortion as one of many important issues. Fewer than two in ten Americans (17%) say they do not see abortion as a major issue. Democrats (56%) are significantly more likely than independents (35%) and Republicans (36%) to say they will only vote for a candidate who shares their views on abortion. In 2020, however, Democrats (17%) and independents (14%) were significantly less likely to say they would only vote for a candidate who shares their views on abortion, while Republicans (32%) did not differ significantly.
Around half of Jewish Americans (50%), religiously unaffiliated Americans (47%), white evangelical Protestants (46%), and other non-Christians (46%) say they will only vote for a candidate who shares their views on abortion. Four in ten Black Protestants (42%), Hispanic Protestants (42%), white Catholics (38%), and Hispanic Catholics (38%) say the same. One-third of white mainline/non-evangelical Protestants (32%) and Latter-day Saints (32%) say they will only vote for a candidate who shares their views on abortion. Compared with 2020, white evangelical Protestants have become significantly more likely to say they will only vote for a candidate who shares their views on abortion (36% vs. 46%). Women (44%) are more likely than men (39%) to say they will only vote for a candidate who shares their views on abortion. Among those who say abortion should be legal in all or most cases, 43% say they will only vote for a candidate who shares their views on this issue, compared with 40% among those who say abortion should be illegal in all or most cases.
Immigration
Over one-third of Americans (36%) say they will only vote for a candidate who shares their views on immigration. A slim majority of Americans (52%) consider a candidate’s position on immigration as one of many important issues, and one in ten Americans (9%) say immigration is not a major issue. Since 2023, both Republicans (from 45% to 59%) and independents (from 27% to 33%) have grown more likely to say they will only vote for a candidate who shares their views on immigration, while Democrats have moved in the opposite direction (from 29% to 23%).
Among religious groups, more than half of white evangelical Protestants (53%) say that they will only vote for a candidate who shares their views on immigration. Around four in ten white Catholics (44%), Jewish Americans (40%), and Latter-day Saints (40%) indicate that immigration is a litmus test voting issue. Those who favor building a wall along the U.S. border with Mexico are more than twice as likely as those who oppose it to say they will only vote for a candidate who shares their views on immigration (51% vs. 22%).
Access to Guns
Over one-third of Americans (36%) say they will only vote for a candidate who shares their views on access to guns. A plurality of Americans (48%) considers access to guns one of many important issues; 13% of Americans do not see access to guns as a major issue. Around four in ten Republicans (44%), Democrats (37%), and independents (35%) say they would only vote for a candidate who shares their views on access to guns. Democrats have become less likely to say they would only vote for a candidate who shares their view on access to guns since 2023 (46%).
The State of the Economy in America
Concerns About the Economy
The survey finds several indicators of increased economic stress. More than seven in ten Americans (72%) say they are very or somewhat worried about not having enough money to retire. More than six in ten Americans say they are very or somewhat worried about being unable to afford health care (65%), housing (64%), everyday expenses such as groceries or gas (61%), or getting a job that pays a living wage (59%). Feelings about economic stress have not changed significantly since last year when these questions were first asked.
Solid majorities across party, religion, race, generation, gender, and education levels express increased economic stress on all these five indicators. However, among racial and ethnic groups, Hispanic Americans consistently show the highest level of economic stress. Older Americans, including baby boomers and members of the Silent Generation, are significantly less worried than younger Americans about economic issues.
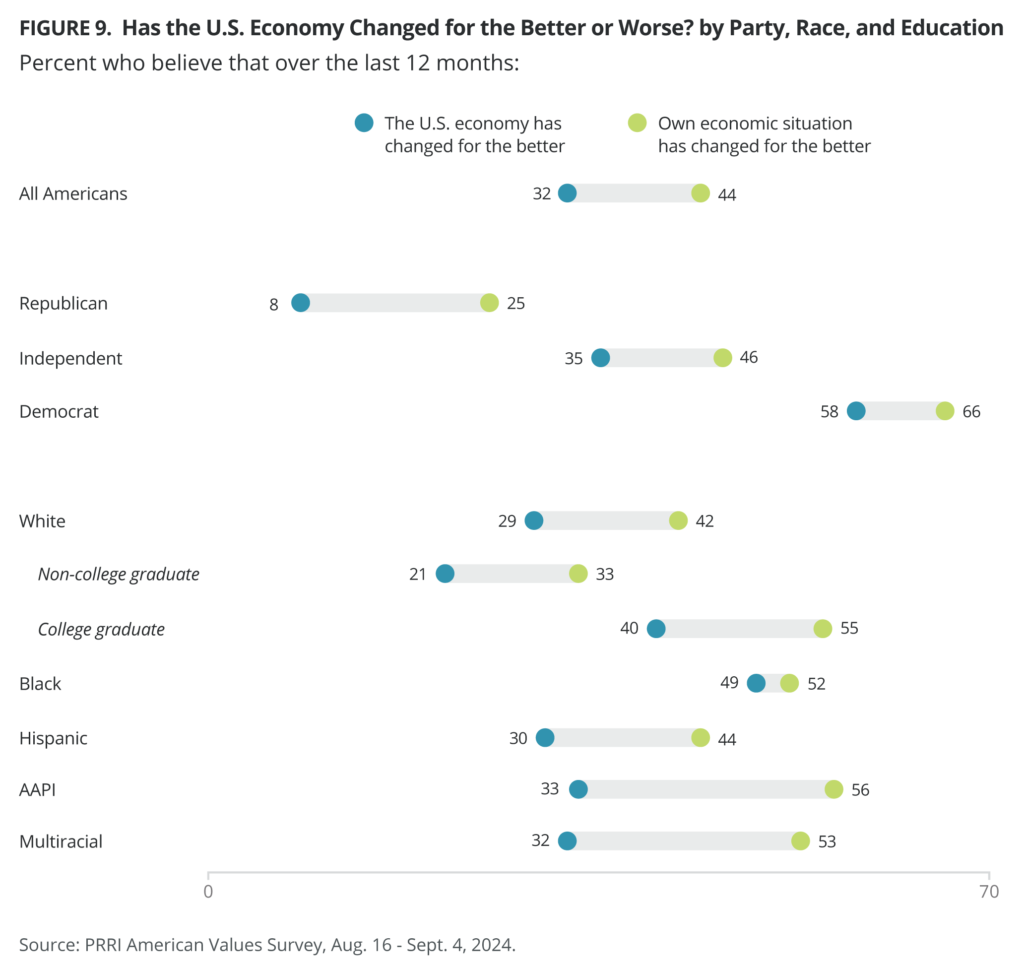
Has the U.S. Economy Changed for Better or for Worse?
About one-third of Americans (32%) believe that over the last 12 months, the U.S. economy has mostly changed for the better, while 66% believe it has mostly changed for the worse. The majority of Democrats (58%) believe that the U.S. economy has changed for the better, compared with 35% of independents and only 8% of Republicans who share the same sentiment.
Black Americans (49%) are the most likely to believe that the economy has changed for the better, compared with three in ten AAPI (33%), multiracial (32%), Hispanic (30%), and white Americans (29%). However, white Americans with a college degree (40%) are about twice as likely as white Americans without a college degree (21%) to share this belief.
Has Your Own Economic Situation Changed for Better or for Worse?
Slightly fewer than half of Americans (44%) believe that over the last 12 months, their economic situation has mostly changed for the better, while 54% believe it has mostly changed for the worse. Two-thirds of Democrats (66%) believe that their economic situation has changed for the better, along with slightly fewer than half of independents (46%). Republicans (25%) are significantly less likely to feel this way.
Majorities of AAPI (56%), multiracial (53%), and Black (52%) Americans believe that their economic situation has mostly changed for the better; they are more likely to feel this way than Hispanic (44%) and white (42%) Americans. The majority of white Americans with a college degree (55%) believe their economic situation has mostly changed for the better, compared with 33% of white Americans without a college degree.
Cutting Taxes on Everyone
Seven in ten Americans (69%) favor cutting taxes on everyone to speed up growth and job creation, while three in ten (29%) oppose this. Republicans (81%) are significantly more likely than independents (67%) and Democrats (60%) to favor this policy. Majorities across religion, race, generation, gender, and education levels favor cutting taxes on everyone.
Raising Taxes on the Wealthy
Seven in ten Americans (68%) favor raising taxes on wealthy people and corporations to spend more on education and the nation’s infrastructure, while 29% oppose this policy. Majorities of Democrats (92%) and independents (69%) favor raising taxes on wealthy people and corporations, compared with only 46% of Republicans.
Black and multiracial Americans (both 82%) are the most likely racial groups to favor raising taxes on wealthy people and corporations, followed by about three-quarters of AAPI (73%) and Hispanic (72%) Americans. White Americans (64%) are less likely to favor raising taxes on the wealthy. Younger generations are more likely than older generations to favor raising taxes on the wealthy. Over seven in ten millennials (73%) and Gen Zers (71%) favor this, compared with 66% of Gen Xers, 65% of baby boomers, and 59% of the Silent Generation.
Favorability Ratings of 2024 Candidates
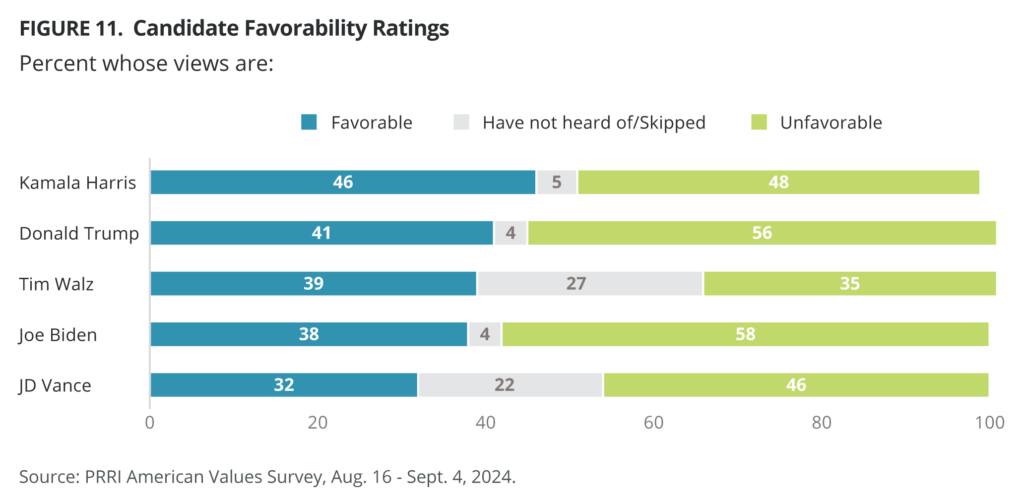
Kamala Harris
Americans are divided about their views concerning Vice President Kamala Harris. Forty-six percent say they view the Democratic presidential candidate favorably, while 48% view her unfavorably. Republicans and Democrats have diametrically opposite views regarding Harris. Nine in ten Republicans (90%) view her unfavorably, while only 9% view her favorably. Ninety-three percent of Democrats have a favorable view of Harris, and 6% view her unfavorably. A majority of independents (53%) view Harris unfavorably, while 44% have a favorable view of her.
Majorities of Black Protestants (84%), Hispanic Catholics (64%), religiously unaffiliated and other non-Christians (60%), and Jewish Americans (53%) have a favorable view of Harris. Majorities of white evangelical Protestants (82%), Latter-day Saints (73%), white Catholics (63%), white mainline/non-evangelical Protestants (61%), and Hispanic Protestants (52%) have unfavorable views of Harris.
Majorities of Black (71%), AAPI (61%), and Hispanic (55%) Americans have a favorable view of Harris. Nearly six in ten white Americans (59%) have an unfavorable view of Harris. However, among whites with a college degree, half have a favorable view of Harris (50%) and 49% have an unfavorable view. Among white Americans with no college education, 65% have an unfavorable opinion, and 30% have a favorable opinion.
Tim Walz
Most Americans are divided about Minnesota Governor Tim Walz. Nearly four in ten have a favorable opinion of the Democratic vice-presidential candidate (39%), 35% have an unfavorable opinion, and 25% of Americans have not heard of him. More than three-quarters of Democrats (76%) have a favorable opinion of Walz, 6% have an unfavorable opinion, and 17% have not heard of him. Seven in ten Republicans (70%) have an unfavorable opinion of Walz, 9% have a favorable opinion, and 22% have not heard of him. Among independents, more have a favorable (40%) than an unfavorable view (34%) of Walz, but 25% still have not heard of him.
Majorities of Black Protestants (58%), Jewish Americans (58%), and religiously unaffiliated Americans (53%) have a favorable opinion of Walz. Pluralities of Hispanic Catholics (44% favorable, 24% unfavorable, 31% have not heard of) and other non-Christian Americans (45% favorable, 22% unfavorable, 29% have not heard of) also express overall favorable opinions of Walz.
Half of white Catholics (50%) and a plurality of Latter-day Saints (49% unfavorable, 24% favorable, 26% have not heard of) and white mainline/non-evangelical Protestants (44% unfavorable, 35% favorable, 20% have not heard of) have overall unfavorable opinions of Walz. Forty-five percent of Hispanic Protestants have not heard of Walz, while 20% have a favorable opinion and 35% have an unfavorable opinion.
Around half of AAPI (53%) and Black (50%) Americans have a favorable view of Walz and four in ten multiracial Americans (41%) say the same. However, other groups are more divided. White Americans have a 37% favorable view of Walz, and 41% have an unfavorable view. However, among white Americans with a college degree, more than half have a favorable view of Walz (52%) and 37% have an unfavorable view. Among white Americans who do not have a college education, 44% have an unfavorable opinion, and 27% have a favorable opinion. Hispanic Americans are similarly divided: 34% have a favorable view of Walz, and 26% have an unfavorable one.
There are interesting patterns regarding age and Walz’s favorability. Though a plurality (38%) of young Americans (age 18-29) has not heard of the Minnesota governor, he has the most favorable balance (+14: 37% favorable, 23% unfavorable) among this age cohort. Among seniors (ages 65+), 44% have a favorable view of Walz, 45% have an unfavorable view, and 9% have not heard of Walz.
Donald Trump
A majority of Americans (56%) have an unfavorable opinion of Republican presidential nominee Donald Trump, while 41% have a favorable opinion of him. Republicans and Democrats have opposite views regarding Trump. More than eight in ten Republicans (84%) have a favorable opinion, while 16% view him unfavorably. Ninety-one percent of Democrats have an unfavorable view of Trump, and 7% view him favorably. More than six in ten independents (61%) have an unfavorable opinion of Trump, while 37% have a favorable opinion. Since PRRI began tracking favorability toward Trump in 2015, there has never been a majority of Americans with favorable views; however, Trump’s favorability reached its highest level — 49% — in March 2020, at the start of the pandemic.
A majority of white Christians (58%), including 72% of white evangelical Protestants, 53% of white mainline/non-evangelical Protestants, and 51% of white Catholics, have a favorable opinion of Trump. Nearly half of white mainline/non-evangelical Protestants (46%) and white Catholics (48%) have an unfavorable opinion. More than six in ten Christians of color (62%) have an unfavorable opinion of Trump, and one-third have a favorable opinion (33%). Additionally, 84% of Black Protestants and 58% of Hispanic Catholics have an unfavorable opinion of Trump. Only Hispanic Protestants (51% favorable, 41% unfavorable) have an overall favorable view of Trump among Christians of color. Religiously unaffiliated Americans and other non-Christian Americans (both 72%) have an unfavorable opinion of Trump, as do 64% of Jewish Americans. 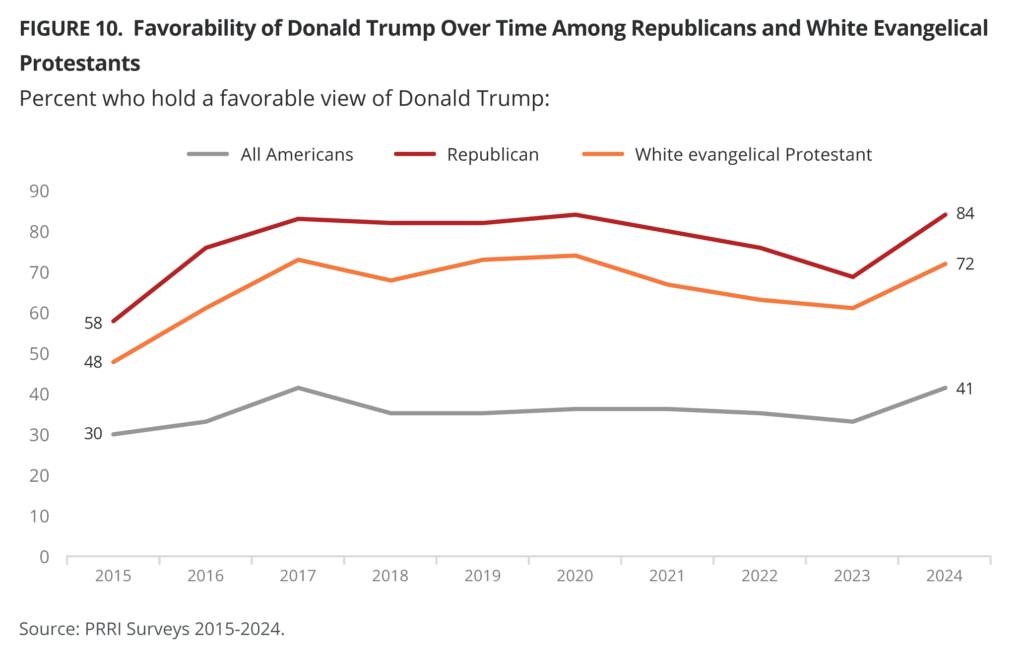
Black (75%), AAPI (74%), and Hispanic (54%) Americans have an unfavorable opinion of Trump. White Americans are more divided: half (50%) have an unfavorable view of Trump, and 47% have a favorable opinion. However, among white Americans with a college degree, nearly two-thirds have an unfavorable view of Trump (64%), and 35% have a favorable view. Among white Americans with no college education, 55% have a favorable opinion, and 41% have an unfavorable opinion.
JD Vance
A plurality of Americans has an unfavorable opinion of Ohio Senator JD Vance (46%). About one-third of Americans have a favorable opinion (32%) of him, and one in five have not heard of him (20%). More than three-quarters of Democrats (78%) have an unfavorable opinion of Vance, 6% have a favorable opinion, and 15% have not heard of him. Roughly seven in ten Republicans (71%) have a favorable opinion of Vance, 14% view him unfavorably, and 14% have not heard of him. A majority (51%) of independents have an unfavorable opinion of the Republican vice-presidential candidate, 28% have a favorable opinion, and 20% have not heard of him.
Nearly two-thirds (64%) of white evangelical Protestants have a favorable opinion of Vance, while other religious groups have, on balance, a favorable opinion of him, including pluralities of Latter-day Saints (48% favorable, 36% unfavorable, 15% have not heard of), white Catholics (48% favorable, 43% unfavorable, 9% have not heard of), and white mainline/non-evangelical Protestants (45% favorable, 40% unfavorable, 13% have not heard of). A plurality of Hispanic Protestants (38%) has not heard of Vance; 37% of Hispanic Protestants have favorable views of him and 25% have unfavorable views of him. A plurality of Hispanic Catholics (41%) has an unfavorable opinion of Vance, 28% have a favorable opinion, and 29% have not heard of him. More than six in ten Black Protestants (66%) and religiously unaffiliated Americans (62%) have an unfavorable opinion of Vance. Majorities of Jewish Americans (53%) and other non-Christian Americans (52%) also have an unfavorable opinion.
Majorities of AAPI (60%) and Black Americans (59%) have an unfavorable opinion of Vance. In contrast, white Americans are more divided: 44% have an unfavorable view of Vance, and 40% have a favorable opinion. However, among white Americans with a college degree, six in ten have an unfavorable view of Vance (57%), and 36% have a favorable view. Among white Americans without a four-year degree, 35% have an unfavorable opinion, and 43% have a favorable opinion. Nearly four in ten Hispanic Americans (38%) have an unfavorable view of Vance.
The age patterns of Vance’s favorability mirror Walz’s to some extent. A plurality of young Americans (age 18-29) has an unfavorable opinion of Vance (46%), nearly three times as high as the proportion of those with a favorable opinion (17%). Young Americans are twice as likely to say they have not heard of Vance (34%) than to say they have a favorable opinion. Among seniors (ages 65+), Vance has the highest overall favorability (46%), though a similar share has an unfavorable opinion of him; 6% have not heard of him.
Joe Biden
Nearly six in ten (58%) Americans have an unfavorable opinion of President Joe Biden, and roughly four in ten have a favorable view (38%). Democrats (79%) are the most favorable toward the president, though one in five have an unfavorable opinion (20%). More than nine in ten Republicans (92%) and nearly two-thirds of independents (64%) have an unfavorable opinion of the president. Just 7% of Republicans and around one-third of independents (34%) have a favorable opinion of Biden.
Three-quarters of white Christians (76%) have an unfavorable opinion of Biden, and about one-quarter have a favorable opinion (23%). More than eight in ten white evangelical Protestants (86%), 71% of white Catholics, and 69% of white mainline/non-evangelical Protestants have an unfavorable opinion of Biden. Majorities of Latter-day Saints (79%), Hispanic Protestants (61%), and other non-Christian Americans (56%) also have an unfavorable opinion of the president. Jewish Americans (47% favorable, 51% unfavorable) and religiously unaffiliated Americans (47% favorable, 50% unfavorable) are the most divided in their opinion of the president. Black Protestants (75% favorable, 23% unfavorable) and Hispanic Catholics (51% favorable, 44% unfavorable) are the only religious groups in which a majority have a favorable opinion of Biden.
The 2024 Election: The Horse Race, Nominee Traits, and Perceptions of Trump and Harris as Threats to Democracy
The 2024 Horse Race
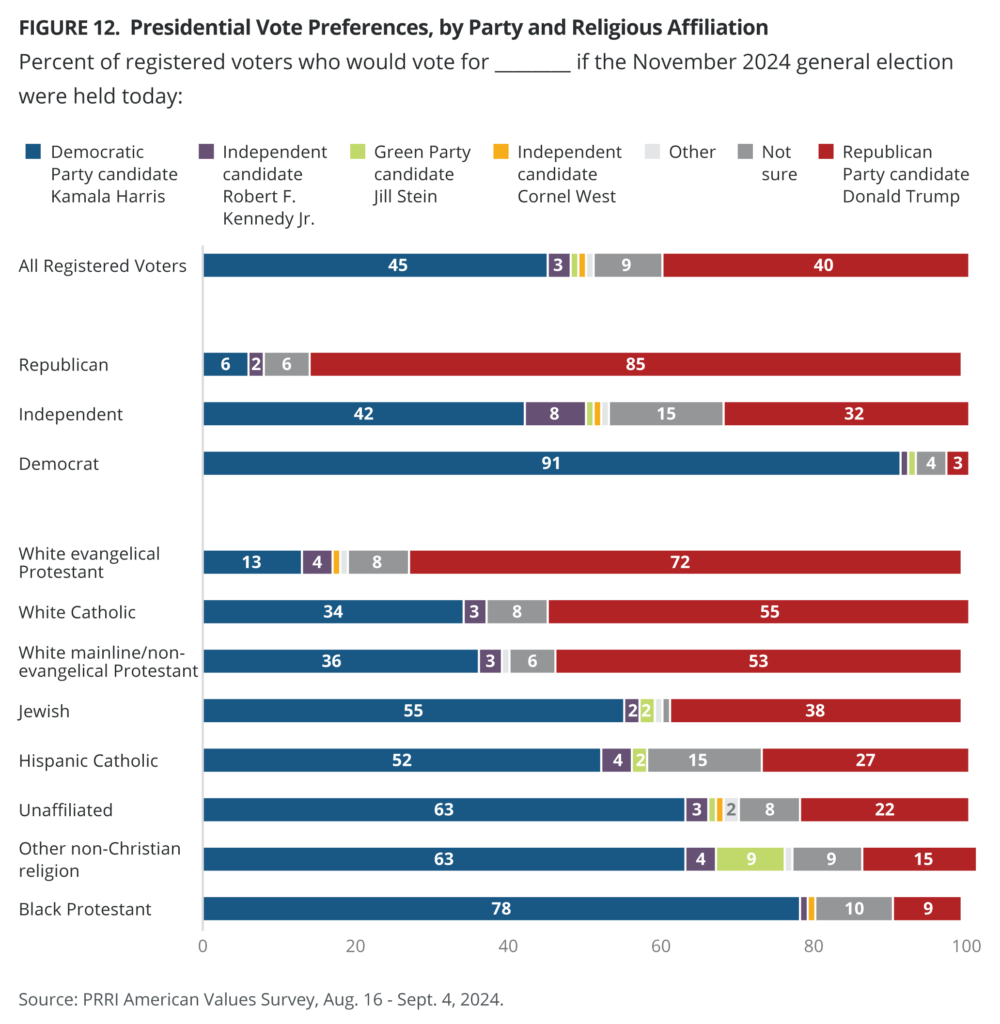
This survey shows Harris leading Trump by 5 percentage points (45% vs. 40%) among registered voters, in early September. Nearly one in ten voters are not sure who they are voting for (9%) and 6% say they will vote for another candidate, with half of these voters (3%) selecting independent candidate Robert F. Kennedy Jr., who recently suspended his campaign and endorsed Trump.
Among Democrats, Harris leads Trump 91% to 3%. Among Republicans, Trump leads 85% to 6%. Among independent registered voters, Harris leads Trump 42% to 32%, with 15% not sure and 11% supporting other candidates, including 8% for Kennedy.
White Christians prefer Trump over Harris (61% vs. 27%); an additional 8% are unsure, 5% support other candidates, including 4% for Kennedy. White evangelical Protestant voters show the strongest support for Trump over Harris (72% vs. 13%), with 8% unsure and 6% for other candidates. White Catholic voters (55% Trump, 34% Harris, 8% not sure, 3% Kennedy) and white mainline/non-evangelical Protestant voters (53% Trump, 36% Harris, 6% not sure, 4% others) also support Trump. Black Protestants (78% Harris, 9% Trump, 10% not sure, 2% others) show the strongest support for Harris. A majority of adherents in several other religious groups also favor Harris over Trump. These include religiously unaffiliated, Jewish, and other non-Christian Americans and Hispanic Catholics.
Among the unaffiliated, Harris leads Trump 63% to 22%, with 8% undecided and 7% for other candidates, primarily Kennedy (3%). Other non-Christians support Harris 63% and 15% support Trump, with 9% undecided and 14% supporting other candidates, primarily Green Party candidate Jill Stein (9%) and Kennedy (4%). Fifty-five percent of Jewish voters support Harris, 38% support Trump, 5% support various other candidates, and 1% are not sure. Hispanic Catholics support Harris over Trump by nearly a 2-to-1 ratio (52% vs. 27%), with 15% not sure and 6% supporting other candidates, including 4% for Kennedy.
Voters vary drastically based on their outlook and support for Christian nationalism. More than three-quarters of Christian nationalism Adherents (76%) and two-thirds of Sympathizers (67%) support Trump for president. Eleven percent of Adherents and 18% of Sympathizers plan on voting for Harris. Four in five Christian nationalism Rejecters (80%) support Harris, compared with 9% who favor Trump. Christian nationalism Skeptics are divided, with 43% supporting Trump and 40% supporting Harris; 7% favor other candidates, including 5% for Kennedy. Eleven percent of Skeptics are not sure who they are voting for.
After asking registered voters who preferred third-party candidates or who were undecided to choose between Harris and Trump, we examined all registered voters’ candidate preferences and found that they are divided over whether they would vote for Harris (50%) or Trump (47%), while 2% of registered voters refused to choose either candidate. Most Democrats prefer Harris (95%), while most Republicans (91%) prefer Trump. Independents, including registered voters who preferred third-party candidates, are divided evenly between Harris (49%) and Trump (47%).
Majorities of white Christian voters support Trump in the 2024 election, including eight in ten white evangelical Protestant voters (81%) and six in ten white Catholic (61%) and white mainline/non-evangelical Protestant (60%) voters. By contrast, most Black Protestant (83%), religiously unaffiliated (70%), other non-Christian (67%), Hispanic Catholic (61%), and Jewish (58%) voters prefer Harris.
Among registered white American voters, over half support Trump (56%) while four in ten say they would vote for Harris (42%). White Americans who attend religious services weekly or more are significantly more likely to support Trump (76%) than Harris (21%). The same pattern holds true for white Americans who attend religious services monthly or a few times a year, with 64% supporting Trump and 34% supporting Harris. In contrast, white Americans who seldom or never attend religious services are more likely to support Harris (56%) than Trump (43%).
Over half of registered Hispanic American voters say they would vote for Kamala Harris (55%) while four in ten say they would vote for Trump (42%). Similar to white Americans, Hispanic Americans who attend services weekly or more say they are more likely to vote for Trump (55%) than Harris (41%). Hispanic Americans who attend services monthly or a few times a year are more divided, with 54% supporting Harris and 46% supporting Trump. In contrast, Hispanic Americans who seldom or never attend religious services are significantly more likely to support Harris (65%) than Trump (33%).2
The vast majority of registered Black American voters support Harris (77%) while around two in ten support Trump (18%). Among Black Americans, religious service attendance has the opposite effect. Those who attend religious services more regularly are less likely to support Trump than those who seldom or never attend. 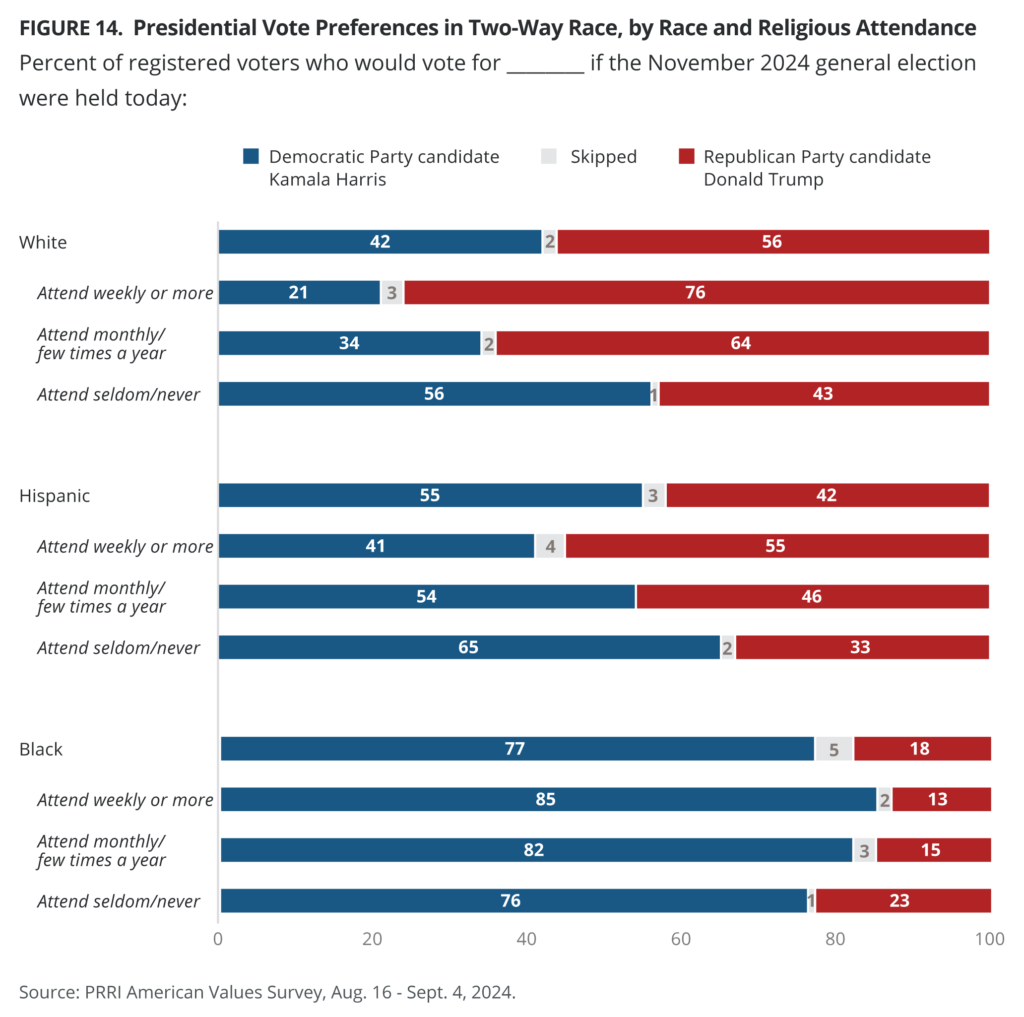
Likelihood of Voting Based on Nominees’ Characteristics
Kamala Harris
Voters were asked about various characteristics of the two major-party candidates and assessed whether the traits would make them more likely to vote for the candidate, less likely to vote for the candidate, or made no difference. For Harris, those characteristics included:
- Her status as the first potential female president
- Her age
- Her performance as vice president
- Her background as a lawyer and prosecutor
- Her character and personal conduct
Harris’ best-performing trait was her character and personal conduct, which 44% of registered voters selected as a characteristic that makes them more likely to vote for her. However, 38% said that this same trait would make them less likely to vote for her, and 17% said it makes no difference in their vote choice.
A plurality of voters (39%) says that Harris’ background as a lawyer and prosecutor makes no difference in their candidate selection. However, more people say that Harris’ background as a prosecutor and lawyer makes them more likely to vote for her (36%) than those who say it makes them less likely to vote for her (24%).
The vast majority of voters say Harris’ age does not make a difference in their vote choice (64%). However, far more voters say this attribute makes them more likely to vote for her (30%) than those who say it makes them less likely to vote for her (5%).
Harris’ performance as vice president is her most problematic trait. A plurality of voters says this characteristic makes them less likely to vote for her (45%). About three in ten voters say her performance as vice president makes them more likely to vote for her (29%), while one-quarter of voters say this characteristic makes no difference in their vote (25%).
If Harris wins, she will become the first woman elected president of the United States, a fact that 62% of voters say makes no difference in their vote choice. However, more than one-quarter of voters say this characteristic makes them more likely to vote for her (26%), and just over one in ten say her status as the first potential female president makes them less likely to vote for her (12%).
Donald Trump
Voters were asked to assess if the following characteristics make them more likely to vote for Trump, less likely to vote for him, or if the characteristics make no difference to them:
- His survival of the recent assassination attempt on his life
- His age
- His performance as president
- His background as a business owner
- His character and personal conduct
Trump’s best-performing trait is his performance as president with 45% of voters saying this characteristic makes them more likely to vote for him. Still, a similar share (47%) say that this makes them less likely to vote for him, making it also one of his worst-performing characteristics. Only 8% of voters say Trump’s performance as president makes no difference in their vote.
About four in ten voters say Trump’s background as a business owner makes them more likely to vote for him (38%), while more than one-third of voters say this characteristic makes them less likely to vote for him (34%). More than one-quarter of voters say this characteristic makes no difference in their presidential vote choice (27%).
Nearly two-thirds of voters say that Trump’s survival of the recent assassination attempt on his life makes no difference in their presidential vote choice (66%). About one in five voters say that it makes them more likely to vote for him (21%). More than one in ten say it makes them less likely to vote for him (12%).
More than six in ten voters say Trump’s character and personal conduct makes them less likely to vote for him (61%). Twenty-one percent of voters say this characteristic makes no difference in their presidential choice. Seventeen percent say Trump’s character and personal conduct make them more likely to vote for him.
Finally, 50% of voters say that Trump’s age does not impact their voting decision. However, 44% of voters say Trump’s age makes them less likely to vote for him, while only 5% say it makes them more likely to vote for him. 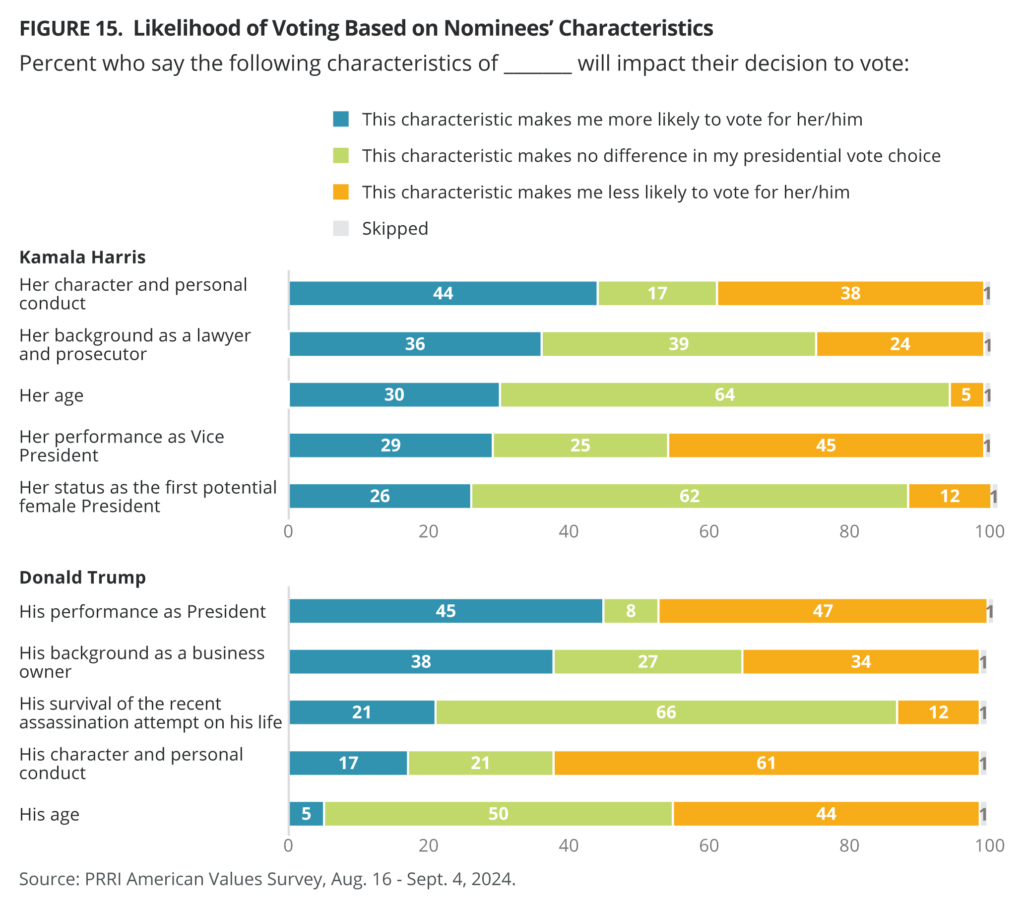
Likelihood of Voting Based on Critical Issues
Registered voters who say that the health of our democracy is a critical issue favor Harris over Trump (58% vs. 40%). Similarly, registered voters who say that abortion is a critical issue are substantially more likely to favor Harris over Trump (69% vs. 29%). By contrast, registered voters who say that immigration is a critical issue are about three times as likely to prefer Trump over Harris (75% vs. 23%).
When examining the economy, registered voters who say that jobs and unemployment are a critical issue prefer Trump over Harris (58% vs. 41%). The same pattern emerges among voters who say that the increasing cost of housing and everyday expenses is a critical issue. They slightly prefer Trump over Harris (53% vs. 45%).
Dangers Posed by Trump/Harris to Democracy
Trump as a Dictator and Declaring Election Results Invalid
Americans were asked about their opinions regarding Trump’s relative threats to democracy: whether Trump will use the presidency to become a dictator and whether he should declare the election results invalid and assume his place as president if he is not declared the winner.
The American public is evenly divided about whether there is a real danger that Trump will use the presidency to become a dictator (49% agree vs. 48% disagree). Only 11% of Republicans agree with the statement, and 89% disagree. Among Democrats, 88% agree with the statement that Trump intends to become a dictator and 12% disagree. Independents are divided on this question (48% agree vs. 50% disagree).
Two-thirds of white Christians (67%) disagree that Trump will use the presidency to become a dictator, though 31% agree. At 81%, white evangelical Protestants are the most likely to disagree with the statement. Sixty-one percent of white Catholics and 60% of white mainline/non-evangelical Protestants also disagree. A majority of Christians of color (59%) agree that Trump will use the presidency to become a dictator, including 81% of Black Protestants and 55% of Hispanic Catholics. Among Christians of color, half of Hispanic Protestants (52%) disagree that Trump will use the office to become a dictator. Majorities of religiously unaffiliated Americans (63%), Jewish Americans (55%), and other non-Christian Americans (68%) agree that there is a real danger that Trump will use the presidency to become a dictator.
The vast majority of Americans (84%) disagree that Trump should declare the election results invalid and do whatever it takes to assume the presidency if he is not confirmed as the winner of the 2024 election. Only 13% agree with the statement. More than three-quarters of Republicans (79%) and approximately nine in ten independents (88%) and Democrats (92%) disagree with the statement. While 79% of Republicans disagree with this statement, nearly one in five (19%) agree. Republicans who view Trump favorably are five times as likely as those who hold unfavorable views to say that if Trump loses the election, he should declare the results invalid and do whatever it takes to assume office (23% vs. 5%). Majorities of most religious and demographic cohorts disagree that Trump should declare the election invalid and assume power if he is not confirmed the winner of the 2024 election.
Harris as a Dictator and Declaring Election Results Invalid
Americans were also asked about their opinions regarding Harris’ relative threats to democracy: whether Harris would use the presidency to become a dictator and whether she should declare the election results invalid and assume her place as president if she is not declared the winner. Nearly seven in ten Americans disagree that there is a real danger that Harris will use the presidency to become a dictator if elected (69%). About three in ten agree (28%).
A majority of Republicans (56%) agree that Harris intends to become a dictator, while 43% disagree. About one-quarter of independents (24%) agree that Harris intends to become a dictator, while nearly three-quarters disagree (74%). Democrats (95%) are nearly unanimous in their disagreement that there is a danger of Harris becoming a dictator if she wins the election.
Most demographic and religious groups disagree with the idea that there is danger in Harris using the presidency to become a dictator, with one exception: a majority of white evangelical Christians (53%) agree that there is a danger of Harris becoming a dictator if she becomes president, while 46% disagree.
In addition, nearly nine in ten Americans (88%) disagree that Harris should declare herself the winner of the 2024 election and do whatever it takes to assume the presidency if she’s not confirmed the winner. Only 9% agree. Ninety-four percent of Republicans, 90% of independents, and 87% of Democrats disagree that Harris should try to assume the presidency if she is not declared the winner.
Concerns about Voting
Americans are divided on what they believe is the most significant issue facing our elections: people casting votes who are not eligible to vote vs. eligible voters being denied the right to vote (49% vs. 47%). Nearly nine in ten Republicans (87%) say ineligible voters casting ballots is the bigger problem. In comparison, 81% of Democrats say eligible voters being denied the right to vote is the bigger issue. Independents are more divided, though a slim majority (51%) say eligible voters being denied the right to vote is the bigger problem. At the same time, 47% think the bigger issue is ineligible voters casting ballots.
Seven in ten white Christians (70%) say ineligible voters casting ballots is the bigger problem, while 27% say the bigger issue is eligible voters being denied the right to vote. More than six in ten white evangelical Protestants (81%), white Catholics (67%), and white mainline/non-evangelical Protestants (63%) say that ineligible voters casting ballots is the bigger issue. A majority of Christians of color (58%), including more than three-quarters of Black Protestants (77%) and 55% of Hispanic Catholics, say eligible voters being denied the right to vote is the bigger issue. Hispanic Protestants (43%) are the only exception, as the majority (54%) say ineligible voters casting ballots is the bigger issue. More than six in ten Jewish (60%), other non-Christian (66%), and religiously unaffiliated (65%) Americans say that eligible voters being denied the right to vote is the bigger problem of the two.
Political Violence and Concerns About 2024 Election
Patriots May Have to Resort to Violence to Save the Country
Support for justifying political violence has remained stable over the last three years, with a brief uptick in September 2023. Today, 18% of Americans agree that “because things have gotten so far off track, true American patriots may have to resort to violence in order to save our country.” This is slightly higher than in March 2021 (15%), when the question was first asked, but lower than the peak of 23% in September 2023. Nearly three in ten Republicans (29%) believe that true American patriots may have to resort to violence to save the country, compared with 16% of independents and 8% of Democrats. Republicans who view Trump favorably are three times as likely as those who hold unfavorable views to support political violence (32% vs. 11%).
 Americans who trust conservative news outlets are the most likely to support political violence (41%), followed by 30% of those who most trust Fox News, 18% of those who do not watch any TV news, and 13% of those who most trust mainstream TV news.
About three in ten Latter-day Saints (33%) and white evangelical Protestants (28%) agree that true American patriots may have to resort to violence to save the country. Two in ten or fewer members of all other religious groups agree with this idea, including 18% of Hispanic Catholics, 17% of white mainline/non-evangelical Protestants, 17% of non-Christians, 16% of Hispanic Protestants, 15% of white Catholics, 15% of religiously unaffiliated Americans, 14% of Black Protestants, and 10% of Jewish Americans.
One-third of Christian nationalism Adherents and Sympathizers (33%) agree that true American patriots may have to resort to violence to save the country, compared with one in ten Christian nationalism Rejecters and Skeptics (11%).
Democrats vs. Republicans Are Determined to Stay in Power Even If That Means Resorting to Political Violence
About one-third of Americans (35%) agree with the idea that Democrats are determined to stay in power even if that means resorting to political violence. Two-thirds of Republicans (65%), one-third of independents (34%), and just 7% of Democrats agree that Democrats are determined to stay in power.
Americans hold different opinions about Republicans, with 44% saying that Republicans are determined to stay in power even if that means resorting to political violence. Over seven in ten Democrats (77%), nearly half of independents (46%), and just 13% of Republicans agree that Republicans are determined to stay in power even if that means resorting to political violence.
White evangelical Protestants (61%) are the only religious group whose majority agree that Democrats are determined to stay in power even if that means resorting to political violence. By contrast, majorities of Black Protestants (69%), non-Christians (55%), and Jewish Americans (54%) are concerned that Republicans are determined to stay in power even if that means resorting to political violence. Significantly smaller minorities of all other religious groups agree that Democrats or Republicans are determined to stay in power even if that means resorting to political violence.
While about six in ten Christian nationalism Adherents and Sympathizers (59%) agree that Democrats are determined to stay in power, just one in four say the same about Republicans (25%). By contrast, nearly six in ten Christian nationalism Rejecters and Skeptics (56%) agree that Republicans are determined to stay in power, compared with one in four who say the same about Democrats (23%).
Armed Citizens Are Needed as Poll Watchers to Ensure a Fair Election
Just 18% of Americans agree with the idea that “to ensure a fair vote for the presidential election this November, we need armed everyday citizens to show up as poll watchers, even if this makes some voters uncomfortable.” Roughly one-quarter of Republicans (27%) and one in ten independents (14%) and Democrats (12%) agree. Republicans who hold favorable views of Trump are about three times as likely as those who hold unfavorable views to agree (30% vs. 11%).
Over one-third of Americans who most trust conservative news outlets (36%) as well as 28% of those who most trust Fox News agree that armed citizens are needed to ensure a fair election in November, compared with just 16% of those who do not watch TV news and 15% of those who most trust mainstream media outlets.
About two in ten Hispanic Catholics (22%), Latter-day Saints (22%), non-Christians (21%), and Black Protestants (20%) agree with the idea that armed citizens are needed to ensure a fair election in November, compared with about one in ten white Catholics (16%), Jewish Americans (16%), Hispanic Protestants (15%), white mainline/non-evangelical Protestants (13%), and religiously unaffiliated Americans (13%). White evangelical Protestants are the only religious group that has grown more likely to agree with this statement since June 2024 when the question was first asked (from 19% to 25% in 2024).
One-third of Americans who qualify as Christian nationalism Adherents or Sympathizers (34%) agree that armed citizens are needed to ensure a fair election in November, compared with 11% who qualify as Christian nationalism Skeptics or Rejecters.
Ensuring the Rightful Leader Takes Office, Even if Violence Is Required
While most Americans (80%) disagree with the idea that “if the 2024 presidential election is compromised by voter fraud, everyday Americans will need to ensure the rightful leader takes office, even if it requires taking violent actions,” 16% of Americans agree.
Republicans (22%) are more likely than independents (14%) or Democrats (12%) to agree. Among Republicans, those who hold favorable views of Trump are more likely than those who hold unfavorable views to agree (23% vs. 16%). Around one-third of Americans who most trust conservative news outlets (32%) agree that violent actions may be required to install the rightful leader even if violence is required, compared with 21% of those who most trust Fox News, 17% of those who don’t watch any TV news, and 14% of those who most trust mainstream TV news outlets.
About two in ten Hispanic Catholics (24%), Latter-day Saints (24%), white evangelical Protestants (21%), Hispanic Protestants (21%), and other non-Christians (19%) agree that violent actions may be required to install the rightful leader. Roughly one in ten Black Protestants (15%), religiously unaffiliated respondents (15%), white mainline/non-evangelical Protestants (13%), and Jewish Americans (11%) agree.
Nearly three in ten Americans who qualify as either Christian nationalism Adherents or Sympathizers (28%) believe that violent actions may be required to install the rightful leader, compared with 13% of those who qualify as Christian nationalism Skeptics or Rejecters.
Beliefs About Trump, the 2020 Election, and the Jan. 6 Insurrection
Did Trump Break the Law to Stay in Power?
A slim majority of Americans (53%) agree with the statement that former President Trump likely broke the law to try to stay in power after losing the 2020 election, while 44% disagree. This sentiment has gone down by 7 percentage points from 60% in 2023, when the question was first asked. About two in ten Republicans (17%), compared with 54% of independents and 90% of Democrats, believe Trump broke the law to try to stay in power. Republicans who hold unfavorable views of Trump are six times more likely than those who hold a favorable view of Trump to agree (65% vs. 8%).
Americans who most trust Fox News (12%) or far-right news outlets (5%) are the least likely to believe Trump broke the law to stay in power after losing the election, compared with half of Americans who do not watch TV news (49%) and three in four Americans who most trust mainstream TV news (74%). Radio consumers of political information (37%) are the least likely to agree with this idea, compared with those who consume political information from social media platforms (50%), YouTube (52%), television (56%), and newspapers or magazines (67%), but they do not differ significantly from those who consume political information from podcasts (46%).
Solid majorities of Black Protestants (86%), non-Christians (70%), religiously unaffiliated Americans (68%), Hispanic Catholics (62%), and Jewish Americans (59%) agree with the statement that Trump likely broke the law. By contrast, fewer than half of white mainline/non-evangelical Protestants (43%), white Catholics (43%), Hispanic Protestants (38%), and Latter-day Saints (36%) agree. Just 23% of white evangelical Protestants agree that former President Trump broke the law to try to stay in power after the 2020 election.
The majority of Americans who qualify as Christian nationalism Skeptics or Rejecters (66%) agree with this idea, compared with 29% of those who qualify as Christian nationalism Adherents or Sympathizers.
Americans who live in rural areas (35%) are notably less likely to agree that Trump broke the law than those who live in suburban areas (52%), and urban areas (62%).
The 2020 Election Was Stolen from Donald Trump
Nearly one-third of Americans (31%) agree with the statement that the 2020 election was stolen from Trump, while two-thirds disagree (67%). This sentiment has remained stable since March 2021 when the question was first asked. Over six in ten Republicans (62%), compared with 27% of independents and just 4% of Democrats, believe the 2020 election was stolen from Trump. Republicans who hold favorable views of Trump are eight times as likely as those who hold unfavorable views to agree (72% vs. 9%).
Americans who most trust far-right news outlets (84%) and Fox News (64%) are the most likely to agree with the statement that the 2020 election was stolen from Trump, compared with one-third of Americans who do not watch TV news (33%) and 13% of those who most trust mainstream TV news. White evangelical Protestants (56%) are the only religious group in which a majority agree that the 2020 election was stolen from Trump. Significantly smaller minorities of all other religious groups agree with this sentiment.
The majority of Americans who qualify as Christian nationalism Adherents or Sympathizers (58%) agree that the 2020 election was stolen from Trump, compared with 18% of those who qualify as Christian nationalism Skeptics or Rejecters.
White Americans without a four-year degree (44%) are twice as likely as those who have a four-year degree (22%) to say the election was stolen from Trump.
Those Convicted of Crimes on Jan. 6 Are Patriots Being Held Hostage by the Government
Only one in four Americans (25%) agree with Trump’s frequent claim that “the people convicted for their role in the violent Jan. 6 attacks on the U.S. Capitol are really patriots who are being held hostage by the government.” Nearly three-quarters of Americans (72%) disagree, including 52% who strongly disagree. Republicans (46%) are more than twice as likely as independents (20%) and about seven times as likely as Democrats (7%) to agree with this statement. Moreover, Republicans who hold favorable views of Trump are more than four times as likely as those who hold unfavorable views to agree with this assessment of those convicted of crimes on Jan. 6 (52% vs. 12%).
Americans who most trust far-right news outlets (75%) and Fox News (51%) are the most likely to agree with this statement, compared with one-quarter of Americans who do not watch TV news (25%) and 12% of those who most trust mainstream TV news. Americans who consume political information from newspapers or magazines (14%) are the least likely to agree, while consumers of political information from other platforms such as television (23%), social media (25%), radio (30%), YouTube (33%), and podcasts (34%) are more likely to agree.
Among religious Americans, white evangelical Protestants (41%) are the most likely to agree that those convicted for their criminal actions on Jan. 6 are patriots being held hostage by the government. Significantly smaller minorities of all other religious groups agree with this sentiment.
While nearly half of Americans (46%) who qualify as either Christian nationalism Adherents or Sympathizers agree with this idea, just 15% of those who qualify as Christian nationalism Skeptics or Rejecters agree.
Specific Issues
The Role of a College Education
Confidence in College as a Smart Investment in the Future
Americans are slightly more likely to say that a college education is a risky gamble that might not pay off (51%) than to say a college education is a smart investment in the future (47%). The view that a college education is a smart investment has dropped since 2016, reaching a low of 42% in 2022 but slightly increasing to 47% in 2024. Both Republicans and Democrats are now less likely to say college is a smart investment, but Republicans are significantly more likely to do so, down from 52% in 2016 to 39% in 2024. Among Democrats, agreement decreased slightly from 66% in 2016 to 62% in 2024. Notably, the partisan gap on the value of a college education has grown from 14 percentage points in 2016 to 23 percentage points in 2024.
Americans who most trust mainstream TV news sources (60%) are significantly more likely than those who most trust Fox News (43%) and those who do not watch TV news (37%) to say that college is a smart investment. Americans who most trust conservative news sources (25%) are the group least likely to say that college is a smart investment.
A majority of AAPI (57%), Hispanic Americans (55%), and Black Americans (52%) say a college education is a good investment in the future, compared with 43% of white Americans. However, white Americans with a four-year college degree or higher are notably more likely than white Americans without a four-year college degree to say that college is a smart investment (57% vs. 33%). However, among both groups of white Americans, the belief in a college education as a smart investment has decreased significantly since 2016, when it was 63% among those with a four-year college degree and 46% among those without a four-year college degree.
Except for members of the Silent Generation (61%), confidence that a college education is a smart investment varies little across generations: 45% of Gen Zers, 42% of millennials, 48% of Gen Xers, and 50% of baby boomers agree. 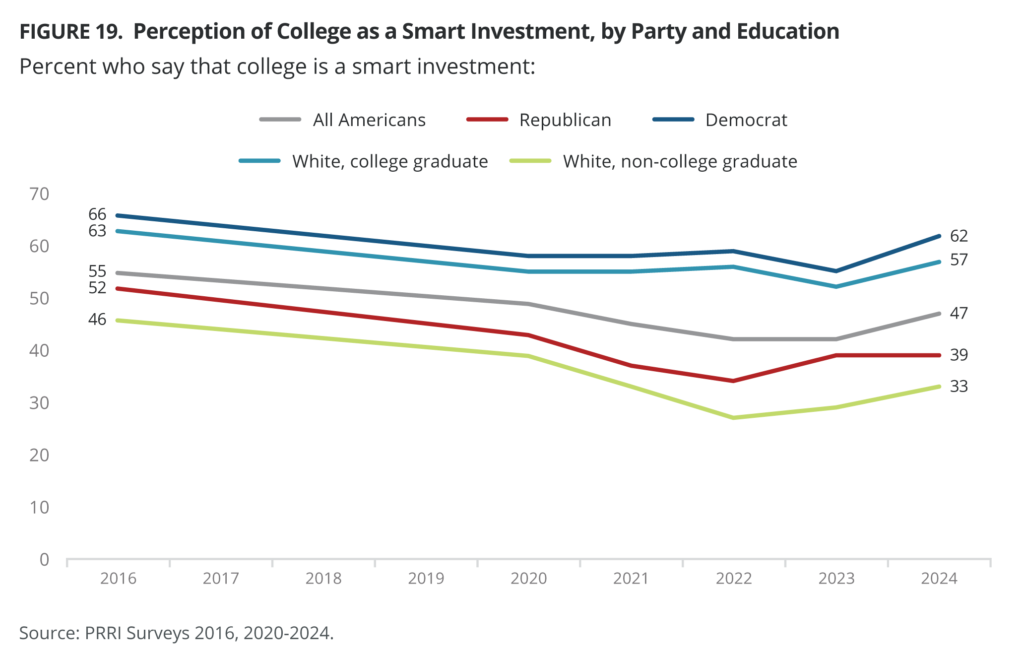
College Prepares Young People for the World
Six in ten Americans say the college education system prepares young people for the real world (60%) rather than making them out of touch (37%). Democrats (83%) are significantly more likely than independents (60%) and Republicans (42%) to say the college education system prepares young people for the real world. Around seven in ten Black (70%), AAPI (70%), and Hispanic (67%), and around half of white (55%) and multiracial (54%) Americans say the same. Around six in ten Gen Zers (64%), members of the Silent Generation (61%), millennials (60%), Gen Xers (59%), and baby boomers (58%) say that the college education system prepares young people for the real world.
College Broadens the Worldview of Young People
Two-thirds of Americans say that the college education system broadens the worldview of young people (67%) rather than radicalizes them (30%), yet party differences are stark: Democrats (90%) are significantly more likely than independents (67%) and Republicans (46%) to say that college broadens the worldview of young people. Black Americans (80%) are more likely than Hispanic (72%), multiracial (64%), and white Americans (62%) to say the college education system broadens the worldview of young people but are not significantly different from the AAPI community (74%). Gen Zers (73%) are more likely than Gen Xers (65%), baby boomers (63%), and the Silent Generation (63%) to say that the college education system broadens the views of young people but are not significantly different from millennials (68%).
College Is Accessible to All Who Want to Attend
Four in ten Americans (41%) agree that the education system is accessible to all people who want to attend, with Republicans (50%) being more likely than independents (40%) and Democrats (37%) to say so. Nearly half of Black Americans (48%) and four in ten white Americans (40%), and AAPI and Hispanic Americans (both 41%) say that the college education system is accessible to all people who want to attend, compared with 32% of multiracial Americans. Gen Zers (31%) are less likely than Gen Xers (44%), baby boomers (48%), and the Silent Generation (52%) to say that the college education system is accessible for all people but are not significantly different from millennials (36%).
College Is the Best Option for Everyone to Get Ahead in Life
One-third of Americans (32%) believe that college is the best option for everyone to get ahead in life, including 41% of Democrats, 31% of independents, and 27% of Republicans. White Americans (27%) are less likely than Black (40%) and Hispanic (40%) Americans to say that the college education system is the best option for everyone to get ahead in life but do not differ significantly from multiracial (30%) and AAPI (35%) Americans. Similarly, Gen Zers (28%) are less likely than baby boomers (37%) and the Silent Generation (45%) to say that the college education system is the best option for everyone to get ahead in life but do not differ significantly from millennials (26%) or Gen Xers (31%).
![]()
Supreme Court Age or Term Limits
Nearly three-quarters of Americans (73%) favor requiring Supreme Court justices to retire at a certain age or after a certain number of years instead of serving for life, while 24% of Americans oppose this. The vast majority of Democrats (88%) favor age or term limits for Supreme Court justices, compared with 72% of independents and 59% of Republicans.
Majorities of all religious traditions favor Supreme Court justices retiring at a certain age or after a certain number of years, with unaffiliated Americans (83%) most likely to agree and white evangelical Protestants (59%) least likely.
Americans who qualify as Christian nationalism Rejecters and Skeptics (80%) are more likely than Adherents and Sympathizers (62%) to favor Supreme Court justices retiring at a certain age or after a certain number of years instead of serving for life.
About three-quarters of Gen Zers (76%), millennials (76%), and Gen Xers (73%), as well as around two-thirds of baby boomers (68%) and members of the Silent Generation (67%), support age or term limits for justices. Around three-quarters of women (76%) favor Supreme Court justices retiring at a certain age or after a certain number of years, compared with 70% of men. 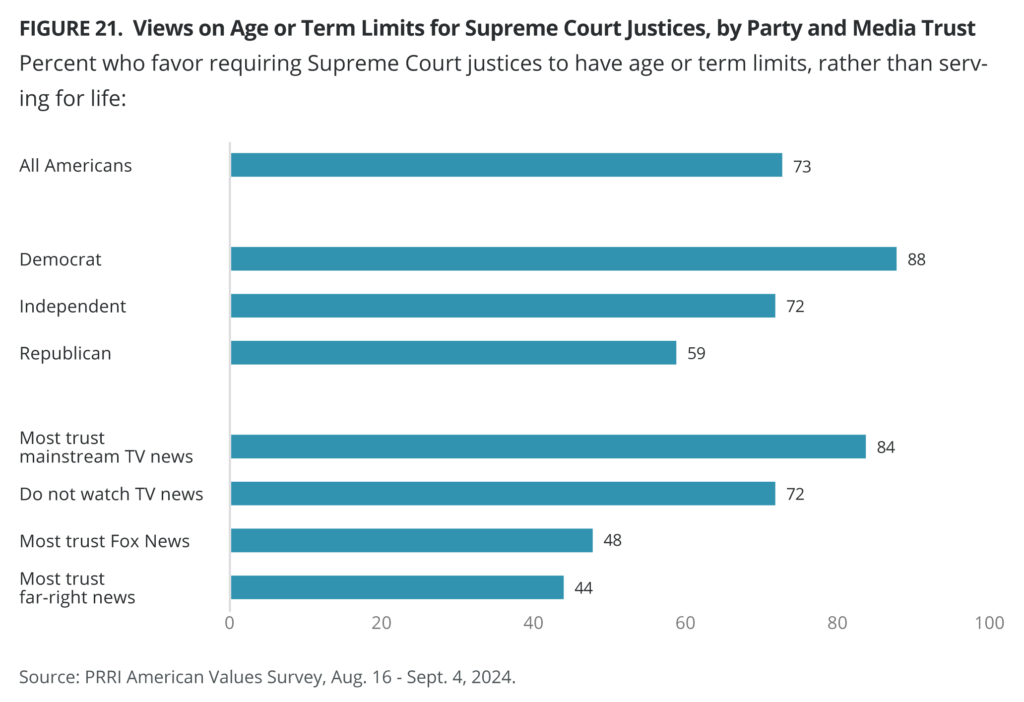
Women’s Reproductive Rights
Legality of Abortion
About six in ten Americans (62%) say abortion should be legal in most or all cases, compared with around one-third of Americans (34%) who say it should be illegal in most or all cases. Americans are more than three times as likely to say abortion should be legal in all cases than they are to say it should be illegal in all cases (25% vs. 7%).
Four in ten Republicans (40%) say abortion should be legal in most or all cases, compared with 59% who say it should be illegal in most or all cases. Only 13% of Republicans say abortion should be illegal in all cases. Around two-thirds of independents (65%) and the vast majority of Democrats (86%) say abortion should be legal in most or all cases. Since 2010, Democratic support for the legality of abortion in most or all cases has increased by 15 percentage points, up from 71%. 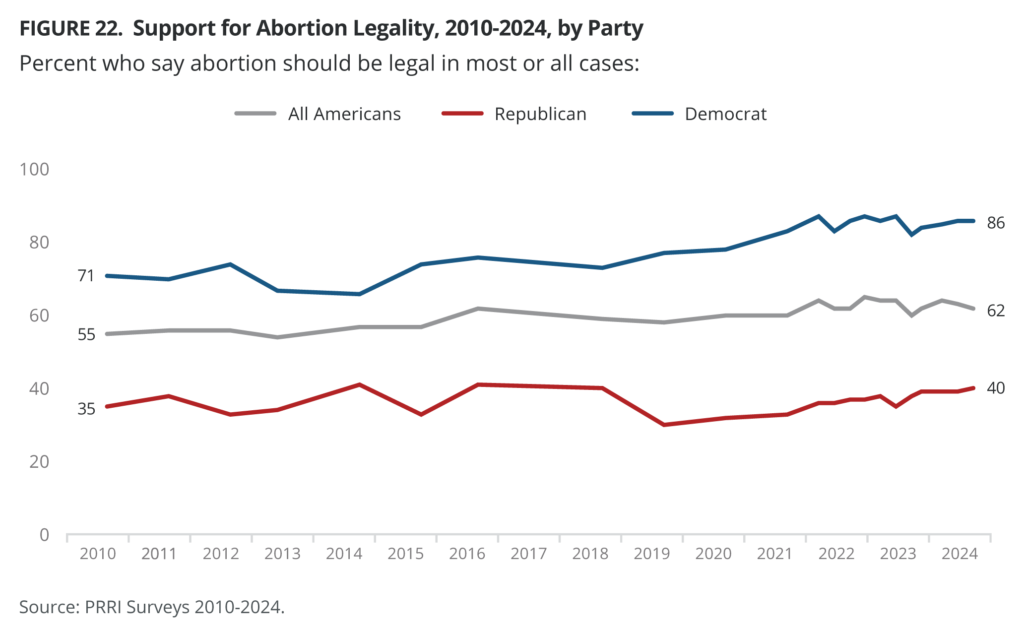
Majorities of religious traditions support abortion legality, including unaffiliated Americans (83%), Jewish Americans (79%), other non-Christian religions (78%), Black Protestants (74%), white mainline/non-evangelical Protestants (66%), white Catholics (59%), and Hispanic Catholics (58%). Around four in ten Hispanic Protestants (41%) support abortion legality, as do fewer than three in ten white evangelical Protestants (29%) and Latter-day Saints (27%).
Christian nationalism Rejecters and Skeptics (77%) are more likely to support abortion legality, while 37% of Sympathizers and Adherents support it. Only 13% of Christian nationalism Adherents and Sympathizers say abortion should be illegal in all cases.
Ensuring Some Health Care Professionals Provide Legal Abortions
Two-thirds of Americans (65%) favor ensuring at least some health care professionals in their community provide legal abortions, while 30% oppose it. More than eight in ten Democrats (85%) favor ensuring some health care professionals provide legal abortions, compared with 69% of independents and 48% of Republicans.
With the exception of white evangelical Protestants (39%) and Hispanic Protestants (36%), majorities of all major religious traditions favor ensuring some health care professionals provide legal abortions, with the highest favorability among around eight in ten unaffiliated (83%) and Jewish Americans (79%). The majority of other non-Christian religions (76%), white mainline/non-evangelical Protestants (75%), Black Protestants (72%), white Catholics (66%), Latter-day Saints (58%), and Hispanic Catholics (54%) favor ensuring at least some health care professionals in their community provide legal abortions.
Around eight in ten Christian nationalism Rejecters and Skeptics (79%) favor ensuring some health care professionals in their community provide legal abortions, compared with only 43% of Adherents and Sympathizers.
The Abortion Pill
The majority of Americans (68%) oppose laws that make it illegal to use or receive through the mail FDA-approved drugs, also known as the abortion pill, for medical abortion; fewer than three in ten Americans (29%) favor these laws. More than eight in ten Democrats (82%) oppose laws that make it illegal to receive abortion pills through the mail, compared with 71% of independents and 54% of Republicans.
Majorities of each religious tradition oppose laws that make it illegal to use or receive through the mail pills for a medical abortion. About eight in ten unaffiliated Americans (81%) oppose these laws, followed by other non-Christian religions (77%), white mainline/non-evangelical Protestants (75%), Jewish Americans (75%), Black Protestants (68%), white Catholics (65%), Hispanic Catholics (63%), Latter-day Saints (58%), Hispanic Protestants (53%), and white evangelical Protestants (51%).
Eight in ten Christian nationalism Rejecters and Skeptics (80%) oppose laws that make abortion pills through the mail illegal, compared with 49% of Adherents and Sympathizers.
Seven in ten multiracial (73%), AAPI (72%), and white Americans (71%), as well as more than six in ten Black (64%) and Hispanic Americans (62%) oppose laws that make it illegal to use or receive pills for a medical abortion. Around three-quarters of white Americans with a four-year degree or higher (77%) oppose laws that make it illegal to use or receive medical abortion pills through the mail, compared with 66% of white Americans without a four-year degree.
In Vitro Fertilization
The vast majority of Americans (85%) oppose laws that make it illegal for people to seek out in vitro fertilization, or IVF, to have a child; only 13% of Americans favor such laws. There are no differences in the opposition to laws making IVF illegal across Democrats (88%), independents (86%), and Republicans (85%). Approximately eight in ten or more of every religious tradition oppose laws that make it illegal for people to seek out IVF to have a child, including 84% of white evangelical Protestants.
Human Life Begins at Fertilization
Over half of Americans (56%) oppose laws that declare human life begins at the moment of fertilization, while 39% of Americans favor such laws. The majority of Democrats (77%) and independents (61%) oppose laws that assert human life begins at fertilization, compared with 35% of Republicans.
Around eight in ten religiously unaffiliated (81%) and Jewish (76%) Americans oppose laws that declare human life begins at the moment of fertilization. Similarly, around six in ten other non-Christians (67%), white mainline/non-evangelical Protestants (64%) and Black Protestants (58%), and half of white (51%) and Hispanic Catholics (50%) oppose laws declaring that human life begins at fertilization, compared with one-third or fewer of Latter-day Saints (35%), white evangelical Protestants (26%), and Hispanic Protestants (26%).
Seven in ten Christian nationalism Rejecters and Skeptics (72%) oppose laws that declare human life begins at fertilization, compared with 29% of Adherents and Sympathizers.
![]()
Gender and LGBTQ Issues
Same-Sex Marriage
Two-thirds of Americans (66%) support allowing same-sex couples to marry legally, a 12-percentage-point increase from 54% in 2014. However, support for same-sex marriage has decreased slightly from 69% in 2022. Three in ten Americans (30%) oppose allowing same-sex marriage. More than eight in ten Democrats (84%) favor same-sex marriage, a 19-percentage-point increase from 2014, when 65% of Democrats favored allowing gay and lesbian couples to marry legally. Around seven in ten independents (71%) support same-sex marriage, a 13-percentage-point increase from 2014 (58%). Republicans are divided between support (49%) and opposition (49%) to same-sex marriage; Republican support has increased significantly from 35% in 2014.
The vast majority of religiously unaffiliated Americans (85%) favor same-sex marriage, followed by around three-quarters of white mainline/non-evangelical Protestants (78%), other non-Christian religions (75%), and Jewish Americans (73%), seven in ten white Catholics (70%), and two-thirds of Hispanic Catholics (66%). Six in ten Latter-day Saints (62%) and Black Protestants (61%) also support same-sex marriage. Only two major religious groups lack majority support for same-sex marriage today: Hispanic Protestants (37%) and white evangelical Protestants (35%).
Eight in ten Christian nationalism Rejecters and Skeptics (82%) favor allowing same-sex couples to marry legally, compared with 39% of Adherents and Sympathizers.
Around seven in ten multiracial (73%), AAPI (72%), and white (68%) Americans support same-sex marriage, compared with six in ten Black (60%) and Hispanic Americans (60%). Looking at education levels, white Americans with a college degree (78%) are more likely than those without a college degree (62%) to favor same-sex marriage. Seven in ten Gen Zers (71%) and millennials (70%) favor allowing same-sex couples to marry legally, followed by 65% of Gen Xers, 62% of baby boomers, and 55% of members of the Silent Generation.
Preventing Parents from Letting Their Child Receive Care for Gender Transitions
Americans are divided over support for laws that would prevent parents from allowing their child to receive medical care for a gender transition (47% favor, 49% oppose). There is a slight increase in support from 44% in 2022 when PRRI first asked this question. Both Republicans (68%) and Democrats (26%) have grown more likely to agree with such laws in 2024 than they were in 2022 (61% and 22%, respectively). Independents remain stable.
Majorities of white Christian groups support these laws, including 65% of white evangelical Protestants (up from 59% in 2022 but down from 72% in 2023), 54% of white mainline/non-evangelical Protestants (up from 46% in 2022), and 51% of white Catholics (up from 43% in 2022). Six in ten Latter-day Saints (62%) also agree. Around half of Hispanic Protestants (52%) and around four in ten Black Protestants (44%) and Hispanic Catholics (37%) support such laws. Four in ten Jewish (40%) and unaffiliated (39%) Americans, as well as one-third of other non-Christian religions (34%), also agree.
The majority of Christian nationalism Adherents and Sympathizers (64%) support these laws, a more than 20-percentage-point difference with Rejecters and Skeptics (41%).
The Silent Generation (34%) is less likely than Gen Zers (45%), millennials (48%), Gen Xers (49%), and baby boomers (46%) to favor these restrictions. Half of men (50%) support these laws, compared with 44% of women.
IDs Showing Sex at Birth Rather Than Gender Identity
A majority of Americans (57%) support laws that require driver’s licenses or government ID to display a person’s sex at birth rather than their gender identity, while 38% oppose them. More than eight in ten Republicans (83%) support these laws, compared with 59% of independents and 34% of Democrats.
White evangelical Protestants (81%) are the most supportive of laws that require driver’s licenses or government ID to display a person’s sex at birth rather than their gender identity, followed by seven in ten Latter-day Saints (69%). Two-thirds of white Catholics (66%), white mainline/non-evangelical Protestants (65%), and Hispanic Protestants (64%) favor these laws, as well as 61% of Hispanic Catholics and slim majorities of Black Protestants (54%) and Jewish Americans (53%). Fewer than half of other non-Christian religions (47%) support these laws, and unaffiliated Americans are the least likely to support them, at 42%.
More than eight in ten Christian nationalism Adherents and Sympathizers (83%) agree with these laws, compared with fewer than half of Rejecters and Skeptics (47%).
With the exception of AAPI (43%), the majority of other racial groups support laws that require driver’s licenses or government ID to display a person’s sex at birth rather than their gender identity, including six in ten white (60%) and Hispanic (59%) Americans, and more than half of multiracial (53%) and Black (52%) Americans.
Society Is Too Soft and Feminine
More than four in ten Americans (43%) agree that society as a whole has become too soft and feminine, a 5-percentage-point decrease from 2023 (48%); a majority of Americans (54%) disagree. Since PRRI first asked this question in 2011, the partisan divide has more than doubled, from 23 percentage points to 57 percentage points. Nearly three-quarters of Republicans (73%) say that society has become too soft and feminine, compared with 42% of independents and only 16% of Democrats.
Majorities of white Christian subgroups agree that society has become too soft and feminine, including nearly two-thirds of white evangelical Protestants (64%), six in ten Latter-day Saints (58%), and slimmer majorities of white mainline/non-evangelical Protestants (55%) and white Catholics (54%). Among non-white Christian groups, only the majority of Hispanic Protestants (55%) agree, followed by 36% of Hispanic Catholics, and 25% of Black Protestants. Nearly four in ten other non-Christian religions (37%) and Jewish Americans (36%), as well as three in ten unaffiliated Americans (30%), also agree.
Nearly seven in ten Christian nationalism Adherents and Sympathizers (68%) agree that society as a whole has become too soft and feminine, compared with 32% of Christian nationalism Rejecters and Skeptics.
Fewer than half of Gen Xers (48%) and around four in ten Gen Zers (40%), millennials (40%), baby boomers (44%), and members of the Silent Generation (39%) view society as becoming too soft and feminine. Men (49%) are more likely than women (38%) to agree that society has become too soft and feminine. 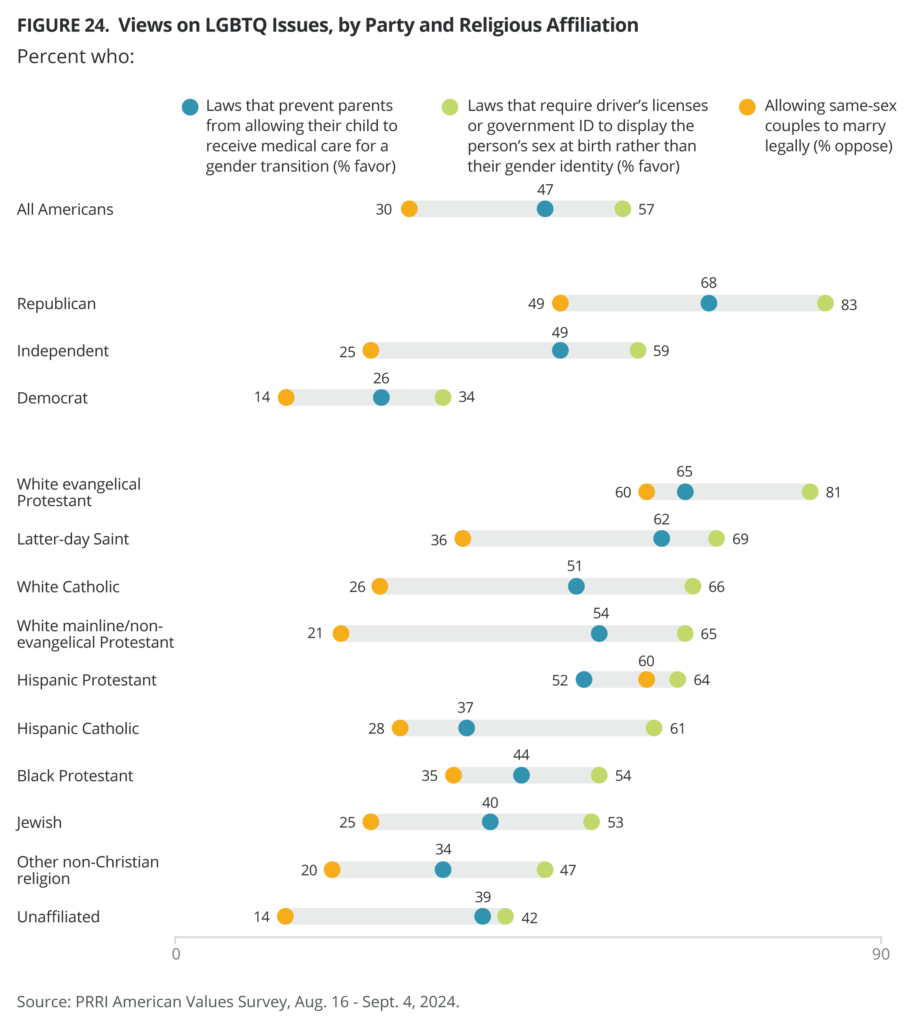
Systemic Racism
The State of Race Relations in the U.S.
Nearly six in ten Americans (59%) say that over the last four years, the state of race relations in the United States has mostly changed for the worse. Around four in ten Americans (38%) say race relations have changed for the better. Three-quarters of Republicans (75%) say that race relations in the United States have mostly changed for the worse in the last four years, compared with 57% of independents and 45% of Democrats.
Seven in ten AAPI (70%) and around six in ten Black (60%), white (59%), multiracial (58%), and Hispanic Americans (56%) say that over the last four years, race relations in the United States have mostly changed for the worse. White Americans without a college degree (62%) are more likely than white Americans with a college degree (54%) to say race relations in the United States have mostly changed for the worse.
A slim majority of Gen Zers (52%) and around six in ten millennials (60%), Gen Xers (62%), baby boomers (59%), and members of the Silent Generation (57%) say that race relations have mostly changed for the worse.
Generations of Slavery and Discrimination Against Minorities
Americans are evenly divided over whether generations of slavery and discrimination against Black people and Native Americans have given white people unfair economic advantages (48% agree, 48% disagree). Levels of disagreement on this statement are 10 percentage points lower than when the question was first asked in 2015 (58%). Three-quarters of Republicans (76%) disagree that generations of slavery and discrimination have given white people unfair economic advantages, compared with 45% of independents and 26% of Democrats.
White evangelical Protestants are most likely to disagree that generations of slavery and discrimination have given white people unfair economic advantages (70%), followed by majorities of white Catholics (62%), white mainline/non-evangelical Protestants (58%) and Latter-day Saints (58%). Fewer than half of Hispanic Protestants (48%) and around four in ten Hispanic Catholics (42%), Jewish Americans (41%), and religiously unaffiliated Americans (38%) disagree with the statement. More than one-third of other non-Christian religions (35%) and only one-quarter of Black Protestants (25%) disagree.
Two-thirds of Christian nationalism Adherents and Sympathizers (67%) disagree that generations of slavery and discrimination have given white people unfair economic advantages, compared with four in ten Christian nationalism Rejecters and Skeptics (40%).
A majority of white Americans (55%) disagree that generations of slavery and discrimination against Black people and Native Americans have given white people unfair economic advantages, compared with 42% of Hispanic, 36% of multiracial, 35% of AAPI, and 27% of Black Americans. White Americans without a four-year degree (62%) are more likely to disagree than white Americans with a four-year degree or higher (45%).
Around half of Gen Xers (50%), baby boomers (52%), and the Silent Generation (53%) disagree with the statement, compared with 42% of millennials and 46% of Gen Zers.
Immigration
Views of Immigrants
Immigrants Increase Crime Rates
Around four in ten Americans (43%) say that immigrants increase crime rates in local communities, while the majority (54%) disagree. Nearly three-quarters of Republicans (73%) agree with this statement, compared with 40% of independents and only 17% of Democrats.
More than eight in ten Americans who most trust far-right news (84%) and three-quarters who most trust Fox News (76%) agree with this negative perception of immigrants, followed by 42% who do not watch TV news and 29% who most trust mainstream TV news. Americans who receive their political news from newspapers or magazines (26%) are the least likely to agree with the statement, compared with 55% who receive their information from podcasts, 50% from YouTube, 49% from radio, 48% from television, and 39% from social media.
Among white Christian groups, white evangelical Protestants (69%) agree that immigrants increase crime rates in local communities, followed by 58% of white Catholics and 49% of white mainline/non-evangelical Protestants. Nearly four in ten Hispanic Catholics (39%) and three in ten Black Protestants (28%) and unaffiliated Americans (27%) agree with this statement.3
Around seven in ten Christian nationalism Adherents and Sympathizers (69%) agree that immigrants increase crime rates in local communities, compared with 31% of Rejecters and Skeptics.
Immigrants Burden Local Communities
Nearly six in ten Americans (57%) say the growing number of newcomers from other countries burdens local communities by using more than their share of social services, while 39% of Americans disagree. The vast majority of Republicans (86%) agree with this statement, compared with 57% of independents and 36% of Democrats.
Around nine in ten Americans who most trust far-right news (93%) or Fox News (86%) say that newcomers burden local communities, compared with 57% who do not watch TV news and 48% who most trust mainstream TV news.
More than three-quarters of white evangelical Protestants (78%), two-thirds of white Catholics (68%) and white mainline/non-evangelical Protestants (67%), and slim majorities of Black Protestants (55%) and Hispanic Catholics (53%) say that immigrants burden local communities.4 Around four in ten unaffiliated Americans (42%) agree with this statement.
More than eight in ten Christian nationalism Adherents and Sympathizers (83%) say the growing number of newcomers burdens local communities, compared with fewer than half of Rejecters and Skeptics (48%).
The Great Replacement Theory
Around one-third of Americans (35%) agree with the statement “immigrants are invading our country and replacing our cultural and ethnic background,” compared with 61% who disagree. Agreement with this statement has remained unchanged from the first time PRRI asked this question in 2019 (36%). While Democrats (13%) have become less likely to agree with this idea — which is promoted in conservative circles as the “Great Replacement Theory” — than they were in 2019 (20%), independents (29%) and Republicans (65%) have remained largely consistent.
The vast majority of far-right news (83%) and Fox News viewers (66%) agree with this theory, compared with 35% who do not watch TV news or 24% who most trust mainstream TV news.
With the exception of white evangelical Protestants (62%) and Latter-day Saints (50%), fewer than half of other religious groups agree with the “Great Replacement Theory.” Around four in ten white Catholics (45%) and white mainline/non-evangelical Protestants (41%); one-third of Jewish Americans (36%) and Hispanic Protestants (35%); and around one-quarter of other non-Christian religions (28%), Black Protestants (25%), Hispanic Catholics (24%), and unaffiliated Americans (23%) agree with this statement.
There is a 40-percentage-point difference between the proportion of Christian nationalism Adherents and Sympathizers (63%) vs. Rejecters and Skeptics (23%) who agree with the theory.
Immigrants are Poisoning the Blood of the Country
One-third of Americans (34%) say that immigrants entering the country illegally today are poisoning the blood of our country, while 63% of Americans disagree. Six in ten Republicans (61%) agree with this statement, compared with 30% of independents and only 13% of Democrats.
A majority of Americans who most trust far-right news (70%) or Fox News (65%) agree with this idea, compared with 32% who do not watch TV news, and 23% who most trust mainstream TV news.
White evangelical Protestants (60%) are the only religious group in which a majority agree that immigrants entering the country illegally are poisoning the blood of the country. Fewer than half of white Catholics (46%) and only one-third of white mainline/non-evangelical Protestants (36%) and Latter-day Saints (34%) agree with the statement. Three in ten Hispanic Protestants (30%), around one-quarter of Hispanic Catholics (27%), other non-Christian religions (27%), Jewish (23%) and unaffiliated (23%) Americans, and only 19% of Black Protestants also agree with this idea.
Six in ten Christian nationalism Adherents and Sympathizers (60%) say that illegal immigrants are poisoning the blood of the country, compared with 22% of Rejecters and Skeptics.
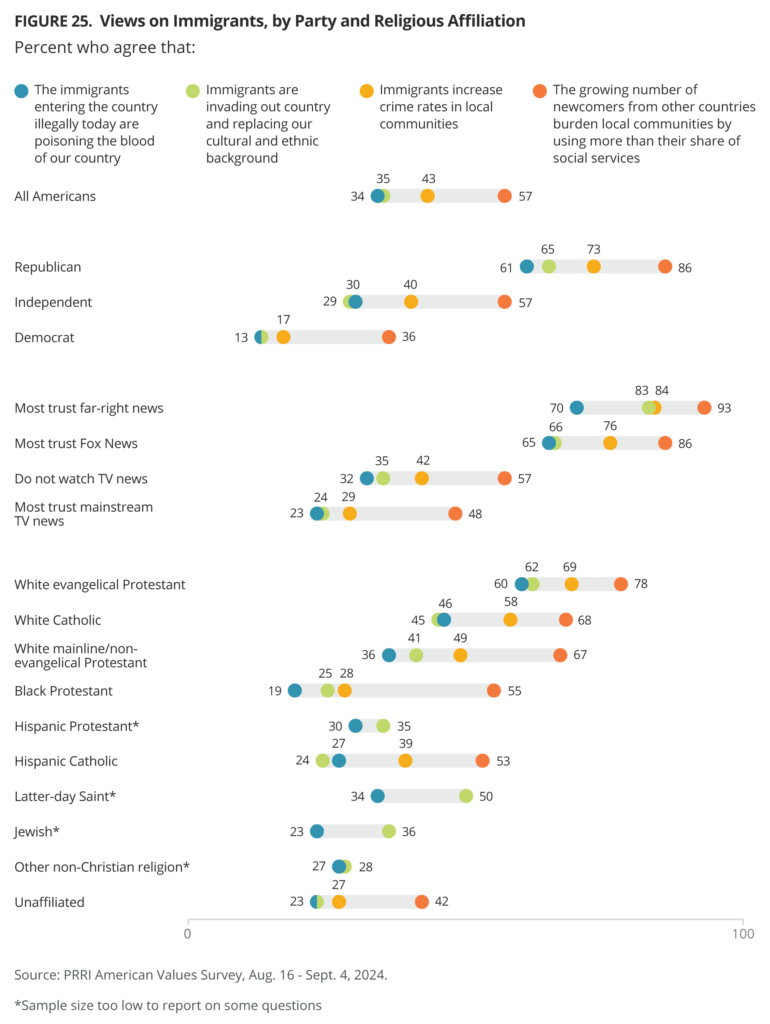
Immigration Policies
Rounding Up Illegal Immigrants into Militarized Encampments
Americans are divided over support for a policy that would round up and deport immigrants who are in the country illegally, even if it takes setting up encampments guarded by the U.S. military (47% favor, 50% oppose). Nearly eight in ten Republicans (79%) favor putting undocumented immigrants in encampments, compared with 47% of independents and 22% of Democrats.
The vast majority of Americans who most trust far-right news (91%) or Fox News (82%) favor militarized encampments for undocumented immigrants, compared with 44% of Americans who do not watch TV news and 36% who most trust mainstream TV news.
White evangelical Protestants (75%) are most likely to favor militarized encampments for undocumented immigrants, followed by the majority of white Catholics (61%), white mainline/non-evangelical Protestants (58%), and Latter-day Saints (56%). Among non-white Christians, around 47% of Hispanic Protestants, 42% of Black Protestants, and 33% of Hispanic Catholics favor this policy. Four in ten Jewish Americans (39%) and around three in ten unaffiliated Americans (32%) and other non-Christian religions (30%) also support militarized encampments. More than half of Americans who attend church weekly or more (57%) or at least a few times a year (51%) favor putting illegal immigrants in encampments, compared with 41% who seldom or never attend religious services.
Around seven in ten Christian nationalism Adherents and Sympathizers (71%) favor militarized encampments, compared with fewer than four in ten Rejecters and Skeptics (37%).
A Pathway to Citizenship for Undocumented Immigrants
A majority of Americans (56%) say that immigrants living in the United States illegally should be given a way to become citizens, provided they meet certain requirements. More than one in ten say they would prefer undocumented immigrants to be eligible for permanent residency status but not citizenship (11%), and three in ten say all immigrants living in the country illegally should be identified and deported (31%). Majority support for a pathway to citizenship for undocumented immigrants has remained consistent since 2013, with a high of 67% in 2019.
Democrats (77%) have grown more supportive of a path to citizenship for undocumented immigrants, with support increasing from 71% in 2013 when the question was first asked. By contrast, independents (55%) and Republicans (36%) have become less supportive than they were in 2013 (64% and 53%, respectively). Notably, the partisan gap on this question has more than doubled over the last decade, from 18 percentage points in 2013 to 41 percentage points in 2024.
Around two-thirds of Black Protestants (67%), other non-Christian religions (66%), Hispanic Catholics (64%) and unaffiliated Americans (64%) support allowing undocumented immigrants to become citizens, as do the majorities of Hispanic Protestants (57%), Jewish Americans (55%), and white mainline/non-evangelical Protestants (53%). Fewer than half of white Catholics (48%) Latter-day Saints (41%), and white evangelical Protestants (40%) support a pathway to citizenship.
Nearly two-thirds of Christian nationalism Rejecters and Skeptics (64%) support allowing undocumented immigrants to become citizens, compared with 41% of Christian nationalism Adherents and Sympathizers. 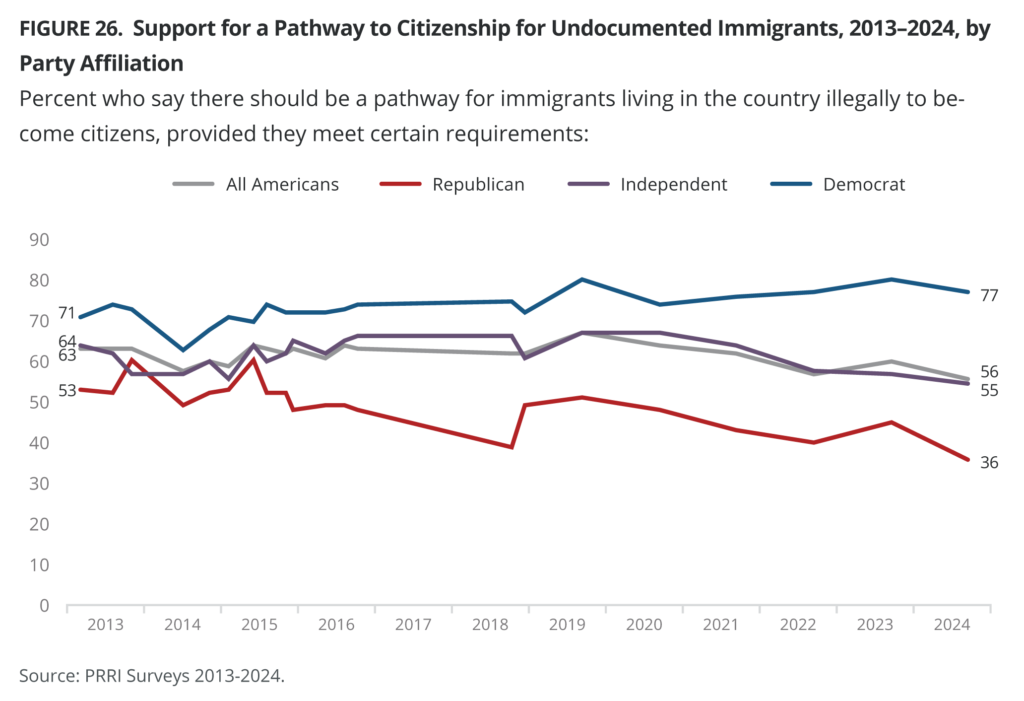
Allowing Children Brought to the U.S. Illegally to Become Citizens
A slim majority of Americans (52%) favor allowing immigrants brought illegally to the U.S. as children to gain legal resident status, while 44% oppose this idea. Support for this policy has decreased since the first time PRRI asked the question in 2018 (62%). More than three-quarters of Democrats (77%) favor allowing children brought to the U.S. illegally to gain resident status, compared with 56% of independents and 27% of Republicans.
Around two-thirds of Americans who most trust mainstream TV news (67%) favor this policy, compared with 50% who do not watch TV news, 25% who most trust Fox News, and only 16% who most trust far-right news.
Fewer than half of white Christian groups favor allowing children brought to the U.S. illegally to gain legal resident status, including 49% of white mainline/non-evangelical Protestants, 42% of white Catholics, 42% of Latter-day Saints, and 32% of white evangelical Protestants. All major non-white Christian groups favor this policy, including 69% of Hispanic Catholics, 66% of Black Protestants, and Hispanic Protestants (59%). More than six in ten unaffiliated Americans (64%) and other non-Christian religions (63%), as well as 51% of Jewish Americans, favor allowing children brought to the country illegally to gain resident status.
More than six in ten Christian nationalism Rejecters and Skeptics (63%) favor allowing immigrants brought to the U.S. illegally as children to gain legal resident status, compared with 34% of Adherents and Sympathizers.
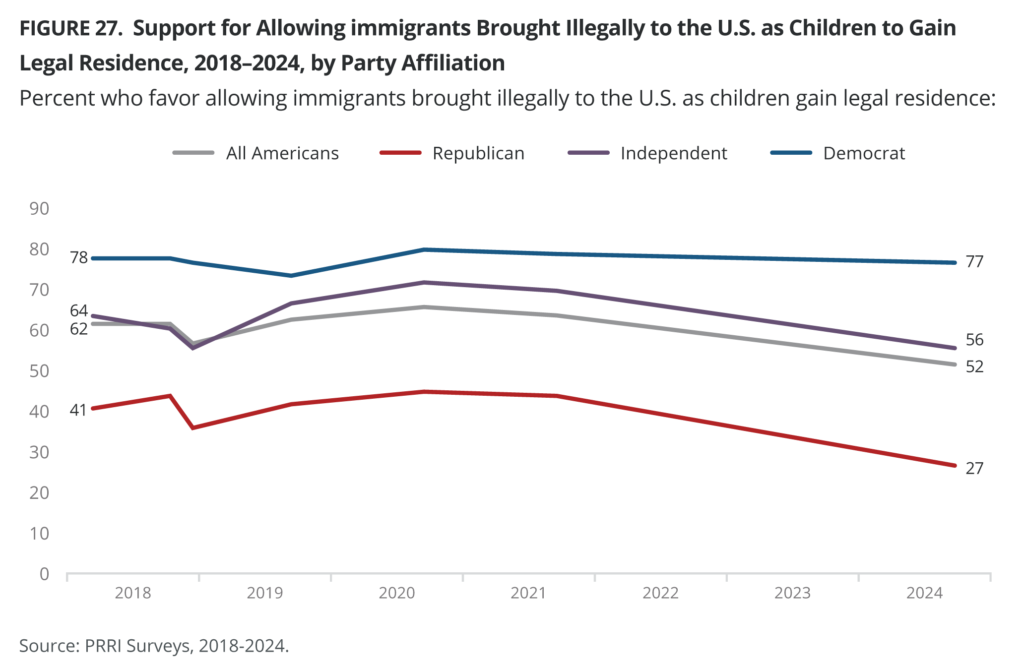
Building a Wall at the U.S. Southern Border with Mexico
Americans are divided over support for building a wall along the U.S. border with Mexico (51% favor, 46% oppose). Support for this policy has grown since 2016 when the question was first asked (41%). The vast majority of Republicans (88%) favor building a wall along the Southern border, compared with 51% of independents and 21% of Democrats.
Nearly all Americans who most trust far-right news (96%) and 86% who most trust Fox News favor building a wall, compared with 47% who do not watch TV news and 40% who most trust mainstream TV news.
Majorities of each white Christian group favor building a wall along the U.S. border with Mexico, including 82% of white evangelical Protestants, 71% of Latter-day Saints, 68% of white Catholics, and 62% of white mainline/non-evangelical Protestants. Among non-white Christians, fewer than half of Hispanic Protestants (49%), Black Protestants (43%), and Hispanic Catholics (37%) favor building a wall. Nearly half of Jewish Americans (49%) favor building a wall, compared with 34% of unaffiliated Americans and 31% of other non-Christian religions.
Nearly eight in ten Christian nationalism Adherents and Sympathizers (79%) support building a wall along the U.S. border with Mexico, compared with fewer than four in ten Rejecters and Skeptics (38%).
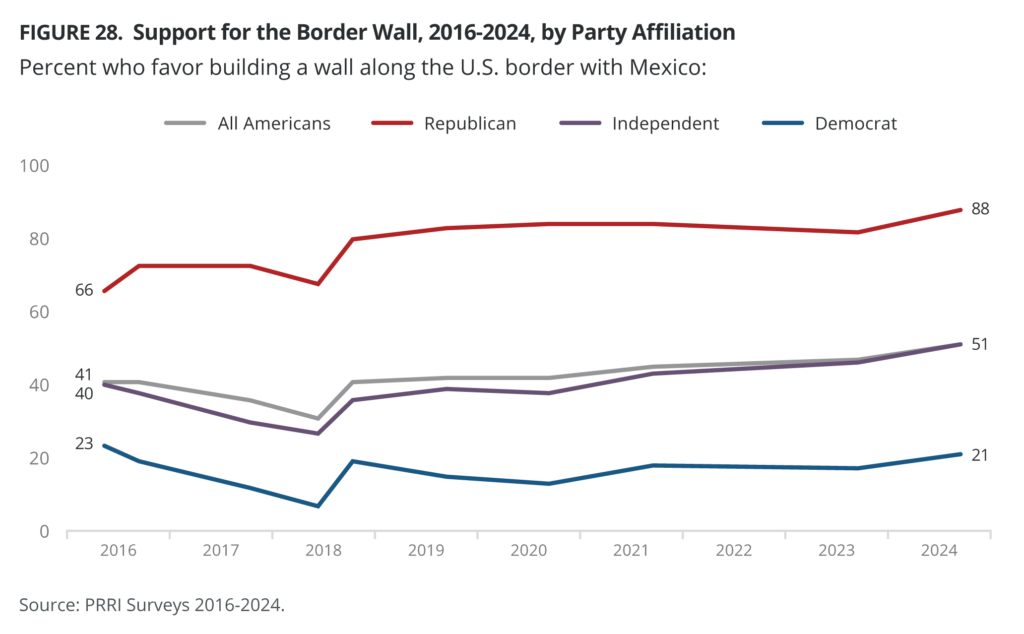
Foreign Policy
Perceptions of the Conflict Between Israel and the Palestinians
When asked about the continuing conflict between Israel and the Palestinians, a majority of Americans say either that their sympathies do not primarily lie with either group (31%) or that their sympathies lie with both groups (23%). Among those who feel more sympathy for one side, nearly twice as many say their sympathies lie more with the Israelis than with the Palestinians (28% vs. 15%). Republicans (54%) are more likely than independents (26%) and Democrats (11%) to say their sympathies lie more with the Israelis, while Democrats (25%) are more likely than independents (14%) and Republicans (3%) to say their sympathies lie with the Palestinians, as well as to say their sympathies lie with both (32% vs. 25% and 13%, respectively).
The majority of Americans who most trust far-right news (75%) or Fox News (61%) say their sympathies lie more with the Israelis, compared with 22% who do not watch TV news and 18% who most trust mainstream TV news.
Majorities of Jewish Americans (64%) and white evangelical Protestants (59%), along with pluralities of Hispanic Protestants (41%) and white Catholics (36%), say their sympathies lie more with the Israelis. By contrast, a plurality of other non-Christian religions (38%) says their sympathies lie more with the Palestinians. Majorities of all other religious groups say their sympathies do not primarily lie with either group.
Around three in ten white (34%) and multiracial (29%) Americans say their sympathies lie more with the Israelis, compared with 21% of Hispanic Americans, 17% of AAPI, and only 9% of Black Americans. White Americans without a four-year degree (34%) are more likely not to have sympathies for either group than those with a four-year degree or higher (22%). One-quarter of Gen Zers (26%) and two in ten millennials (20%) say their sympathies lie more with the Palestinians, compared with 10% of Gen Xers and 7% of both baby boomers and the Silent Generation. Nearly half of the Silent Generation (49%) say their sympathies lie more with the Israelis, followed by 39% of baby boomers, 30% of Gen Xers, 20% of millennials, and only 13% of Gen Zers. Men (33%) are more likely to say their sympathies lie more with the Israelis than women (23%).
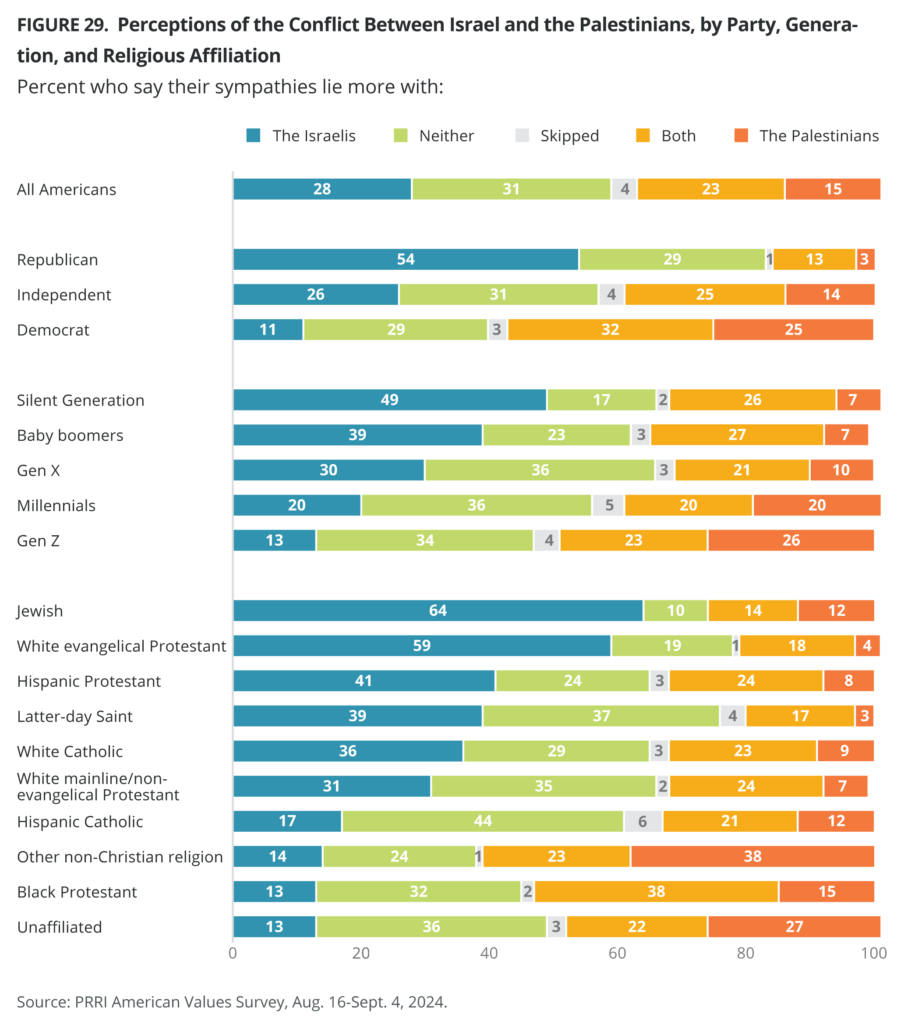
[1] The number of cases for Latter-day Saints throughout this report is 97. Results for this group need to be interpreted with caution.
[2] When restricting the sample to registered voters, the sample size for Black Americans (97) and Hispanic Americans (87) who attend religious services monthly or a few times a year drops below 100. Results for these groups need to be interpreted with caution.
[3] This question was asked of half the sample; thus, we cannot report on Hispanic Protestants, Latter-day Saints, Jewish Americans, or other non-Christian religions due to lower sample sizes.
[4] This question was asked of half sample; thus, we cannot report on Hispanic Protestants, Latter-day Saints, Jewish, or other non-Christian religions due to lower sample sizes.
Survey Methodology
The survey was designed and conducted by PRRI. The survey was made possible through the generous support of the Carnegie Corporation of New York, with additional support from the Ford Foundation, the Unitarian Universalist Veatch Program at Shelter Rock, and the Open Society Foundations. The survey was conducted among a representative sample of 5,027 adults (age 18 and up) living in all 50 states in the United States, who are part of Ipsos’s KnowledgePanel and an additional 325 who were recruited by Ipsos using opt-in survey panels to increase the sample sizes in smaller states. Interviews were conducted online between August 16 and September 4, 2024.
Respondents are recruited to the KnowledgePanel using an addressed-based sampling methodology from the Delivery Sequence File of the USPS – a database with full coverage of all delivery addresses in the U.S. As such, it covers all households regardless of their phone status, providing a representative online sample. Unlike opt-in panels, households are not permitted to “self-select” into the panel; and are generally limited to how many surveys they can take within a given time period. 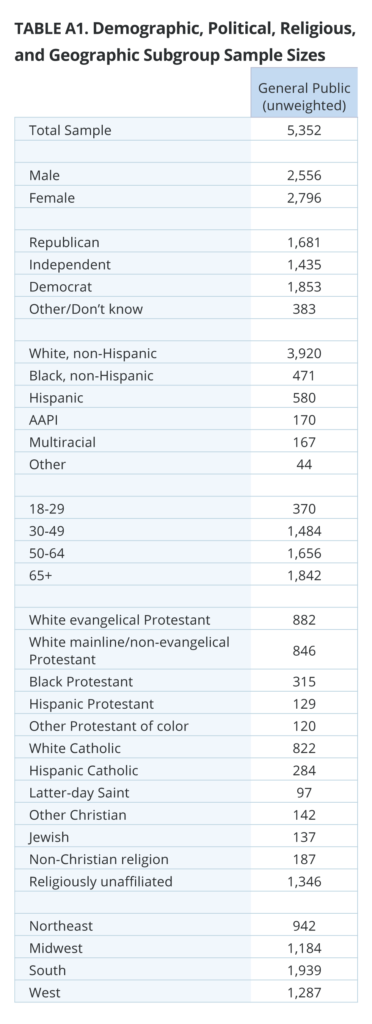
The initial sample drawn from the KnowledgePanel was adjusted using pre-stratification weights so that it approximates the adult U.S. population. Next, a probability proportional to size (PPS) sampling scheme was used to select a representative sample.
To reduce the effects of any non-response bias, a post-stratification adjustment was applied. The needed benchmarks were obtained from the latest 2023 March supplement of the Current Population Survey (CPS), except language proficiency, which is not available from CPS, and was obtained from the 2022 American Community Survey (ACS). Additionally, the party affiliation benchmark was obtained from Pew’s 2023 National Public Opinion Reference survey (NPORS). The post-stratification weight rebalanced the sample based on the following benchmarks: gender by age, race/ethnicity by gender, race/ethnicity by age, race/ethnicity by education, education, income, language proficiency, Census region by metropolitan status, and party affiliation. Additionally, we included individual states (50 states plus D.C.) to account for the oversampling of some states.
The margin of error for the national survey is +/- 1.82 percentage points at the 95% level of confidence, including the design effect for the survey of 1.84. In addition to sampling error, surveys may also be subject to error or bias due to question wording, context, and order effects. Additional details about the KnowledgePanel can be found on the Ipsos website: www.ipsos.com/en-us/solution/knowledgepanel