Analyzing the 2024 Presidential Vote: PRRI’s Post-Election Survey
Introduction
A new PRRI survey of 4,757 voters explores the U.S. political and cultural landscape after the 2024 election, including the impact of partisanship, race, and religion on voters’ choices and their feelings about the election’s outcome. Additionally, the survey considers how Christian nationalism and authoritarianism are linked to presidential vote choice. In the wake of the election results, the survey also considers Americans’ confidence in our elections, views about our political parties, and attitudes about the state of democracy in a second Trump term.
Support for the 2024 Presidential Candidates
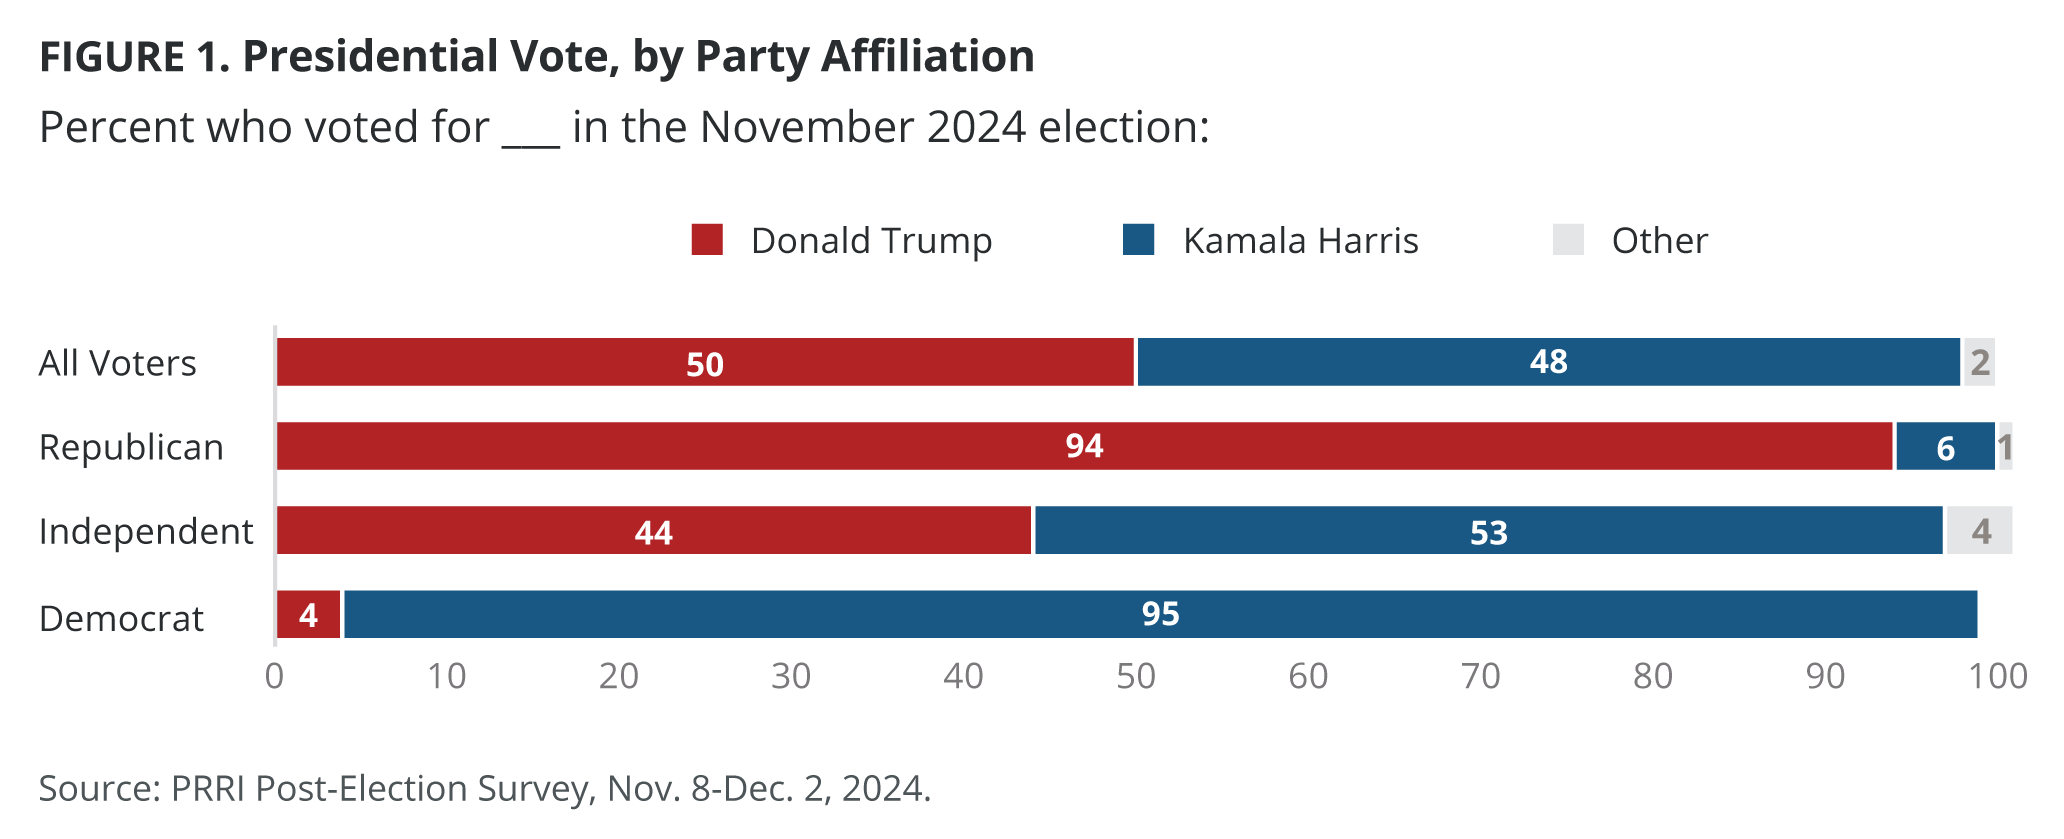
Americans report backing Donald Trump narrowly over Kamala Harris; while Republicans and Democrats overwhelmingly backed their party’s nominee, independents slightly favored Harris.
- Half of American voters (50%) report that they voted for Donald Trump, with slightly fewer voters reporting that they voted for Kamala Harris (48%). Just 2% of Americans report voting for other candidates.
- More than nine in ten Republicans (94%) report voting for Donald Trump and more than nine in ten Democrats (95%) report voting for Kamala Harris.
- Slightly more than half of independent voters (53%) say they voted for Kamala Harris, compared with 44% who say they voted for Donald Trump. Four percent of independents report voting for other candidates.
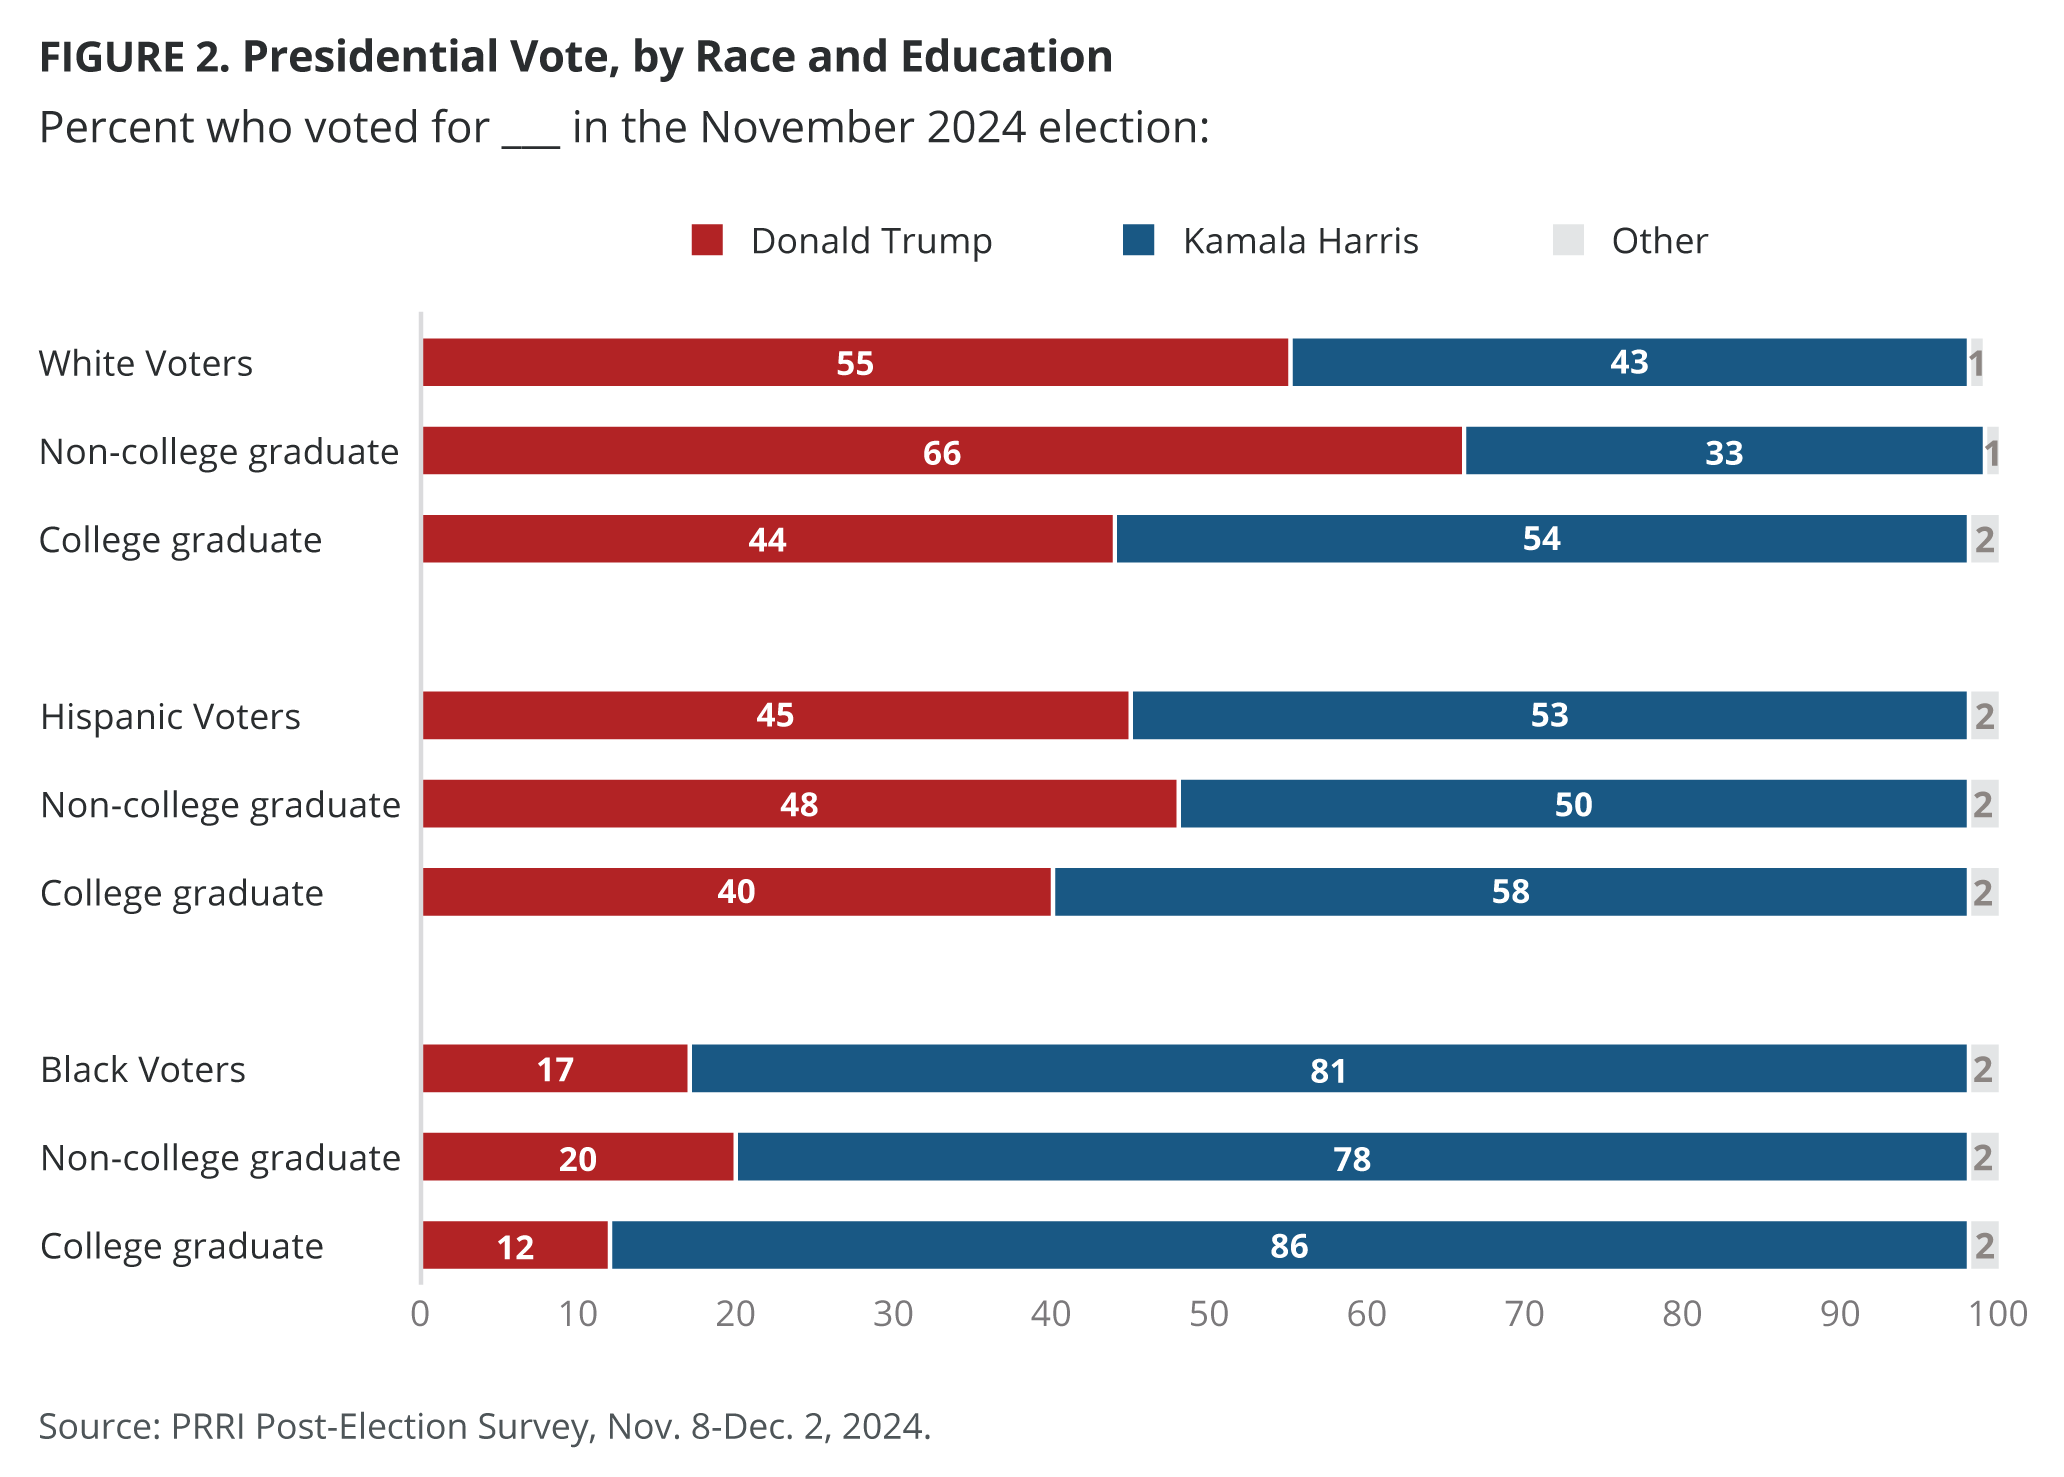
Racial differences in voting are pronounced, with Donald Trump garnering more support from white voters, especially non-college graduates. Hispanic voters slightly favored Kamala Harris and strong majorities of Black voters report voting for Harris.
- While white voters report voting for Trump at higher levels than Harris (55% vs. 43%) overall, white voters without a college degree (66%) were 22 percentage points more likely than white voters with a college degree (44%) to support Trump.
- Black voters overwhelmingly report voting for Harris over Trump (81% vs. 17%), with some variation by education levels: Black college-educated voters report voting for Harris at higher rates than working-class Black voters (86% vs. 78%).
- Hispanic voters were more divided between Harris (53%) and Trump (45%), though Harris received stronger support from Hispanic college graduates (58%), compared with working-class Hispanic Americans (50%).
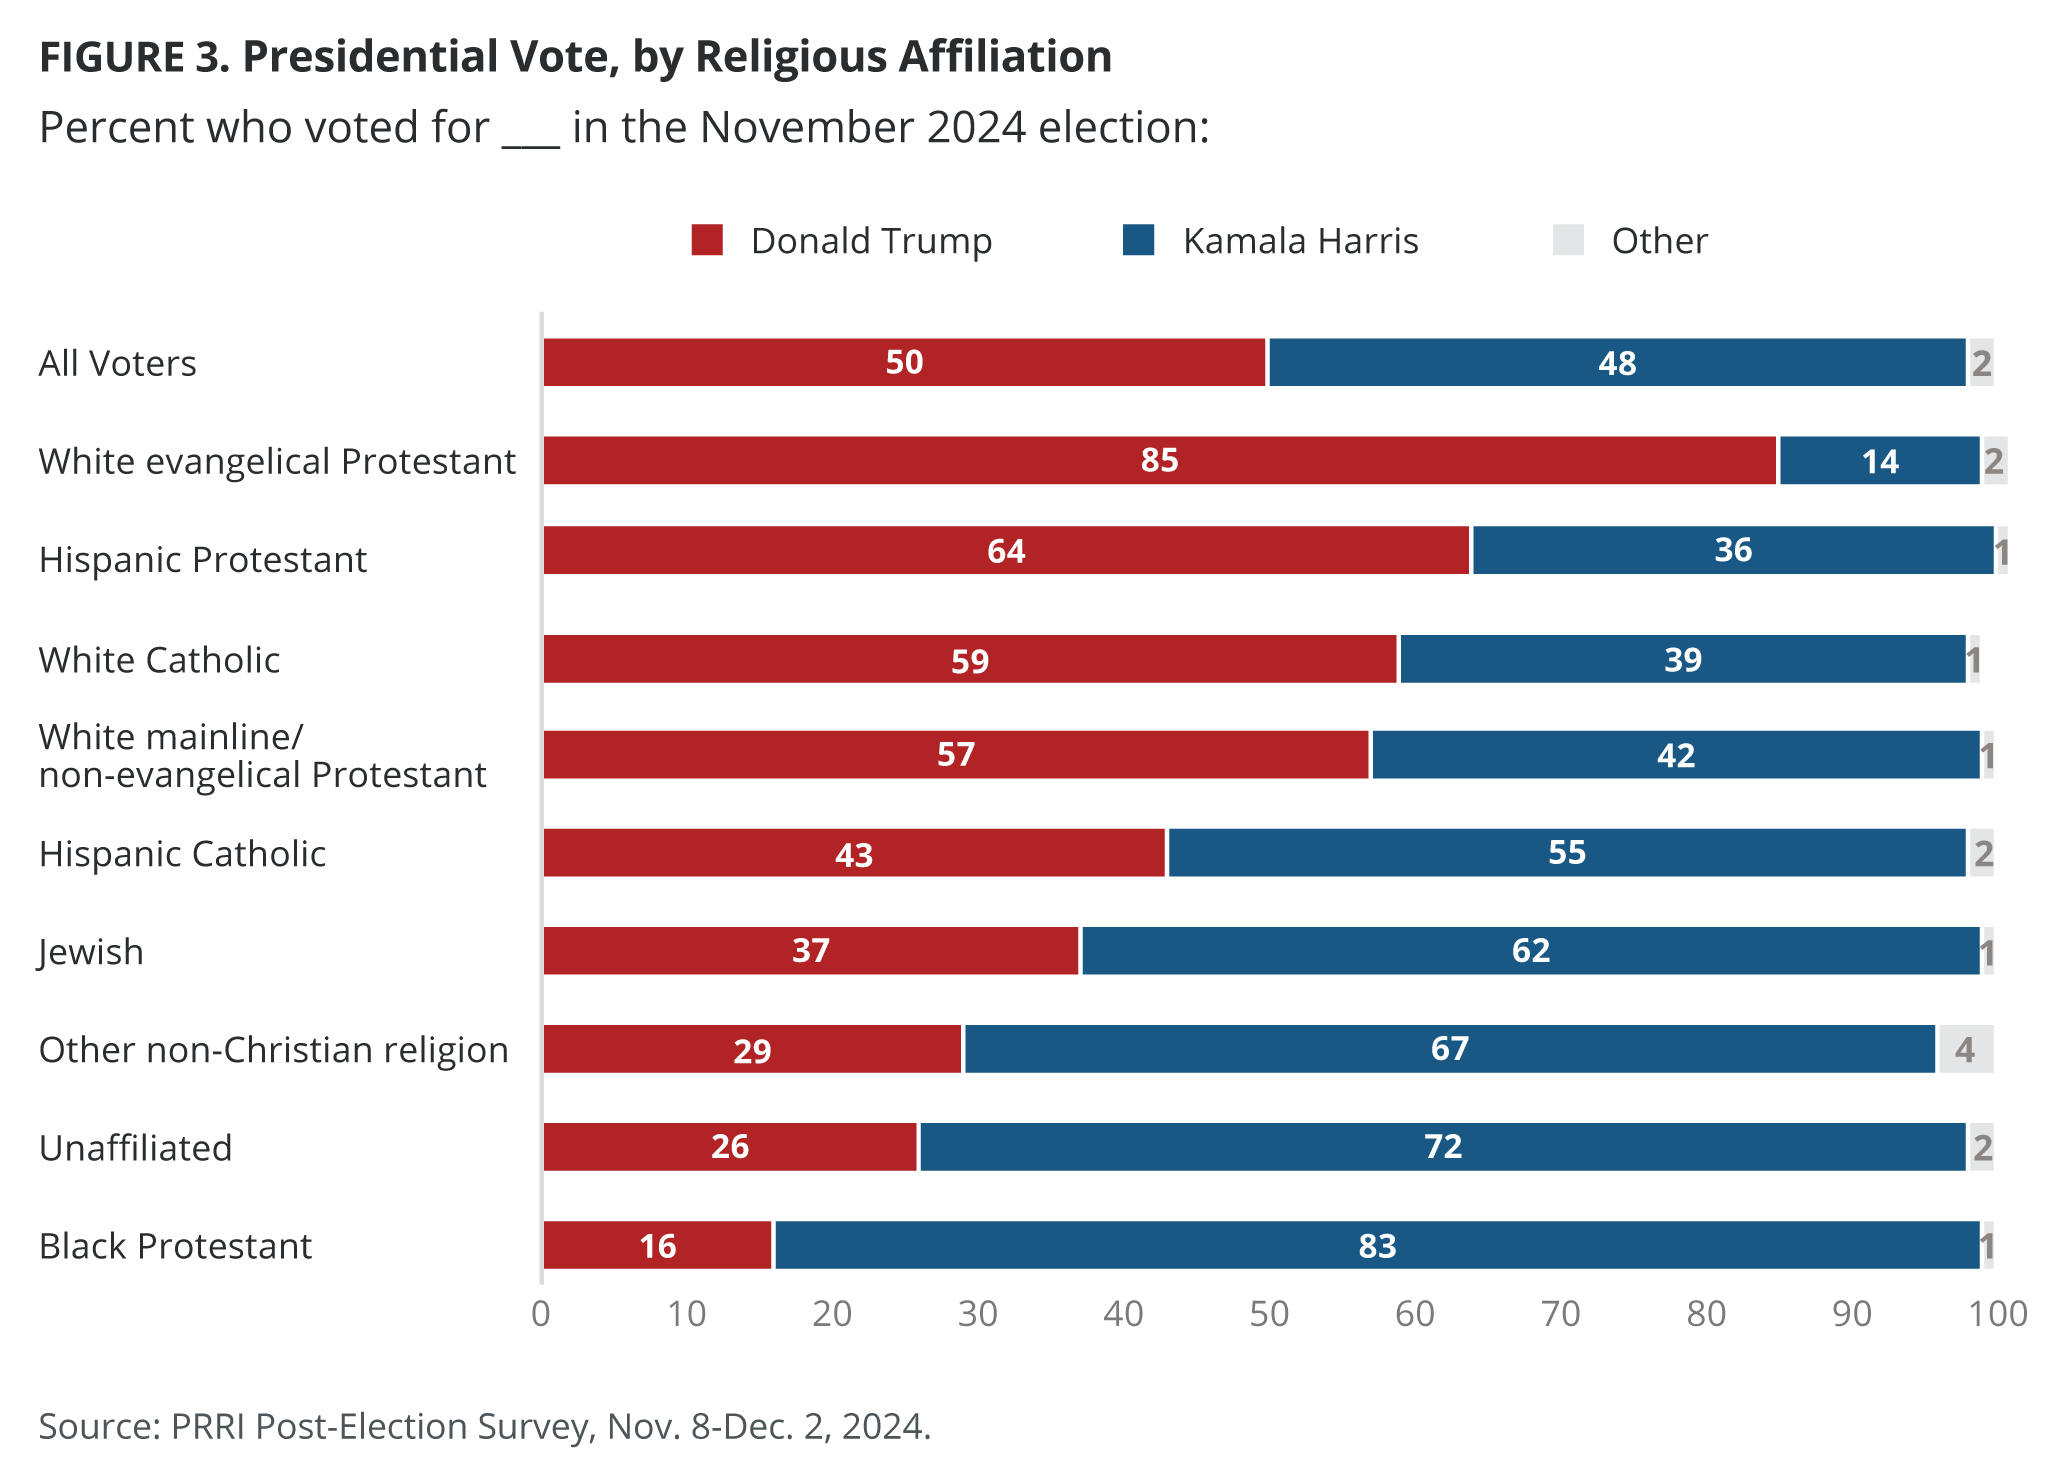
Religious divides in presidential vote choice are stark, with white evangelical Protestants strongly backing Trump and Black Protestants, the religiously unaffiliated, and non-Christian voters overwhelmingly supporting Harris.
- White evangelical Protestants continue to be the religious group with the strongest backing of Donald Trump, with 85% reporting that they voted for the President-elect. Majorities of both white Catholics (59%) and white mainline/non-evangelical Protestants (57%) also report voting for Trump.
- Strong majorities of Black Protestant voters (83%), unaffiliated voters (72%), those from other non-Christian religions (67%), and Jewish voters (62%) report voting for Harris.
- Hispanic Catholic voters are more likely to report voting for Harris over Trump (55% v. 43%). In contrast, Hispanic Protestants are more likely to report voting for Trump over Harris (64% v. 36%).
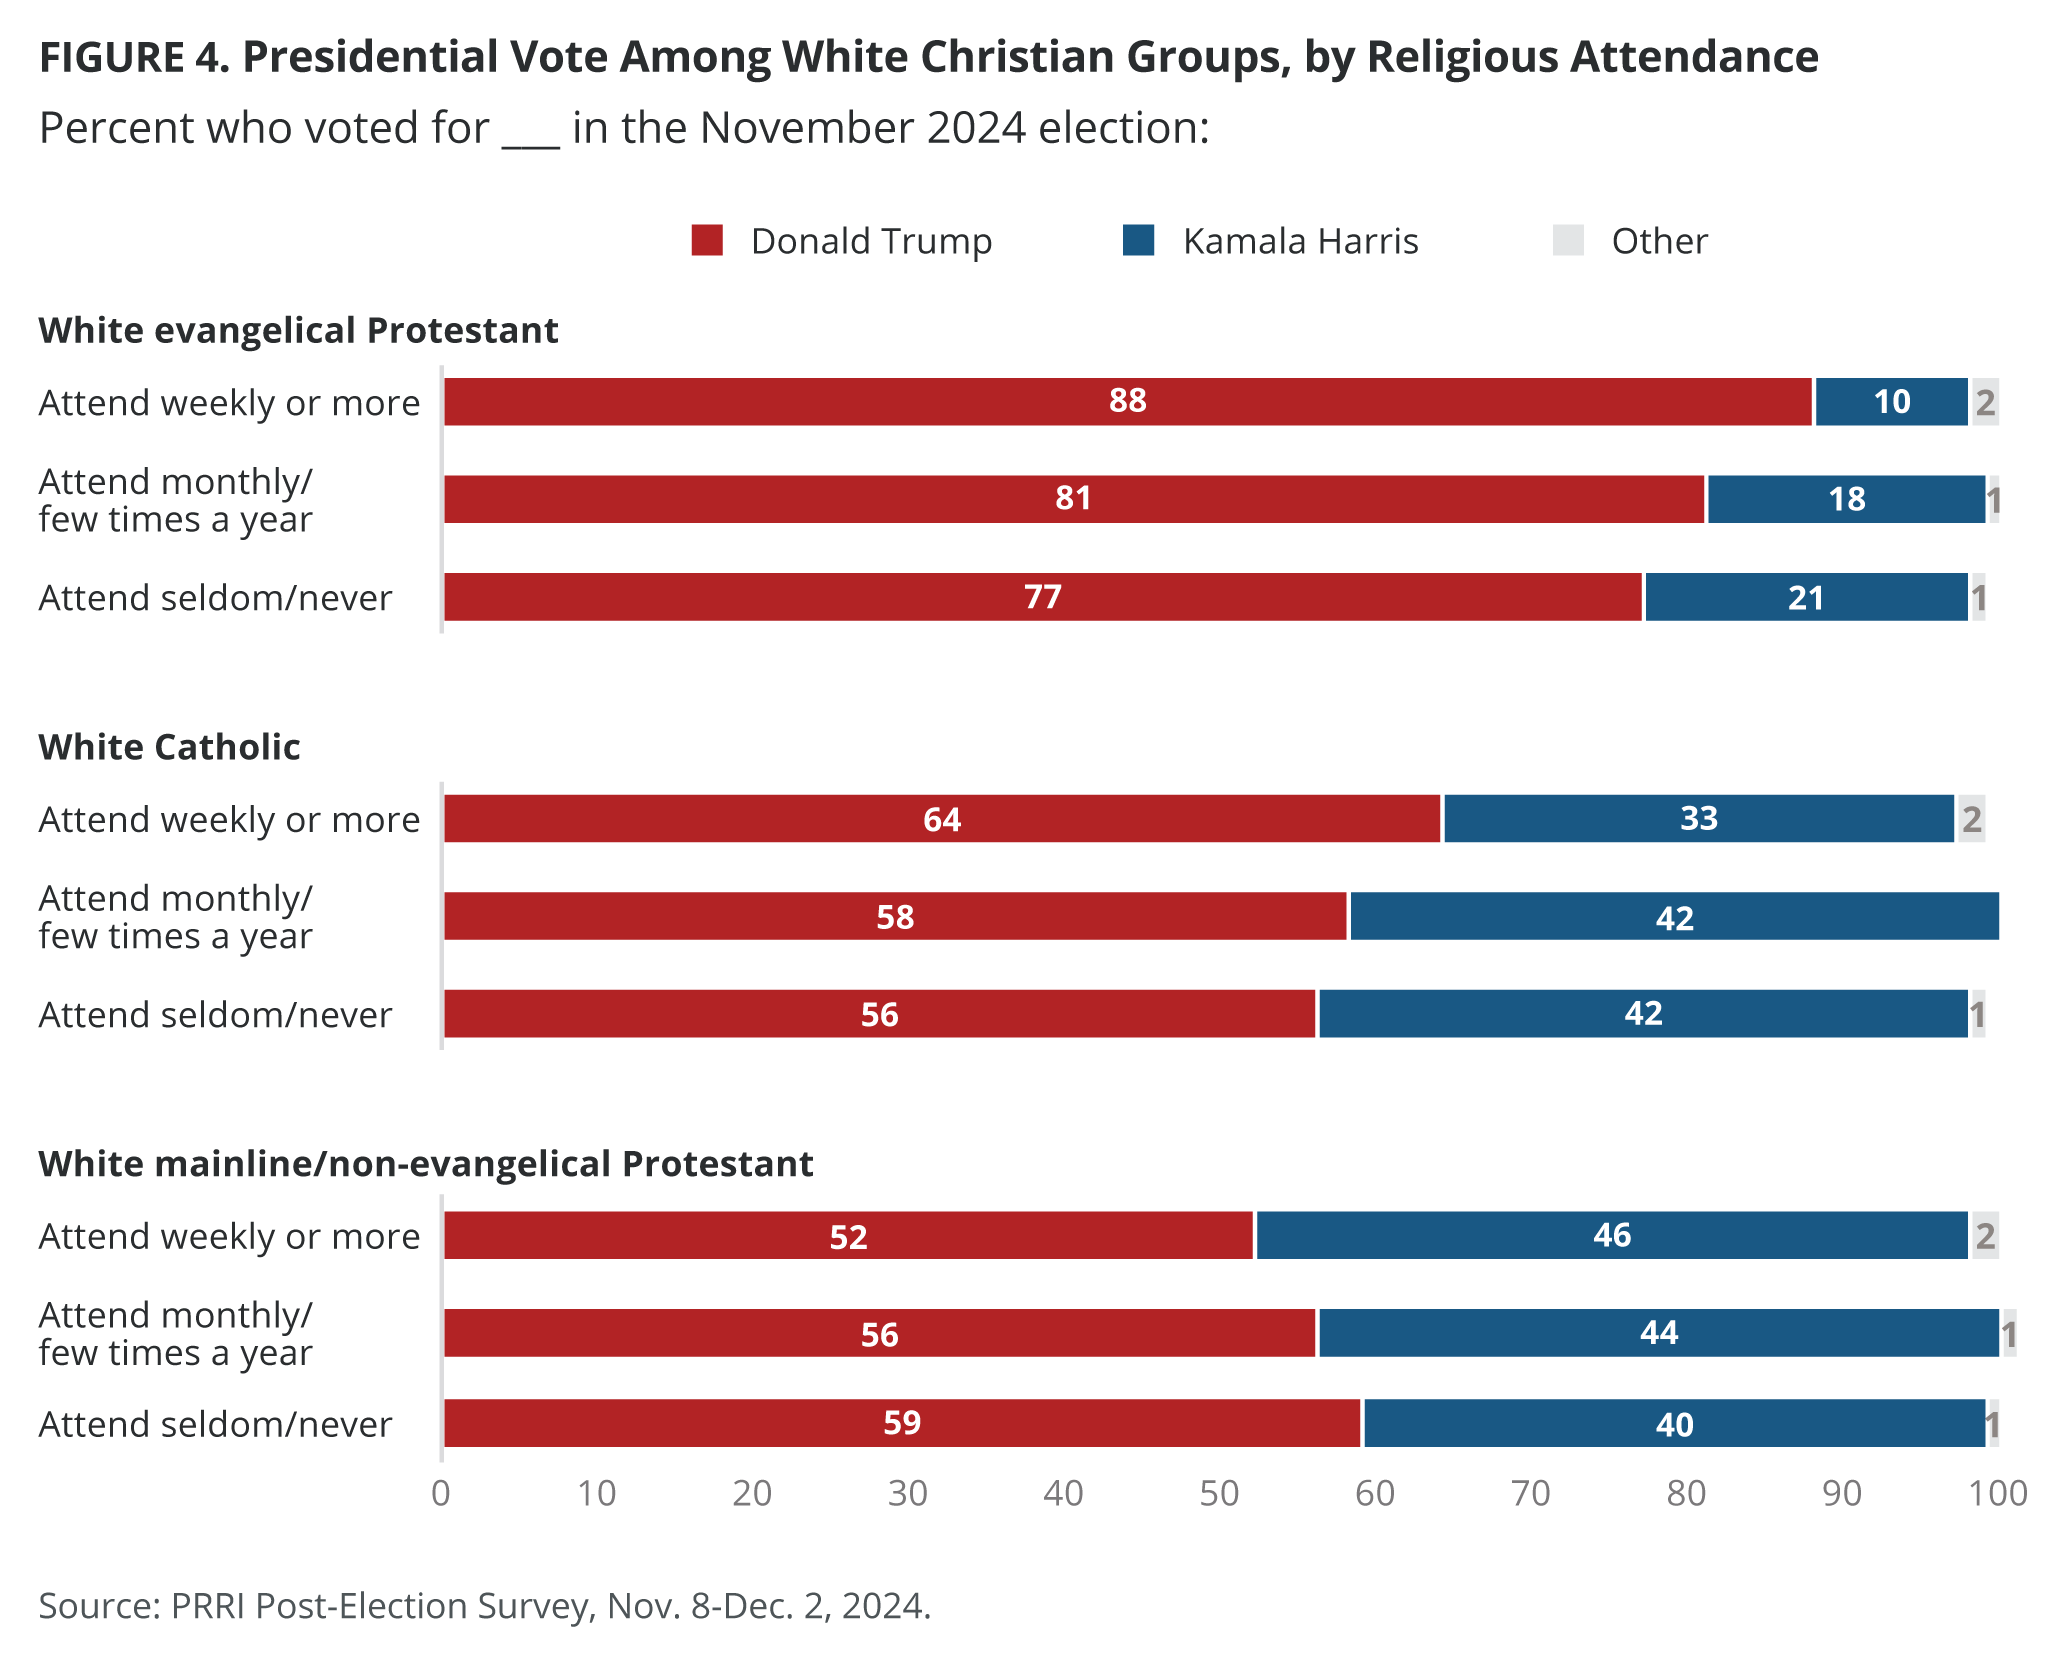
Among white evangelical Protestants and white Catholics, higher church attendance is correlated with higher support for Trump.
- While solid majorities of white evangelical Protestants overwhelmingly supported Trump across all levels of church attendance, weekly church attenders reported voting for Trump at significantly higher levels (88%) than those who seldom or never attend church (77%).
- White Catholics who attend church weekly report voting for Trump at higher levels (64%) than those who attend monthly (58%) or seldom/never (56%).
- The opposite pattern appears among white mainline/non-evangelical Protestants, however: those who attend weekly (52%) report voting for Trump at lower levels than those who attend church less often.
Responses to the 2024 Election Outcome
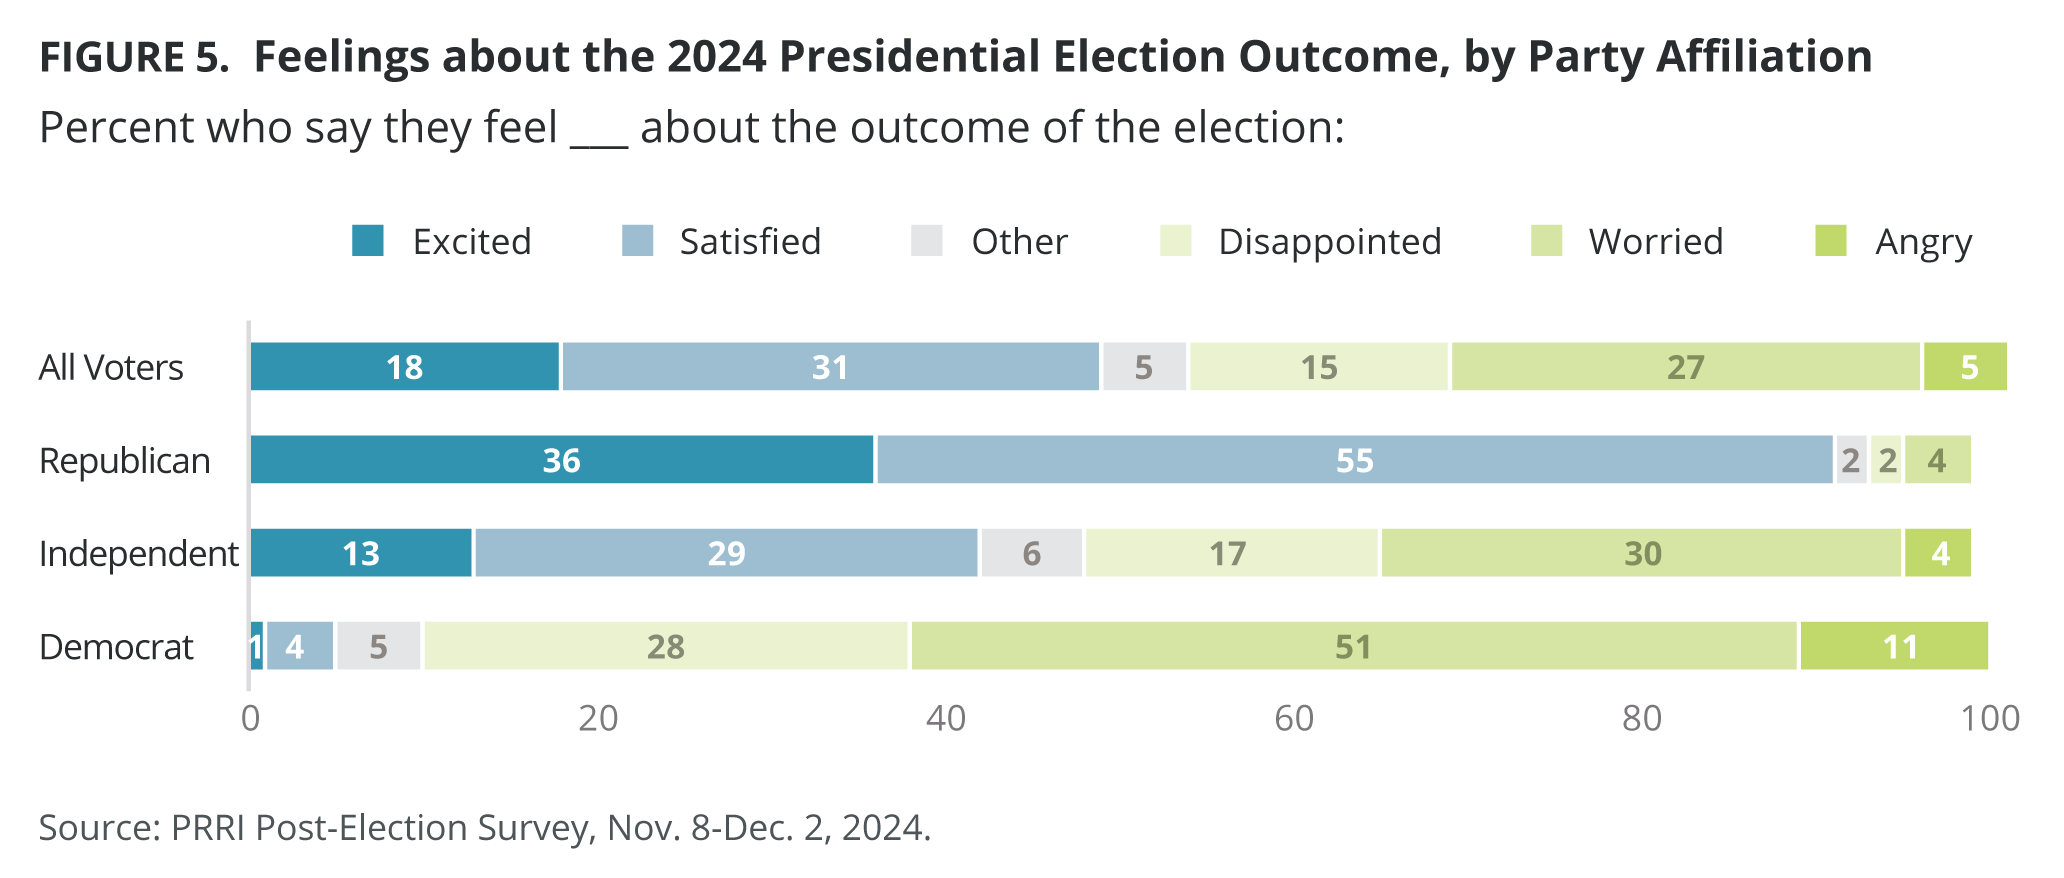
Republican voters express high levels of satisfaction and excitement with the outcome of the election, while Democrats express high levels of worry, disappointment, and anger. Independent voters display more mixed emotions about the election’s outcome.
- More than half of Republican voters (55%) express satisfaction with the election results; an additional 36% reported being very excited that Trump won.
- Around half of Democratic voters (51%) are worried about the election outcome, one in four Democratic voters (28%) are disappointed in the outcome, while one in ten (11%) are angry about the election outcome.
- The emotional response from independents toward the election outcome mirrors the national average, with roughly equal percentages reporting that they are either satisfied (29%) or worried (30%) about the election results.
The Influence of Christian Nationalism, Authoritarianism, and QAnon
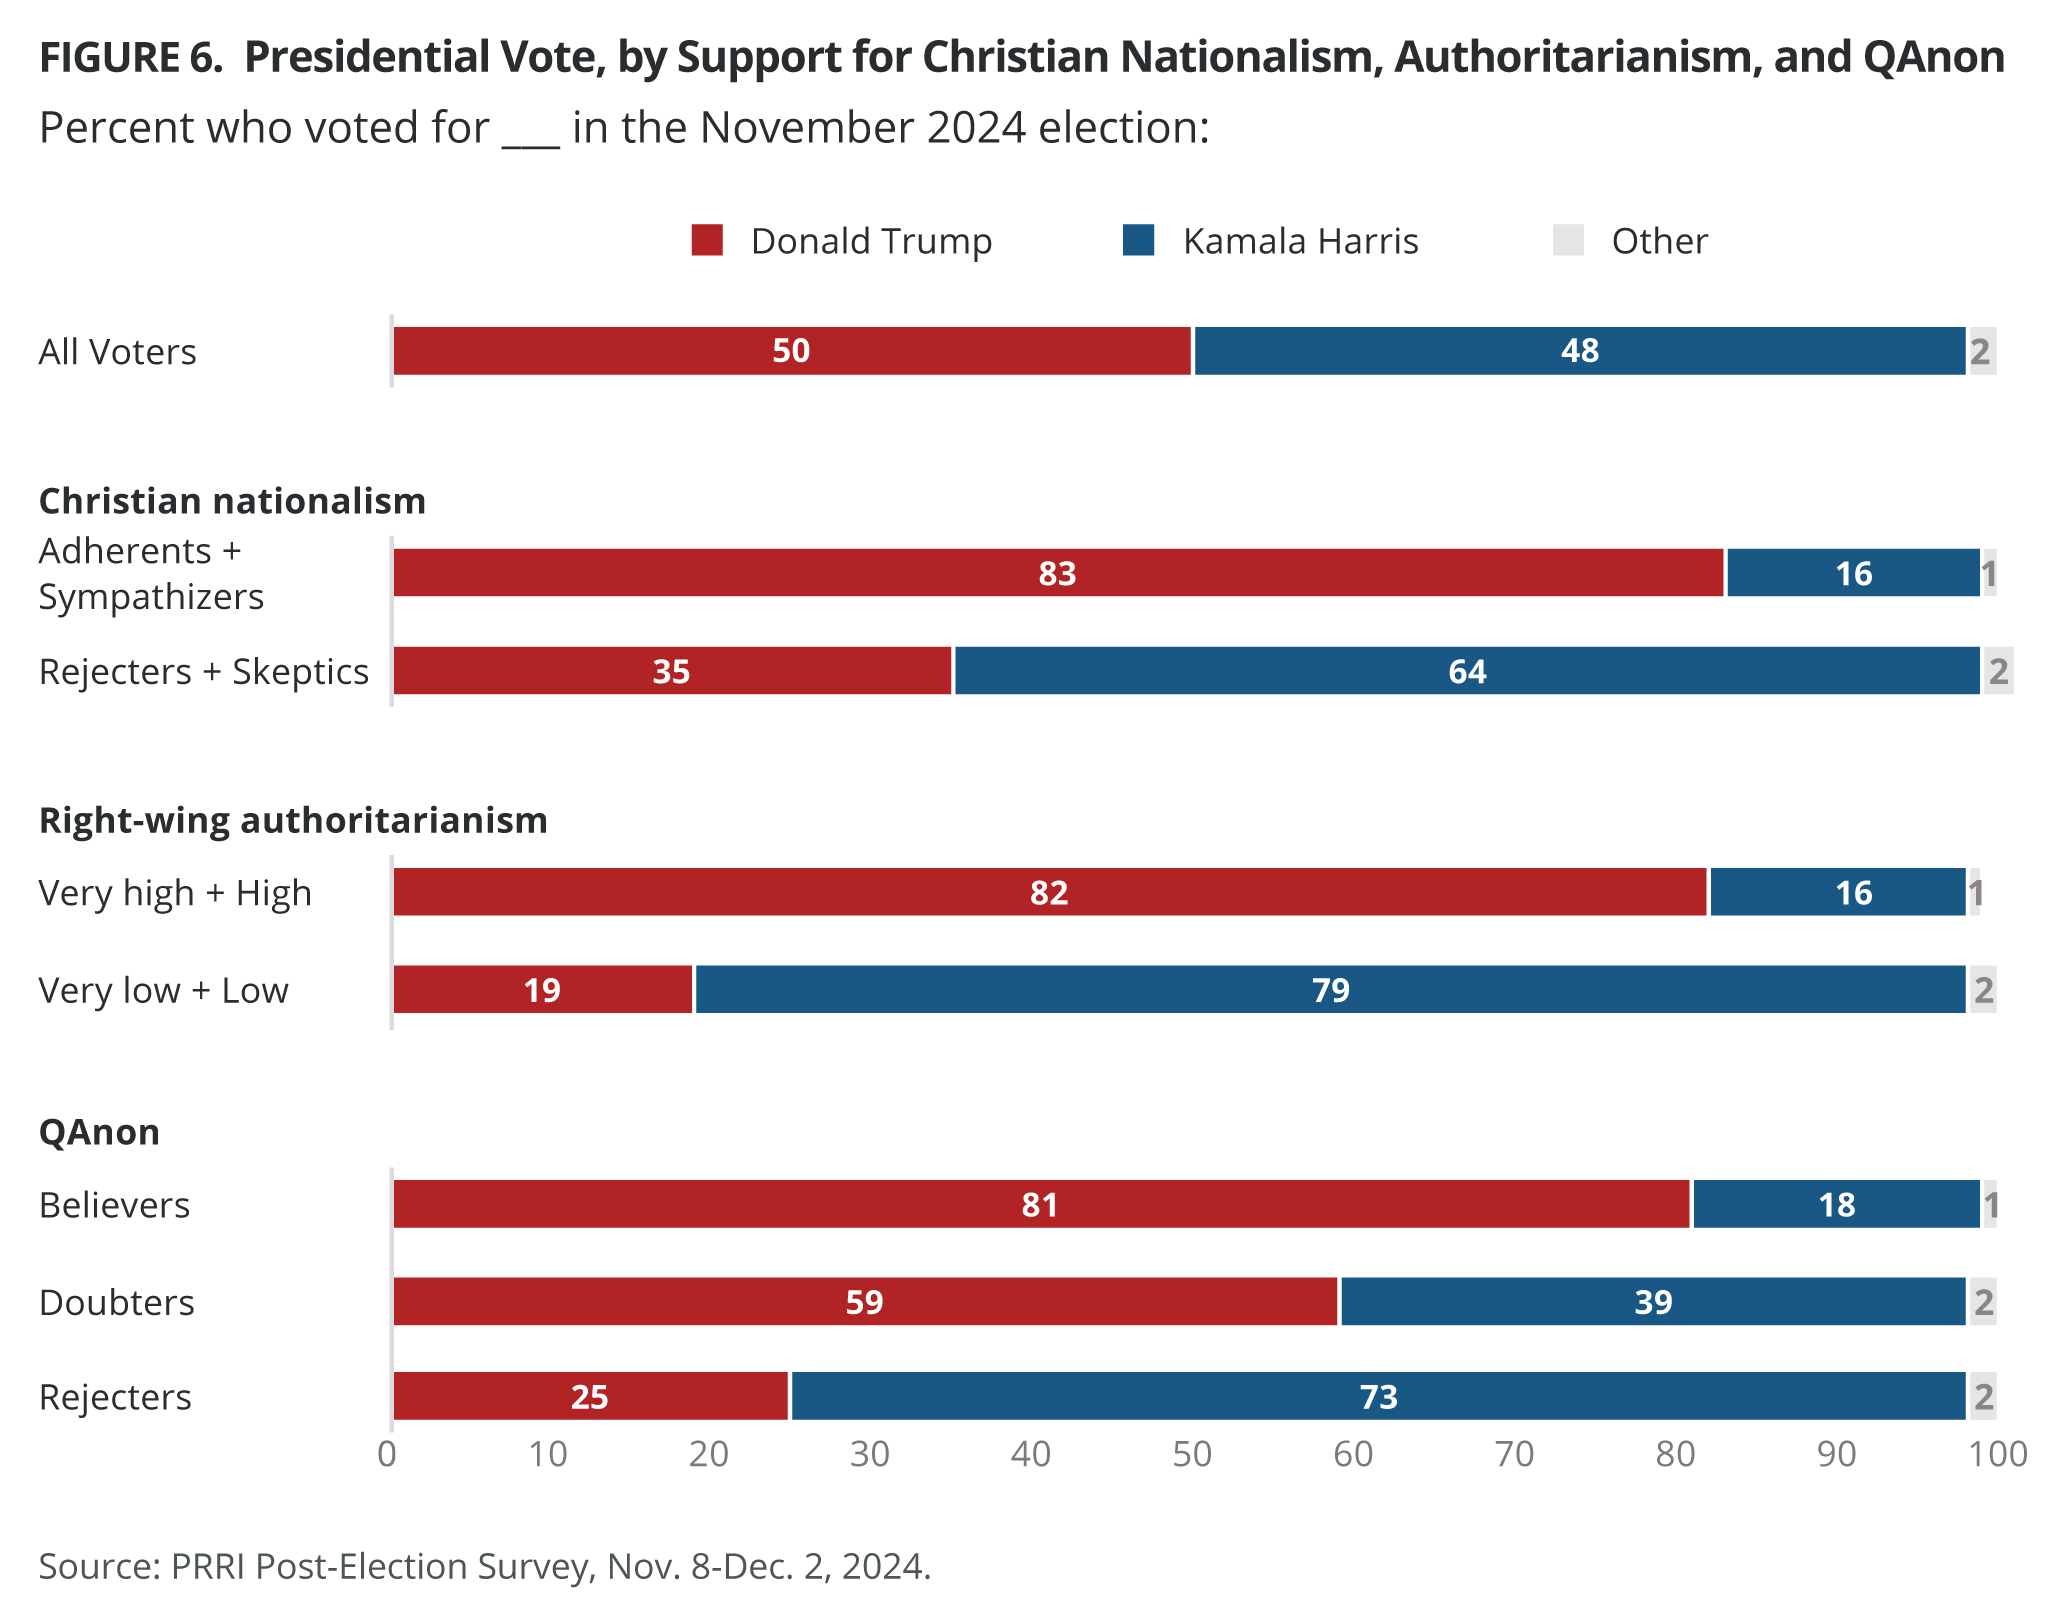
Views about Christian nationalism, authoritarianism, and QAnon conspiracy theories strongly divide Americans in their vote choice for president.
- A strong majority of Americans who qualify as Christian nationalism Adherents and Sympathizers report voting for Trump (83%), while almost two-thirds of Christian nationalism Rejecters and Skeptics (64%) report voting for Harris.[1]
- Voters who score very high or high on the Right-Wing Authoritarianism Scale (RWAS) report strongly supporting Trump (82%), while those voters who score very low or low overwhelmingly supported Harris (79%).[2]
- QAnon believers are far more likely to report voting for Trump (81%) while QAnon rejecters report voting for Harris (73%) at much higher numbers.[3]
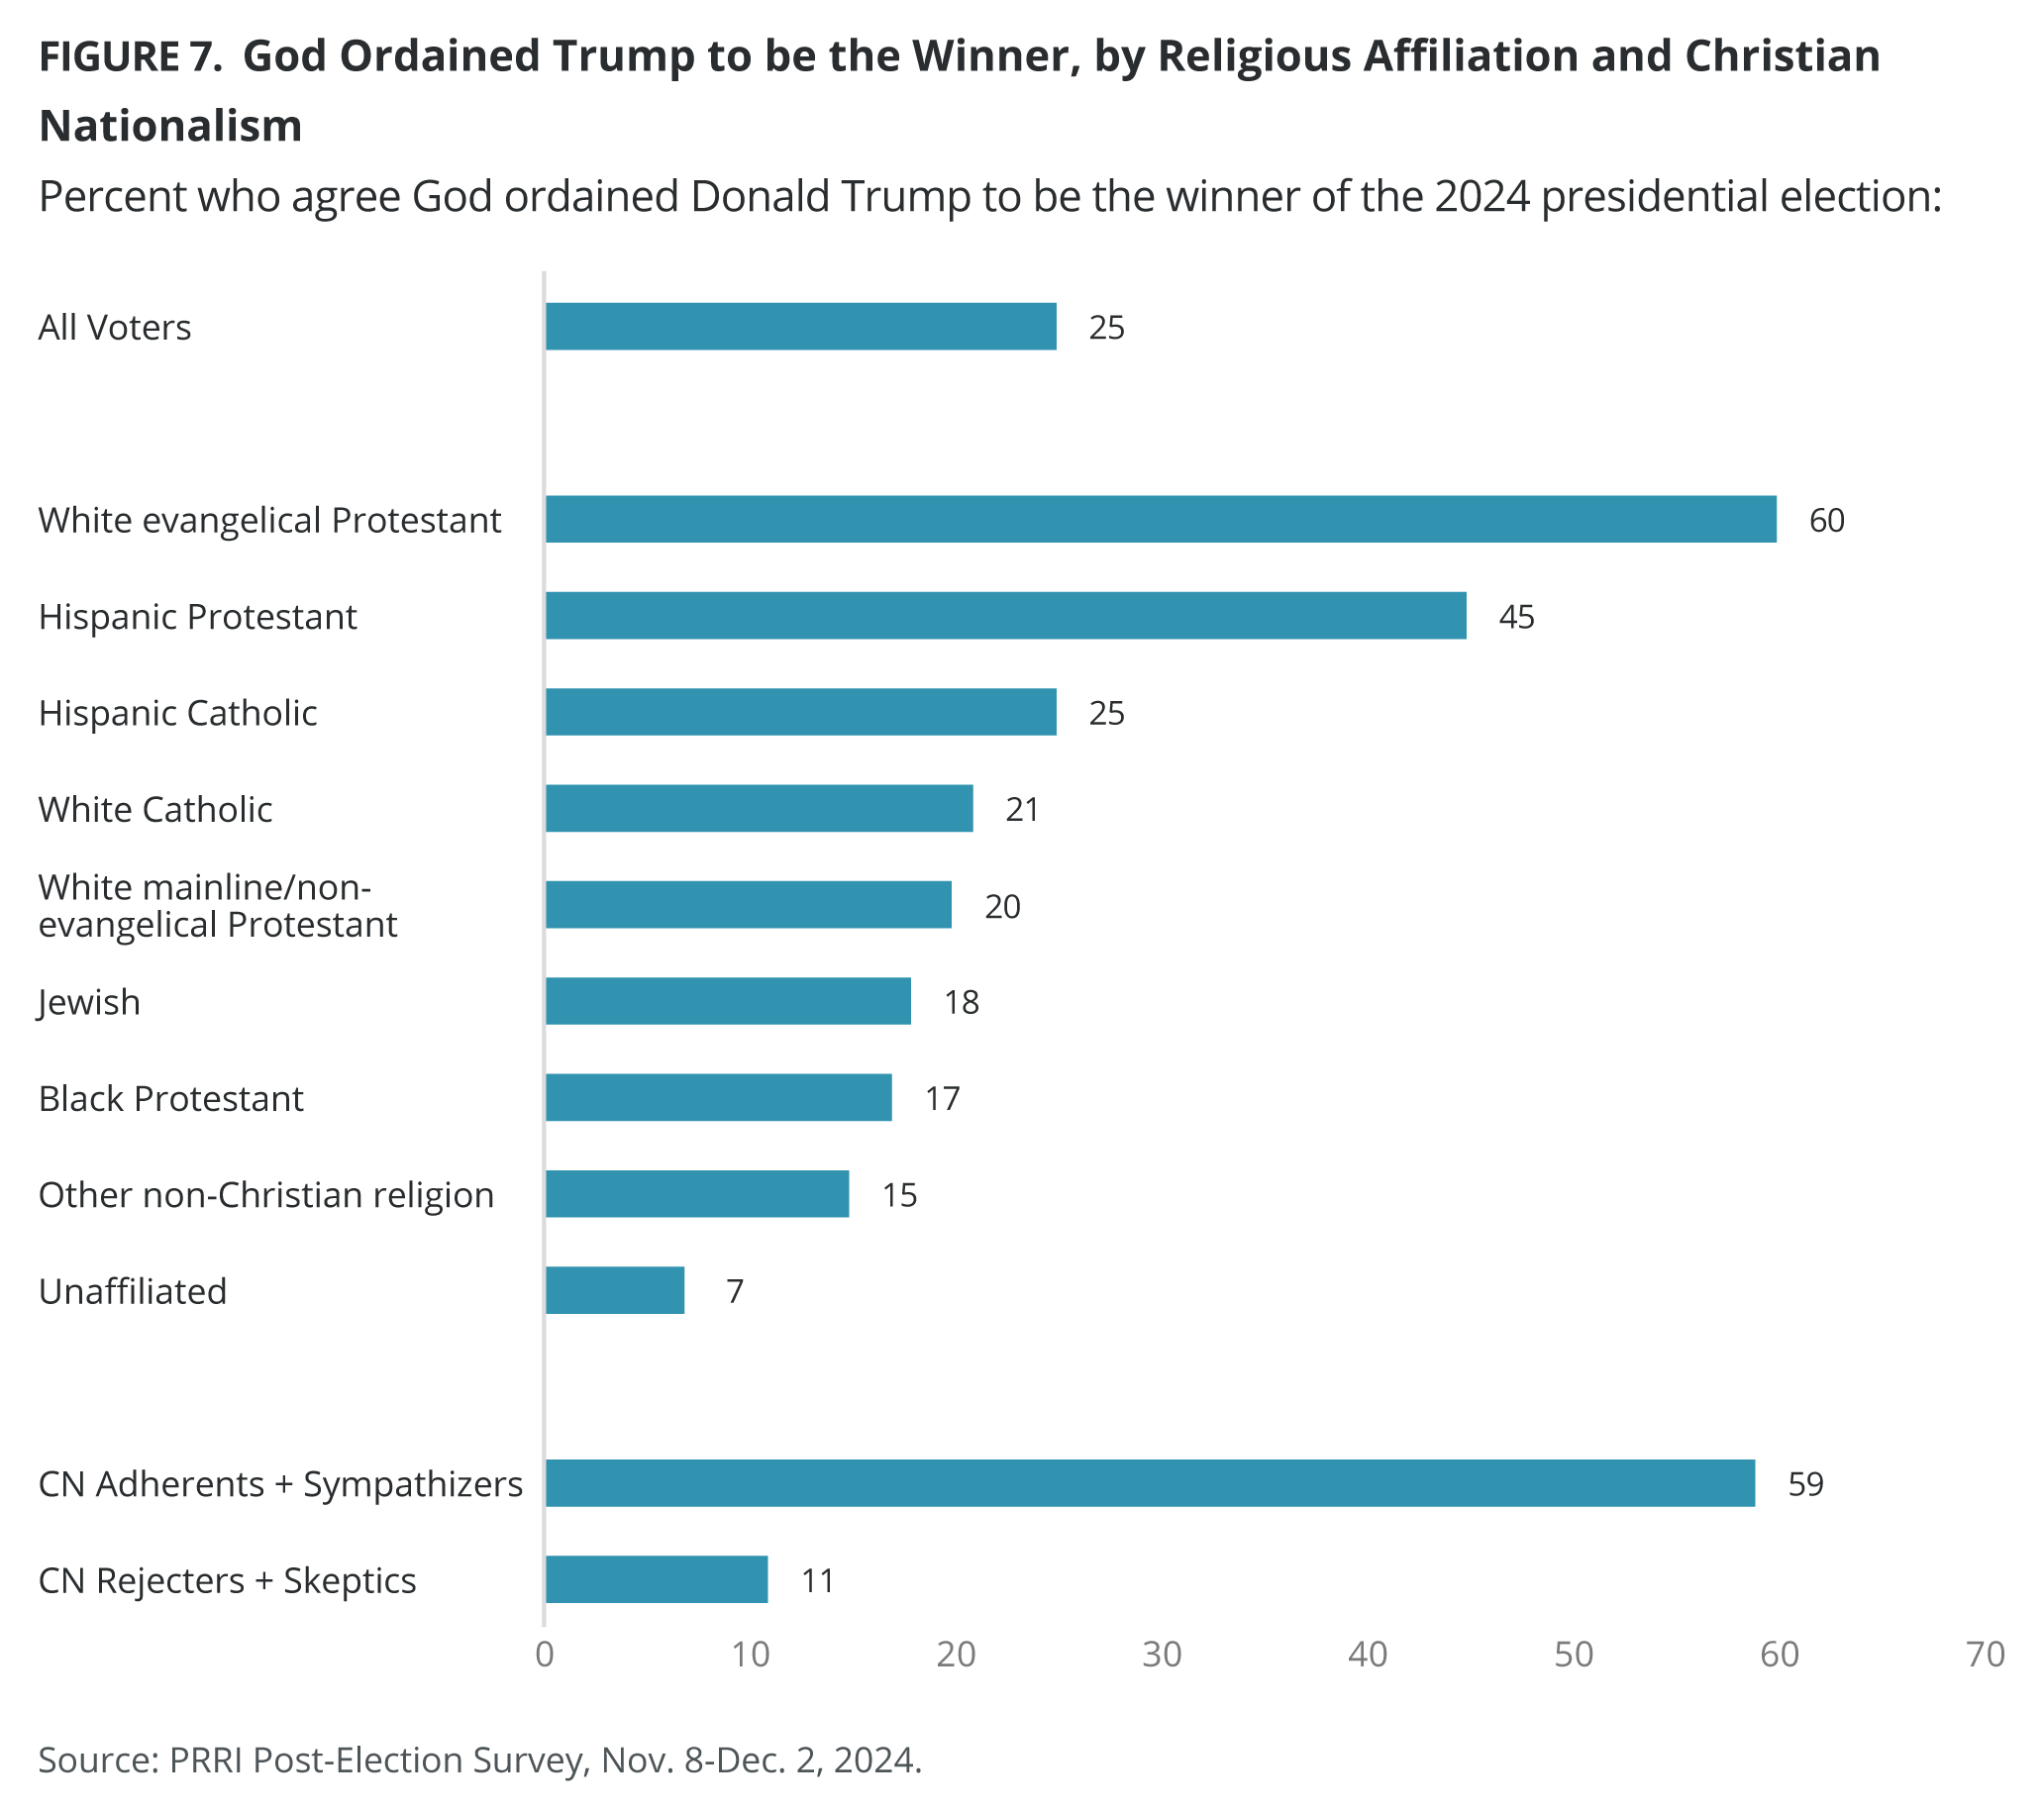
While few voters believe that God ordained Trump to be the winner of the election, belief in Trump’s divine endorsement is highest among white evangelical Protestants, Hispanic Protestants, and Americans who qualify as Christian nationalism Adherents and Sympathizers.
- Just one in four voters (25%) agree with the idea that “God ordained Donald Trump to be the winner of the 2024 presidential election.”
- White evangelical Protestants (60%) are the religious voters most likely to agree that Trump was divinely ordained to win, followed by Hispanic Protestants (45%).
- Few Hispanic Catholics (25%), white Catholics (21%), or white mainline/non-evangelical Protestant voters (20%) agree that God ordained Trump to win; Jewish (18%), Black Protestant (17%), other non-Christian (15%), and unaffiliated (7%) voters are notably less likely to agree.
- Voters who qualify as Christian nationalism Adherents and Sympathizers (59%) are five times as likely as Christian nationalism Rejecters and Skeptics (11%) to agree that God ordained Trump to win.
Confidence in Elections and Democracy
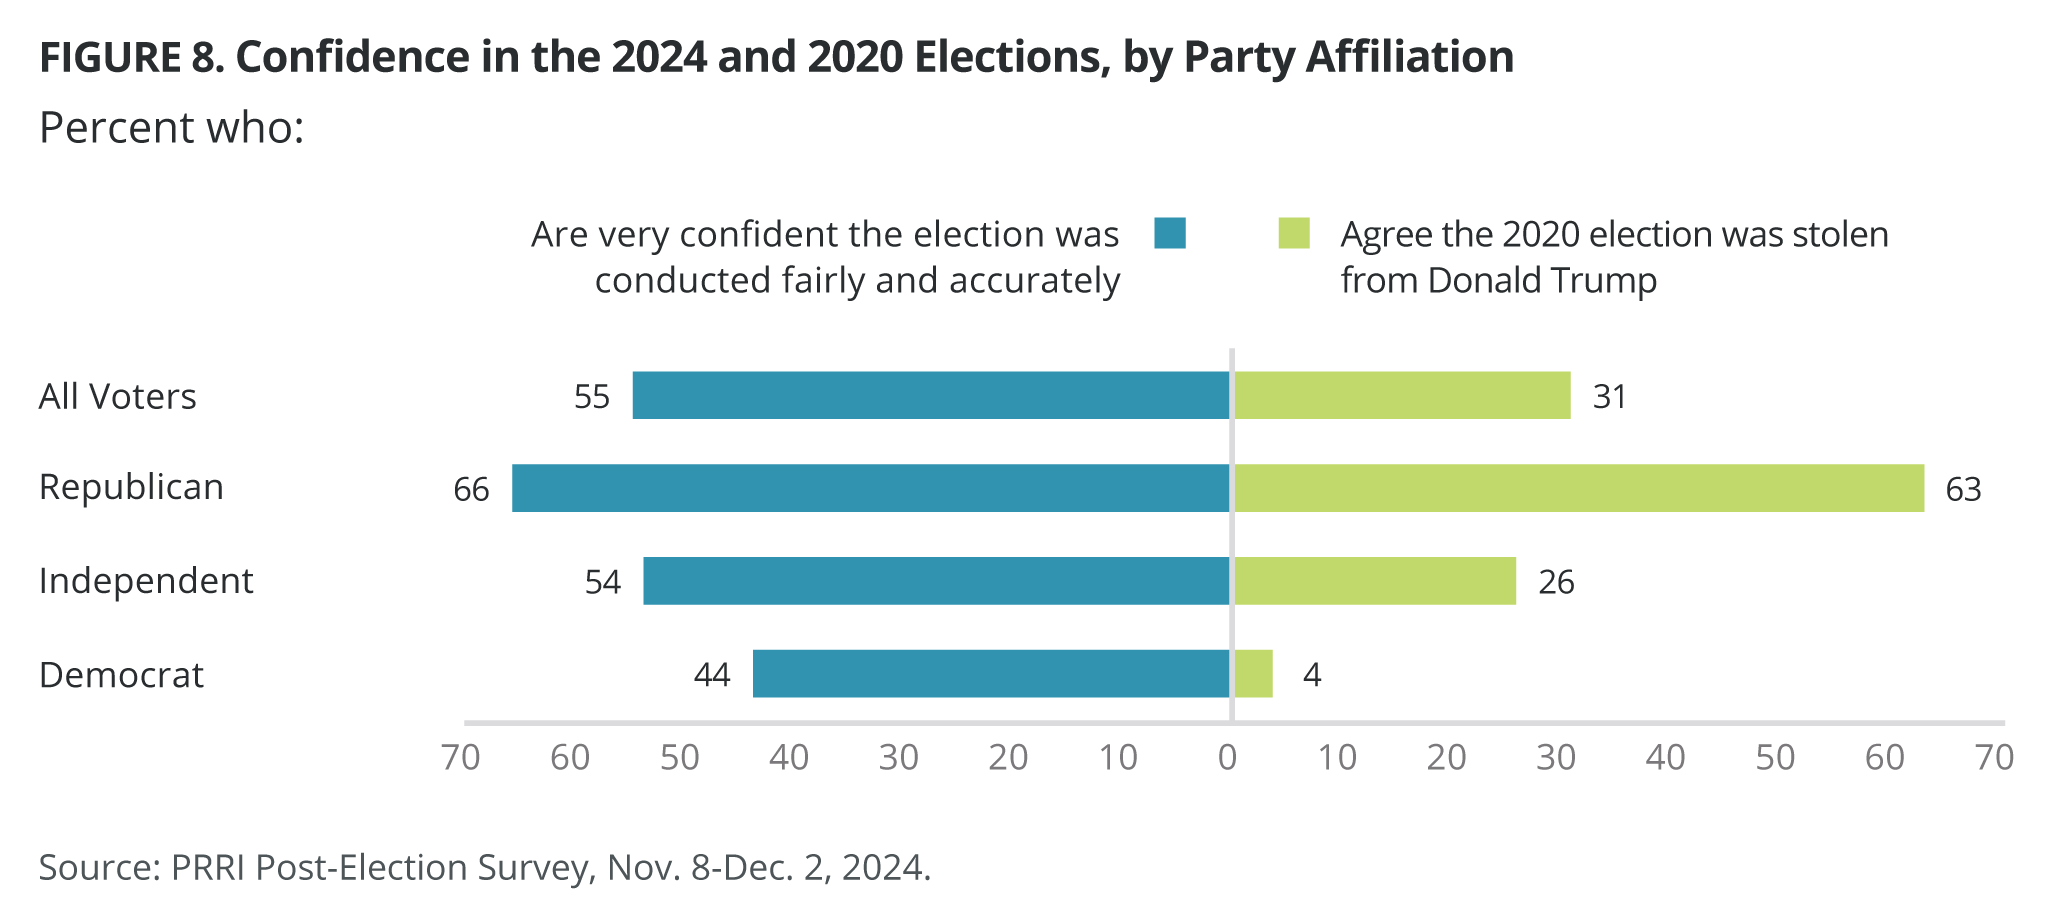
Republican voters are far more likely than Democratic voters to report high levels of confidence that the 2024 presidential election was conducted fairly and accurately; at the same time, most Republican voters continue to believe the false claim that the 2020 election was stolen from Trump.
- A majority of American voters (55%) are very confident the 2024 election was conducted fairly and accurately, compared with three in ten voters who agree that the 2020 election was stolen from Donald Trump (31%).
- Confidence in the fairness and accuracy of the 2024 election is much higher among Republican voters (66%) compared with Democratic voters (44%).
- At the same time, Republican voters continue to believe the election was stolen in 2020 (63%) — a view that Democrats almost unanimously reject (4%).
- Independent voters are closer to the national average in expressing both confidence in this year’s election (54%) and agreement with the false 2020 “stolen election” narrative (26%).
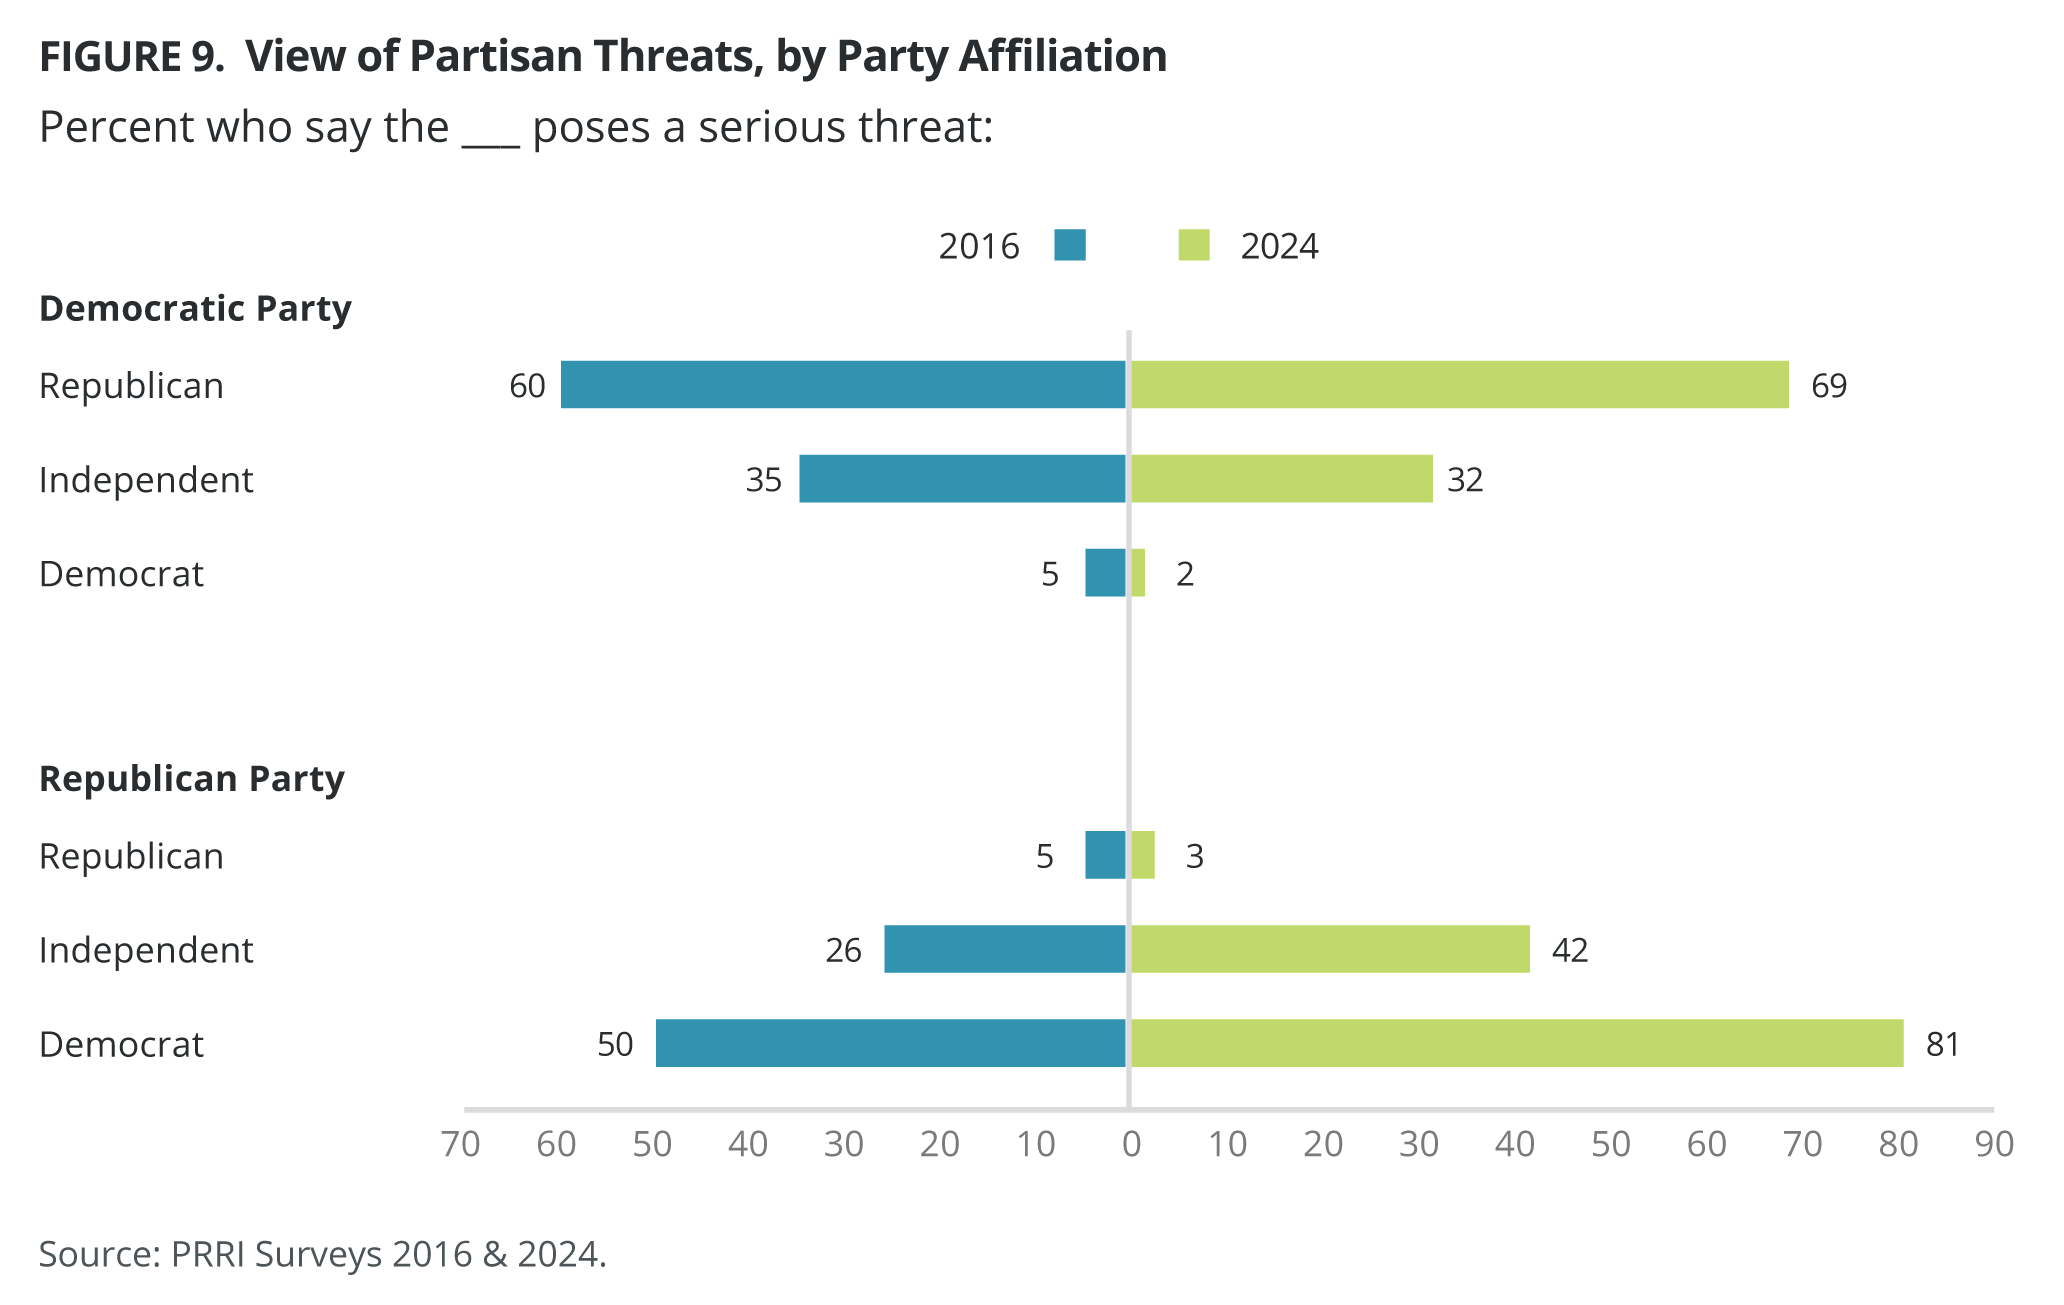
Compared with 2016, partisan polarization has intensified, with partisans increasingly likely to view the opposing party as a serious threat. While independent voters remain relatively stable in their views of the Democratic Party since 2016, they show growing concern about the Republican Party as a threat.
- Republican voters are more likely to see the Democratic Party as a serious threat to the country today than they did when Trump first ran for office (60% in 2016 vs. 69% in 2024); however, the perception among Democrats that the Republican Party poses a serious threat has increased at a much higher rate in that same time (50% in 2016 vs. 81% in 2024).
- While roughly one-third of independent voters continue to say the Democratic Party poses a serious threat today compared with 2016, they show a significant increase in concern about the threat posed by the Republican Party, up from 26% in 2016 to 42% in 2024.
- Both Democratic and Republican voters have shown a decline in seeing their own party as a threat since 2016, suggesting stronger alignment within each party.
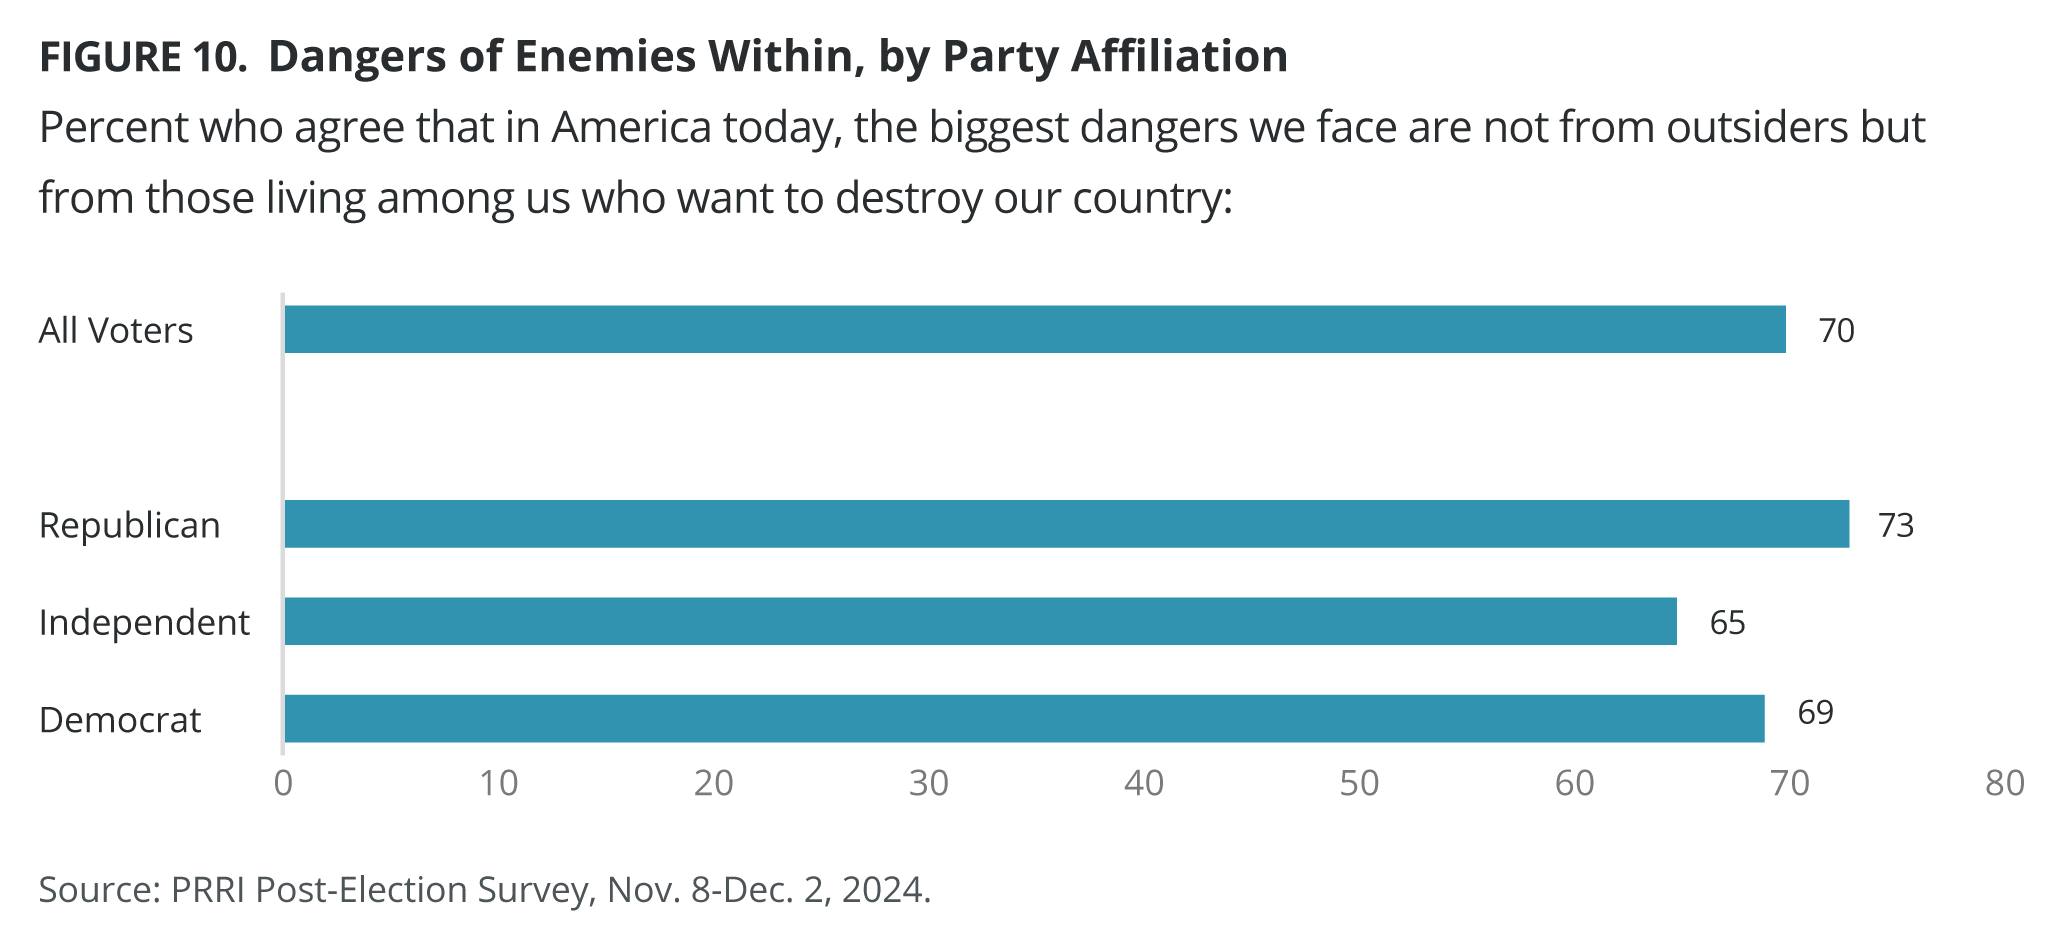
Strong majorities of both Republicans and Democrats believe that internal threats pose bigger threats to our nation than outsiders.
- Seven in ten American voters (70%) agree that “In America today, the biggest dangers we face are not from outsiders, but from those living among us who want to destroy our country.”
- Strong majorities of Republican voters (73%), Democratic voters (69%), and independent voters (65%) share this sentiment.
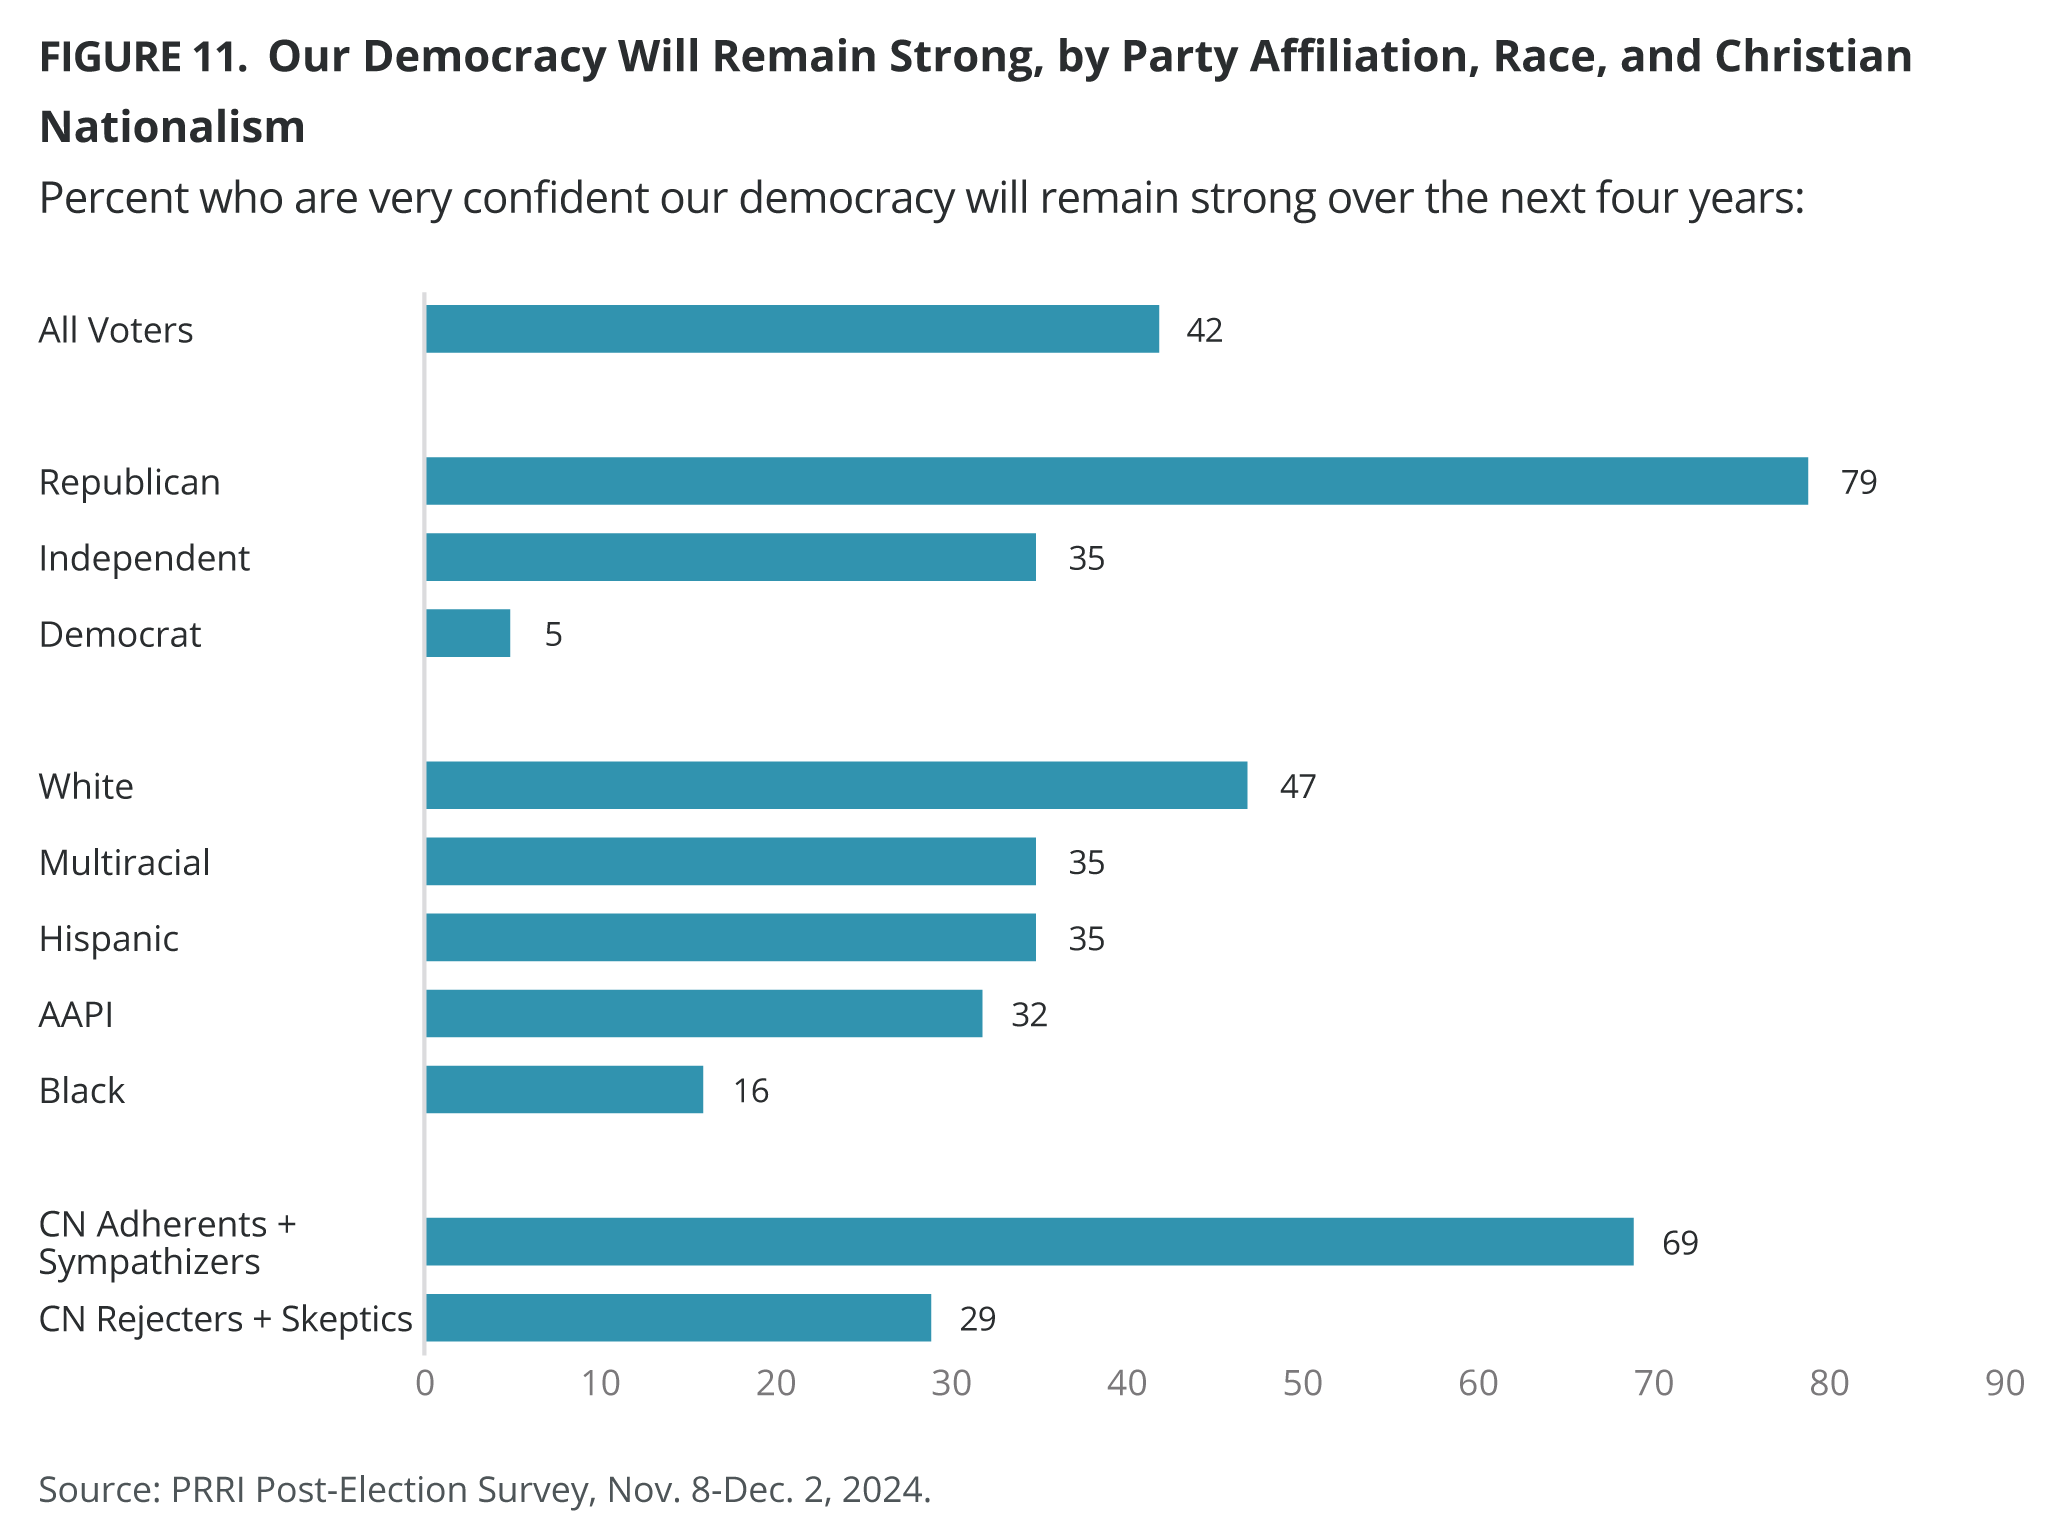
Looking ahead, confidence that our democracy will remain strong in the next four years varies sharply across political, racial, and ideological lines.
- While about four in ten American voters (42%) are very confident that democracy will remain strong over the next four years, partisan differences are stark: most Republican voters (79%) are very confident in democracy, compared with roughly one-third of independent voters (35%), and just 5% of Democrats.
- White voters remain the most confident in the strength of our democracy (47%), compared with about one-third of multiracial (35%), Hispanic (35%), and AAPI (32%) voters. Black voters (16%) are the least optimistic about the strength of our democracy in the next four years.
- Christian nationalism Adherents and Sympathizers are far more confident in democracy (69%) than Rejecters and Skeptics (29%).
What the Future Holds
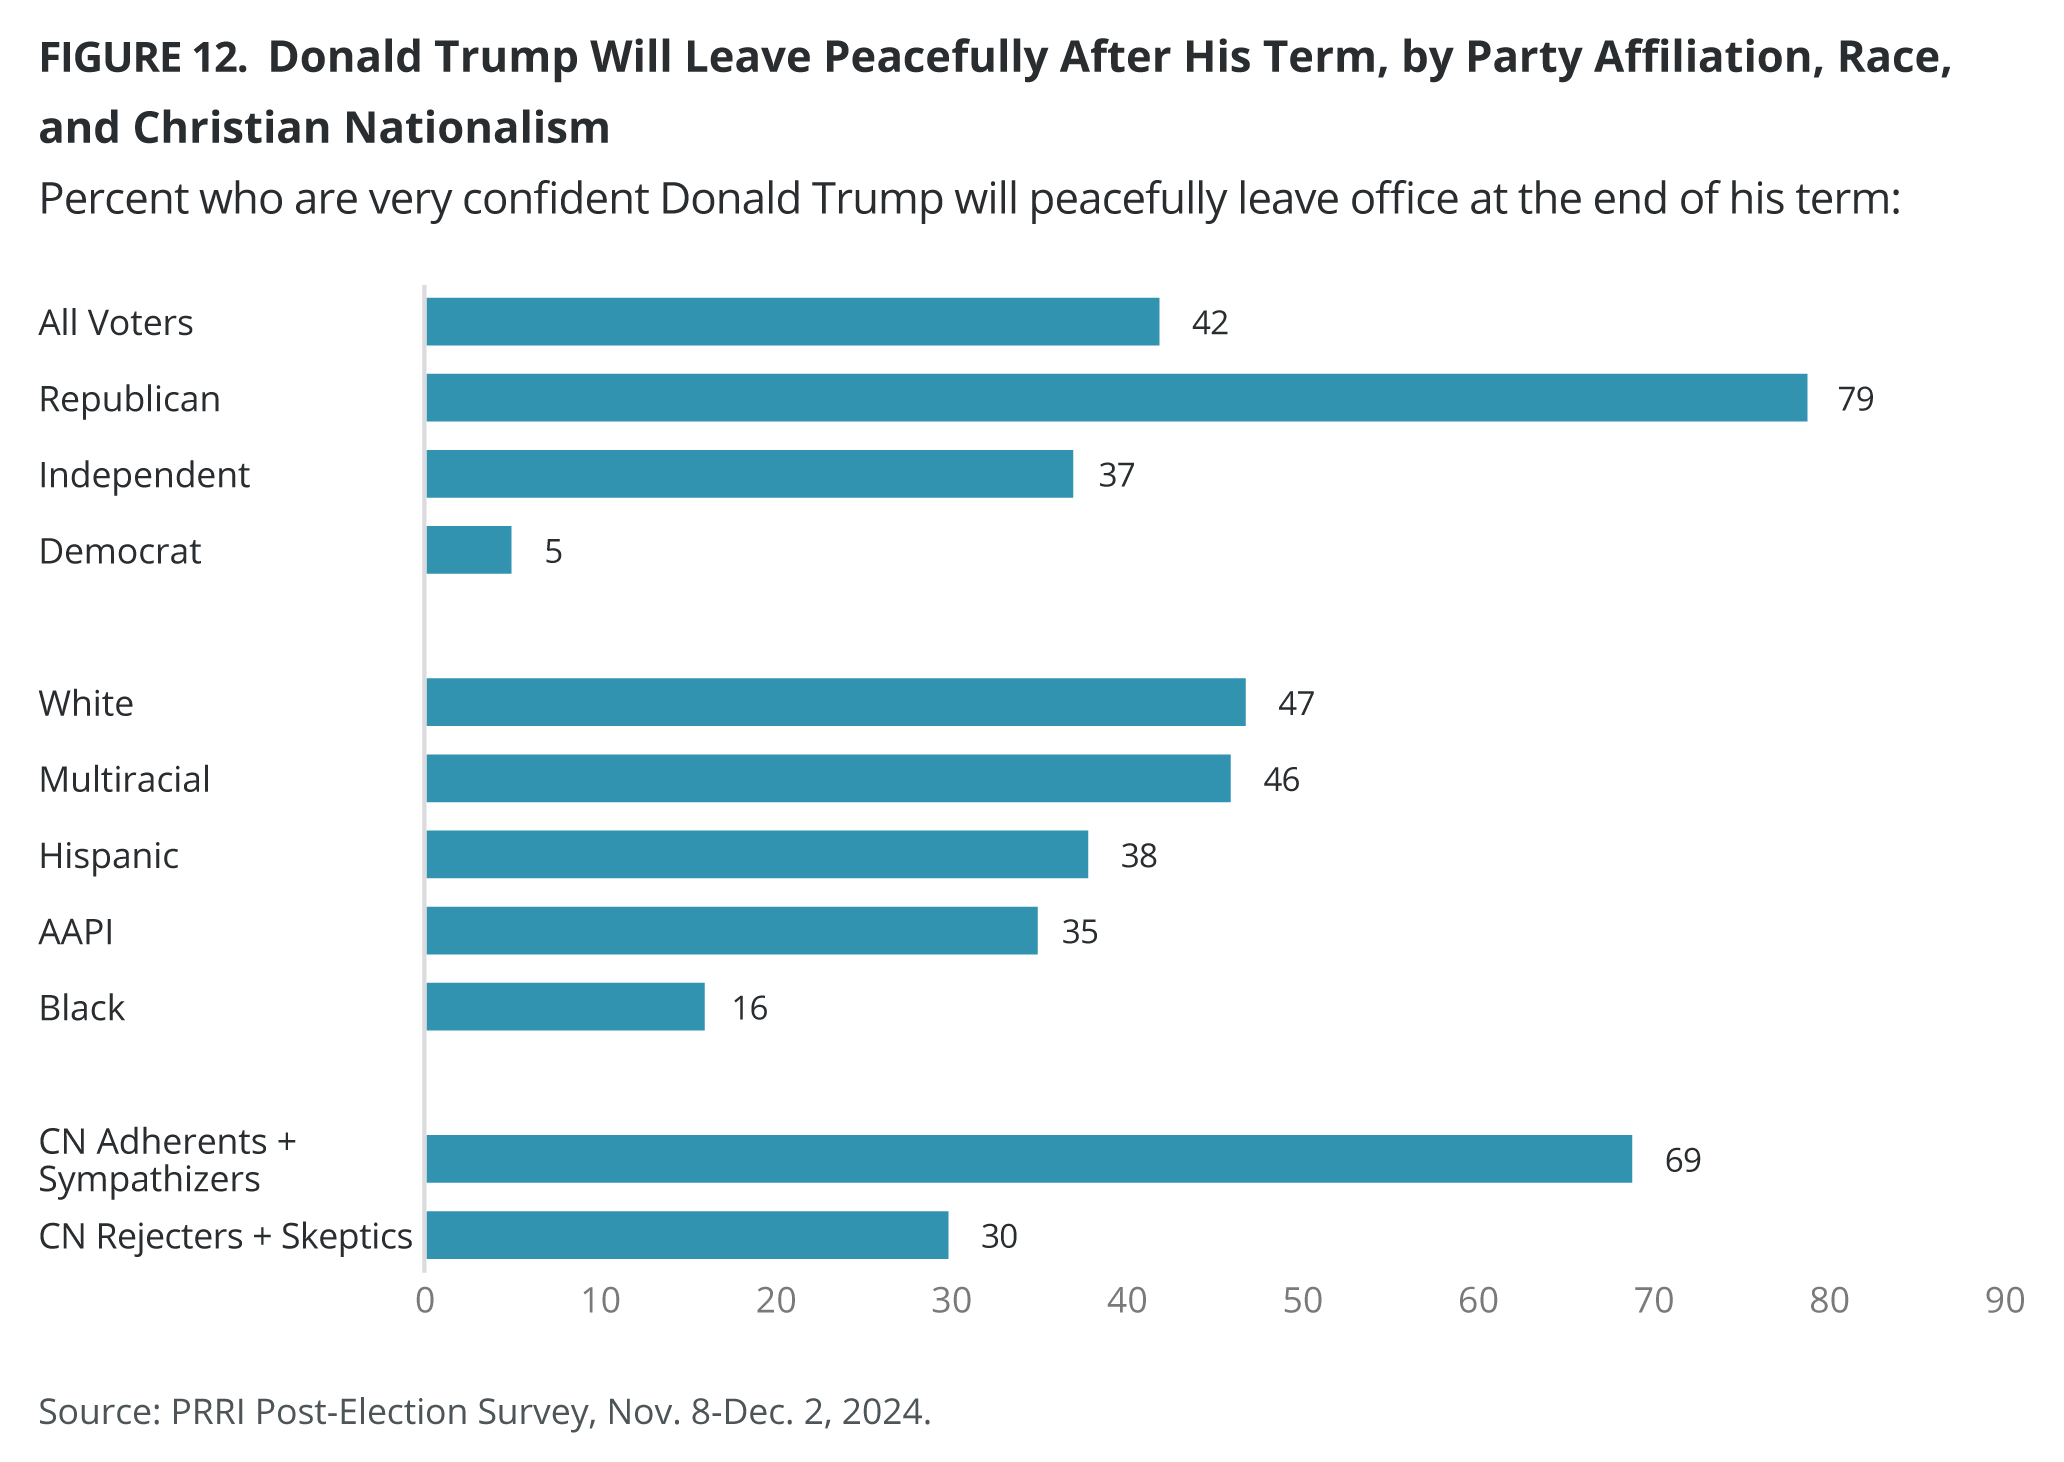
Partisanship, race, and Christian nationalist views strongly shape Americans’ confidence that Donald Trump will peacefully leave office at the end of his term.
- About four in ten American voters (42%) are very confident that Donald Trump will peacefully leave office at the end of this term.
- Most Republican voters (79%) are very confident that Trump will peacefully leave office, compared with 37% of independent voters and just 5% of Democratic voters.
- About half of white (47%) and multiracial (46%) voters are confident that Trump will peacefully leave office at the end of his term, compared with over one-third of Hispanic (38%) and AAPI (35%) voters and only 16% of Black voters.
- Christian nationalism Adherents and Sympathizers (69%) are more than twice as likely as Christian nationalism Rejecters and Skeptics (30%) to express confidence that Trump will peacefully leave office.
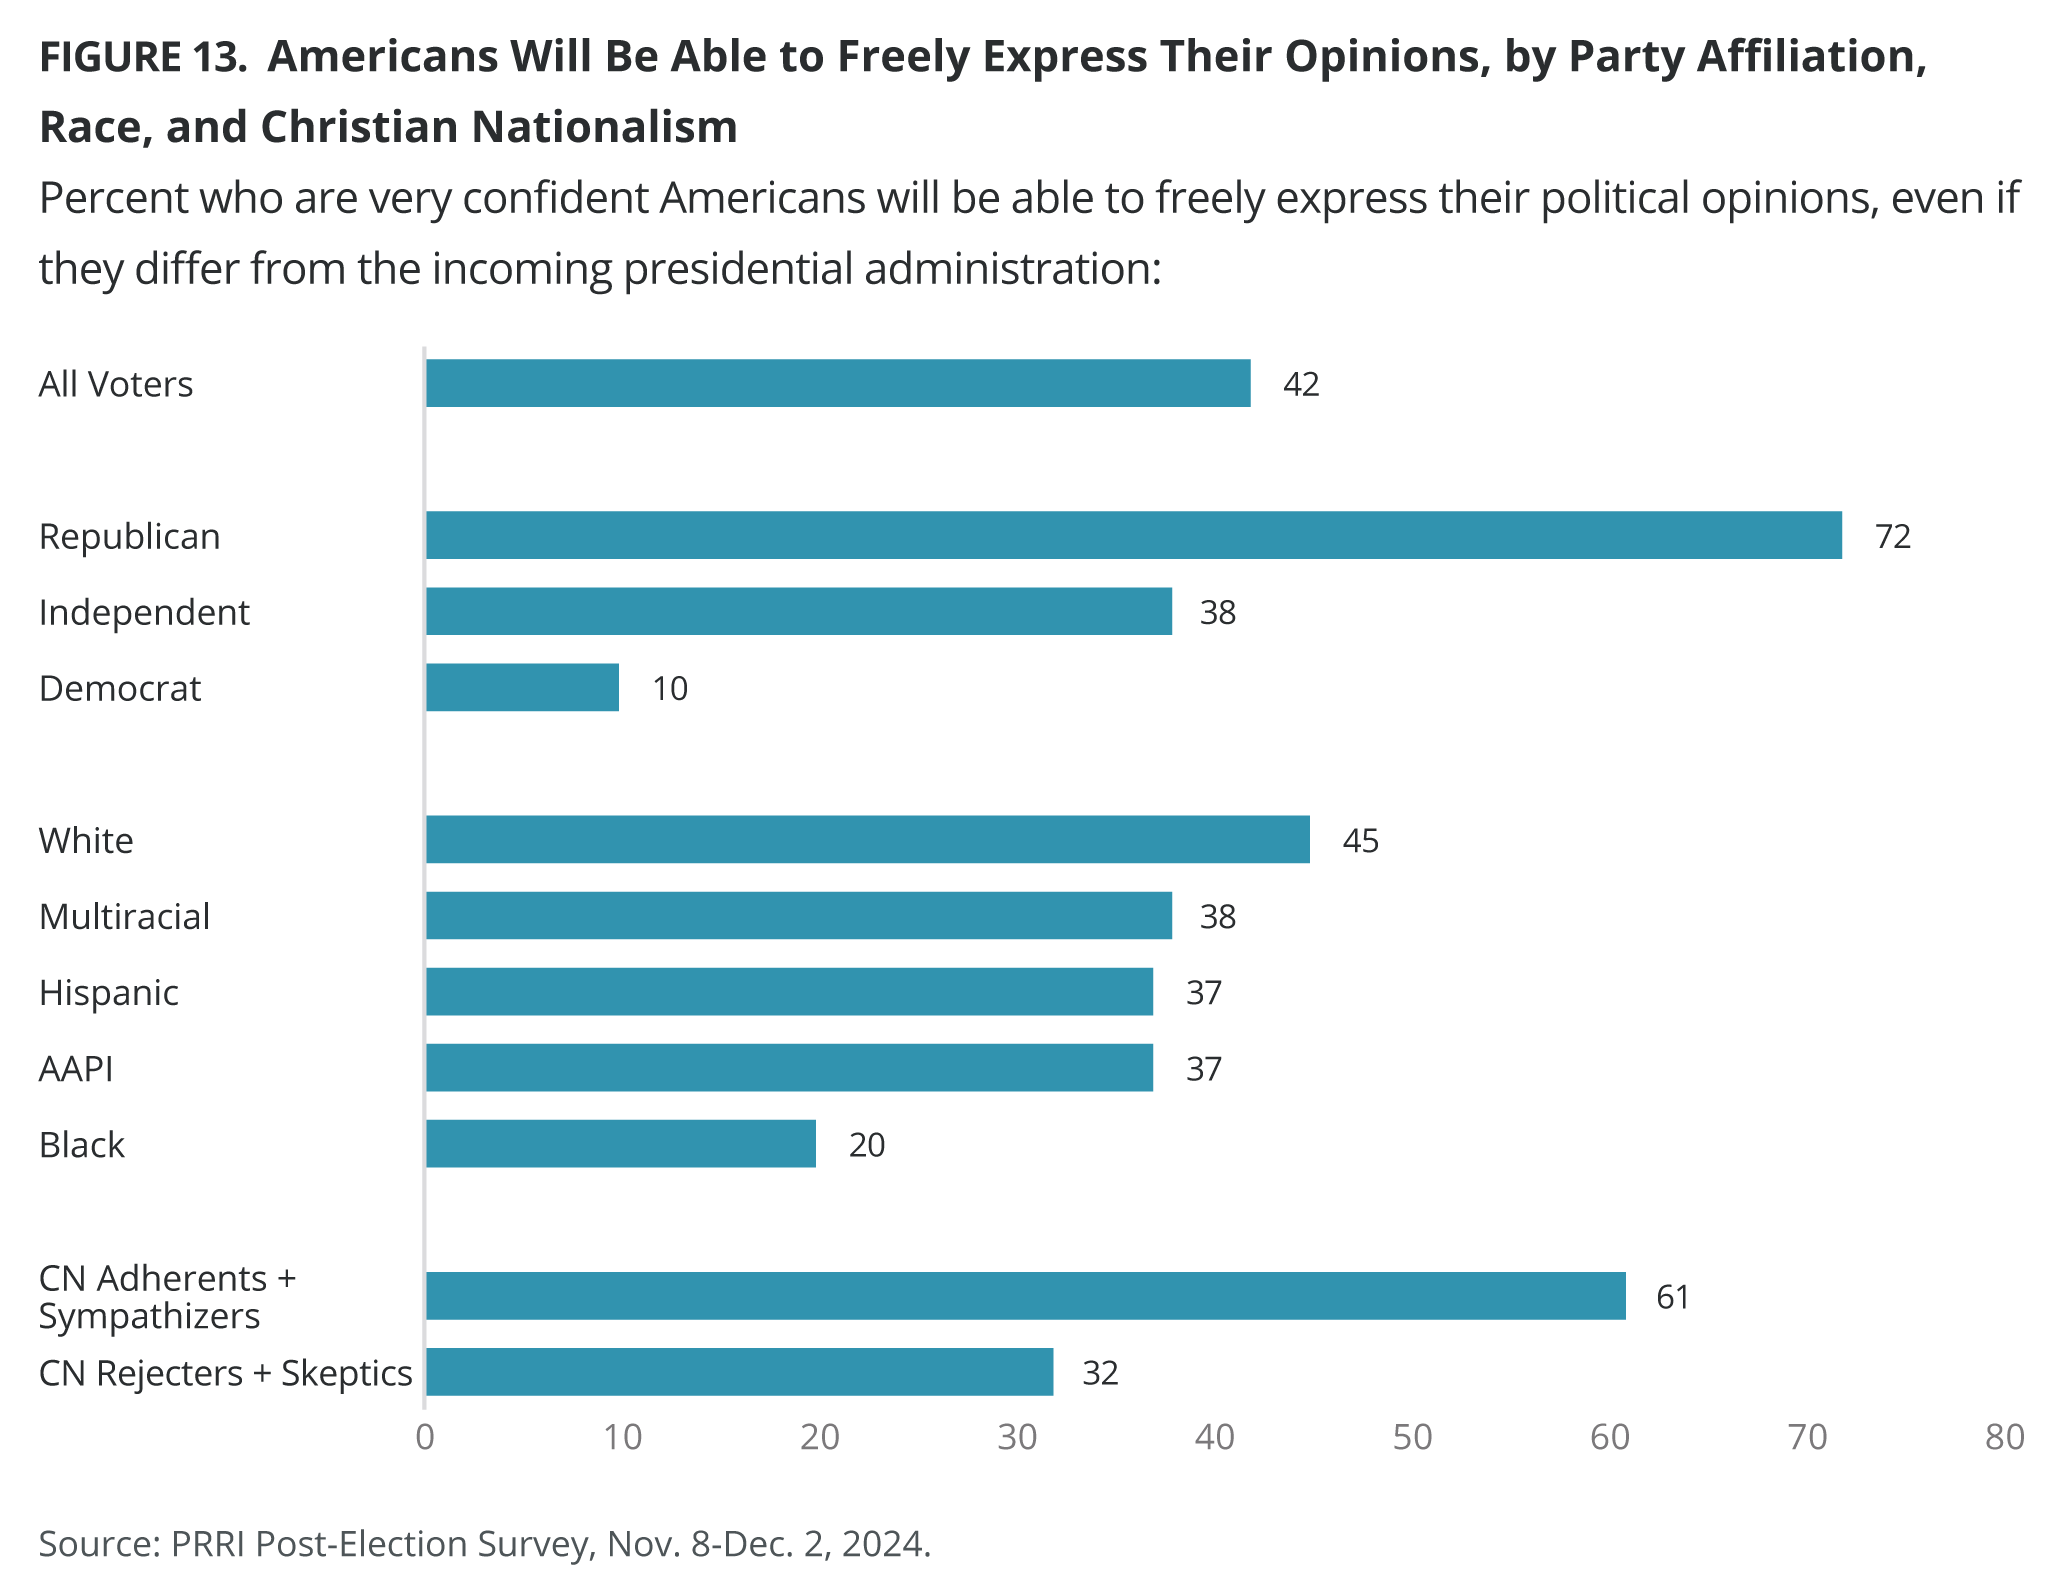
Confidence in free political expression in the wake of a new presidential administration is highest among Republicans, white voters, and Christian nationalism Adherents and Sympathizers, while Democrats, Black voters, and Christian nationalism Rejecters and Skeptics show the most pessimism.
- About four in ten American voters (42%) are very confident that Americans will be able to freely express their political opinions, even if they differ from the incoming presidential administration.
- Most Republican voters (72%) are very confident that Americans will be able to freely express their political opinions, compared with 38% of independent voters and 10% of Democratic voters.
- White voters (45%) are the most likely to express confidence in the ability to freely express political opinions, while Black voters (20%) are the least confident.
- Christian nationalism Adherent and Sympathizer voters (61%) are about twice as likely as Christian nationalism Rejecter and Skeptic voters (32%) to express confidence in their ability to freely express their political opinions.
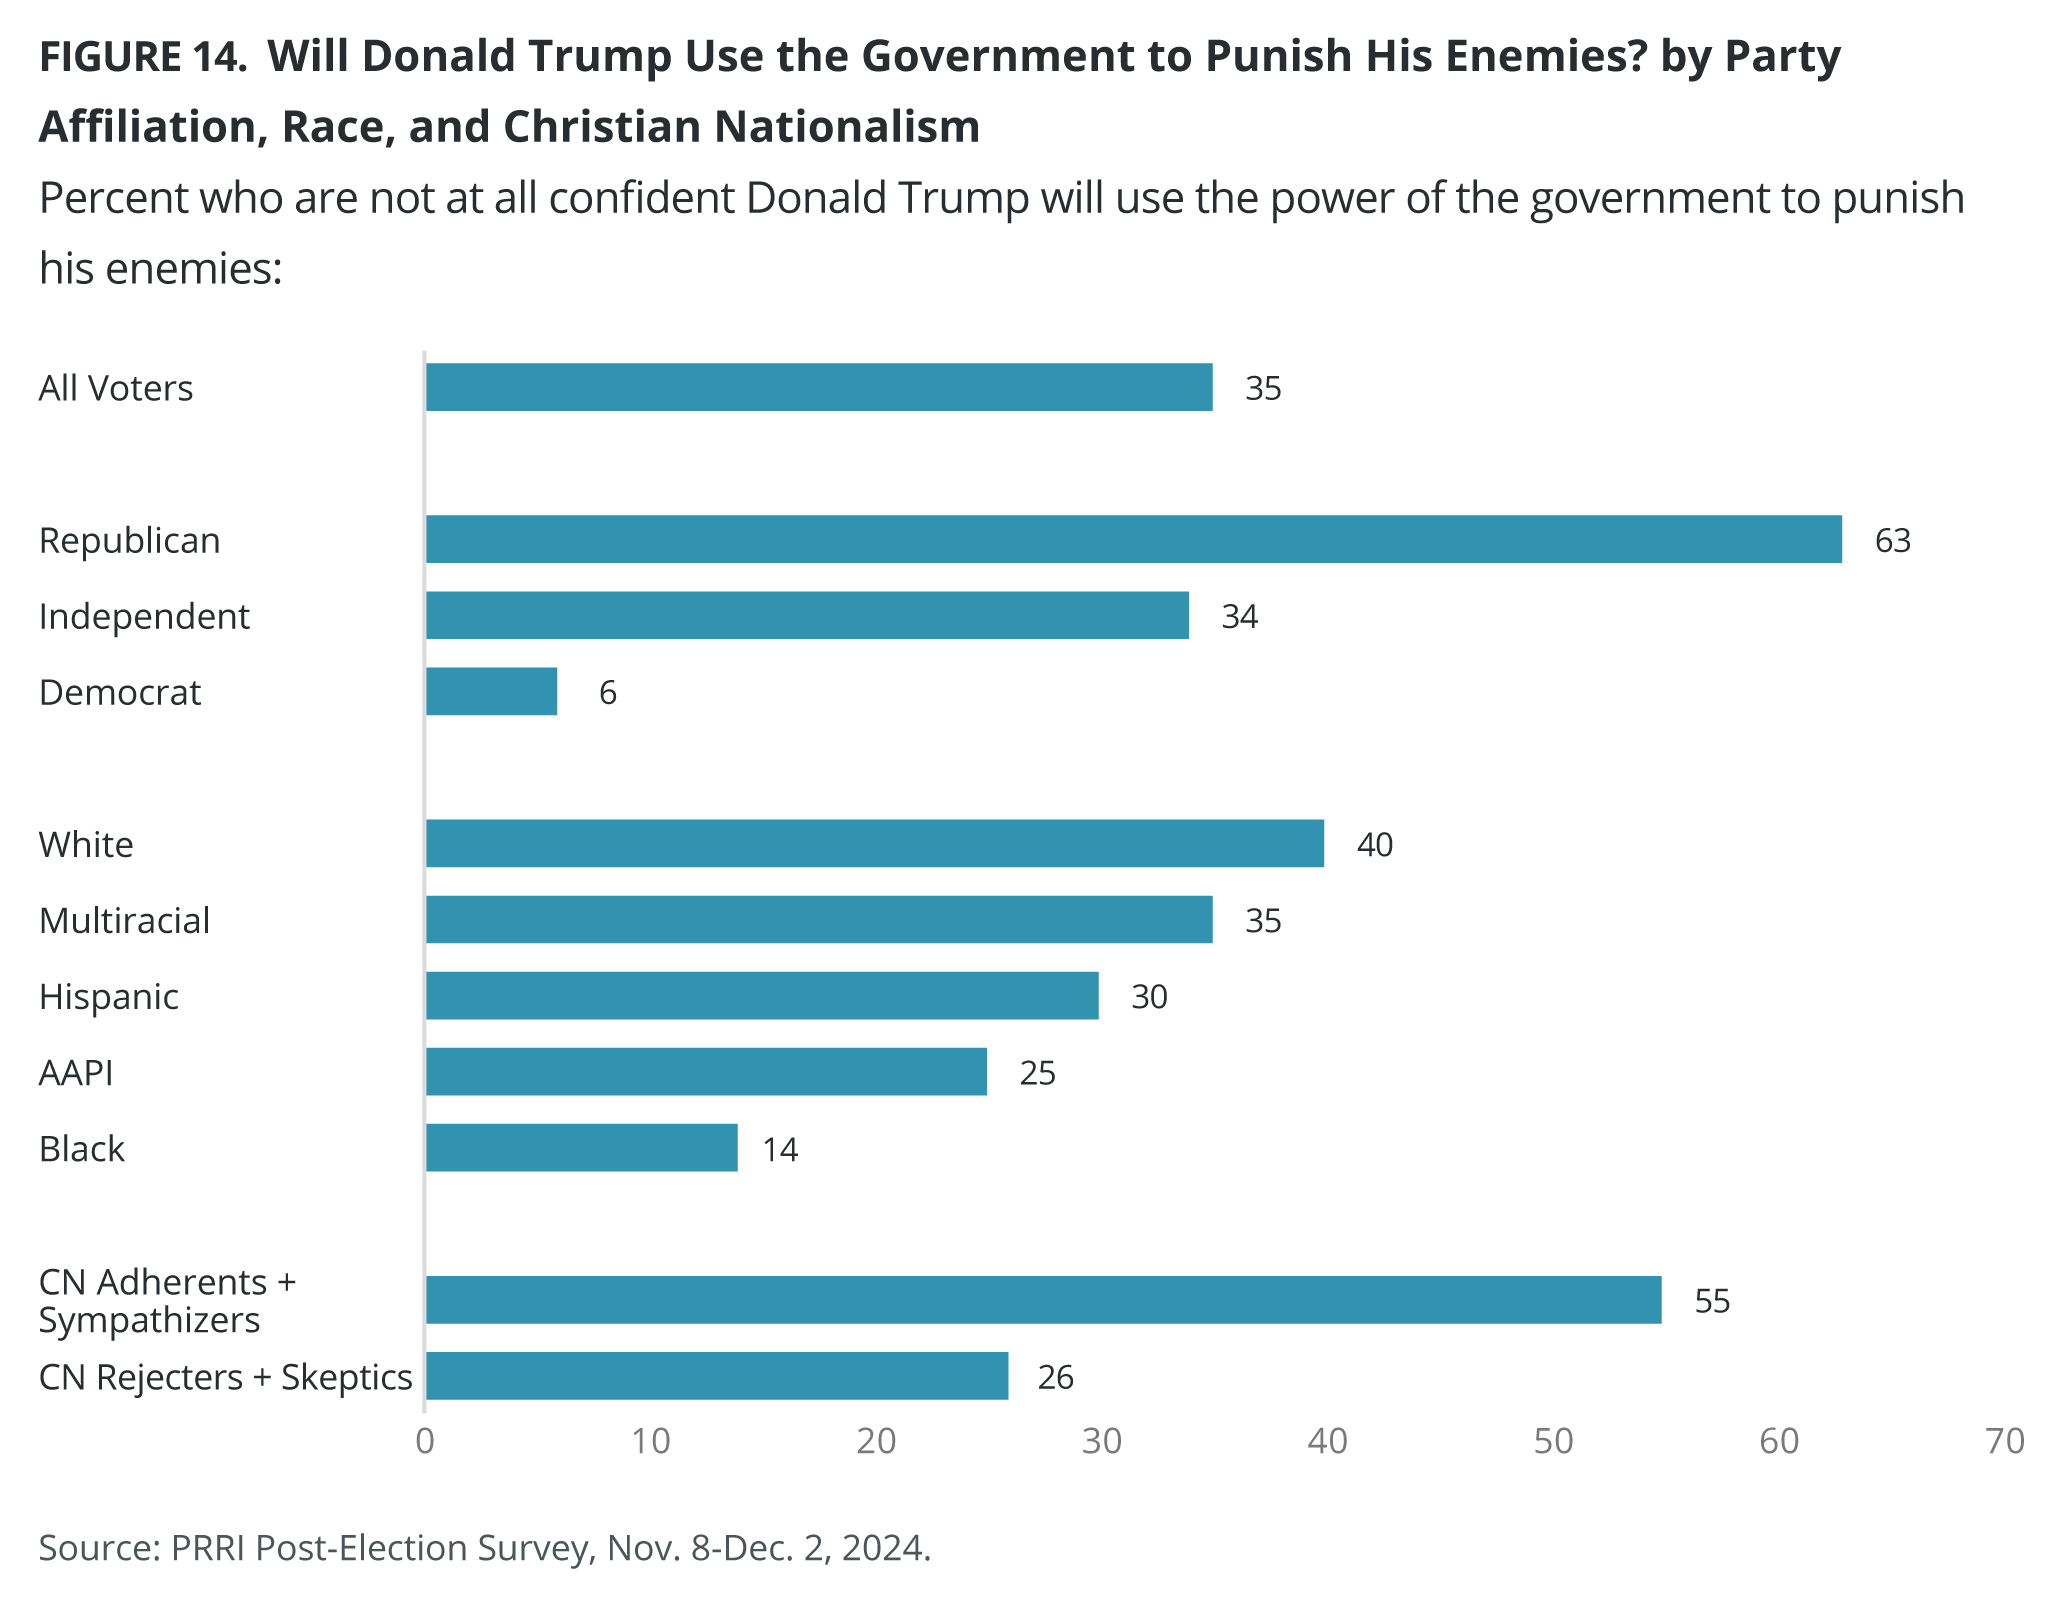
Republican, white, and Christian nationalism Adherent and Sympathizer voters are far less likely to believe that Trump will use the power of the government for retribution than Democratic, Black, and Christian nationalism Rejecter and Skeptic voters.
- Roughly one-third of American voters (35%) say they are “not at all confident” that Donald Trump will use the power of the government to punish his enemies.
- Republican voters (63%) are the most confident that Trump will not use government power to exact political revenge, compared with 34% of independent voters, and just 6% of Democratic voters.
- Four in ten white voters (40%) are “not at all confident” that Trump will use the power of the government to punish his enemies, followed by multiracial (35%), Hispanic (30%), and AAPI (25%) voters. Black voters (14%) are the least confident that Trump will avoid using government power to punish his enemies.
- About one-quarter (26%) of voters who qualify as Christian nationalism Rejecters and Skeptics “are not at all confident” that Trump will use the government to exact political revenge, compared with more than half (55%) of Christian nationalism Adherent and Sympathizer voters.
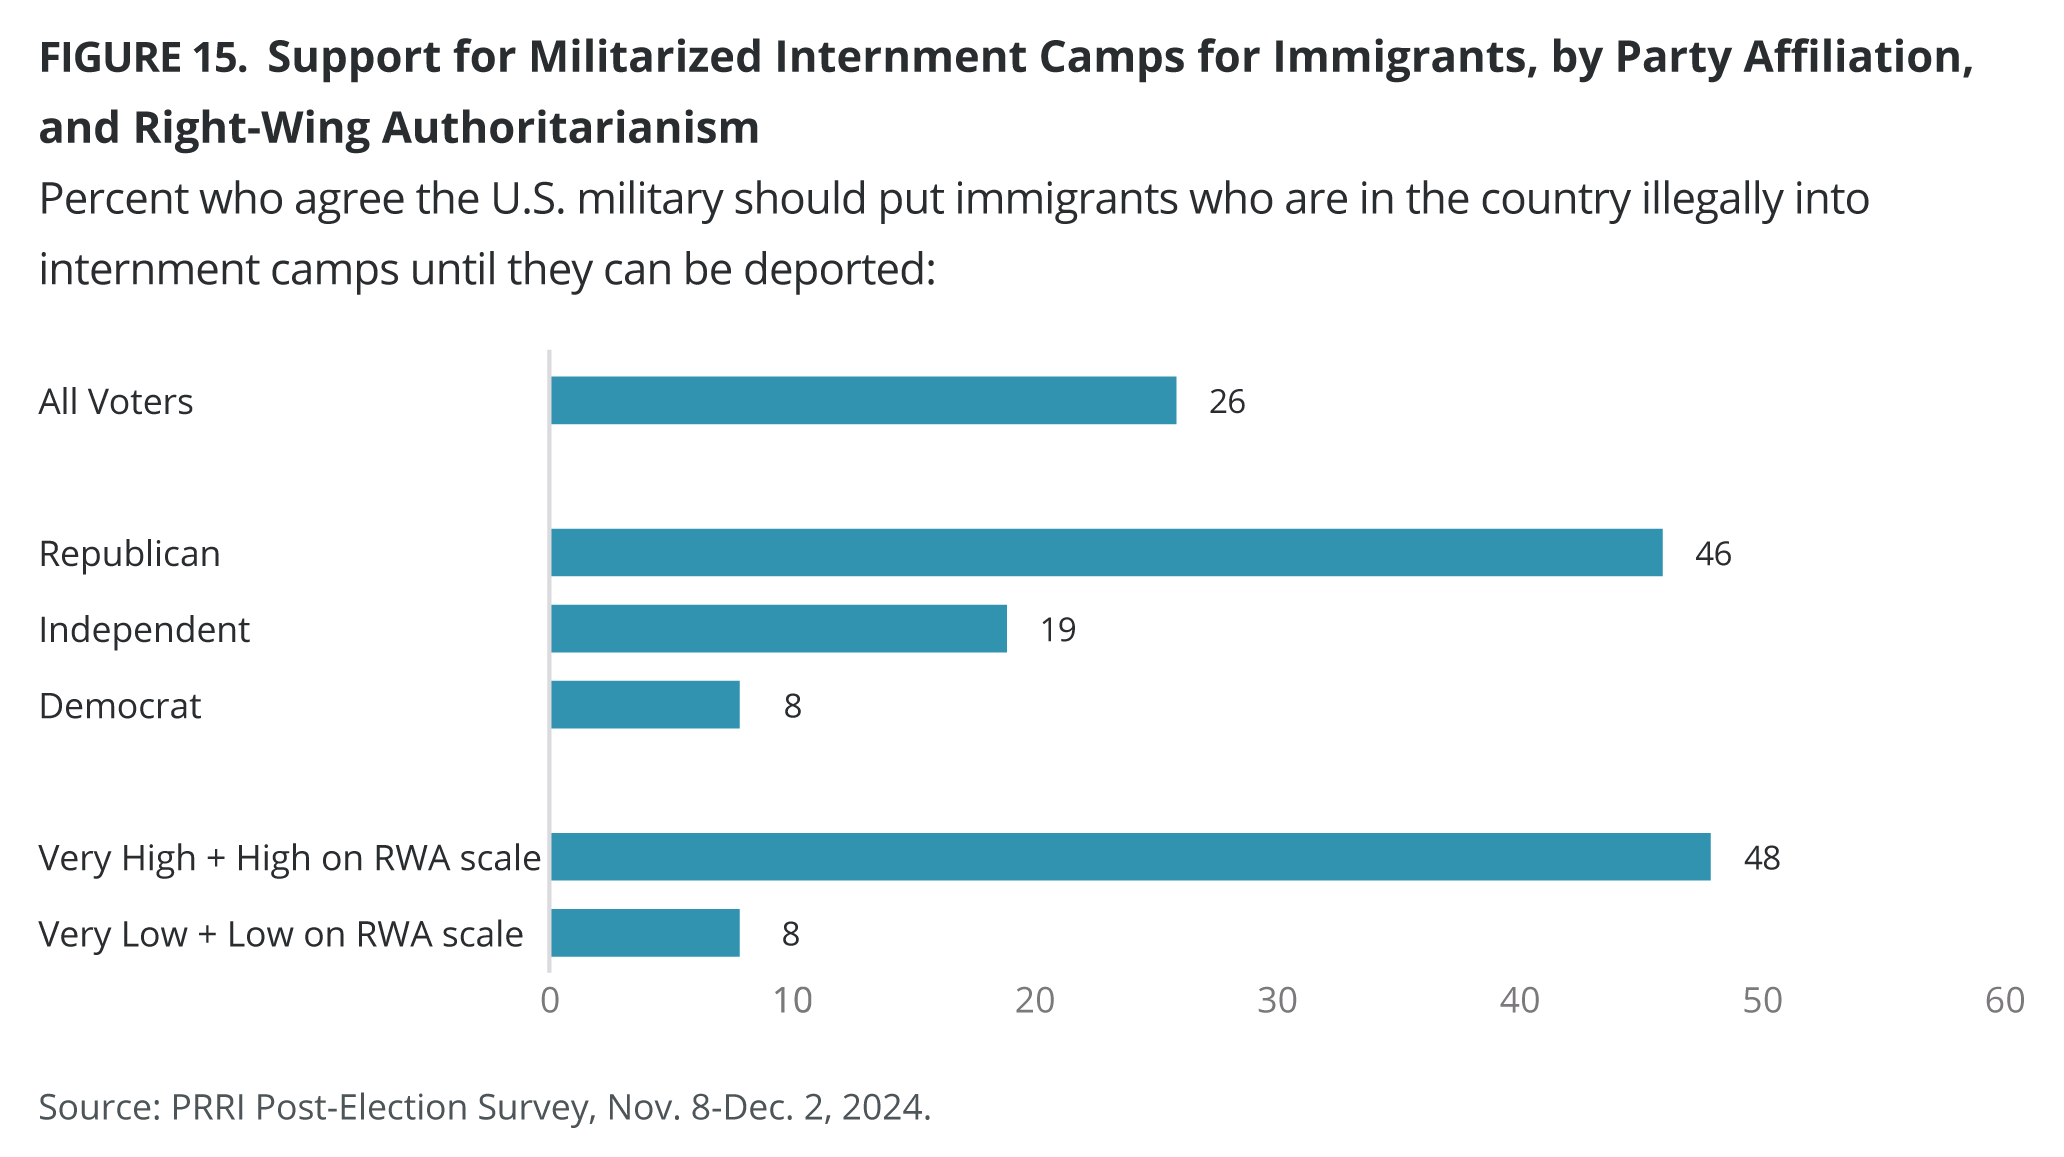
Republican voters and voters who score high on the authoritarianism scale are the most likely to agree that the U.S. military should put undocumented immigrants into internment camps until they can be deported.
- Just one in four voters (26%) agree that the U.S. military should put immigrants who are in the country illegally into internment camps until they can be deported.
- Republican voters (46%) are more than twice as likely as independent voters (19%) and more than five times as likely as Democratic voters (8%) to agree with this policy.
- American voters who hold highly authoritarian views are six times as likely to agree with placing undocumented immigrants into such camps until they can be deported than American voters who largely reject authoritarianism (48% v. 8%).
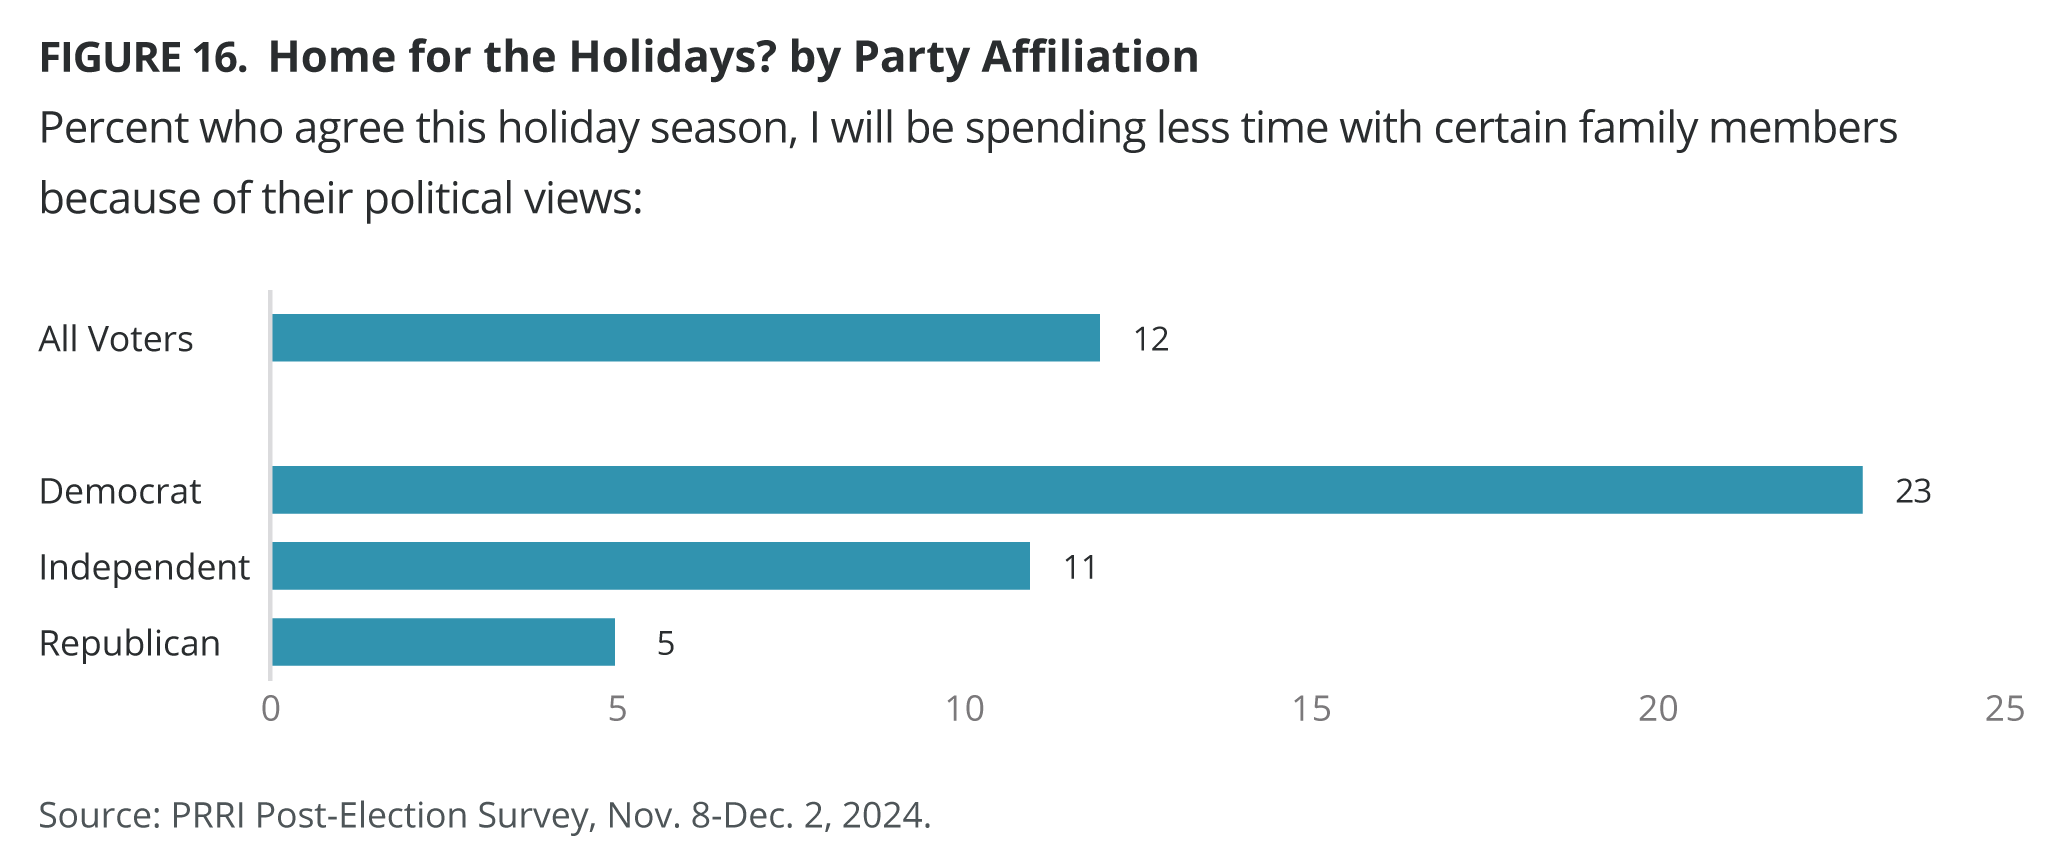
As the holidays approach, Democratic voters are significantly more likely than Republican and independent voters to say they will reduce time with family due to political differences.
- Just 12% of American voters say they will be spending less time with certain family members because of their political views this holiday season.
- Democratic voters (23%) are nearly five times as likely as Republican voters (5%) to say they will be spending less time with certain family members because of their political views.
[1] For more information on how the Christian nationalism Scale was created, see our 2024 report “Support for Christian Nationalism in All 50 States: Findings from PRRI’s 2023 American Values Atlas,” and our February 2023 report “A Christian Nation? Understanding the Threat of Christian Nationalism to American Democracy and Culture.”
[2] For more information on how the Right-Wing Authoritarianism Scale was created, see our September 2024 report “One Leader Under God: The Connection Between Authoritarianism and Christian Nationalism in America.”
[3] For more information on QAnon believers, see “The Rise and Impact of Q: The 2024 Election from the View of QAnon Believers.”
Methodology
The survey was designed and conducted by PRRI. The survey was conducted among a representative sample of 5,772 adults (age 18 and up) living in all 50 states in the United States, who are part of Ipsos’s KnowledgePanel. Interviews were conducted online between November 8 and December 2, 2024. The margin of error for the full sample is +/- 1.72 percentage points at the 95% level of confidence. Our analysis in this report is isolated to Americans who reported voting (N=4,757 cases). The margin of error for this subsample of voters is +/- 1.9 percentage points at the 95% level of confidence. In addition to sampling error, surveys may also be subject to error or bias due to question wording, context, and order effects. Additional details about the KnowledgePanel can be found on the Ipsos website: https://www.ipsos.com/en-us/solution/knowledgepanel
Press Coverage
Kamala Harris Was Poised to Crush the Women’s Vote. What Went Wrong?
 The Nation


