Americans’ Support for Key LGBTQ Rights Continues to Tick Upward
Introduction
For several years, PRRI has surveyed Americans’ support and opposition to three main LGBTQ rights policies:
- Laws that would protect gay, lesbian, bisexual, and transgender people against discrimination in jobs, public accommodations, and housing (since 2015)
- Allowing a small business owner in your state to refuse to provide products or services to gay or lesbian people if doing so would violate their religious beliefs (since 2015)
- Allowing gay and lesbian couples to marry legally (since 2014)
All three issues have been addressed in continued policy action and court decisions at the federal and state levels during this time period. There is currently no national law guaranteeing nondiscrimination protections for LGBTQ people across most categories, but the 2019 Bostock v. Clayton County, Georgia U.S. Supreme Court ruling found that LGBTQ discrimination in employment is considered “sex discrimination” as defined by the Civil Rights Act of 1964.[1] However, that ruling applies only to employment, and beyond that, 29 states currently do not have complete or any nondiscrimination protections for LGBTQ Americans.[2] The U.S. Congress is currently considering the Equality Act, which would bar discrimination based on sexual orientation and gender identity at the federal level.[3]
The recent history of LGBTQ rights and the rights of private business owners to deny services that may violate their religious beliefs has been complex, notably involving a highly publicized battle between a baker and a gay couple for whom the baker refused to make a wedding cake. The years long battle culminated in the 2018 U.S. Supreme Court decision in Masterpiece Cakeshop v. Colorado Civil Rights Commission, which sided with the baker on narrowly defined terms.[4] The issue remains unsettled, and the Supreme Court will hear another case on the issue in 2022.[5]
Same-sex marriage was legalized at the federal level by the Obergefell v. Hodges U.S. Supreme Court ruling in 2015.[6] There are fears that the court, which is now majority conservative, might overturn the decision if an opportunity arises. If the ruling is overturned, same-sex marriage might become illegal in states that had not passed marriage equality legislation prior to 2015.[7]
Nondiscrimination Protections
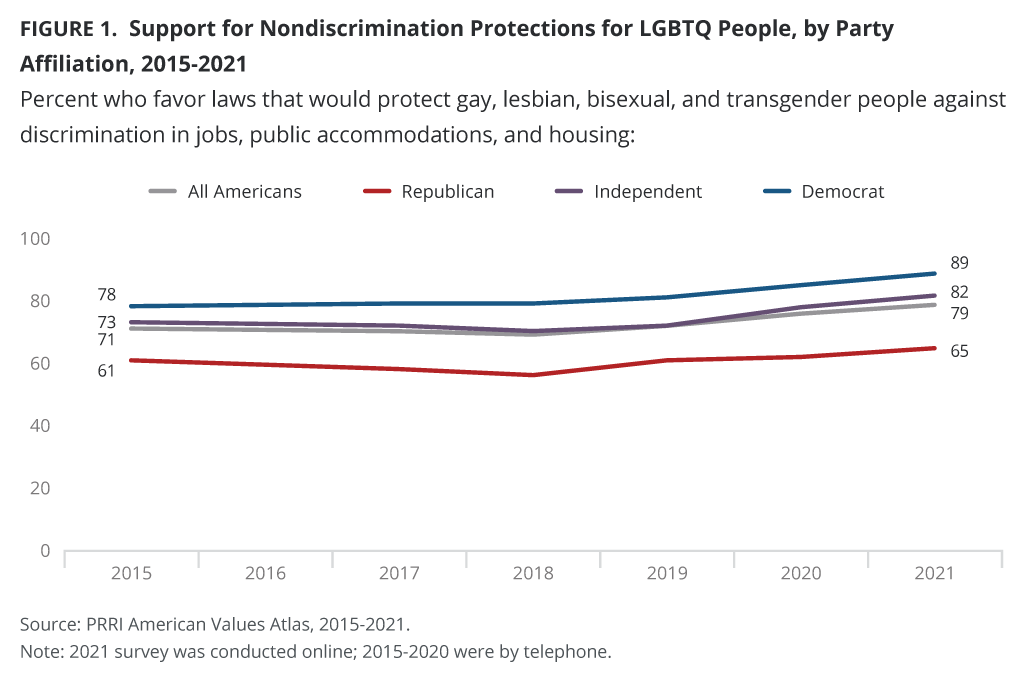
Nearly eight in ten Americans (79%) favor laws that would protect gay, lesbian, bisexual, and transgender people against discrimination in jobs, public accommodations, and housing, including 41% who strongly support them. One in five Americans (20%) oppose such laws, including just seven percent who strongly oppose them. Support for these protections has increased over the past few years, with around seven in ten Americans favoring nondiscrimination provisions in 2015 (71%), 2017 (70%), 2018 (69%), and 2019 (72%), up to 76% in 2020.[8]
Most Democrats (89%), independents (82%), and almost two-thirds of Republicans (65%) favor nondiscrimination provisions for LGBTQ people. Since 2015, support increased nine percentage points among Democrats (78% to 89%) and independents (73% to 82%). Support among Republicans has also increased, but only by a few percentage points (61% to 65%).
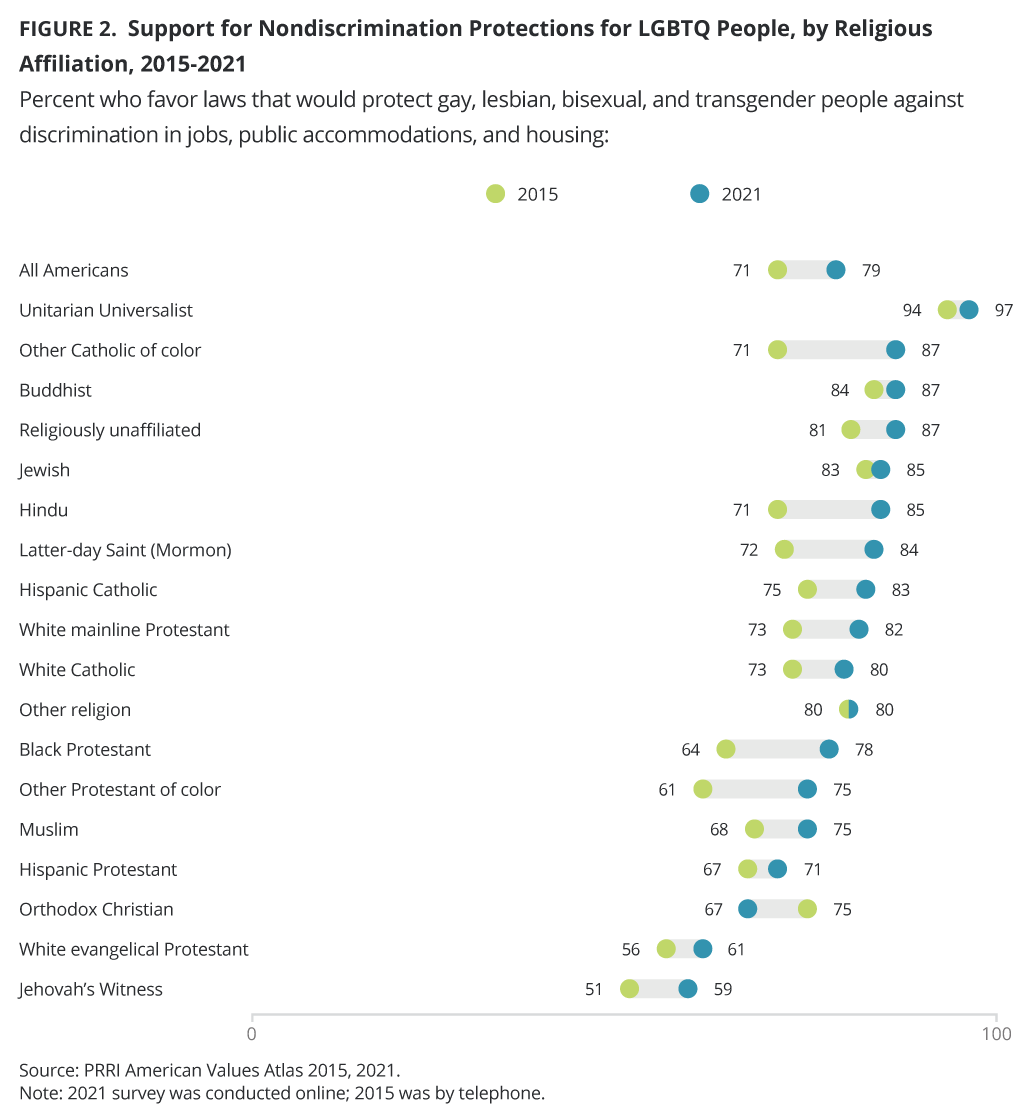
Vast majorities of most major religious groups support nondiscrimination protections for LGBTQ people and have increased their support since 2015, including nearly all Unitarian Universalists (97%) and about nine in ten other Catholics of color (87%), Buddhists (87%), and religiously unaffiliated Americans (87%). In addition, eight in ten or more Jewish Americans (85%), Hindus (85%), Latter-Day Saints (Mormons) (84%), Hispanic Catholics (83%), white mainline Protestants (82%), white Catholics (80%), and members of other religions (80%) support nondiscrimination laws to protect LGBTQ people. About three in four Black Protestants (78%), other Protestants of color (75%), and Muslims (75%), as well as seven in ten Hispanic Protestants (71%) and two-thirds of Orthodox Christians (67%), support such protections.[9] About six in ten white evangelical Protestants (61%) and Jehovah’s Witnesses (59%) support nondiscrimination protections for LGBTQ people.
Majorities of Americans of almost every major racial and ethnic group support nondiscrimination protections for LGBTQ people, including Hispanic Americans (80%, up from 74% in 2015), white Americans (79%, up from 71% in 2015), Black Americans (77%, up from 65% in 2015) and multiracial Americans (77%, up from 72% in 2015). Majorities of white Americans across educational lines support nondiscrimination protections for LGBTQ people, though whites with college degrees (84%, up from 80% in 2015) are more likely than whites without degrees (75%, up from 67% in 2015) to support these provisions.
Support for nondiscrimination protections for LGBTQ people increases with education, to 73% of Americans with a high school degree or less, 80% of Americans with some college experience, 84% of Americans with four-year college degrees, and 86% of Americans with postgraduate degrees.
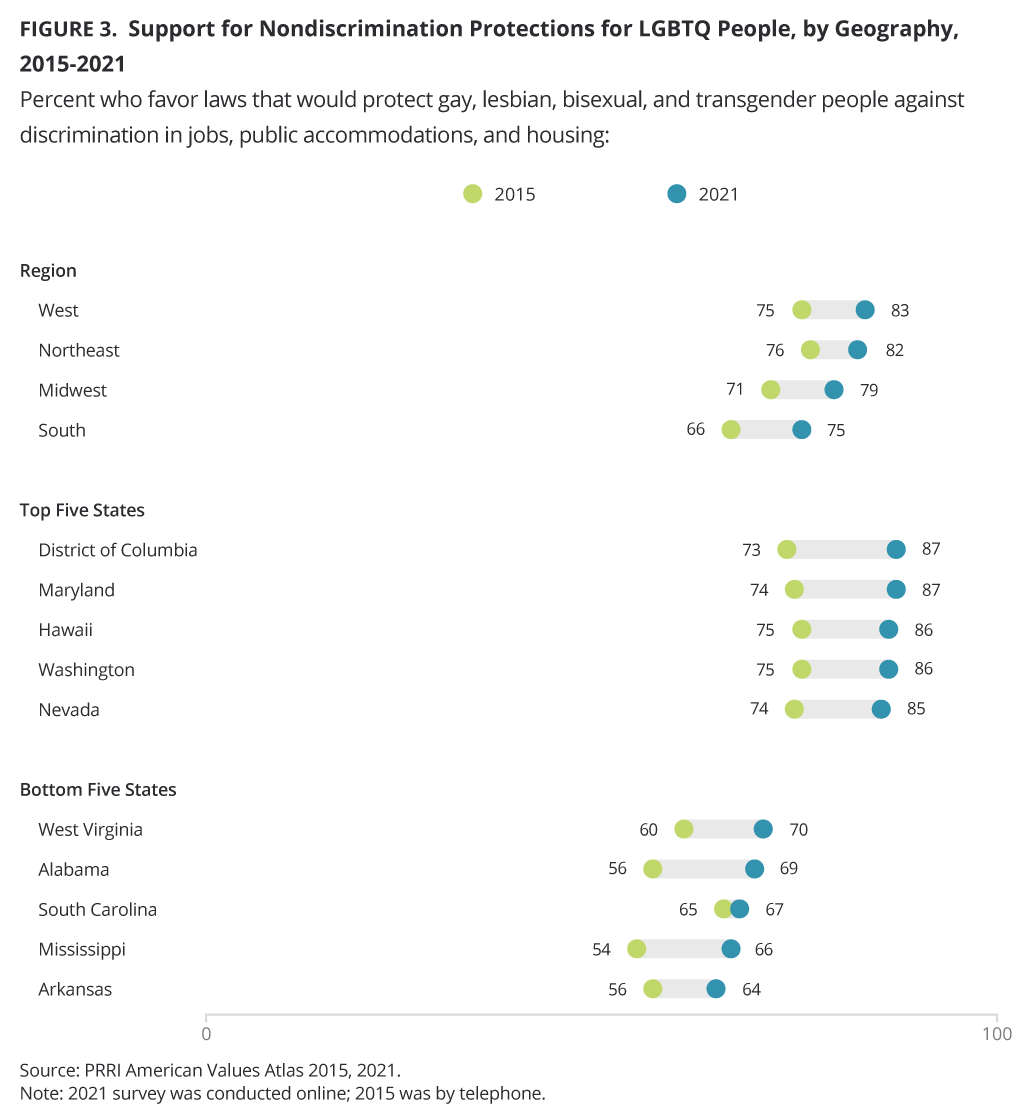
There are not large differences in support by geography, although residents of states in the South are notably less likely to support nondiscrimination laws. Most Americans who reside in the West (83%), the Northeast (82%), the Midwest (79%), and the South (75%, up from 66% in 2015) support nondiscrimination protections for LGBTQ people and have increased their support since 2015.
The top five states in support for nondiscrimination protections for LGBTQ people each show increases of 11 percentage points or more since 2015: District of Columbia (87%, up from 73% in 2015), Maryland (87%, up from 74% in 2015), Hawaii (86%, up from 75% in 2015), Washington (86%, up from 75% in 2015), and Nevada (85%, up from 74% in 2015). Each of these states have state laws that explicitly prohibits discrimination based on sexual orientation and gender identity.[10]
The bottom five states show differing levels of change in the last few years. Between six and seven in ten residents of Arkansas (64%, up from 56% in 2015), Mississippi (66%, up from 54% in 2015), South Carolina (67%, no change since 2015), Alabama (69%, up from 56% in 2015), and West Virginia (70%, up from 60% in 2015) support nondiscrimination protections for LGBTQ people. Despite broad majority support in these states, none of them have state laws prohibiting discrimination based on sexual orientation or gender identity.
Religiously Based Service Refusals
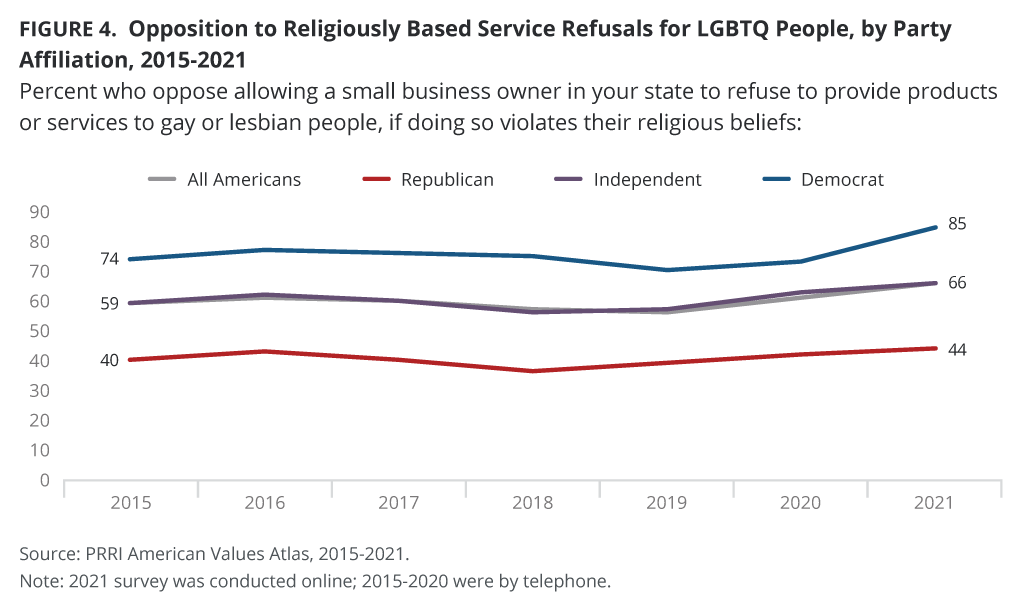
Majorities of Americans consistently oppose religiously based refusals to serve gay and lesbian people, and nearly two-thirds (66%) opposed such refusals in 2021. About one-third of Americans (33%) support such religiously based service refusals, including 13% who strongly favor them. Unlike on the other issues in this report, opposition to religiously based refusals to serve gay and lesbian people has shown negative and positive fluctuations since 2015, when 59% opposed this policy. Opposition to refusing service stayed about the same in 2016 (61%) and 2017 (60%), then ticked slightly down, to 57% in 2018 and 56% in 2019. In 2020, opinion shifted back to the 2016 level (61%), and 2021 shows a significant increase again.[11]
Nearly nine in ten Democrats (85%) and two-thirds of independents (66%) oppose religiously based refusals to serve gay and lesbian people. About four in ten Republicans (44%) oppose such service refusals, compared to a majority (56%) who support them. Opposition to religiously based service refusals has increased among all partisans since 2015, when 74% of Democrats, 59% of independents, and 40% of Republicans opposed religiously based service refusals.
Majorities of almost every major religious group oppose religiously based service refusals, including 82% of Unitarian Universalists, 80% of religiously unaffiliated Americans, 79% of other Catholics of color, 78% of members of other religions, 77% of Muslims, 76% of Jewish Americans, 75% of Buddhists, 75% of Hindus, 74% of Hispanic Catholics, 71% of Black Protestants, 66% of Hispanic Protestants, 65% of white Catholics, 63% of white mainline Protestants, and 58% of other Protestants of color. Less than half of Jehovah’s Witnesses (49%), Latter-Day Saints (44%), Orthodox Christians (43%), and white evangelical Protestants (38%) oppose religiously based service refusals.[12]
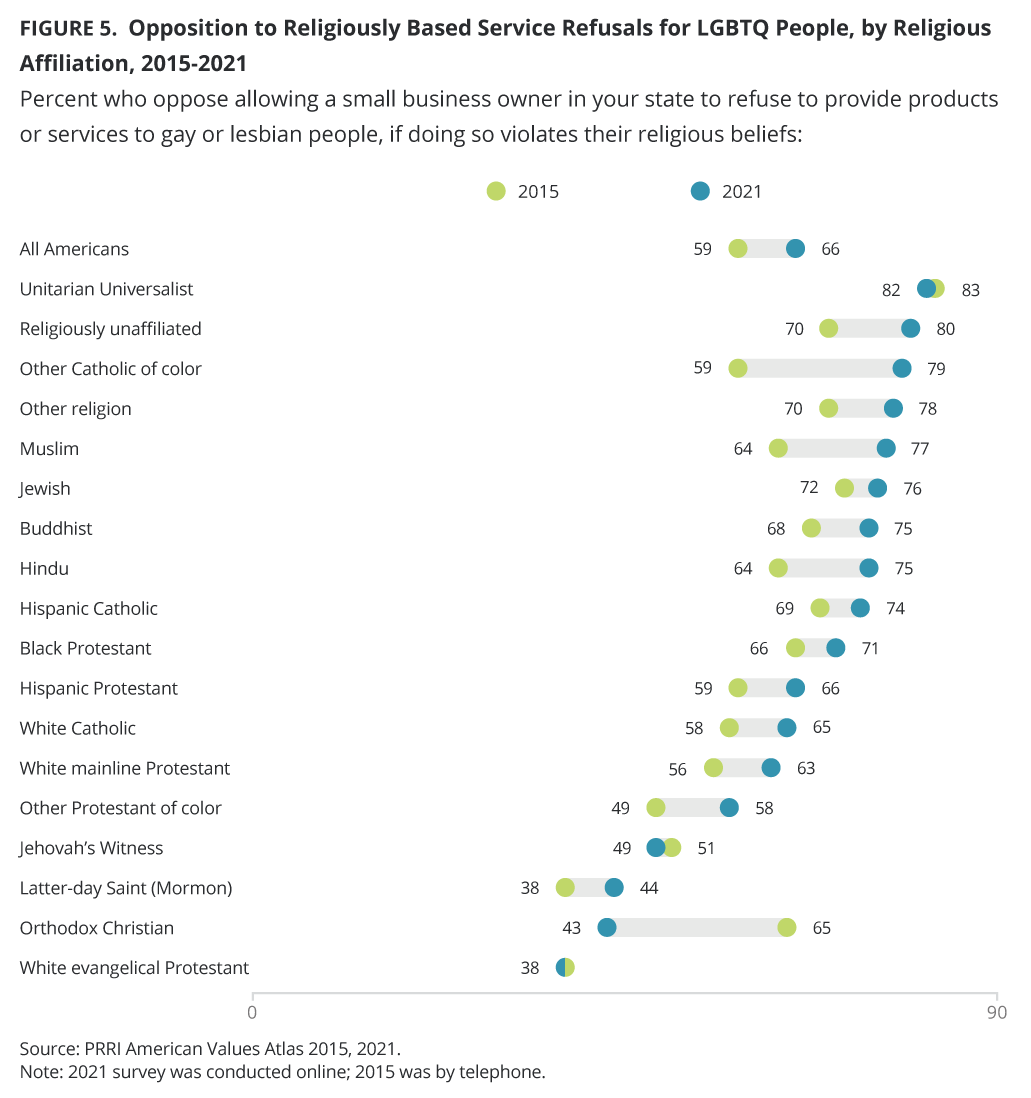
White Americans (62%) are less likely than Hispanic Americans (73%) and Black Americans (72%) to oppose religiously based service refusals, but do not differ significantly from multiracial Americans (64%). However, white Americans with college degrees (66%) are more likely than whites without college degrees (60%) to oppose religiously based refusals to serve gay and lesbian people.
Majorities of Americans across educational lines oppose religiously based service refusals. Americans with postgraduate degrees (70%) are significantly more likely than Americans with a high school degree or less (66%) and Americans with some college experience (63%) to oppose religiously based service refusals but do not differ significantly from Americans with four-year college degrees (68%).
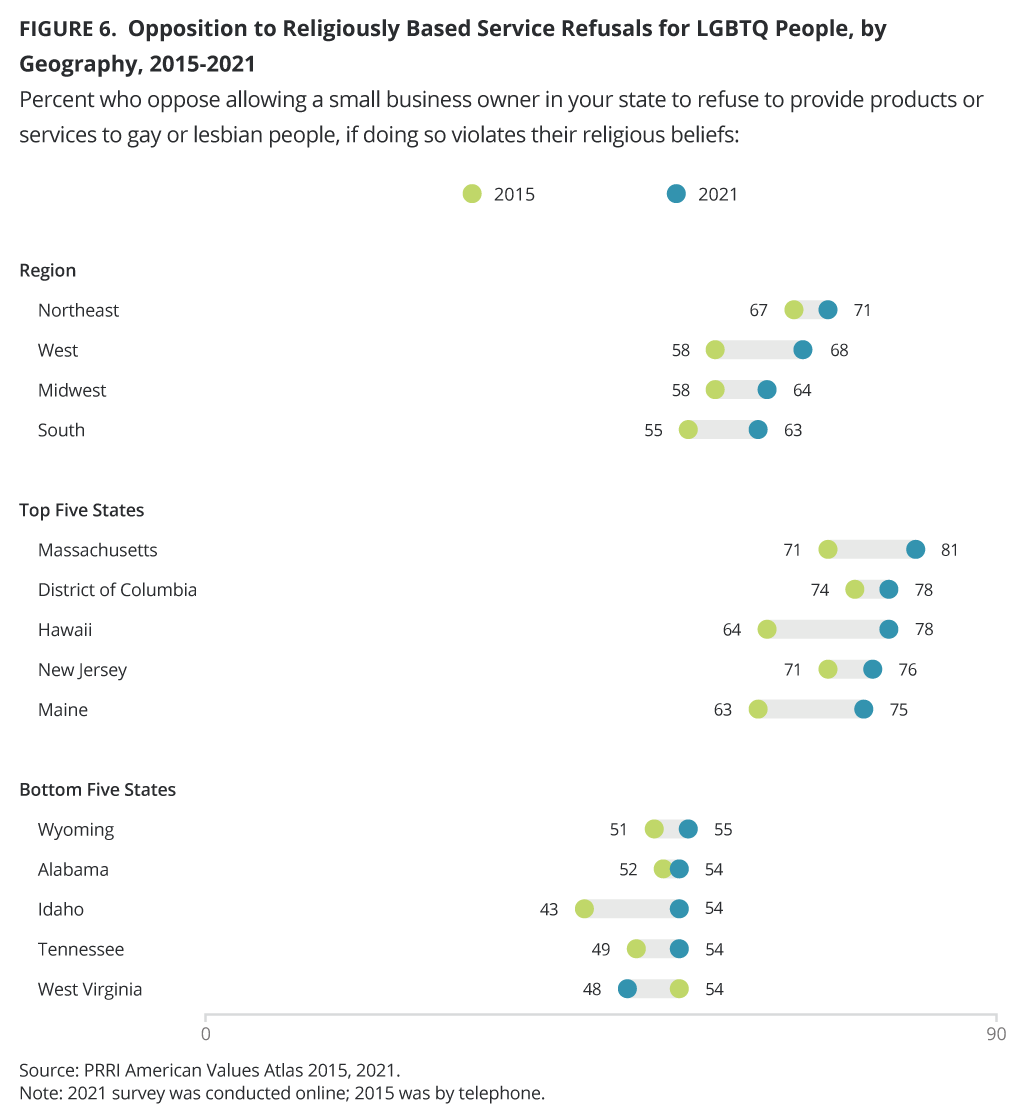
Even though Americans who reside in the South (63%) and the Midwest (64%) are less likely than Americans who reside in the Northeast (71%) and the West (68%) to oppose religiously based refusals to serve gay and lesbian people, they still represent a solid majority.
The top five states that oppose allowing small business owners to refuse service to gay and lesbian customers are Massachusetts (81%), the District of Columbia (78%), Hawaii (78%), New Jersey (76%), and Maine (75%).
West Virginia is the only state in which less than half of residents (48%) oppose religiously based refusals. After West Virginia, Tennessee (54%), Idaho (54%), Alabama (54%), and Wyoming (55%) show the lowest opposition to religiously based service refusals at the state level.
Same-Sex Marriage
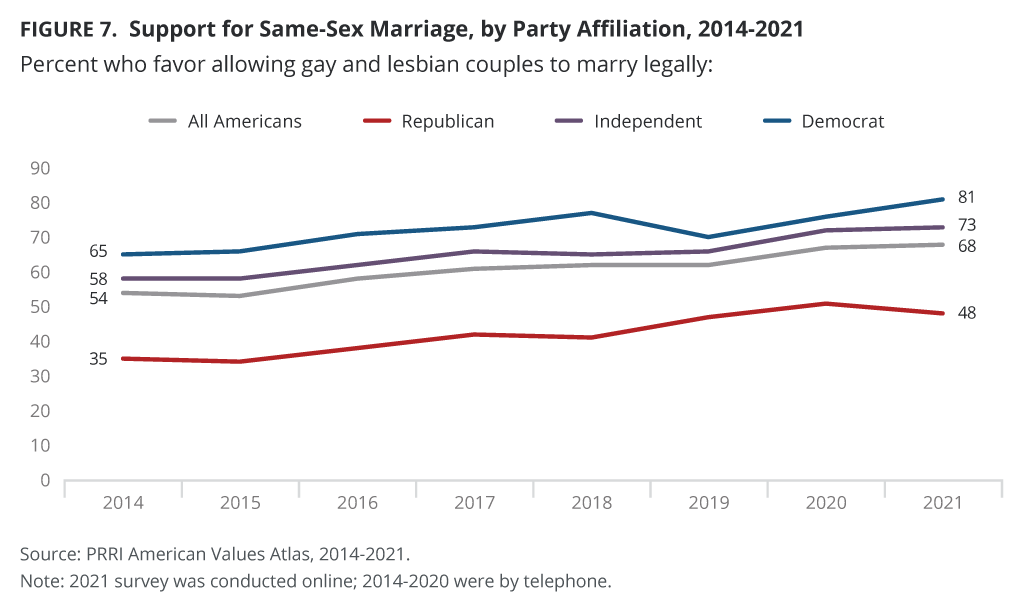
Nearly seven in ten Americans (68%) express support for same-sex marriage. Only 30% of Americans oppose allowing gay and lesbian couples to marry. Support has risen consistently since 2014, from 54% to 58% in 2016 and 61% in 2017 to 67% in 2020 and 68% in 2021. In June 2015, when Obergefell v. Hodges was decided, 53% of Americans said they were in favor of same-sex marriage.
Republicans are now divided over same-sex marriage (48% support, 50% oppose), while Democrats and independents express strong support. Eighty-one percent of Democrats and nearly three in four independents (73%) favor allowing gay and lesbian couples to marry legally. Support for same-sex marriage has increased steadily since 2014, when 35% of Republicans, 58% of independents, and 65% of Democrats were in favor.
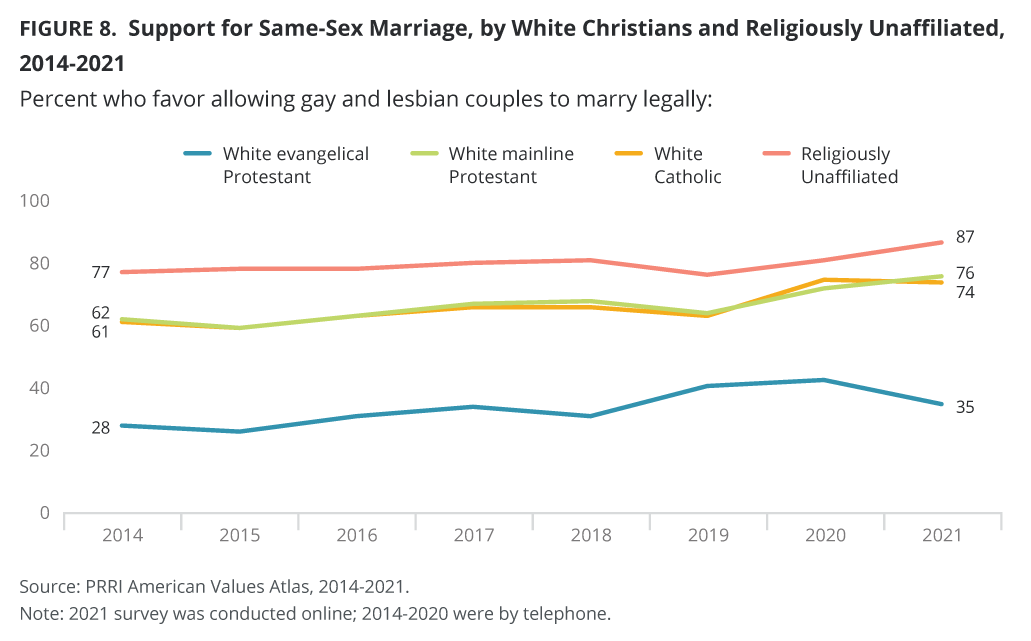
Majorities of most major religious groups support same-sex marriage, including nearly all Unitarian Universalists (96%), about nine in ten religiously unaffiliated Americans (87%), and Hindus (86%). In addition, about eight in ten Jewish Americans (83%), Buddhists (81%), and other Catholics of color (80%) also support same-sex marriage, as do about three in four white mainline Protestants (76%), white Catholics (74%), and Hispanic Catholics (72%). Majorities of Orthodox Christians (58%), Black Protestants (55%), Muslims (55%), Hispanic Protestants (52%), and other Protestants of color (51%) support same-sex marriage.[1] Less than half of Latter-Day Saints (46%) support same-sex marriage, and white evangelical Protestants (35%) and Jehovah’s Witnesses (22%) are the least likely to support same-sex marriage.
Majorities of Americans of almost every major racial and ethnic group support same-sex marriage, including around seven in ten white Americans (69%), Hispanic Americans (68%), and multiracial Americans (68%). Though still a majority, Black Americans are the least likely to support same-sex marriage (59%). White Americans with college degrees (78%) are more likely than white Americans without college degrees (64%) to support same-sex marriage.
Support for same-sex marriage increases with education: 60% of Americans with a high school degree or less, 69% of Americans with some college experience, 77% of Americans with four-year college degrees, and 79% of Americans with postgraduate degrees support same-sex marriage.
There are enduring generational divisions as well, although majorities of every age group now express support for same-sex marriage, including nearly six in ten older Americans (59%), 64% of Americans ages 50-64, 72% of Americans ages 30-49, and 76% of Americans ages 18-29.
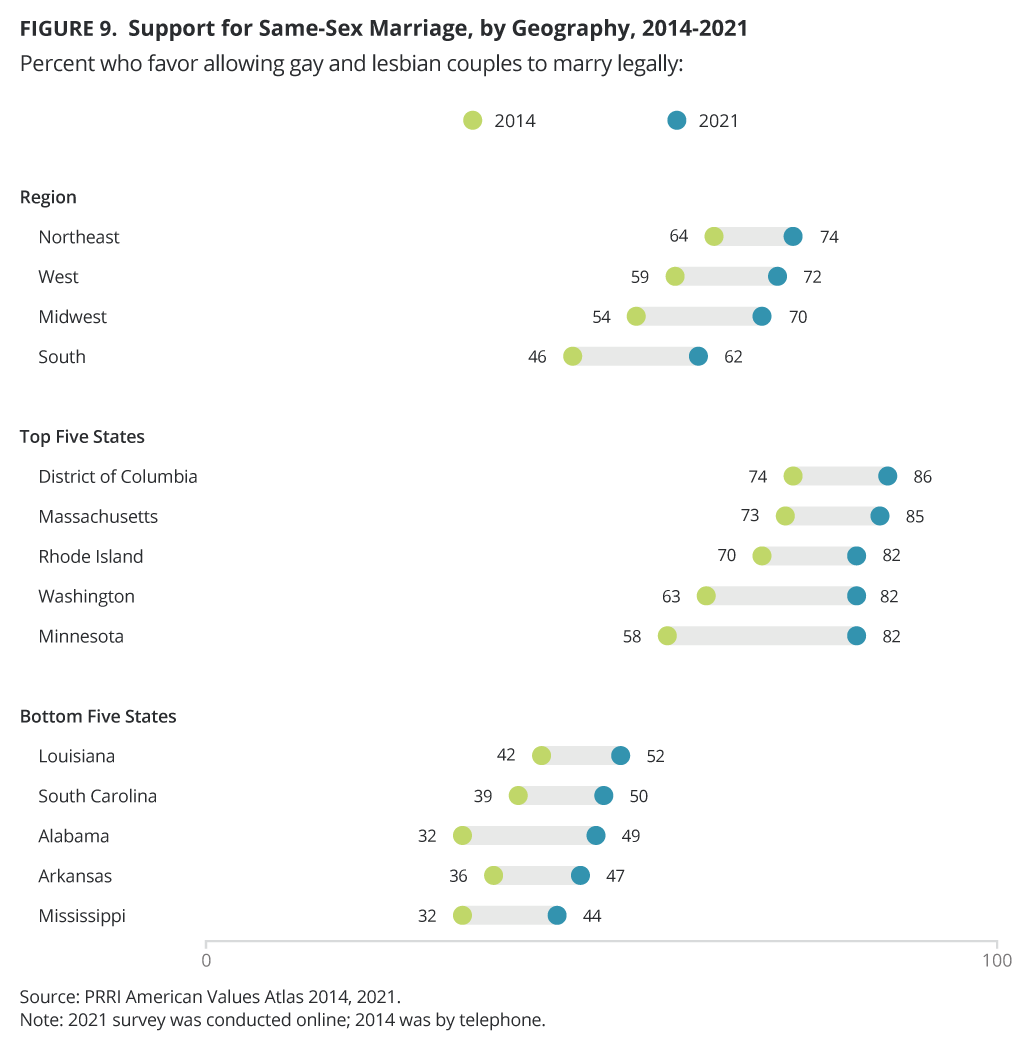
Even though Americans who reside in the South (62%) are less likely than Americans who reside in the Midwest (70%), West (72%), and Northeast (74%) to support same-sex marriage, they still represent a majority.
The top five states that support same-sex marriage are the District of Columbia (86%), Massachusetts (85%), Rhode Island (82%), Washington (82%), and Minnesota (82%).
By contrast, the five states with the lowest support for same-sex marriage are Mississippi (44%), Arkansas (47%), Alabama (49%), South Carolina (50%), and Louisiana (52%).
Groups Least Supportive of LGBTQ Rights: Republicans and White Evangelical Protestants
Two groups have consistently lagged in support of these three LGBTQ rights issues. Republicans and white evangelical Protestants have consistently been less likely than other groups of Americans to support LGBTQ nondiscrimination protections and same-sex marriage, and they have been more likely to support religiously based service refusals. These groups are not monolithic, however, and pockets of higher and lower support are found when they are disaggregated.
Republicans and LGBTQ Nondiscrimination Protections
In 2021, Republicans expressed their highest levels of support for laws to protect LGBTQ people from discrimination (65%). This level of support is slightly higher than it was in 2020 (62%), and support for LGBTQ nondiscrimination protections has remained steady at around six in ten Republicans since 2015 (61%). The increase in support for nondiscrimination protections has come predominantly from moderate Republicans, whose support increased from 71% in 2015 to the current level of 79%. Support among conservative Republicans has remained similar between 2015 (58%) and now (60%).
By race, support among white Republicans has increased, to 65% from 60%, while support among Hispanic Republicans has decreased, from 69% to 64% in the same time period.
Support for LGBTQ nondiscrimination protections has increased nominally among white mainline (non-evangelical) Protestant Republicans (73%, compared to 64% in 2015), white evangelical Protestant Republicans (55%, up from 51%), and religiously unaffiliated Republicans (74%, up from 70%). Support for protections increased slightly among Latter-Day Saint Republicans (77%, from 75% in 2015) and has not changed among white Catholic Republicans (68% in 2021 and 2015). Support for nondiscrimination laws has declined slightly among both Hispanic Protestant Republicans (from 63% in 2015 to 57% in 2021) and Hispanic Catholic Republicans (from 71% in 2015 to 65% in 2021).
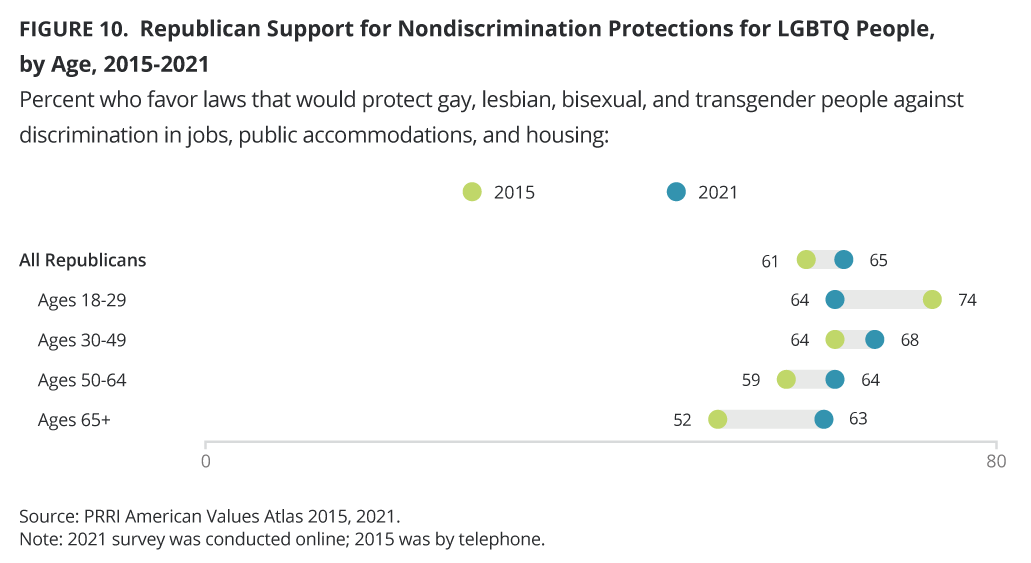
Surprisingly, shifts toward supporting nondiscrimination protections for LGBTQ people increase with age among Republicans. Republicans ages 18-29 have become less likely to support protections now (64%) than they were in 2015 (74%). Support among Republicans ages 30-49 has increased slightly, to 68%, from 64% in 2015, and Republicans ages 50-64 have also become somewhat more likely to support protections now (64%) than they were in 2015 (59%). Republicans over age 65 have shifted the most in their support, increasing from 52% in 2015 to 63% in 2021. These shifts among Republicans have essentially closed the age gap between the youngest and oldest Republicans: In 2015, Republicans ages 18-29 were 22 percentage points more likely than Republicans over age 65 to support nondiscrimination protections (74% vs. 52%, respectively), and now are just one percentage point more likely (64% vs. 63%, respectively).
More than six in ten Republicans across all levels of education support LGBTQ nondiscrimination protections. Support among Republicans with a high school degree or less has increased the most (from 55% in 2015 to 63% in 2021). Republicans with postgraduate degrees have become slightly more supportive (from 68% to 71%), while support among Republicans with some college but no four-year degree (from 63% to 65%) and Republicans with four-year college degrees (from 66% to 66%) has remained mostly stable.
Republican women are somewhat more supportive of nondiscrimination protections for LGBTQ people now (68%) than they were in 2015 (64%). Attitudes among Republican men have only shifted slightly between 2015 (59%) and now (61%).
White Evangelical Protestants and LGBTQ Nondiscrimination Protections
Around six in ten white evangelical Protestants (61%) support nondiscrimination protections for LGBTQ people, up from 56% in 2015. Support for nondiscrimination protections among white evangelicals has increased across party lines since 2015. White evangelical Protestant Democrats have increased most in their support, to 81%, from 64% in 2015. White evangelical Protestant independents have increased to 69%, from 61% in 2015, and white evangelical Protestant Republicans have increased to 55%, from 51% in 2015.
Interestingly, support for LGBTQ nondiscrimination protections among white evangelical Protestants ages 18-29 has decreased slightly, to 66%, from 73% in 2015. Other age groups of white evangelical Protestants have become somewhat more supportive of nondiscrimination, including those ages 30-49 (64%, up from 59% in 2015), 50-64 (62%, up from 56%), and those ages 65 and older (56%, up from 48%). These shifts have narrowed the age gap between the youngest and oldest white evangelical Protestants from 25 percentage points in 2015 to 10 points in 2021.
White evangelical Protestants with a high school degree or less have increased in support for LGBTQ nondiscrimination protections to 59%, from 50% in 2015. Growth in support is smaller among those with some college experience but no four-year degree (62%, up from 60%) and those with four-year degrees (66%, up from 61%). Support has declined marginally among white evangelicals with postgraduate degrees (65% in 2021, 67% in 2015).
White evangelical Protestant women have become more likely to support nondiscrimination protections now (66%) than they were in 2015 (60%). Men have shifted slightly, going from 51% in 2015 to 55% in 2021.
Republicans and Religiously Based Service Refusals
The trend in opposition to religiously based service refusals among Republicans has remained relatively stable between 2015 and 2021, with around four in ten who oppose service refusals (40% in 2015, 44% in 2021).
Moderate Republicans have become much more likely to oppose religiously based service refusals now (65%) than they were in 2015 (53%), while opposition among conservative Republicans has only increased slightly, to 36%, from 32% in 2015.
Opposition to religiously based service refusals has increased most among white mainline (non-evangelical) Protestant Republicans (47%, from 42% in 2015), Hispanic Protestant Republicans (48%, from 43% in 2015), and religiously unaffiliated Republicans (60%, from 53% in 2015). Opposition has also increased somewhat among Latter-Day Saint Republicans (32%, from 28%), white Catholic Republicans (49%, from 44%), and white evangelical Protestant Republicans (32%, from 29%). Opposition among Hispanic Catholic Republicans has decreased slightly, to 52%, from 57% in 2015.
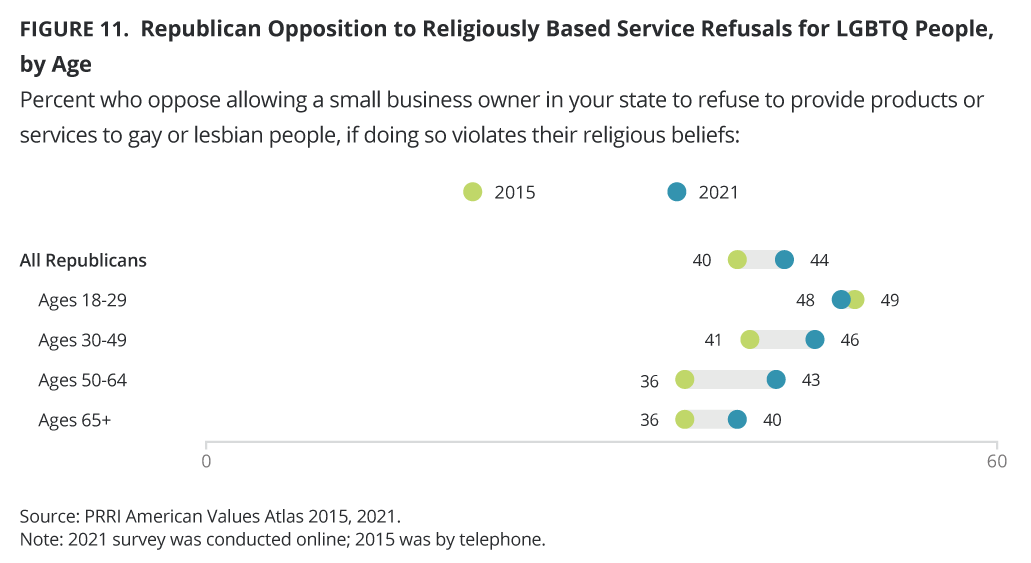
Opposition to religiously based service refusals has remained stable among Republicans ages 18-29 (49% in 2015, 48% in 2021). Opposition has increased among Republicans ages 30-49 (from 41% to 46%), ages 50-64 (from 36% to 43%), and over age 65 (from 36% to 40%). These shifts have shrunk the age gap between young Republicans and senior Republicans from 13 percentage points to eight percentage points.
Republicans of all levels of traditional education have become more likely to oppose religiously based service refusals now than they were in 2015. Republicans with a high school degree or less have increased, from 47% in 2015 to 49% in 2021, along with Republicans with some college experience but no four-year degree (from 38% to 42%), Republicans with four-year college degrees (from 35% to 39%), and Republicans with postgraduate degrees (from 35% to 39%).
The gender gap has widened among Republicans, with women becoming more likely to oppose religiously based service refusals (from 44% in 2015 to 48% in 2021), while the difference in opposition among Republican men has only shifted marginally (from 37% in 2015 to 38% in 2021).
White Evangelical Protestants and Religiously Based Service Refusals
Opposition to religiously based service refusals has increased among all Americans and in most subgroups, but it has not changed among white evangelical Protestants: In both 2015 and 2021, 38% of white evangelicals opposed religiously based service refusals.
There are some key partisan differences. White evangelical Protestant Republicans (32%) are much less likely than white evangelical Protestant Democrats (76%) to oppose refusals. White evangelical Protestant independents look like the group as a whole (39% oppose).
White evangelical Protestants ages 65 and older have become slightly less likely to oppose religiously based service refusals (35%, vs. 40% in 2015), while other age groups have not meaningfully shifted.
Republicans and Same-Sex-Marriage Legality
Republican support for the legality of same-sex marriage has increased dramatically since 2014, from 35% to 48% in 2021. In 2020, support was slightly higher and reached the majority level for the first time (51%).[14]
Support for same-sex marriage has increased from just one-quarter of conservative Republicans in 2014 (26%) to more than four in ten in 2021 (41%). Support among moderate Republicans has increased from a solid majority in 2014 (55%) to two-thirds in 2021 (67%).
White evangelical Protestant Republicans remain the Republican group least likely to support same-sex marriage, though their support has significantly increased, from 16% in 2014 to 25% in 2021. Support for same-sex marriage has increased most among white mainline (non-evangelical) Protestant Republicans (from 47% to 63%), religiously unaffiliated Republicans (from 61% to 75%), Latter-Day Saint Republicans (from 19% to 31%), white Catholic Republicans (from 47% to 58%), and Hispanic Catholic Republicans (from 48% to 60%). Support among Hispanic Protestant Republicans, a group that is largely evangelical, has only increased slightly, from 28% to 33%.
Between 2014 and 2021, support for same-sex marriage among white Republicans has doubled, from 34% to 49%. Support has remained essentially the same among Hispanic Republicans (40% in 2014, 49% in 2021).
A majority of Republicans ages 18-29 supported same-sex marriage in both 2014 (53%) and 2021 (55%). Support has grown substantially among Republicans ages 30-49 (from 37% to 56%), ages 50-64 (from 33% to 47%), and ages 65 and over (from 23% to 38%).
Support for same-sex marriage among Republicans increases with higher levels of formal education, and the education gap is somewhat wider now than it was in 2014. Support for same-sex marriage among Republicans with a high school education or less has seen double-digit increases (from 30% to 46%), with similar growth among Republicans with some college experience (from 36% to 48%), Republicans with four-year degrees (from 37% to 51%), and Republicans with postgraduate degrees (from 36% to 55%).
Support among Republican women has grown, from 38% in 2014 to 51% in 2021, and support among Republican men has increased, from 31% to 46%.
White Evangelical Protestants and Same-Sex-Marriage Legality
Just over one-third of white evangelical Protestants support the legality of same-sex marriage (35%), which is a larger share than in 2014 (28%).
White evangelical Protestants of all parties have become more likely to support same-sex marriage since 2014, including white evangelical Protestant Republicans (25%, up from 16%), independents (45%, up from 34%), and Democrats (64%, up from 45%).
Young white evangelical Protestants have held steady in their support for same-sex marriage (43% in 2021, 45% in 2014). Support for same-sex marriage among white evangelical Protestants has increased to 44% among those ages 30-49 (from 31% in 2014) and 34% of those among ages 50-64 (from 24% in 2014). White evangelicals ages 65 and older have increased slightly (24%, up from 19% in 2014).
Support for same-sex marriage among white evangelicals with four-year college degrees has increased, from 27% in 2014 to 40% in 2021, and from 29% to 40% among white evangelicals with postgraduate degrees. Shifts are smaller among those with a high school degree or less (24% to 31%) or some college experience but no four-year degree (30% to 36%).
White evangelical men and women have both become more supportive of same-sex marriage: Support among white evangelical men has increased from 24% to 31%, and among women from 31% to 38%.
Survey Methodology
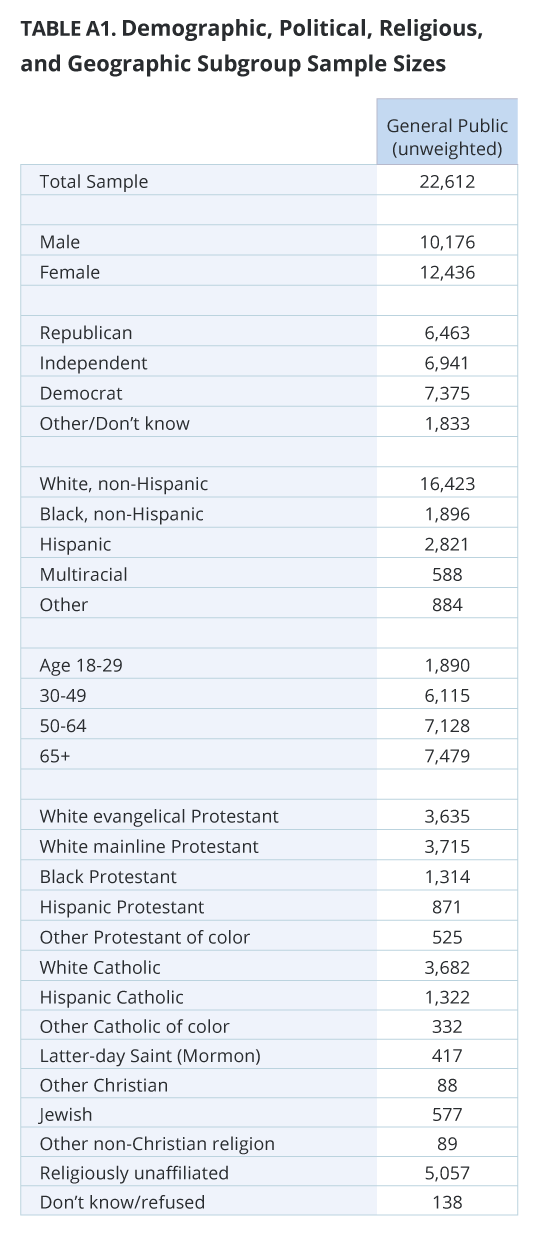 The survey was designed and conducted by PRRI among a total sample of 22,612 adults (age 18 and up) living in all 50 states in the United States, 20,670 of whom are part of Ipsos’s Knowledge Panel. An additional 1,596 were recruited by Ipsos using opt-in survey panels to increase the sample sizes in smaller states. An additional 346 Hispanic Protestants were also recruited using opt-in survey panels. All oversamples are weighted into the full population. Interviews were conducted online March 8-30, June 7-23, August 9-30, and October 18-November 9, 2021. Each of the four waves is weighted separately, but a total weight is used for reporting the combined dataset.
Respondents are recruited to the KnowledgePanel using an addressed-based sampling methodology from the Delivery Sequence File of the USPS – a database with full coverage of all delivery addresses in the U.S. As such, it covers all households regardless of their phone status, providing a representative online sample. Unlike opt-in panels, households are not permitted to “self-select” into the panel; and are generally limited to how many surveys they can take within a given time period.
The initial sample drawn from the KnowledgePanel was adjusted using pre-stratification weights so that it approximates the adult U.S. population defined by the 2019 American Community Survey (ACS). Next, a probability proportional to size (PPS) sampling scheme was used to select a representative sample.
To reduce the effects of any non-response bias, a post-stratification adjustment was applied based on demographic distributions from the ACS. The post-stratification weight rebalanced the sample based on the following benchmarks: age, race and ethnicity, gender, Census division, metro area, education, and income. The sample weighting was accomplished using an iterative proportional fitting (IFP) process that simultaneously balances the distributions of all variables. Weights were trimmed to prevent individual interviews from having too much influence on the final results. In addition to an overall national weight, separate weights were computed for each state to ensure that the demographic characteristics of the sample closely approximate the demographic characteristics of the target populations. The state-level post-stratification weights rebalanced the sample based on the following benchmarks: age, race and ethnicity, gender, education, and income.
These weights from the KnowledgePanel cases were then used as the benchmarks for the additional opt-in sample in a process called “calibration.” This calibration process is used to correct for inherent biases associated with nonprobability opt-in panels. The calibration methodology aims to realign respondents from nonprobability samples with respect to a multidimensional set of measures to improve their representation.
The margin of error for the national survey is +/- 0.8 percentage points at the 95% level of confidence, including the design effect for the survey of 1.7. In addition to sampling error, surveys may also be subject to error or bias due to question wording, context, and order effects. Additional details about the KnowledgePanel can be found on the Ipsos website: https://www.ipsos.com/en-us/solution/knowledgepanel
Endnotes
[1] https://www.supremecourt.gov/opinions/19pdf/17-1618_hfci.pdf
[2] https://freedomforallamericans.org/equality-act/
[3] https://www.congress.gov/bill/117th-congress/house-bill/5
[4] https://www.supremecourt.gov/opinions/17pdf/16-111_j4el.pdf
[5] https://www.npr.org/2022/02/22/1082235826/supreme-court-to-reconsider-religious-objectors-refusal-to-serve-same-sex-couple
[6] https://www.supremecourt.gov/opinions/14pdf/14-556_3204.pdf
[7] https://www.nbcnews.com/nbc-out/out-politics-and-policy/high-court-signals-roe-v-wade-reversal-states-eye-sex-marriage-protect-rcna11645
[8] PRRI’s American Values Atlas was conducted by random digit dial telephone (both landline and cell phone) from 2014 to 2020. In 2021, the project transitioned to a probability-based online panel. In the transition, demographic and religious metrics were compared to ensure the two sources were comparable; however, it is possible that the change in survey mode from telephone to internet caused some small additional changes to the data beyond the usual sampling error that accompanies all surveys. A full methodological description is available in the appendix.
[9] “Other Catholic of color” includes all Catholics who are not white or Hispanic, including Black, Asian American or Pacific Islander, multiracial, Native American, or any other race or ethnicity. “Other Protestant of color” includes all Protestants who are not white, Black, or Hispanic (including Asian American or Pacific Islander, multiracial, Native American, or any other race or ethnicity). Categories were combined due to sample size limitations. Sample sizes for Hindus is n=99, Muslims is n=89, and Orthodox Christians is n=88. Only statistically significant changes from 2015 are reported here.
[10] https://www.lgbtmap.org/equality-maps/non_discrimination_laws
[11] This difference is statistically significant but might have been affected by the mode change described in footnote 8.
[12] Sample sizes for Hindus is n=99, Muslims is n=89, and Orthodox Christians is n=88.
[13] Sample sizes for Hindus is n=89, Muslims is n=75 and Orthodox Christians is n=73.
[14] While the difference between 51% in 2020 and 48% in 2021 is statistically significant, it is small enough that it might have been affected by the mode change described in footnote 8.
Recommended Citation
“Americans’ Support for Key LGBTQ Rights Continues to Tick Upward: Findings From the 2021 American Values Atlas” PRRI (March 14, 2022). https://www.prri.org/research/americans-support-for-key-lgbtq-rights-continues-to-tick-upward-findings-from-the-2021-american-values-atlas/


