American Democracy in Crisis: Civic Engagement, Young Adult Activism, and the 2018 Midterm Elections
The State of the Country
Feelings About the State of the Country
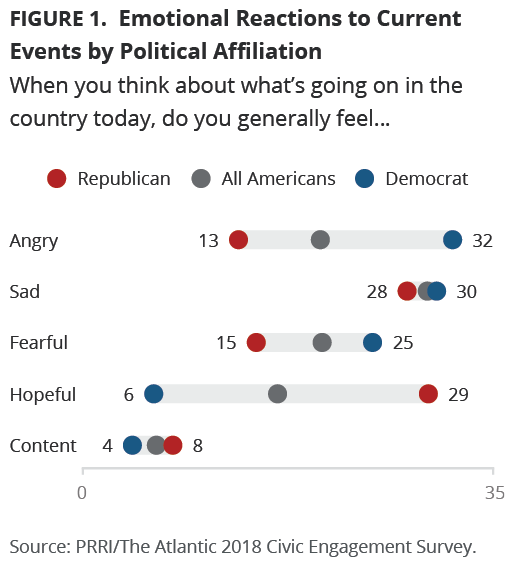
Feelings about the state of the country are primarily negative. Nearly seven in ten (69%) Americans report that, when thinking about what is going on in the country today, they generally feel a negative emotion, including feeling sad (29%), angry (20%), or fearful (20%). By contrast, less than one-quarter (23%) of Americans feel positive emotions, including less than one in five (17%) who say they are hopeful and six percent who say are content.
Overall, Republicans feel more positively about the state of the country than Democrats (37% vs. 10%). Republicans are almost five times as likely as Democrats to say they are hopeful about the country (29% vs. 6%), while Democrats are more likely than Republicans to say they are angry (32% vs. 13%) or fearful (25% vs. 15%). Notably, about three in ten Democrats (30%) and Republicans (28%) say they are sad about what is going on the country.
Seniors (age 65 or older) are slightly more likely than young Americans (age 18-29) to feel sad (32% vs. 26%) or angry (22% vs. 16%) about the things going on today, and they are just as likely to feel hopeful and fearful.
Women are more likely than men to say they are fearful about the state of the country (24% vs. 17%), while men are three times more likely than women to say they are content (9% vs. 3%). Among young Americans there are even more striking gender differences. Young women are more likely than young men to report feeling fearful (28% vs. 18%). By contrast, young men are more likely than young women to feel hopeful (20% vs. 13%) and content (12% vs. 6%). Among seniors, men and women report similar feelings about the country.
Members of different racial and ethnic groups feel differently about what is going on in the country today. White Americans (18%) are more hopeful than Hispanic (13%) or black (12%) Americans, while black Americans are more likely than white Americans to say they are fearful (27% v. 19%). Young Americans feel similarly about what is going on in the country across racial and ethnic groups.
Can Americans Work Together to Solve the Country’s Problems?
Over the past year, Americans have grown more pessimistic about our ability to bridge political differences and address important national problems. More than six in ten (62%) Americans say they are pessimistic that Americans who hold different political views can come together to solve the country’s problems, compared to just 36% who say they feel optimistic. Moreover, pessimism about this topic has increased considerably from last year: just 51% of Americans felt pessimistic, compared to nearly as many (47%) who said they felt optimistic.[1]
Partisans are about equally as likely to feel doubt about the country’s ability to bridge its political differences. About six in ten Democrats (65%) and nearly as many Republicans (60%) feel pessimistic about this, while less than four in ten Republicans (39%) and slightly fewer Democrats (33%) say they are optimistic.
Feelings on this topic do not vary widely by gender; similar majorities of men and women saying they are pessimistic (64% vs. 60%).
There is also little difference across age groups, with similar percentages of young Americans (58%) and seniors (65%) saying they don’t believe the country can unite to fix its problems. However, young women (63%) are nearly ten percentage points more likely than young men (54%) to express pessimism.
Black Americans are less pessimistic than white or Hispanic Americans about the potential for Americans to overcome their political differences. Majorities of white (65%) and Hispanic (58%) Americans feel pessimistic about the country’s ability to set aside political differences to solve problems, but less than half (48%) of black Americans are pessimistic, with equal numbers (48%) saying they feel optimistic.
Moreover, young black Americans (50%) say they feel more optimistic than young Hispanic (38%) and young white Americans (35%) about the possibility of national unity to address pressing issues in the country.[2]
Can People in Your Community Work Together to Solve Local Problems?
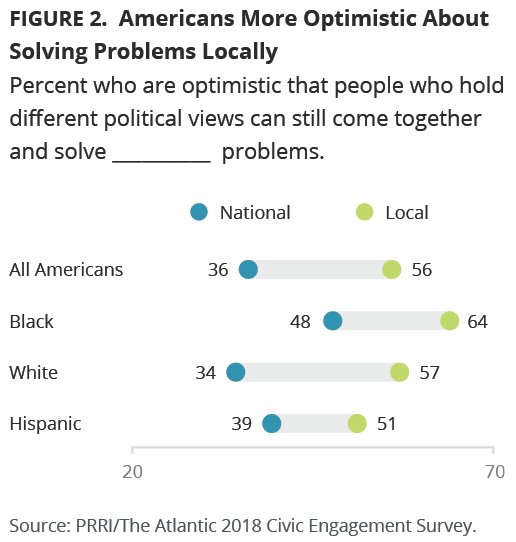
Despite their pessimism at the national level, more Americans feel confident that people in their community can bridge political divides to solve local problems. A majority (56%) of Americans say they are optimistic that people in their communities who hold different political views can still come together and solve the country’s problems, while less than half (42%) say they disagree.
There is little partisan disagreement. Majorities of Democrats (55%) and Republicans (62%) say they believe Americans can overcome political difference.
Women are somewhat more optimistic than men about their communities’ ability to come together and tackle problems. Six in ten (60%) women, compared to just over half (52%) of men, say they believe that people in their community can get beyond their political differences.
Similar numbers of young Americans (55%) and seniors (57%) are optimistic about their community’s capacity to overcome political divisions and solve problems.
There is a sharp racial and ethnic divide on this question. Nearly two-thirds (64%) of black Americans feel optimistic about this, compared to 57% of white Americans and 51% of Hispanic Americans who feel the same. Notably, only one-third (33%) of black Americans doubt their local communities’ ability to come together and solve problems, compared to more than four in ten white Americans (42%) and nearly half of Hispanic Americans (47%). There are no significant racial or ethnic differences among young Americans.
Political Perceptions of President Donald Trump and the Political Parties
Views of President Trump
More than six in ten (62%) Americans say their overall opinion of President Donald Trump is unfavorable, including nearly half (49%) who say their opinion is very unfavorable. Only 35% of Americans have a favorable opinion of Trump, including 13% who say their opinion is very favorable. Opinions of Trump have remained stable since June 2018, when 60% expressed an unfavorable view of him.[3]
Young Americans are more likely than seniors to have an unfavorable opinion of President Trump. Seven in ten (70%) young Americans say they have an unfavorable view of Trump, but just over half (52%) of seniors agree. Notably, 54% of young Americans—including 44% of white, 67% of Hispanic, and 74% of black young Americans[4]——hold a very unfavorable view of Trump. Among young Americans, women are more likely than men to have unfavorable views of Trump (75% vs. 65%).
An overwhelming majority of Republicans (78%) report having a favorable overall opinion of Donald Trump, including over one-third (35%) who say they have a very favorable opinion of him. By contrast, only six percent of Democrats view the president favorably. More than nine in ten (91%) Democrats have an unfavorable opinion of the president, including 79% who hold a very unfavorable view. More than six in ten (64%) independents view the president unfavorably.
With the exception of white evangelical Protestants, majorities of most major religious groups have a poor opinion of the president. The majority of black Protestants (93%), religiously unaffiliated Americans (78%), Hispanic Catholics (76%), non-Christian religious Americans (74%), white Catholics (52%), and white mainline Protestants (52%) express a negative opinion of Trump. By contrast, nearly three-quarters (73%) of white evangelical Protestants have a favorable view of Trump, including 31% of have a very favorable view.
Views of The Republican and Democratic Party
Though at least half of Americans have an unfavorable opinion of both the Republican and Democratic parties, the Democrats are seen more favorably. Nearly six in ten (59%) Americans have an unfavorable opinion of the Republican Party, compared to half (50%) who view the Democratic Party unfavorably. While less than four in ten (37%) report a favorable view of the Republican Party, nearly half (47%) say the same about the Democratic Party.
Views of the parties vary sharply by age. Young Americans are significantly more likely to view the Democratic Party favorably (52%) than they are to view the Republican Party favorably (31%). By contrast, seniors are about equally likely to view the parties favorably (44% vs. 48%).
There are also notable gender gaps on views of the parties. While roughly equal numbers of women and men have positive feelings about the Republican Party (37% vs. 37%), women are more likely than men to hold this view about the Democratic Party (51% vs. 44%).
There are also gender gaps among young Americans. Young women are less likely than young men to hold favorable opinions about the Republican Party (28% vs. 35%) but are more likely to hold favorable views about the Democratic Party (56% vs. 48%).
The 2018 Elections
Critical Issues
Heading into the 2018 midterms, Americans are more likely to rank health care as important than any other issue, with nearly six in ten (58%) Americans saying that health care is a critical issue to them personally. By contrast, less than half say the same about gun policy (46%), immigration (46%), the growing gap between rich and poor (38%), and climate change (38%). About three in ten say that racial inequality (35%), the cost of higher education (33%), and abortion (29%) are critical issues. Only about one in five identify gender equality (23%) and LGBT rights (17%) as critical issues – fewer than those who say these issues are not that important (31% and 45%, respectively).
With two exceptions, there are surprisingly few generational differences in issue priorities. Young Americans and seniors are each about as likely as the other to say that health care (55% vs. 58%), gun policy (44% vs. 49%), the growing gap between rich and poor (39% vs. 34%), racial inequality (36% vs. 34%), climate change (40% vs. 36%), abortion (31% vs. 30%), gender equality (26% vs. 23%), and LGBT rights (18% vs. 16%) are critical issues.
However, there are stark divides between young Americans and seniors on both immigration and the cost of higher education. Seniors (age 65 and older) are more likely than young Americans (ages 18 to 29) to say immigration is a critical issue to them personally (57% vs. 39%). By contrast, younger Americans are more likely than seniors to prioritize rising education costs (39% vs. 32%).
Women are more likely than men to prioritize several issues, including health care (61% vs. 54%), gun policy (50% vs. 43%), gender equality (28% vs. 18%), and LGBT rights (20% vs. 14%).
Among young Americans, women are more likely than men to prioritize gun policy (50% vs. 39%), immigration (46% vs. 32%), racial inequality (43% vs. 30%), cost of higher education (43% vs. 35%), gender equality (34% vs. 17%), and LGBT rights (22% vs. 13%). Young women and men similarly prioritize the growing gap between rich and poor, health care, and climate change.
With only one exception, Democrats are more likely than Republicans to prioritize health care (72% vs. 42%), gun policy (60% vs. 38%), racial inequality (57% vs. 16%), the growing gap between rich and poor (55% vs. 17%), climate change (54% vs. 15%), the cost of higher education (40% vs. 23%), gender equality (37% vs. 10%), and LGBT rights (29% vs. 7%). By contrast, Republicans are more likely than Democrats to prioritize immigration (59% v. 42%).
Likelihood of Voting
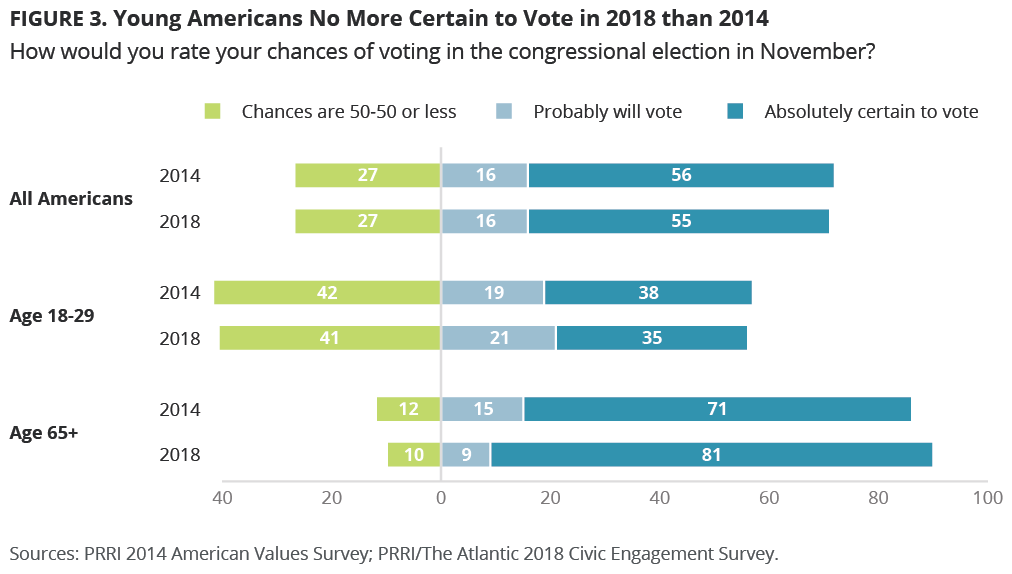
More than half (55%) of Americans report that they are absolutely certain to vote, and an additional 16% say they will probably vote. About one-quarter (27%) put their odds of voting at 50-50 or less, including 12% who say they are definitely not voting.
Consistent with historical turnout patterns, seniors are much more likely than young Americans to report they intend to vote in the upcoming midterm elections. While more than eight in ten (81%) seniors say they are absolutely certain to vote, just 35% of young Americans say the same. At roughly the same point in the 2014 midterm election cycle, a similar number (38%) of young Americans reported that they were absolutely going to vote.[5]
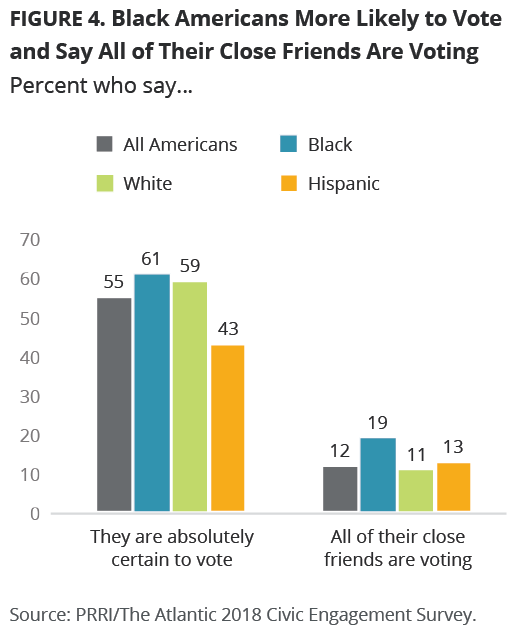
Across race and ethnicity, there are big differences in likelihood to vote. While about six in ten black (61%) and white (59%) Americans say they are absolutely certain to vote, only about four in ten (43%) Hispanic Americans say the same. Among whites, those with a four-year college degree are significantly more likely than those without one to report they are certain to vote (74% vs. 52%).
Among young Americans, there are few identifiable differences in reported likelihood of voting, and no differences between racial and ethnic groups. Similarly, young women and men are about as likely to say they are going to vote. Nevertheless, young white men are slightly more Among young Americans, there are few identifiable differences in reported likelihood of voting, and no differences between racial and ethnic groups. Similarly, young women and men are about as likely to say they are going to vote. Nevertheless, young white men are slightly more likely than young white women to say they have a 50-50 chance or less of voting (52% vs. 33%). Among nonwhites, there was no substantive difference between young men and women.
Close Friends Voting
A majority of Americans report that all or most of their close friends will be voting in the 2018 midterms. About one in ten (12%) say that all their close friends will be voting, while nearly half (46%) say most of them will be voting. About four in ten (41%) report that half or less than half of their friends will turn out to vote in the midterm election – including 6% who say that none of their friends will.
Seniors are much more likely than young Americans to report that their close friends will be voting in the 2018 midterm election. More than eight in ten seniors say that all (18%) or most (63%) of their close friends will head to the polls; by contrast, only about one-third of young American report that all (7%) or most (29%) of their friends will do the same. About six in ten (61%) young Americans report that half or less than half of their friends will vote – including 12% who say that none will vote.
There are racial and ethnic divides on this question. Almost one in five (19%) black Americans report that all their friends will vote in the midterms, compared to about one in ten Hispanic (13%) and white (11%) Americans. However, Hispanic Americans (48%) are more likely than white (38%) or black (33%) Americans to say that half or less than half of their close friends will cast ballots in the midterms.
Young black Americans (17%) are more likely than young Hispanic (7%) or white (4%) Americans to say that all of their close friends will vote in November. Young women are more likely than young men to say most or all of their friends are going to vote this year (42% vs. 31%).[6]
Vote Preference in the Congressional Midterm Elections
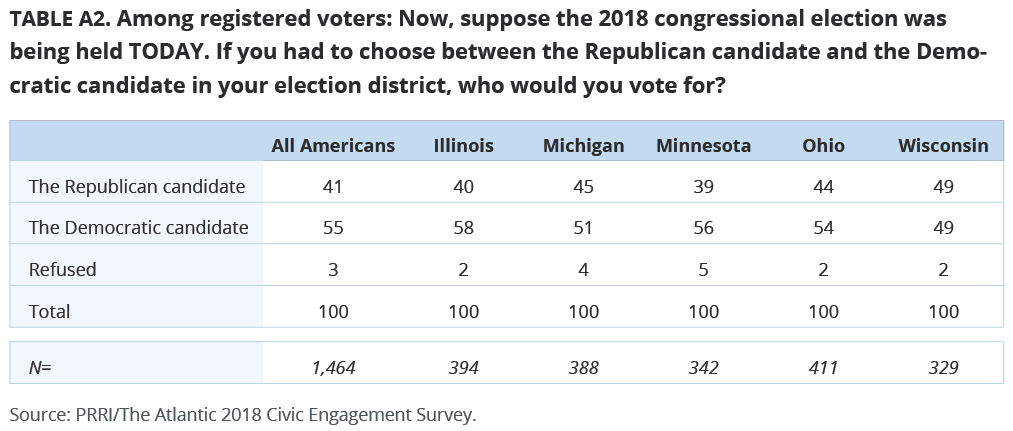
Heading into November, Democratic candidates have a fourteen-point advantage over Republican candidates. More than half (55%) of registered voters say that they would choose the Democratic candidate on the ballot if the election were held today, while about four in ten (41%) say they would vote for the Republican.[7].
Today, registered voters are more likely to say they prefer Democratic candidates than this time in 2014. In 2014, registered voters were split on their choice for candidates, with roughly equal numbers saying they would pick the Democratic candidates (45%) or the Republican candidates (43%).[8]
Young Americans are much more likely than seniors to prefer Democrats over Republicans. More than six in ten (61%) young Americans say they prefer the Democratic candidate, while about one-third (35%) prefer the Republican candidate. By contrast, seniors are essentially split between the Democratic candidates (51%) and the Republican candidates (48%).
The divide is much wider among people of color, with the vast majority (83%) of black registered voters and three-quarters (75%) of Hispanic voters saying they would support Democratic candidates if given the choice. By contrast, white registered voters are more likely to favor Republican candidates over Democratic candidates (53% vs. 45%). Among white Americans, those without a four-year college degree favor Republicans over Democrats (56% vs. 41%), while the opposite is true for whites with one (47% vs. 53%).
These same racial and ethnic divides exist among young Americans. More than three-quarters (76%) of young Hispanic registered voters prefer a Democratic candidate compared to 21% who prefer a Republican. By contrast, about equal numbers of young white registered voters say they prefer the Democratic (49%) and Republican candidates (47%).[9]
Notably, the educational divide among whites is much larger among young Americans. Young Americans without a four-year college degree are more likely to favor the Republican candidate over the Democratic candidate (52% vs. 43%), while those with a college education are much more Democratic leaning (35% vs. 63%).
Major Problems with America’s Election System
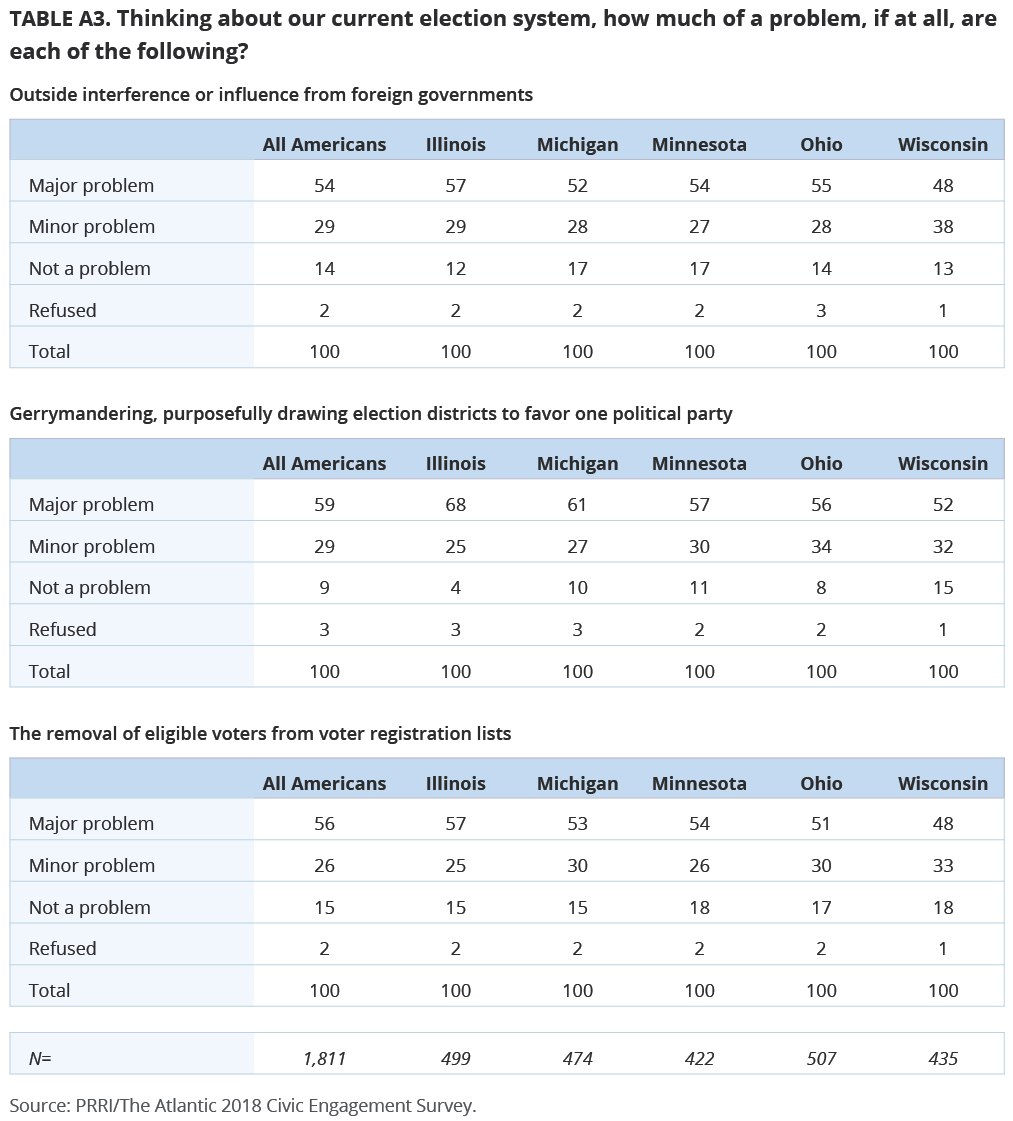
When asked about problems with the country’s current election system, Americans express a variety of concerns. Majorities of Americans say that gerrymandering (59%), the removal of eligible voters from registration lists (56%), and outside interference or influence from a foreign government (54%) are major problems.
Seniors are more likely than young Americans to say that outside interference or influence from a foreign government (66% vs. 47%) and the removal of eligible voters from registration lists (64% vs. 50%) are major problems. Seniors and young Americans are about equally likely to say gerrymandering is a major problem (60% vs. 55%).
Black and Hispanic Americans are more likely than whites to say that outside interference or influence from a foreign government (70%, 63%, and 49%, respectively) and removing eligible voters from voter registration lists (74%, 60%, and 52%, respectively) are major problems. There are no major differences across racial and ethnic groups on the issue of gerrymandering.
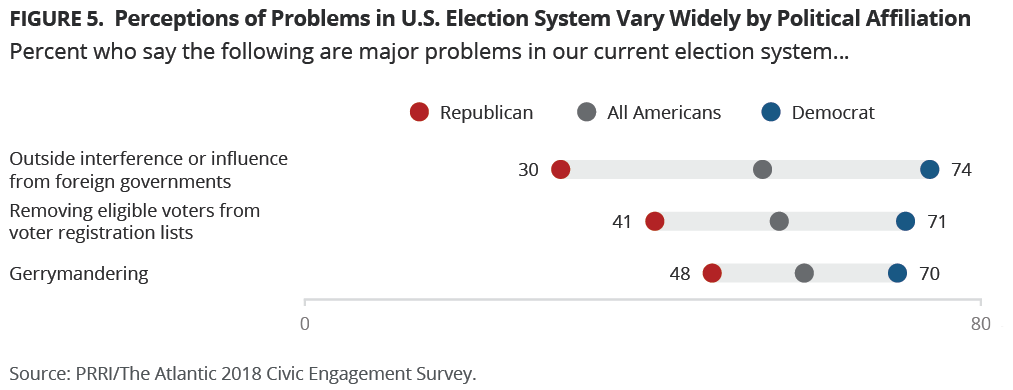
There are stark partisan divides on these issues. Democrats are more likely than Republicans to say gerrymandering (70% vs. 48%), removing eligible voters from rolls (71% vs. 41%), and outside interference (74% vs. 30%) are major problems with the current election system. Notably, black Democrats (79%) are more likely than Hispanic (68%) or white (65%) Democrats to say removing eligible voters from registration lists is a major problem.
Lowering the Voting Age to 16
Most Americans are opposed to lowering the voting age to 16. More than eight in ten (81%) oppose lowering it to 16, while less than one in five (16%) agree that the voting age should be lowered.
Young Americans agree that the voting age should not be lowered, although they are somewhat more likely than seniors to agree with this policy change. Only about one in five (19%) young Americans think sixteen-year-olds should be allowed to vote, compared to just 9% of seniors who agree. Among young Americans, almost three in ten (29%) black Americans favor this policy, compared to 22% of Hispanic and 16% of white Americans.[10]
Democrats are also much more likely than Republicans to agree with lowering the voting age to 16. One-quarter (25%) of Democrats and just six percent of Republicans agree; the partisan division is similar among young Americans.
Civic and Political Participation
Types of Civic and Political Participation
Most Americans do not report high levels of civic engagement across the last year. Less than three in ten Americans say they have signed an online petition (28%), boycotted or purposefully bought something to send a message (25%), posted something on social media about an issue that matters to them (23%), liked or followed a campaign or organization online (22%), contacted an elected official (19%), or donated money to a campaign or cause (19%) in the last 12 months. Even fewer Americans say they have volunteered for a group or cause (14%), encouraged others to be politically active on social media (13%), attended a community meeting such as school board or city council (12%), or attended a public rally or demonstration (8%).
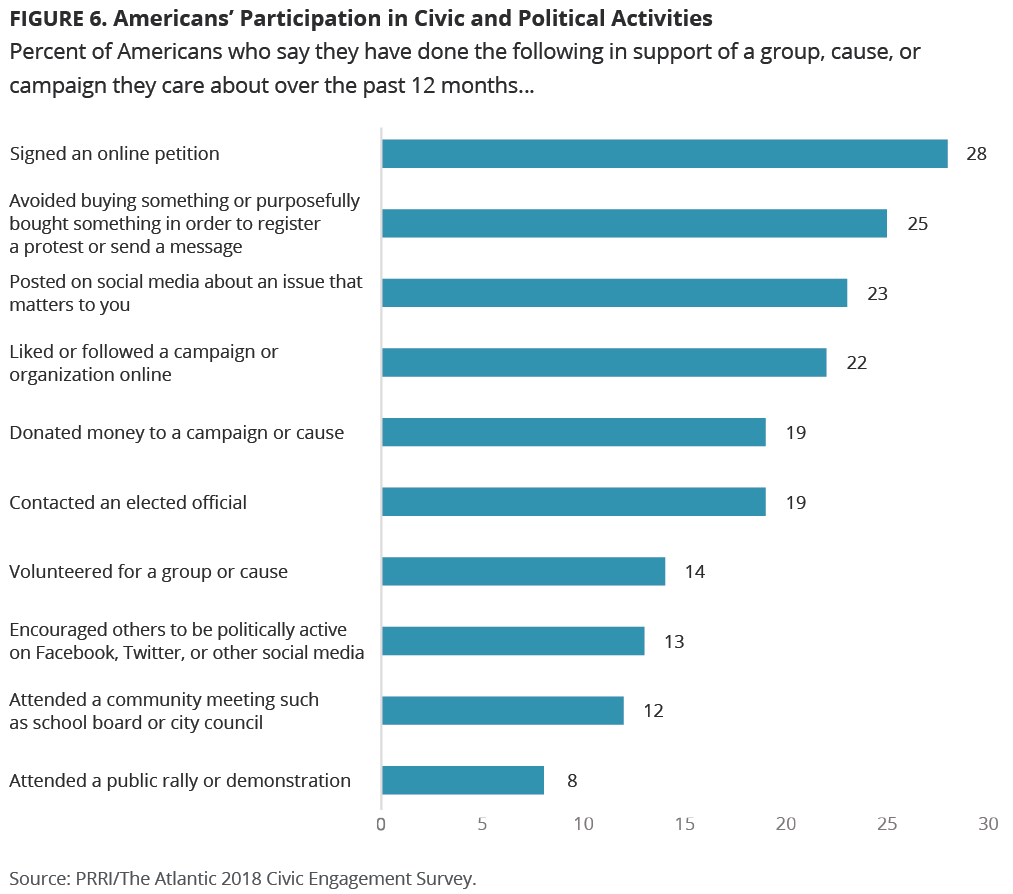
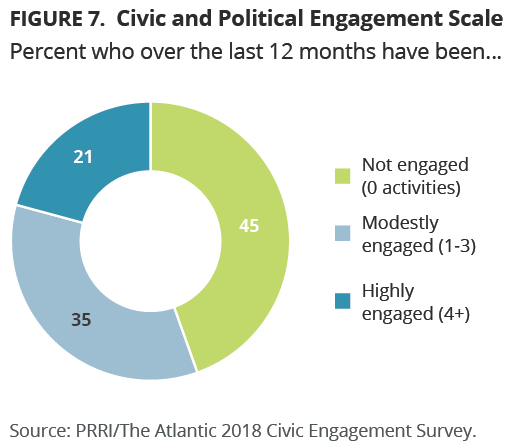
In an effort to provide a more complete picture of Americans’ civic and political engagement, we developed the Civic and Political Engagement Scale. This composite scale categorizes individuals based on how many of these activities they engaged in during the prior 12 months.
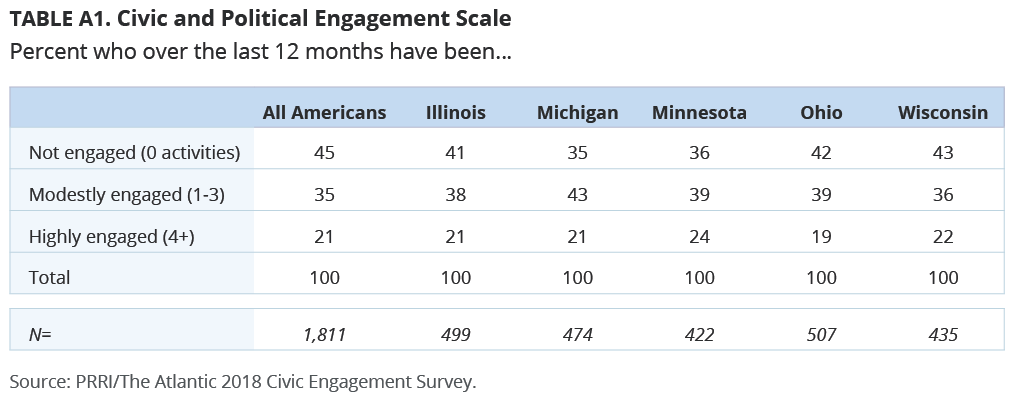
Almost half (45%) of Americans report not being civically or politically engaged at all, having done none of these activities over the past year. A little over one-third (35%) report being modestly engaged, having done between one to three of these activities in the last year. Around one in five (21%) are highly engaged, having participated in at least four of these activities over the last 12 months.
There are subtle but notable differences across generations in civic and political engagement. Seniors are more likely than young Americans to report high levels (23% vs. 18%) or modest (42% vs. 34%) levels of civic and political engagement. Nearly half (48%) of young Americans, compared to only 35% of seniors, report no civic and political participation in the last 12 months. Yet even on measures of digital civic engagement, there are few generational differences. For instance, young Americans are about as likely as seniors to have signed an online petition (28% vs. 29%) or post something on social media about an issue that matters to them (24% vs. 23%) in the last year.
Levels of civic and political engagement also vary by political party. Nearly three in ten (29%) Democrats report being highly engaged in the last 12 months, compared to less than one in five Republicans (18%) and independents (15%). This gap is even wider among young Americans: While a similar number of young Democrats (28%) report being highly engaged, only 10% of young Republicans report the same level of civic and political participation.
When it comes to gender, women are somewhat more likely than men to report high levels of civic and political activities in the last year (23% vs. 18%), but the gap varies considerably by age. Young women (24%) are twice as likely as young men (12%) to say they are highly engaged. In fact, a majority (56%) of young men, compared to 40% of young women, say they haven’t taken any civic or political actions within the last 12 months. By contrast, senior men are about as likely as their female counterparts to be highly involved in civic or political activity (27% vs. 21%). More than four in ten (41%) senior women report no civic or political activity within the last 12 months compared to 28% of senior men.
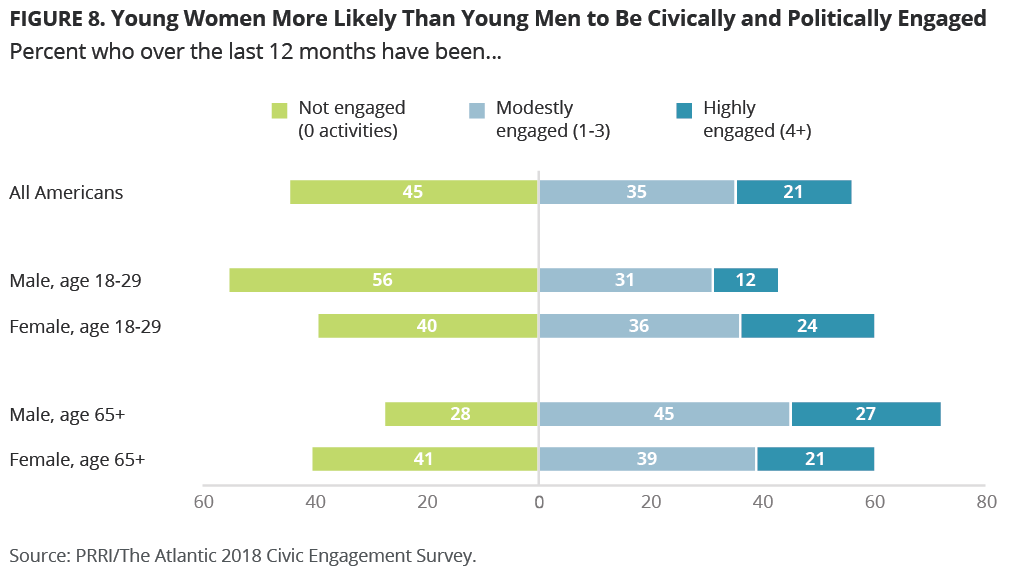
This gender gap, however, does not cut across all partisan lines. While Democratic women are more likely to be highly engaged than Democratic men (33% vs. 24%), Republican women and men are about as likely to have been highly involved in civic or political activity over the last 12 months (17% vs. 20%).
Notably, there are no differences by race or ethnicity on civic engagement. Similar numbers of black (22%), white (21%), and Hispanic (20%) Americans have reported high levels of civic and political participation over the last 12 months.
Online Activism: The Youth Gender Gap
Online activities are generally more common than those occurring offline. Although young women report greater activism overall than young men, much of that activity is taking place online. More than one-third (35%) of young women, compared to 21% of young men, report having signed an online petition in the last 12 months. Similarly, nearly three in ten (29%) young women, compared to only 18% of young men, report having posted on social media about an issue that matters to them. But young women are about as likely as young men to report having contacted an elected official (12% vs. 12%), donated to a campaign or cause (13% vs. 10%), or attended a rally or demonstration (11% vs. 6%).
Increasing Involvement?
Relatively few Americans say their interest in civic or political activities has increased in the last two years. About one in five (20%) say they have become more likely to take part in civic or political activities, but three in ten (30%) say they have become less likely to be engaged over the past two years. Almost half (48%) report that their engagement in civic or political activities hasn’t changed over this period.
There is no appreciable difference between young Americans and seniors appreciably on this question.
Women are somewhat more likely than men to report greater interest in civic or political activities (22% vs. 17%). This gender gap widens among young Americans: more than one-quarter (27%) of young women say they have become more interested in engaging in civic or political activities since 2016, compared to less than one in five (17%) young men. Among seniors, men and women are about as likely to say they have become more interested in engaging in such activities.
Democrats are more likely than Republicans to report an increased interest in political and civic engagement in the last two years. Nearly three in ten (28%) Democrats, but only 13% of Republicans, say their interest in engaging in politics has increased over the past two years. Yet while Democratic women are more likely than their male counterparts to report an increase in politics, interested (32% vs. 23%), almost no gap exists between Republican women (14%) and men (12%) on that question.
Careers in Public Office and Government Service
Over the last two years, very few Americans report an increased interest in running for public office or considering a career in government service. Only a small number of Americans report they have become more likely to consider running for public office (6%) or to consider a career in government service (6%) in the last two years. Far more say they are less likely to pursue a career in public office (42%) or government service (42%).
While there are no appreciable differences between women and men overall on these questions, more young women than young men say they are now less likely to pursue a career in public office (41% vs. 34%).
Who Represents Your Values and Interests?
More than six in ten (62%) Americans say they feel somewhat or very well represented by nonprofit groups advocating change on issues they care about. However, less than half say the same about elected officials at the state or local level (46%), the Democratic Party (44%), religious leaders (42%), labor unions (37%), or the Republican Party (35%). Less than three in ten (28%) feel their interests and values are well represented by national elected officials.
Nonprofit Groups
Americans feel most well represented by nonprofit groups advocating change on issues they care about. More than six in ten (62%) say these groups represent their interests and values in public debates very or somewhat well.
Nearly three-quarters (74%) of Democrats, compared to over half (55%) of Republicans, say these groups represent their interests somewhat or very well.
Local Elected Officials
Americans feel that their interests and values are relatively well represented by elected officials serving at the state or local level. Close to half (46%) of the public believe that elected officials at the state or local level do a good job representing them well, while half (50%) say these officials do not represent them well.
Young Americans and seniors are split in their opinions about state and local politicians. A majority (53%) of seniors, compared to just 42% of young Americans, feel local elected officials represent their concerns.
Women are more likely than men to say they feel well represented by elected officials at the local level (49% vs. 43%) but opinions diverge by age. The gender gap is notable among senior women (59%) and men (46%), but mostly disappears among young women and men (43% vs. 40%).
Partisans are also more likely to feel that their interests and values are represented at state or local level. A majority of Republicans (54%) and Democrats (51%) feel well-represented by their local elected officials. However, only 36% of independents say local or state officials represent them well.
The Political Parties
Americans generally do not feel either major political party represents them well. Less than half (44%) of Americans say the Democratic Party represents their interests and values in public debates well, while over half (53%) disagree. Even fewer Americans (35%) feel the Republican Party represents them, while more than six in ten (61%) say the GOP does not represent their interests and values well.
While similar numbers of seniors and young Americans feel the Democratic Party adequately represents them (45% vs. 47%), seniors are far more likely than young Americans to say that the Republican Party represents their interests well (45% vs. 29%).
Views sharply diverge by race and ethnicity as well. Roughly four in ten (43%) white Americans, and far fewer Hispanic (25%) and black (8%) Americans, say the GOP represents their interests and values well. A similar number of white Americans (37%), but more than half (53%) of Hispanic and 72% of black Americans, report that they feel well-represented by the Democratic Party.
Perhaps expectedly, there are significant divides on the question, based on partisan affiliation. Overwhelming majorities of Democrats (81%) and Republicans (81%) feel well represented by their own party; by contrast, roughly three in ten independents feel the same about the Democratic (32%) and Republican (30%) parties.
While older and younger partisans feel just about as well represented by their respective parties, there are significant age gaps among independents. Older independents (age 50 and older) are much likelier than their younger (age 18-29) counterparts to say the Republican Party represents them well (40% vs. 28%). By contrast, older and younger independents (35% vs. 32%) feel just about as well represented by the Democratic Party.
Religious Leaders
Americans do not generally feel well represented by religious leaders. More than four in ten (42%) Americans say they feel very or somewhat well represented by religious leaders, while more than half (54%) disagree.
Almost half (49%) of seniors say their interests and values are well represented by religious leaders, less than four in ten (38%) young Americans feel the same way.
Republicans, however, are substantially more likely than Democrats to feel well represented by religious leaders (59% vs. 41%). While there are no notable age differences among Republicans, older Democrats (age 50 and older) are significantly more likely than their younger counterparts (age 18-29) to feel well represented by religious leaders (44% vs. 35%).
How well Americans feel represented by religious leaders varies significantly by their religious affiliation. More than three-quarters (76%) of white evangelical Protestants and almost six in ten (57%) black Protestants say that religious leaders represent their interests and values well. Conversely, less than half of Catholics (46%) and white mainline Protestants (44%) say the same. Just 13% of the religiously unaffiliated say religious leaders represent them well.
Labor Unions
Americans also do not feel particularly well represented by labor unions. Only 37% say labor unions represent their interests and values in public debates somewhat or very well, while over half (59%) disagree. These feelings do not vary across gender or generations.
There are sharp partisan divides on feelings of being represented by labor unions. A majority of Democrats (52%), compared to only 33% of political independents and 26% of Republicans, report feeling well represented by labor unions.
Nearly half (47%) of black Americans and more than four in ten (43%) Hispanic Americans say unions represent their interests and values well, compared to only about one-third (34%) of whites. Whites without a four-year college degree are not more likely than whites with one to feel well represented by labor unions (33% vs. 36%).
National Elected Officials
No group or institution is rated lower than national elected officials. Less than three in ten (28%) Americans believe that national elected officials represent their interests and values in public debates satisfactorily. Two-thirds (67%) say they these officials do not represent them well during public debates.
Young Americans are modestly less likely than seniors to say they feel well represented by national politicians (27% vs. 34%).
While similar numbers of men and women report feeling well represented by national elected officials (31% vs. 27%), the gender gap is larger among young Americans. Young women are less likely than young men to say elected officials represent their concerns and interests (24% vs. 30%).
How well Americans feel represented by national elected officials varies significantly by their political affiliation. Republicans are more likely than Democrats to say that elected officials in Washington represent their interests and values in public debates (41% vs. 29%). However, a majority of both Democrats (68%) and Republicans (56%) do not feel well represented by these elected officials. Notably, only one in five (20%) independents feel well represented by national elected officials.
Reasons Why Young Americans Engage in Civic and Political Activities
Most Effective Way to Make Change?
Most Americans agree that voting is the most effective method for bringing about change on issues they care about. Nearly two-thirds (64%) of Americans say voting regularly in elections is the most effective thing they can do. Meanwhile, fewer than one-third list another activity – including volunteering for a group or cause (12%), contacting an elected official (9%), being active on social media (5%), participating in a public rally or demonstration (3%), or donating money to a civic organization or political group (3%) – as the most effective way to make change.
There is a marked generation gap on perceptions of political efficacy. While about eight in ten (78%) seniors say voting regularly in elections is the most effective thing they can do to bring about change, just half (50%) of young Americans agree. By contrast, young Americans are more likely than seniors to say volunteering for a cause (19% vs. 4%) or being active on social media (9% vs. 1%) is most effective in creating change. Notably, young women (46%) are less likely than young men (55%) to agree that voting is the most effective thing they can do.
Hispanic Americans are less likely to see voting as the most influential mechanism for change. A majority (55%) of Hispanic Americans believe in the power of the ballot, a view shared by more than six in ten black (62%) and white (67%) Americans. However, Hispanic Americans are about twice as likely as black and white Americans to say being active on social media about issues they care about is the most effective thing they can do to make change (10% vs. 5% and 4%, respectively). They are also more likely than black and white Americans to say participating in a rally or demonstration is the most effective approach (9% vs. 3% and 1%, respectively).
Political independents are far less likely than partisans to say voting is the most effective way to create change. About half (54%) of political independents say the best way to make change is by voting regularly in elections; by contrast, more than two-thirds (68%) of Democrats and three-quarters (75%) of Republicans say the same.
Local vs. National Involvement
Across all demographic groups, majorities of Americans agree: To make change happen, it is generally more important to get involved in local issues than national issues. More than six in ten (62%) Americans say it is more important to act locally than nationally, while roughly one-third (35%) disagree.
Black Americans are more likely than other racial and ethnic groups to hold this view. Seven in ten (70%) think it is more effective to be active locally, but fewer white (62%) and Hispanic (55%) Americans concur. However, there are significant divisions among whites by educational attainment. Whites with a four-year college degree are more likely than those without one to say local action is more effective than national action (70% vs. 59%).
Republicans are somewhat more likely than Democrats to say local activism is important. Nearly seven in ten (68%) Republicans say engagement on local matters is more important than acting on national ones, a view shared by 60% of Democrats. This divide is primarily driven by the difference between Republican men and Democratic men: More than three-quarters (76%) of Republican men say local action is more effective than national action, compared to just 61% of Democratic men. Equal proportions of Republican and Democratic women say the same (60%).
Young Americans do not differ appreciably from older Americans on this issue. Roughly six in ten (59%) young Americans and 64% of seniors say change occurs most effectively through action at the local level.
Reasons Not to Get Involved
Not Knowing Enough About the Issues
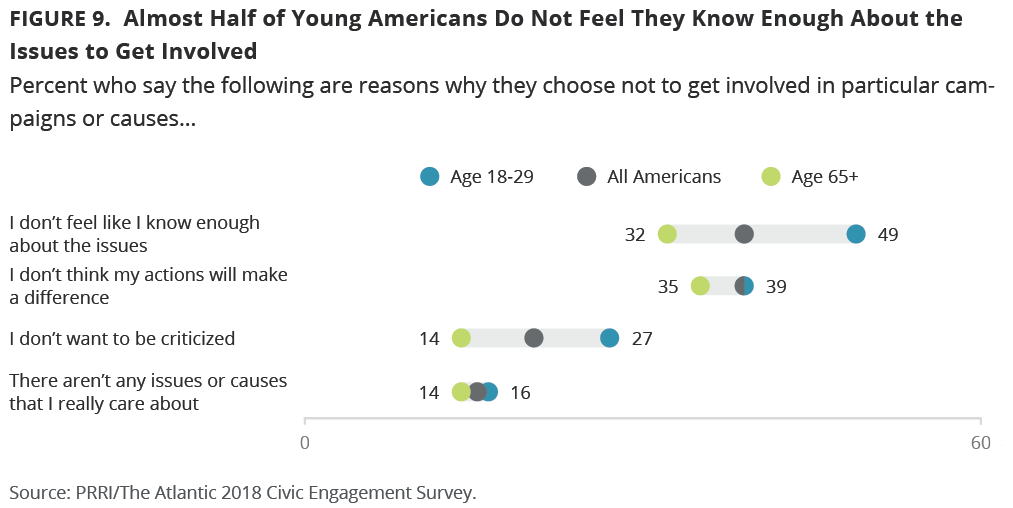
Nearly four in ten (39%) Americans say they do not get involved in social causes or campaigns because they feel like they lack information about the issues. Nearly six in ten (59%) say this does not apply to them.
Young Americans in particular are likely to cite “not knowing enough” as a reason to abstain. Nearly half (49%) of young Americans say they do not know enough about the issues to get involved, a view shared by fewer than one-third (32%) of seniors.
Women are more likely than men to say not knowing enough about the issues keeps them from being politically or civically active. More than four in ten (43%) women say this, a view shared by roughly one-third (35%) of men. This gender gap is consistent among young Americans, where women are more likely than men to say they choose not to get involved because they do not know enough (52% vs. 45%).
Nearly half (47%) of Hispanic Americans say they do not get involved because of lack of knowledge, a view shared by fewer than four in ten white (38%) and black (34%) Americans. Notably, young black (35%) Americans are far less likely than young Hispanic (51%) and white (52%) Americans to cite not knowing enough about the issues as a reason they do not get involved.[11]
Actions Will Not Make a Difference
About four in ten (39%) Americans say they do not get involved because they do not believe it will make a difference, while about six in ten (59%) say this does not apply to them.
Young Americans and seniors are about equally likely to say they do not think their actions will make a difference (39% vs. 35%).
There are no significant gender differences on this question among the general public or among young Americans.
Feeling like their actions will not make a difference is much more common among Hispanic Americans than those in other racial and ethnic groups. Nearly half (47%) of Hispanic Americans, compared to 38% of white Americans and 31% of black Americans, say they do not get involved because they do not believe it will make a difference.
Fear of Criticism
One in five (20%) Americans say they do not engage in campaigns and causes because they do not want to be criticized. About eight in ten (78%) Americans say this belief does not apply to them.
Young Americans are almost twice as likely as seniors to say they do not participate in campaigns or causes for fear of criticism (27% vs. 14%). Young women are much more likely to express this fear than young men (34% vs. 21%). While young white and nonwhite women are about as likely to express this sentiment (36% vs. 30%), young white men are less likely than young nonwhite men to say they do not get involved because of a fear of criticism (17% vs. 27%).
Democrats and Republicans are about equally likely to cite fear of criticism as a reason for not getting involved in campaigns and causes (20% vs. 23%)
Hispanic Americans are about twice as likely as black and white Americans to avoid involvement in civic or political campaigns because they do not want to be criticized (32% vs. 17% and 16%, respectively).
Apathy: There Are No Issues I Care About
Americans are much less likely to cite apathy as a reason to abstain from participating in campaigns or supporting causes. Only 15% say there are no issues or causes they really care about, while more than eight in ten (83%) say this does not apply to them.
Seniors and young Americans are about equally likely to cite this as a reason for not getting involved.
Hispanic Americans are more likely than white and black Americans to say they are not involved because there are no issues they care about. Nearly one-quarter (23%) of Hispanics say this applies to them, a view shared by only about one in ten blacks (14%) and whites (11%).
There are no significant gender or partisan differences on this topic.
Formative Civic Engagement Experiences
The frequency with which Americans, while growing up, engaged in various civic activities with their parents varies widely. The most common childhood experience is talking about social problems or political issues at home, with half (50%) of Americans saying they had that experience. More than four in ten (42%) say they volunteered with their church or religious congregation growing up, and roughly one-third (34%) say they’ve accompanied one or both of their parents to the polls on Election Day. Significantly fewer report having attended a community meeting such as a school board or city council meeting (23%) or a public rally or demonstration (12%) as a child.
Discussing Societal Problems at Home
Young Americans are more likely than seniors to report talking about social problems or political issues at home during childhood. Nearly six in ten (57%) young Americans but fewer than half (48%) of seniors say they discussed politics at home while growing up. While young women and men are about as likely to say they had such discussions with their family growing up (57%), senior women are significantly less likely than senior men to report having had these conversations with their parents (40% vs. 58%).
Majorities of Republicans (53%) and Democrats (52%) say they talked about political issues while growing up. By contrast, fewer than half (46%) of political independents say the same.
Black Americans stand out in the extent to which their parents discussed social or political issues with them when they were kids. Six in ten (60%) black Americans say they had this experience, compared to 52% of white Americans and four in ten (40%) Hispanic Americans.
Among whites, there are notable educational divides. Nearly two-thirds (65%) of whites with a four-year college degree, compared to less than half (47%) of whites without one, say they discussed social and political issues at home growing up.
Volunteering With a Church or Religious Congregation
Despite declining levels of religious affiliation among young Americans,[12], they are about as likely as seniors to report they volunteered with their church or religious congregation during childhood. Roughly four in ten young Americans (39%) and seniors (44%) say they volunteered with their religious congregation as children. However, there is a significant generation gap among men. Nearly half (47%) of senior men, compared to only 35% of young men, report having volunteered through their church or religious congregation growing up. Young women are just about as likely as senior women to have volunteered with a religious group during childhood (44% vs. 42%).
Hispanic Americans are less likely than black or white Americans to report they volunteered with their church or religious congregation (26% vs. 48% and 46%, respectively). There are, however, stark educational divides among white Americans. Fewer than four in ten (39%) white Americans without a four-year college degree say they volunteered with a church group growing up, compared to six in ten (60%) whites with one.
Republicans are notably more likely than Democrats to have volunteered with their church or religious congregation with their parents while growing up. A slim majority (51%) of Republicans say they volunteered, compared to fewer than four in ten independents (37%) and Democrats (39%).
White evangelical Protestants (60%) and black Protestants (57%) are the most likely to report this experience. By contrast, half of white mainline Protestants (50%) and white Catholics (50%) and about one-third (32%) of Hispanic Catholics say they had this experience. Less than one-quarter (23%) of the religiously unaffiliated say they did this as a child.
Going to Voting Booth With Parents
Young Americans are more likely than seniors to have accompanied one or both of their parents to the polls on Election Day when they were kids, with more than four in ten (41%) saying they did so while growing up, compared to 30% of seniors. However, this experience is much more common among young women (46%) than young men (36%).
There are modest differences between racial and ethnic groups on this question. At least one-third of white (36%) and black (33%) Americans and 28% of Hispanic Americans report this experience while growing up. There are also substantial educational divides among white Americans. Half (50%) of whites with a four-year college degree, compared to 30% of whites without one, say they’ve accompanied their parents to the polls when they were kids.
Men are about as likely as women to say they went with one or both of their parents to vote (32% and 35%, respectively).
Attending Community Meetings or Rallies
About three in ten (29%) seniors, compared to 20% of young Americans, say they attended a community meeting when they were children. Seniors are about as likely as young Americans to report they attended a public rally or demonstration (17% vs. 13%) growing up.
While Democrats (20%) and Republicans (24%) are about as likely to report attending a school board or city council meeting with their parents growing up, Democrats are more than twice as likely as Republicans to report having attended a rally or demonstration with their parents during childhood (16% vs. 7%).
About one-quarter of black (27%) and white (23%) Americans, compared to just 17% of Hispanic Americans, report having attended a community meeting with their parents as children. Fewer than one in five black (16%), white (11%), and Hispanic (10%) Americans say they attended a public rally or demonstration during their childhood.
Influence of Formative Civic Activities on Engagement Today
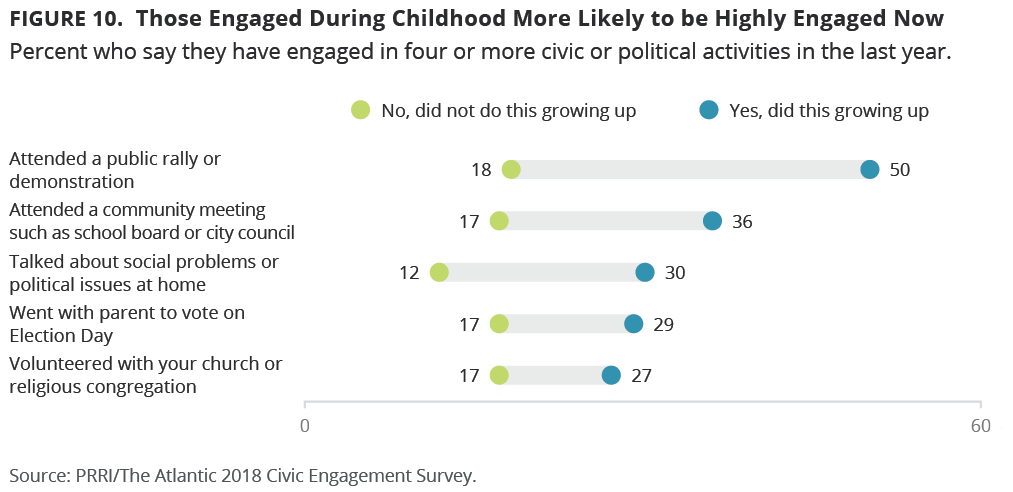
Engaging in civic and political activities as children is closely associated with higher rates of civic engagement later in life. No childhood activity is more strongly correlated with current civic and political activity than attending a public rally or demonstration. Americans who say they went to a rally or demonstration with their parents are almost three times as likely as those who did not to score highly on the Civic and Political Engagement Scale, meaning participating in at least four different activities within the last 12 months (50% vs. 18%).
Attending a community meeting, such as a school board or city council meeting, as a child is also strongly associated with higher rates of civic engagement later in life. Americans who had that experience are about twice as likely as those who did not to report a high level of engagement in the last year (36% vs. 17%).
Talking about social problems at home is also linked with increased civic engagement in adulthood. Those who discussed politics or social issues with their parents growing up are also more than twice as likely as those who did not to report a high level of engagement in the last year than (30% vs. 12%).
Volunteering with a church group or religious congregation and going to the voting booth with parents while growing up are also associated with higher rates of current civic engagement.
Encouragement to be Civically and Politically Active
About three in ten (29%) Americans report that, within the last two years, at least one person has encouraged them to get more involved in civic and political activities. Nearly one in five (19%) Americans say a close friend urged them to get more involved, while fewer Americans say the same of a celebrity, athlete, or social media figure (9%), parent (9%), sibling (8%), religious leader (8%), or teacher (6%).
Young Americans are particularly likely to have had this experience: Four in ten (40%)—including 44% of young women and 36% of young men—report having been encouraged by someone they know to engage in political and civic activities over the last 24 months, compared to only 23% of seniors. Young Americans are also more likely than seniors to say they were encouraged by a celebrity, athlete or social media figure (15% vs. 6%), parent (19% vs. 1%), or teacher (16% vs. 2%). Notably, almost one-quarter (23%) of Americans between ages 18 and 24 say a teacher has encouraged them to be more politically active.
Nonwhite Americans are also more likely than white Americans to say they have received encouragement to get involved in civic or political activities in the last two years. More than one-third of Hispanic (35%) and black (35%) Americans say at least one person has encouraged them to get more involved, compared to 27% of white Americans.
About one in five (17%) Hispanic Americans, compared to 12% of black Americans and just eight percent of white Americans, say a parent has encouraged them to be more civically active in the last two years. Both Hispanic and black Americans are about twice as likely as white Americans to say a teacher has encouraged them to get more involved in civic or political activities (11%, 10% and 4%, respectively). More than one-quarter (26%) of Hispanic Americans say a close friend has encouraged them to get more involved civically, compared to about one in five Black (19%) and white (18%) Americans. Fewer than one in five (16%) black Americans say a religious leader has encouraged them to be more active compared to one in ten (10%) Hispanic Americans and six percent of white Americans.
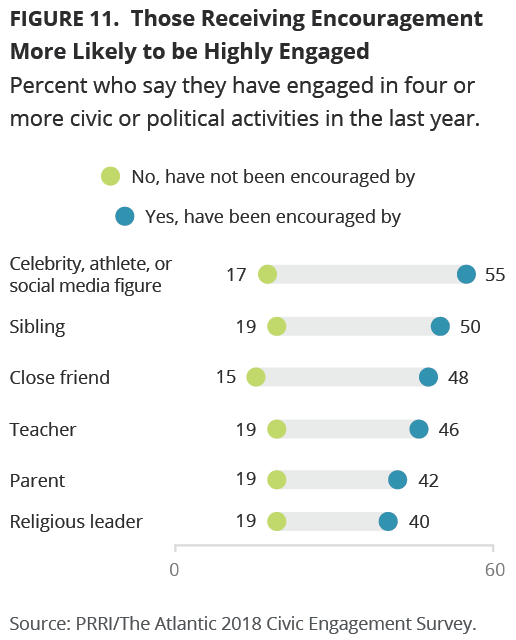
Encouragement to be civically active is positively correlated with higher engagement in one or more civic activities in the last year. The source of encouragement most associated with that outcome are celebrities, athletes, and social media figures. Those who say a celebrity has encouraged them to be more active are more likely than those who say they were not encouraged to be highly civically and politically engaged (55% vs. 17%). Nearly half (47%) of those who were not encouraged by a celebrity say they have not engaged in a single civic activity in the last year, compared to only about one in ten (11%) of those who were influenced by celebrities.
Similarly, Americans who say the following sources have influenced them to be more involved are more than twice as likely as those who say they have not been influenced to be highly engaged: sibling (50% vs. 19%), close friend (48% vs. 15%), teacher (46% vs. 19%), parent (42% vs. 19%), religious leader (40% vs. 19%).
Americans Overwhelmingly Say They Need a Break From the News
More than seven in ten (72%) Americans say they often feel like they need a break from the news, while less than one-quarter (24%) say they disagree.
Young Americans are about as likely as seniors to say they need a break from the news, with approximately seven in ten (71%) young Americans and seniors (70%) feeling this way.
Women are more likely than men to say they often feel the need a break from the news. More than three-quarters (77%) of women say they frequently feel this way these days, a view shared by two-thirds (67%) of men. The gender gap is identical among young women and men.
Whites are more likely than other racial or ethnic groups to say they need a break from the news. Nearly three-quarters (74%) of whites say they feel this way, compared to about two-thirds of black Americans (66%). The views of Hispanic Americans roughly mirror the American public. There are also gender divides among white Americans: Eight in ten (80%) white women say they often need a break from the news these days, compared to roughly two-thirds (68%) of white men.
Majorities of both Republicans and Democrats say they need a break from the news. More than three-quarters (77%) of Republicans say these days they often feel the need to step away from the news, a view shared by seven in ten (70%) of Democrats. Views of political independents do not differ appreciably from the American public.
The Great Lakes Region
To better understand how Americans’ experiences and viewpoints differ between states, this survey included an oversample of states in the Great Lakes region: Illinois, Ohio, Michigan, Minnesota, and Wisconsin. The Great Lakes region has become increasingly important politically, but each state has a distinctive political culture.
Ability to Work Together
Few Americans living in the Great Lakes region think Americans holding different political views can come together to solve the country’s problems. About four in ten (41%) residents of Michigan believe Americans can bridge the partisan divide and find solutions to problems, while only about one-third of the residents of Illinois (36%), Ohio (35%), Minnesota (34%) and Wisconsin (31%) think so.
Similar to Americans nationally, Great Lakes residents are more optimistic that people in their community who hold different views can come together to solve problems. Majorities of those living in Michigan (59%), Minnesota (58%), Illinois (57%), Ohio (54%), and Wisconsin (54%) are optimistic about this happening with people in the community.
Older (age 60 and older) and younger (age 18-39) Americans in the region generally express similar levels of optimism and pessimism on these questions.[13]
Critical Issues
Going into the 2018 midterms, those living in the five Great Lakes states are prioritizing the same issues as Americans nationwide. Health care, gun policy, and immigration are the three issues most likely to be listed as critically important among residents of Ohio (63%, 42%, and 47%), Illinois (60%, 45%, and 41%), Michigan (60%, 39%, and 45%), Wisconsin (60%, 46%, and 47%), and Minnesota (58%, 46%, and 45%).
There are notable age gaps for some of these issues. As observed at the national level, older residents (age 60 and older) of Wisconsin (60%), Ohio (59%), and Michigan (55%) are notably more likely than younger residents (age 18-39) to prioritize immigration (34%, 42%, and 40%, respectively).
Younger residents of some Great Lakes states are more likely than older residents to think climate change is a critical issue. Younger Americans in Illinois (43%), Michigan (42%), and Wisconsin (40%) are more likely than their older counterparts to prioritize climate change (32%, 28%, and 28%, respectively).
There are also age divides in some states on the importance of racial inequality. Younger residents of Ohio (46%), Illinois (42%), and Minnesota (37%) are notably more likely than older residents of those states to prioritize racial inequality (30%, 27%, and 27%, respectively).
There are also notable divisions on the issue of gender equality. Younger residents of the Great Lakes region are more likely than older residents to say it is a critical issue in Michigan (32% vs. 19%), Illinois (28% vs. 14%), Minnesota (27% vs. 14%), Wisconsin (24% vs. 12%) and Ohio (30% vs. 25%).
The 2018 Elections
Likelihood of Voting in the Great Lakes
Strong majorities in all the Great Lakes states say they will vote in the upcoming 2018 midterm elections. About seven in ten residents of Minnesota (71%) and Michigan (67%), as well as majorities of those living in Wisconsin (61%), Ohio (57%), and Illinois (54%) say they are absolutely certain to vote in the upcoming election. Almost three in ten (27%) residents of Illinois say their chances of voting are 50-50 or less, along with about one in five residents of Ohio (24%), Wisconsin (20%), Michigan (19%) and Minnesota (17%).
Younger Americans in this region are generally less likely to say they will vote in the upcoming election. About half of younger residents in Minnesota (50%), Michigan (50%), and Ohio (47%) say they are absolutely certain to vote. By contrast, only about four in ten younger residents of Wisconsin (43%) and Illinois (42%) say the same.
General Ballot in the Great Lakes
Registered voters in most of the Great Lakes states prefer Democratic candidates over Republican candidates: Illinois (58% vs. 40%), Minnesota (56% vs. 39%), Ohio (54% vs. 44%), and Michigan (51% vs. 45%). By contrast, registered voters in Wisconsin are evenly split between the Democratic candidates (49%) and the Republican candidates (49%).
These margins are nearly identical among those registered voters who say they are certain to vote.
Younger Americans residing in these states generally prefer the Democratic candidates over Republican ones, with double-digit margins for that preference in Illinois (67% vs. 31%), Michigan (65% vs. 30%), Ohio (61% vs. 37%), and Wisconsin (57% vs. 40%). The voting preferences of younger Minnesota residents are roughly similar to all Minnesotans (56% Democratic vs. 41% Republican).
Issues with America’s Election System
When asked about the nation’s current electoral system, Great Lakes residents see a variety of major problems.
Almost seven in ten (68%) residents of Illinois, as well as a majority of those living in Michigan (61%), Minnesota (57%), Ohio (56%), and Wisconsin (52%), say that gerrymandering is a major problem. Similarly, most residents in Illinois (57%), Ohio (55%), Minnesota (54%), Michigan (52%), and nearly half (48%) of residents in Wisconsin, believe interference in U.S. elections by a foreign government is a major problem. Similarly, a majority of residents of Illinois (57%), Ohio (51%), Minnesota (54%), Michigan (53%), say removing eligible voters from voter registration lists is a major problem. Wisconsin residents are more divided, with only 48% saying that removing eligible voters from registration lists is a major problem.
Younger residents of these states are just about as likely to see these issues as major problems.
Lowering the Voting Age
Overwhelming majorities of those in the Great Lakes states do not think the voting age should be lowered to 16. Nearly nine in ten (88%) residents of Minnesota, as well as about eight in ten residents of Wisconsin (83%), Michigan (83%), Ohio (83%), and Illinois (79%), do not want the voting age lowered to 16.
Civic and Political Engagement
Local vs. National
A majority of those living in the Great Lakes states believe that to make change happen, it is generally more important to get involved in local issues than national issues. About six in ten residents of Illinois (64%), Minnesota (62%), Ohio (62%), Wisconsin (62%), and Michigan (60%) say it is more important to act locally than nationally.
Younger and older Americans in these states are about as likely to prioritize being active on local issues.
Civic and Political Engagement
Patterns of civic and political engagement are consistent across the Great Lakes region. Less than one-quarter of Minnesota (24%), Wisconsin (22%), Michigan (21%), Illinois (21%) and Ohio (19%) residents report high levels of civic or political engagement, according to the Civic and Political Engagement Scale. About four in ten of those living in Wisconsin (43%), Ohio (42%) and Illinois (41%), along with about one-third residents in Minnesota (36%) and Michigan (35%) report not having engaged in any of these activities in the last year.
Younger and older Americans living in these states are about as likely to report being engaged within the last year.
Reasons for Abstaining From Civic and Political Engagement
When asked why they do not get involved in campaigns or causes, Great Lakes residents are likely to cite their own lack of knowledge about the issues. About four in ten residents of Wisconsin (43%), Illinois (43%), Ohio (40%), Minnesota (39%), and Michigan (37%) say they do not know enough to participate; this concern is generally more prevalent among younger Americans living in these states (56%, 53%, 43%, 51%, and 45%, respectively).
Similarly, Great Lakes residents cite concerns about the efficacy of their actions as a reason they do not get involved. At least one-third of residents in Illinois (40%), Ohio (37%), Wisconsin (37%), Michigan (35%), and Minnesota (33%) say they doubt their actions will make a difference. Younger and older Americans living in the Great Lakes region are about equally likely to express this concern.
Residents of this region also say that fear of being criticized for their involvement makes them hesitant to participate in a campaign or advocate for an issue. More than one-quarter (27%) of those living in Minnesota, as well as about one in five residents of Wisconsin (20%), Michigan (19%), Ohio (19%), and Illinois (16%), cite an aversion to criticism as a reason they do not get involved. Younger Great Lakes residents are generally more likely than older residents to cite this concern in Minnesota (42% vs. 14%), Wisconsin (25% vs. 12%), Michigan (24% vs. 17%), Illinois (22% vs. 8%), and Ohio (21% vs. 15%).
Finally, a smaller percent of Great Lakes residents report that they do not get involved because there are not issues or causes they care about. Less than one in five residents of Ohio (17%), Illinois (17%), Michigan (16%), Wisconsin (13%) and Minnesota (11%) say there are not issues or causes they care about; younger and older Americans living in the Great Lakes region are about equally likely to cite this concern.
Great Lakes Residents Less Likely to Engage in Civic and Political Activities and Consider Pursuing Job in Public Service
Residents of the Great Lakes region generally say they have not been more likely be involved in a political or civic activity the last two years. About half of those living in Wisconsin (51%), Illinois (50%), Michigan (48%), Ohio (46%), and Minnesota (46%) say that they have been about as likely to engage in civic and political activities in the last two years as they were before that. However, those living in the Great Lakes states are more likely to say that they have become less engaged rather than more engaged in the last two years: Ohio (34% vs. 19%), Illinois (29% vs. 20%), Minnesota (29% vs. 25%), Wisconsin (29% vs. 19%), and Michigan (28% vs. 22%). Younger Americans living in this region did not engage or disengage at notably different rates.
Similarly, most of those living in the Great Lakes region say the likelihood they will consider a career in public service has not changed. Asked about careers in government service or running for public office, about half of residents in Minnesota (54% vs. 51%), Wisconsin (51% vs. 49%), Ohio (51% vs. 51%), Michigan (50% vs. 51%), and Illinois (49% vs. 50%) say that they are about as likely to consider these careers in the last two years as they were before that.
In fact, Americans living in this region generally report they are less likely to think about pursuing these types of careers in the past two years. Residents of Illinois (44% vs. 45%), Michigan (43% vs. 44%), Ohio (42% vs. 44%), Minnesota (40% vs. 42%), and Wisconsin (39% vs. 42%) say they are less likely to consider either a career in government services or running for public office as they were two years ago.
Survey Methodolgy
The PRRI/The Atlantic 2018 Civic Engagement Survey was conducted by PRRI in partnership with The Atlantic among a random sample of adults (age 18 and up) living in the United States and who are part of GfK’s Knowledge Panel. The survey included a national sample (N=1,011) representing all 50 states, in addition to an over-sample of Americans ages 18-29 (800), totaling to N=1,811. The survey also over-sampled those living in Ohio (507), Illinois (499), Michigan (474), Wisconsin (435), and Minnesota (422). Interviews were conducted online in both English and Spanish between August 24 and September 13, 2018. The survey was made possible by generous grants from The Joyce Foundation, The Kresge Foundation, The McKnight Foundation, and additional general support funders.
Respondents are recruited to the KnowledgePanel using an addressed-based sampling methodology from the Delivery Sequence File of the USPS – a database with full coverage of all delivery addresses in the U.S. As such, it covers all households regardless of their phone status, providing a representative online sample. Unlike opt-in panels, households are not permitted to “self-select” into the panel; and are generally limited to how many surveys they can take within a given time period.
The initial sample drawn from the KnowledgePanel was adjusted using pre-stratification weights so that it approximates the adult U.S. population defined by the latest Current Population Survey. Next, a probability proportional to size (PPS) sampling scheme was used to select a representative sample. Once assigned to the survey, panel participants received additional email notification reminders on August 26, August 29, September 4, and September 10 to complete the survey.
To reduce the effects of any non-response bias, a post-stratification adjustment was applied based on demographic distributions from the most recent Current Population Survey (CPS). The post-stratification weight rebalanced the sample based on the following benchmarks: age, race and ethnicity, gender, Census division, metro area, education and income. The sample weighting was accomplished using an iterative proportional fitting (IFP) process that simultaneously balances the distributions of all variables. Weights were trimmed to prevent individual interviews from having too much influence on the final results. In addition to an overall national weight, separate weights were computed for each state to ensure that the demographic characteristics of the sample closely approximate the demographic characteristics of the target populations.
The margin of error for the national survey is +/- 2.97 percentage points at the 95% level of confidence. The design effect for the survey is 1.7. Table 1 includes margin of error information for the state samples. In addition to sampling error, surveys may also be subject to error or bias due to question wording, context and order effects.
Table 1. State Sample Sizes and Margins of Error
State Sample Size Margin of Error
Ohio N=507 +/- 5.7
Illinois N=499 +/- 5.7
Michigan N=474 +/- 5.9
Wisconsin N=435 +/- 6.1
Minnesota N=422 +/- 6.2
Additional details about the KnowledgePanel can be found on the GfK website:
Appendix
Table 2. Demographic, Political, Religious, and Geographic Subgroup Sample Sizes
(All figures are unweighted)
N=
Total Sample 1,811
Male 823
Female 988
Republican 431
Independent 732
Leans Republican 264
No Lean 101
Leans Democrat 367
Democrat 611
White, non-Hispanic 1,215
Black, non-Hispanic 178
Hispanic 274
Age 18-29 969
30-49 278
50-64 334
65+ 230
White evangelical Protestant 254
White mainline Protestant 277
Black Protestant 119
Catholic 339
White Catholic 195
Hispanic Catholic 114
Religiously unaffiliated 440
Endnotes
[1] CBS News Poll, Oct 2017.
[2] This finding is taken from a sample of 96 young black Americans and should be interpreted with caution.
[3] PRRI/The Atlantic 2018 Voter Engagement Survey.
[4] This estimate is taken from a sample of 96 young black Americans. Estimate should be interpreted with caution.
[5] PRRI 2014 American Values Survey.
[6]This estimate is taken from a sample of 96 young black Americans. Estimate should be interpreted with caution.
[7] Analysis in this section is limited to those who report that they are registered to vote.
[8] PRRI 2014 American Values Survey.
[9] Insufficient sample size to give estimates for young, black registered voters.
[10]This estimate is taken from a sample of 96 young black Americans. Estimate should be interpreted with caution.
[11] This estimate is taken from a sample of 96 young black Americans. Estimate should be interpreted with caution.
[12] PRRI 2016 American Values Atlas.
[13] Due to sample size limitations, modified age categories are used throughout the analysis of the Great Lakes region.
Recommended Citation
Robert P. Jones, PhD, Daniel Cox, PhD, Rob Griffin, PhD, Maxine Najle, PhD, Molly Fisch-Friedman, and Alex Vandermaas-Peeler. “American Democracy in Crisis: Civic Engagement, Young Adult Activism, and the 2018 Midterm Elections.” PRRI. https://www.prri.org/research/american-democracy-in-crisis-civic-engagement-young-adult-activism-and-the-2018-midterm-elections


