

To view a PDF of slides presented during PRRI’s April 1, 2025 live discussion of this report, please click here. For a replay of the event, please click here.
Executive Summary
In 2024, PRRI interviewed more than 22,000 adults as part of its American Values Atlas, offering a detailed analysis of Americans’ views on the legality of abortion. The report also explores the relationship between religiosity and abortion laws across states.
Nearly two-thirds of Americans support abortion legality in all or most cases; partisans remain deeply divided.
- More than six in ten Americans (63%) say abortion should be legal in most or all cases; in contrast, 34% of Americans say abortion should be illegal in most or all cases.
- Just 8% of Americans say abortion should be illegal in all cases.
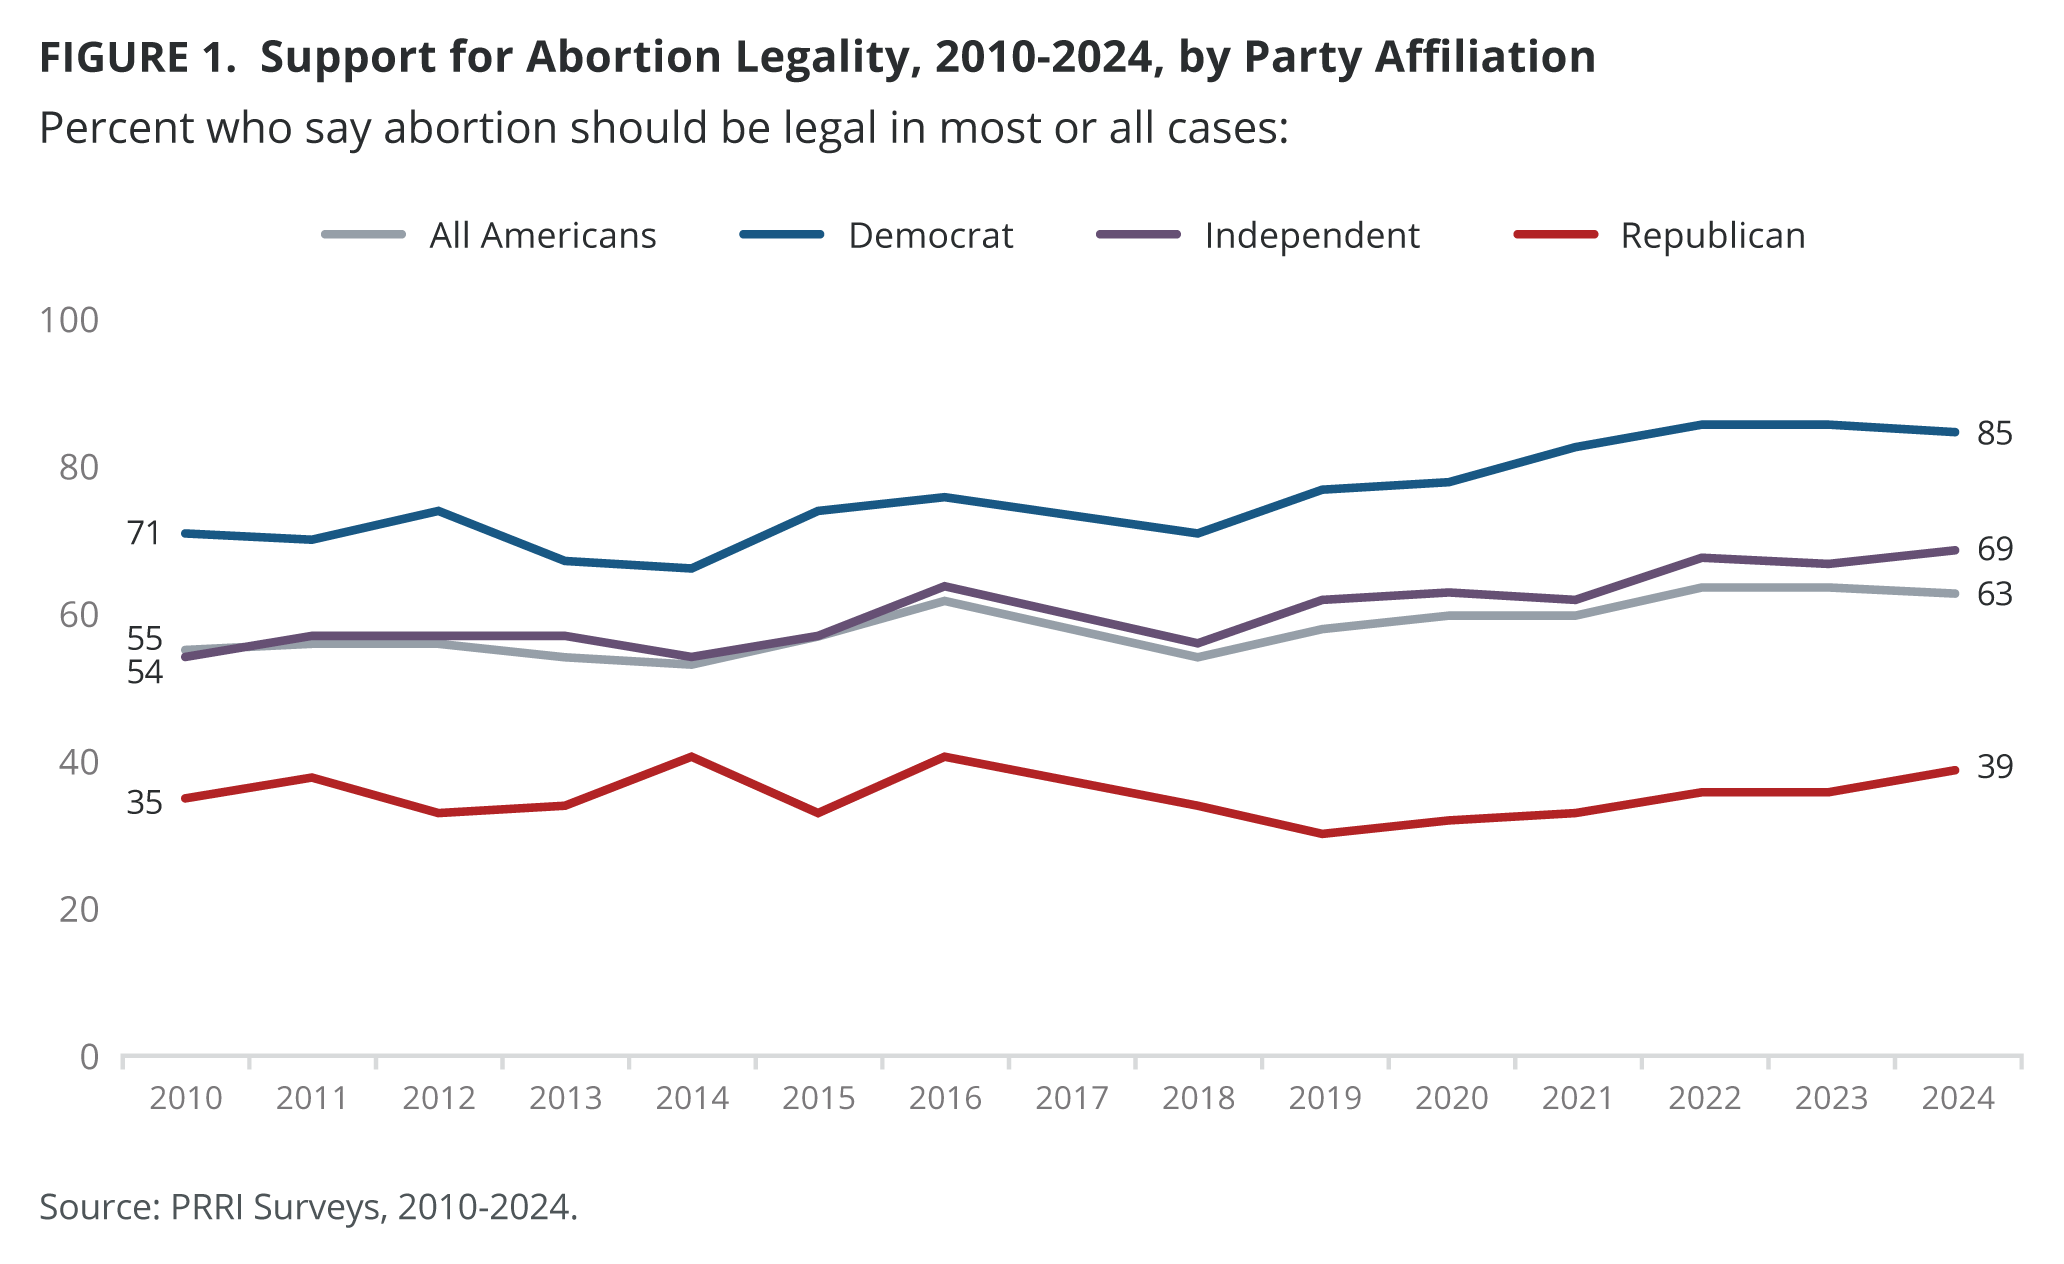
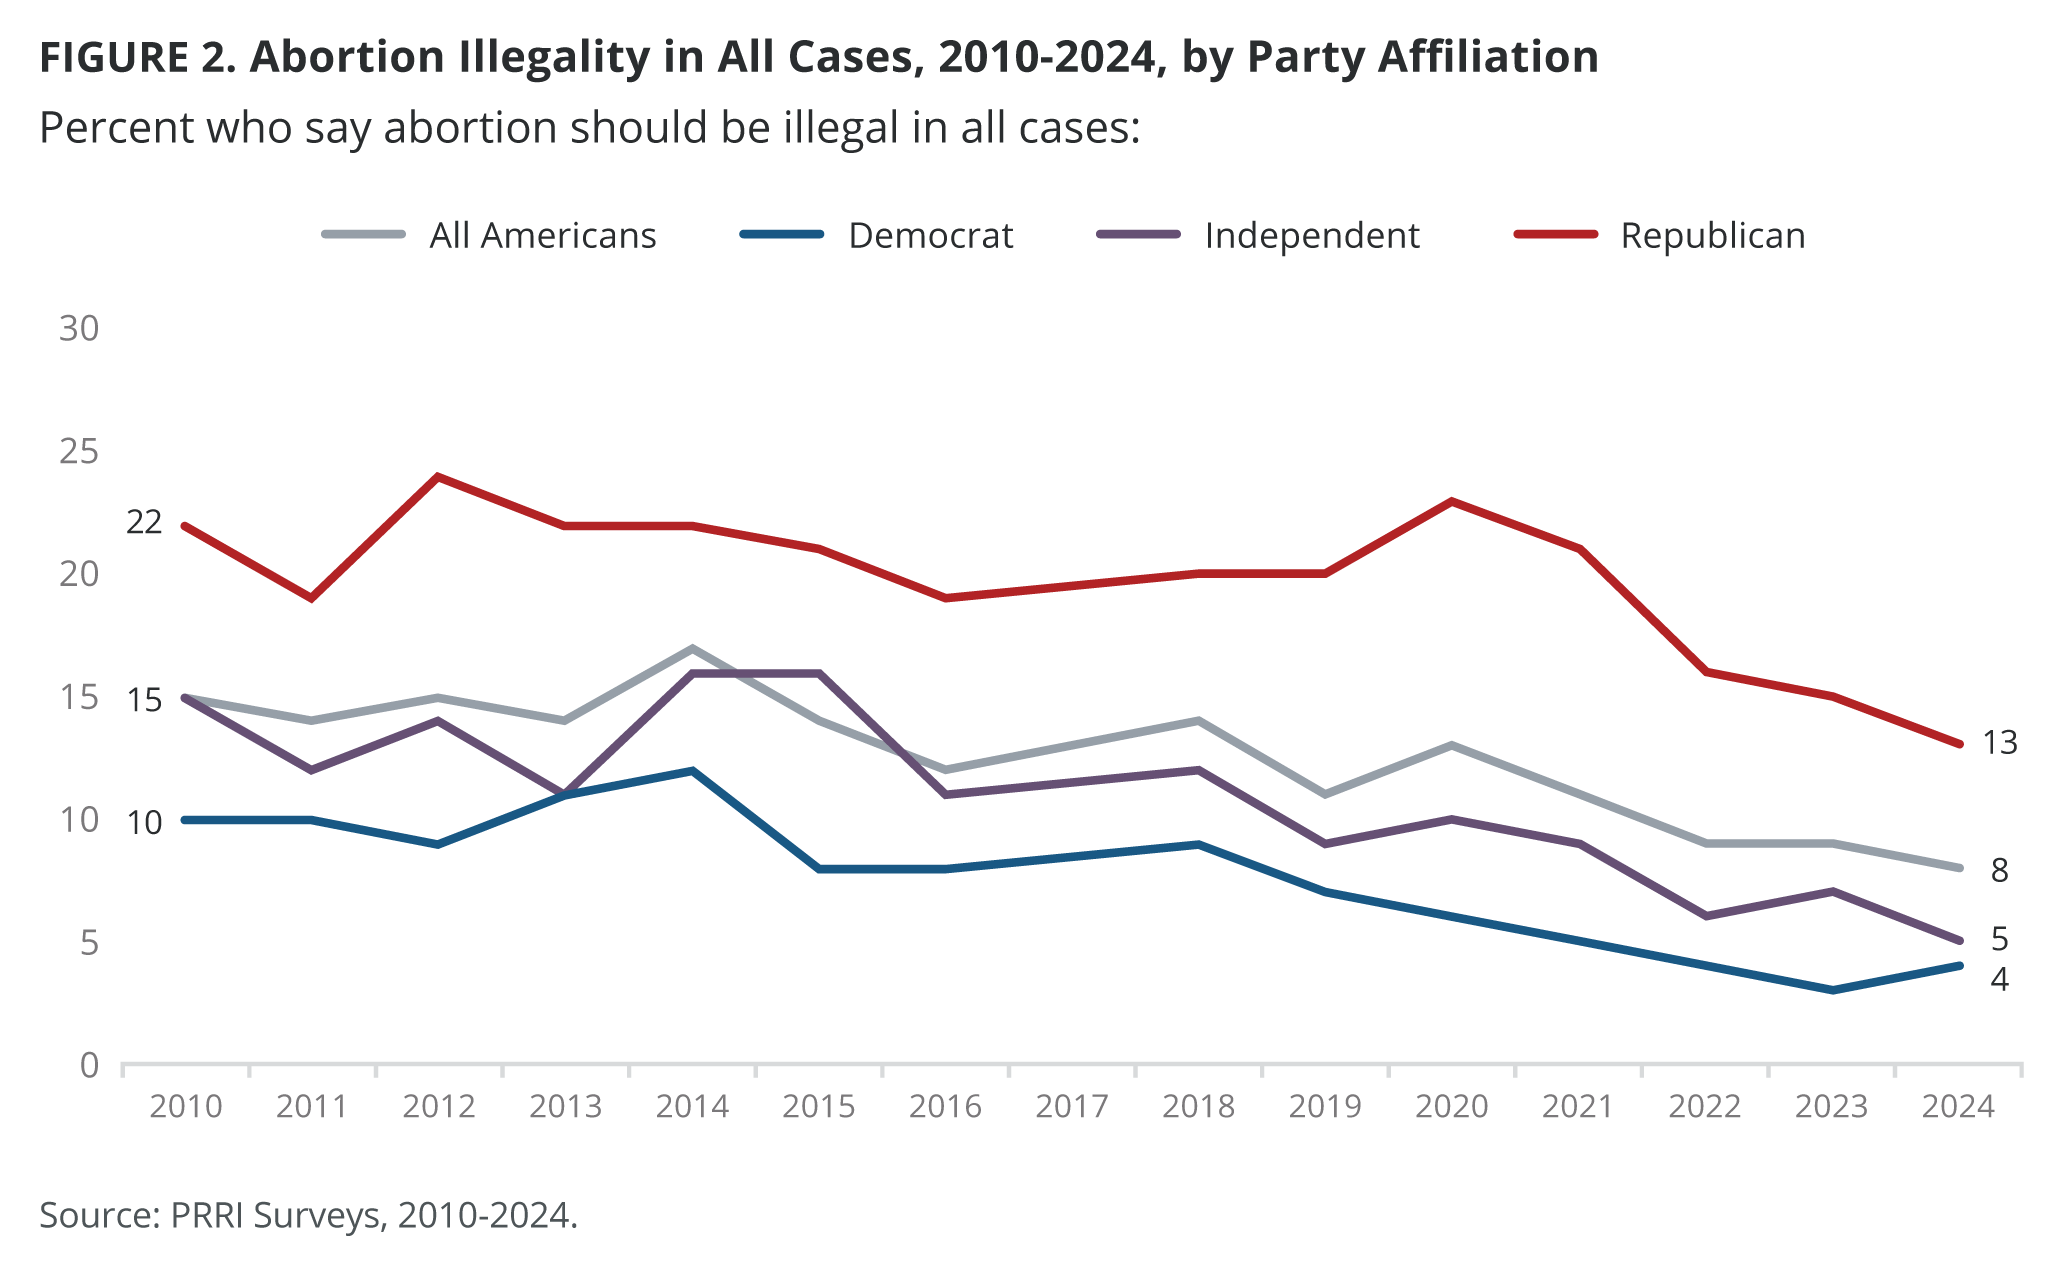
- Most Democrats have consistently favored abortion rights, but support has increased in recent years, from 71% in 2010 to 85% in 2024. In contrast, 39% of Republicans support abortion legality, but their support has increased by 4 percentage points since 2010 (35%). Just 13% of Republicans say abortion should be illegal in all cases, down almost 10 percentage points from 22% in 2010.
There is a slight gender gap in support for abortion legality, and older Americans have become increasingly supportive.
- Nearly two-thirds of women (66%) and more than six in ten men (61%) say abortion should be legal in all or most cases.
- There is a slight gender gap between Democratic women (87%) and Democratic men (84%), between Republican women (40%) and Republican men (37%), and between independent women (71%) and independent men (67%).
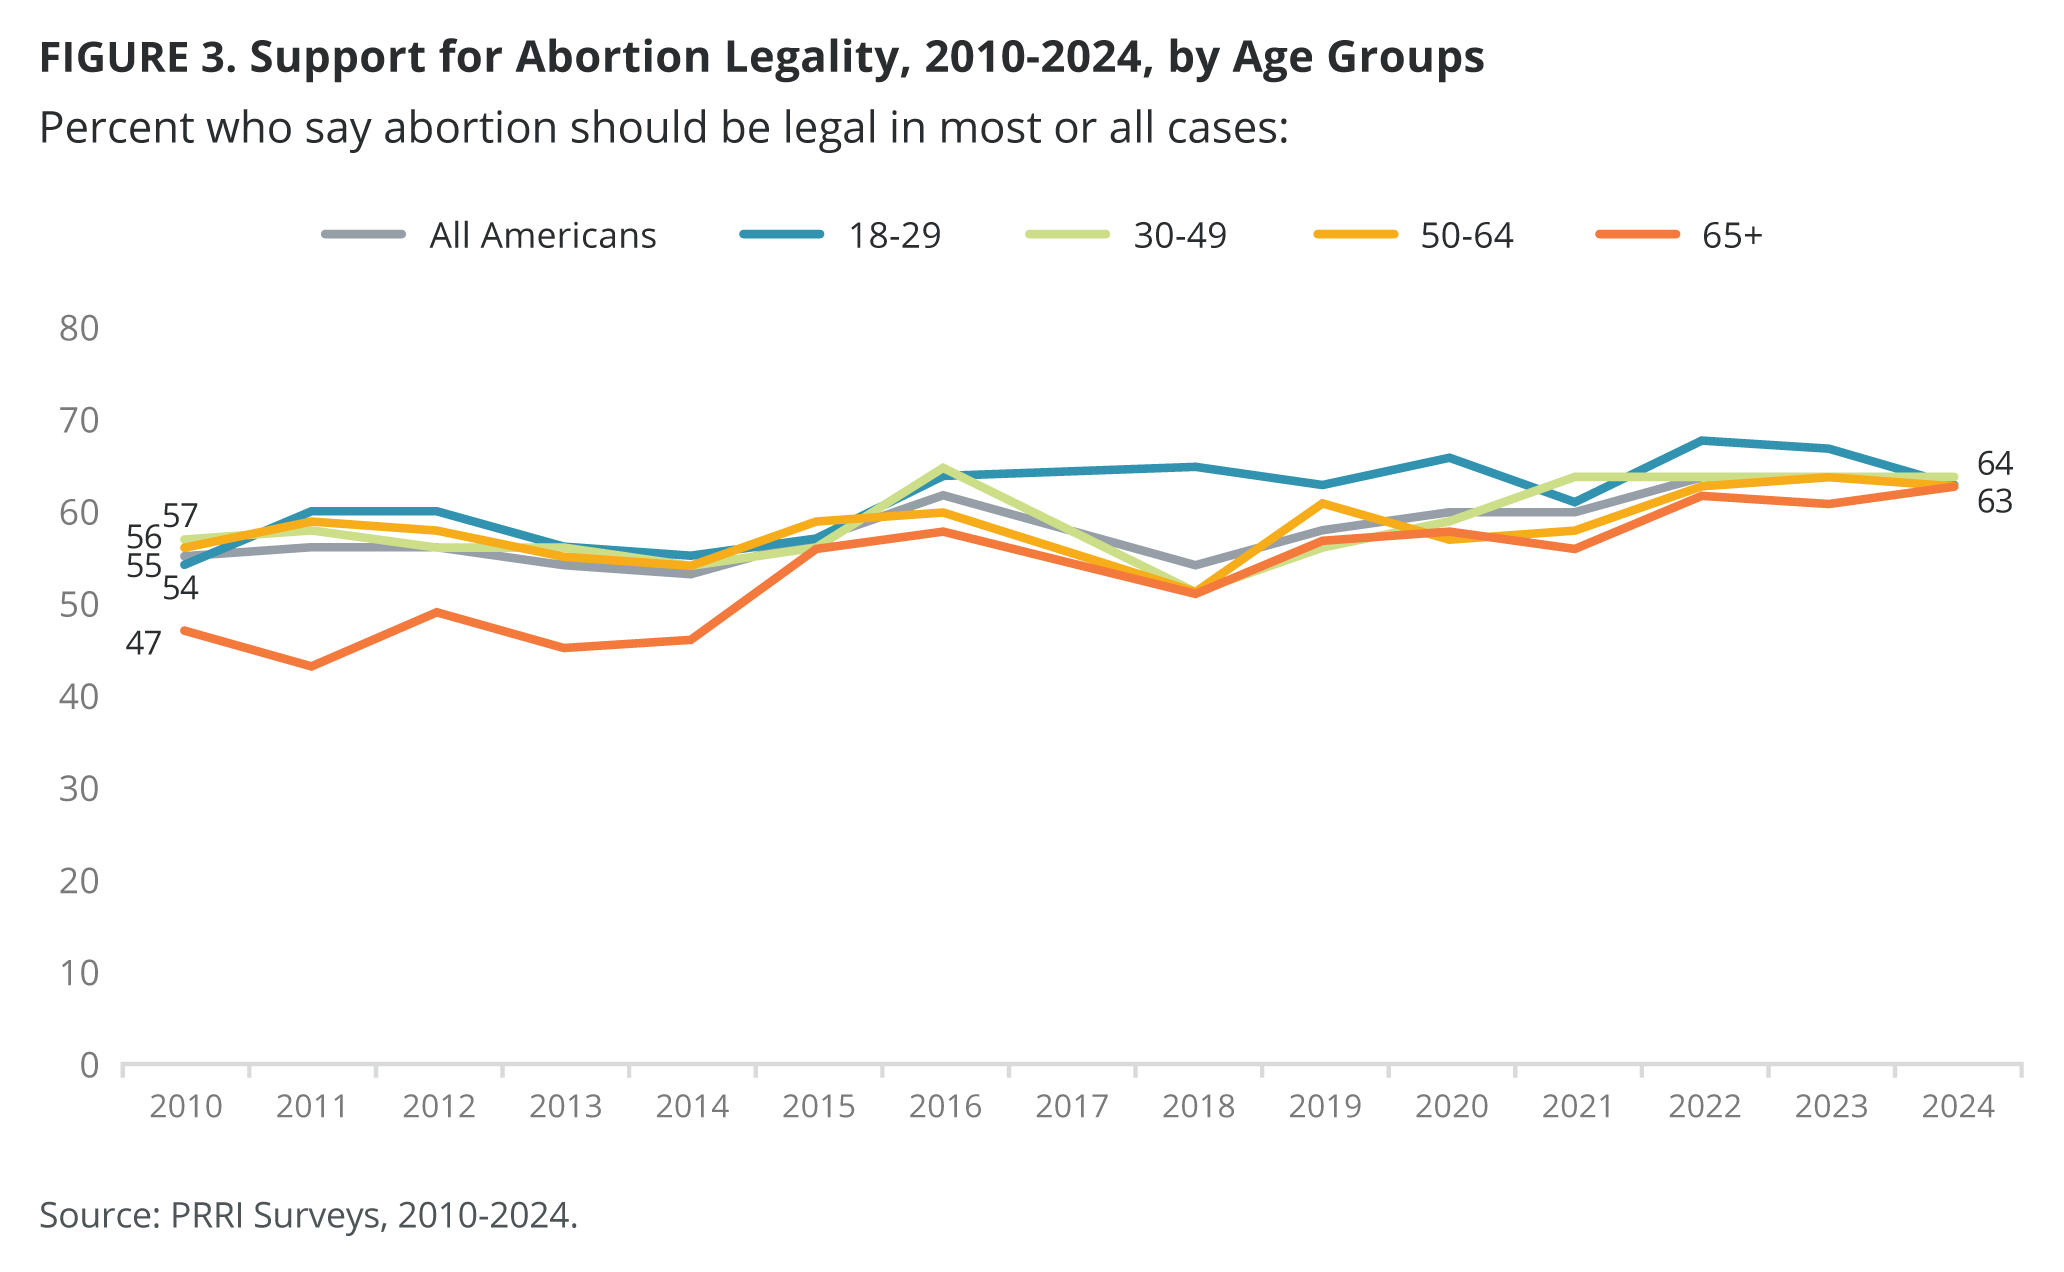
- While the majority of Americans under the age of 65 have consistently supported abortion rights, Americans ages 65 and older have gradually increased their support, from 47% in 2010 to 63% in 2024.
Most religious Americans support abortion legality. Support for abortion legality increased among those who seldom or never attend religious services.
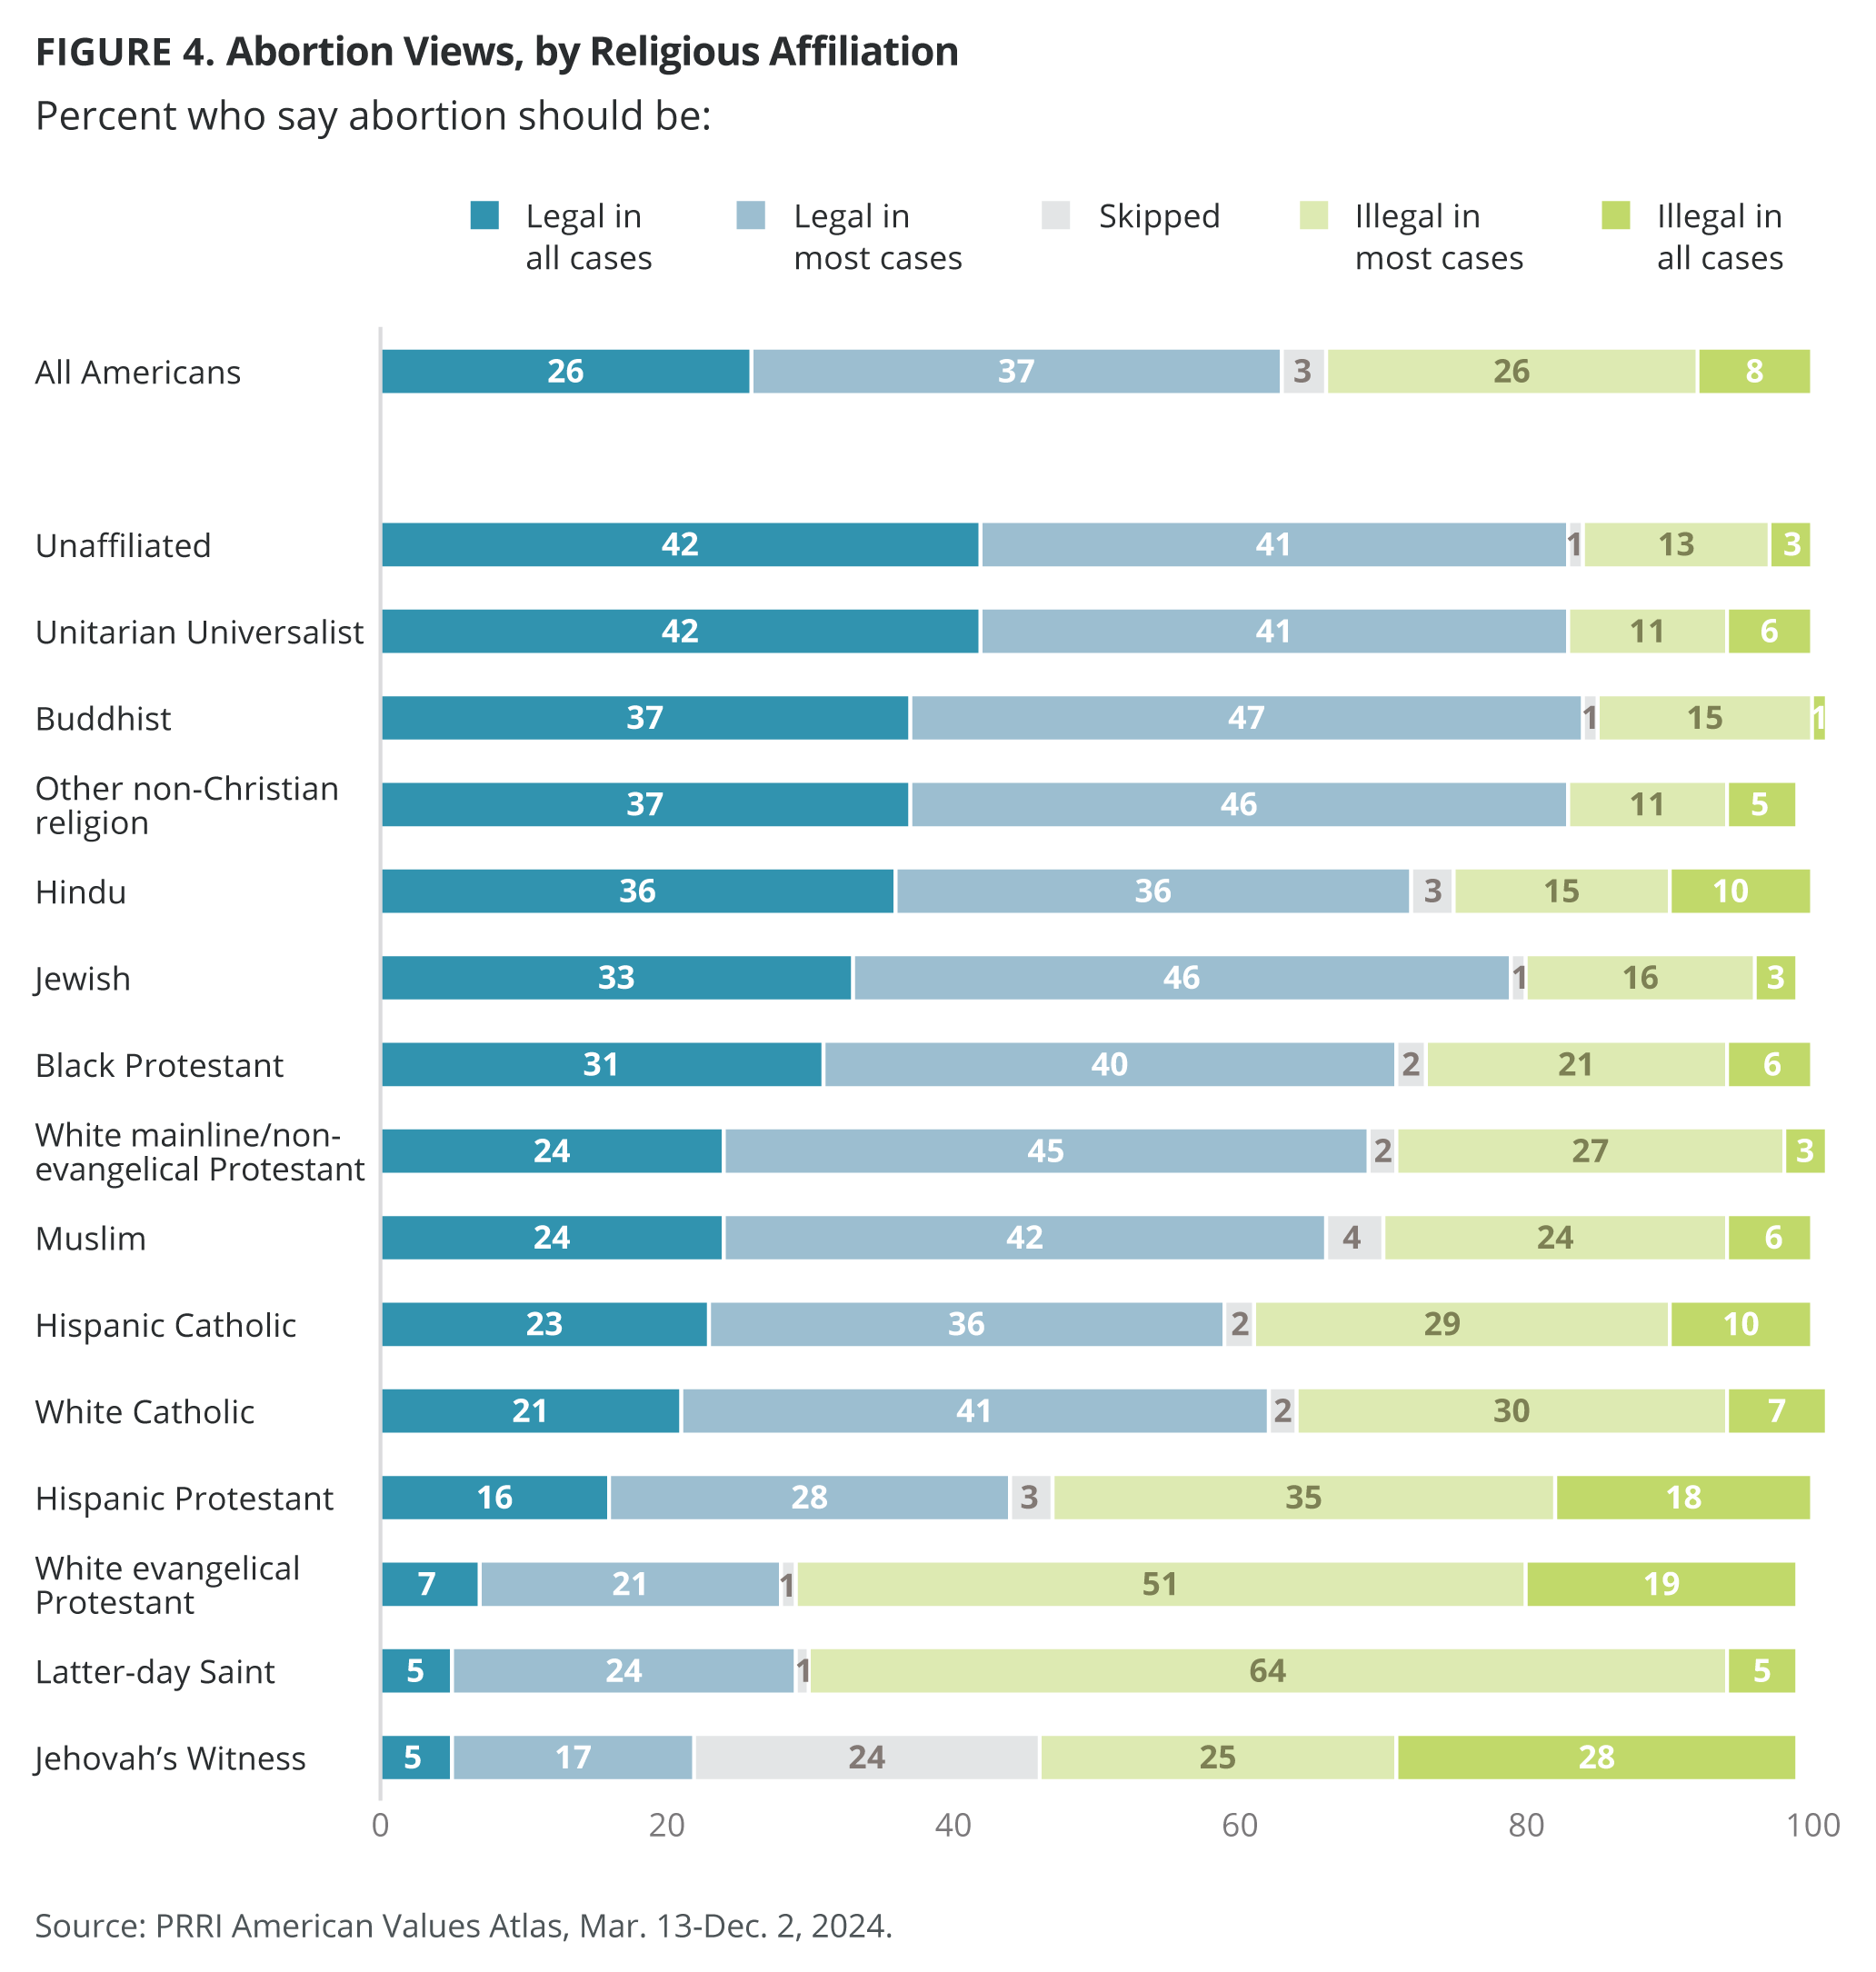
- Majorities across most religious traditions say that abortion should be legal in all or most cases.
- Only four major religious groups lack majority support for abortion legality in all or most cases. These groups include Hispanic Protestants (44%), Latter-day Saints (29%), white evangelical Protestants (28%), and Jehovah’s Witnesses (22%).
- Americans who seldom or never attend religious services (78%) are more likely than those who attend services monthly or a few times a year (61%) and those who attend services weekly or more (35%) to support abortion legality. Support increased among those who seldom or never attend services from 72% in 2010.
A majority of residents in most states say that abortion should be legal; no more than 17% of Americans in any state support a ban on abortion.
- A majority of residents in most states and the District of Columbia say that abortion should be legal in all or most cases; there are only seven states where a minority of residents support abortion legality.
- Roughly one in ten residents in most states say abortion should be illegal in all cases. Nebraska has the highest percentage (17%).
- Americans living in states with more restrictive abortion laws are more likely to oppose abortion, whereas those in less restrictive states show higher levels of support for abortion rights.
Abortion supporters are more likely to be Democrats, to be women, and to have higher levels of education than abortion opponents but are less likely to identify with a religion or engage in religious practices.
- Abortion supporters (40%) are four times as likely as opponents (11%) to identify as Democrats. In contrast, abortion opponents are more likely than supporters to identify as Republican (51% vs. 18%).
- Abortion supporters are more likely than opponents to be women (53% vs. 47%) and have at least a four-year college degree (40% vs. 29%).
- Abortion supporters are more likely than opponents to identify as religiously unaffiliated (36% vs. 13%). Abortion supporters are also less likely to exhibit religious behaviors, including attending church, praying, and reading religious texts than abortion opponents.
- Christian nationalism Rejecters (92%) are more likely than Skeptics (66%), Sympathizers (41%), and Adherents (26%) to support the legality of abortion.
There is a distinct connection between religious practices and opposition to Christian nationalism and support for abortion legality in all 50 states.
- States in which residents more frequently practice religion have higher levels of opposition to abortion legality.
- In all 50 states, the higher a state’s residents scored on the Christian nationalism scale, the less likely they are to support the legality of abortion.
Most Americans, including a majority of Republicans, oppose laws that make it illegal to use or receive through the mail FDA-approved drugs for medical abortion.
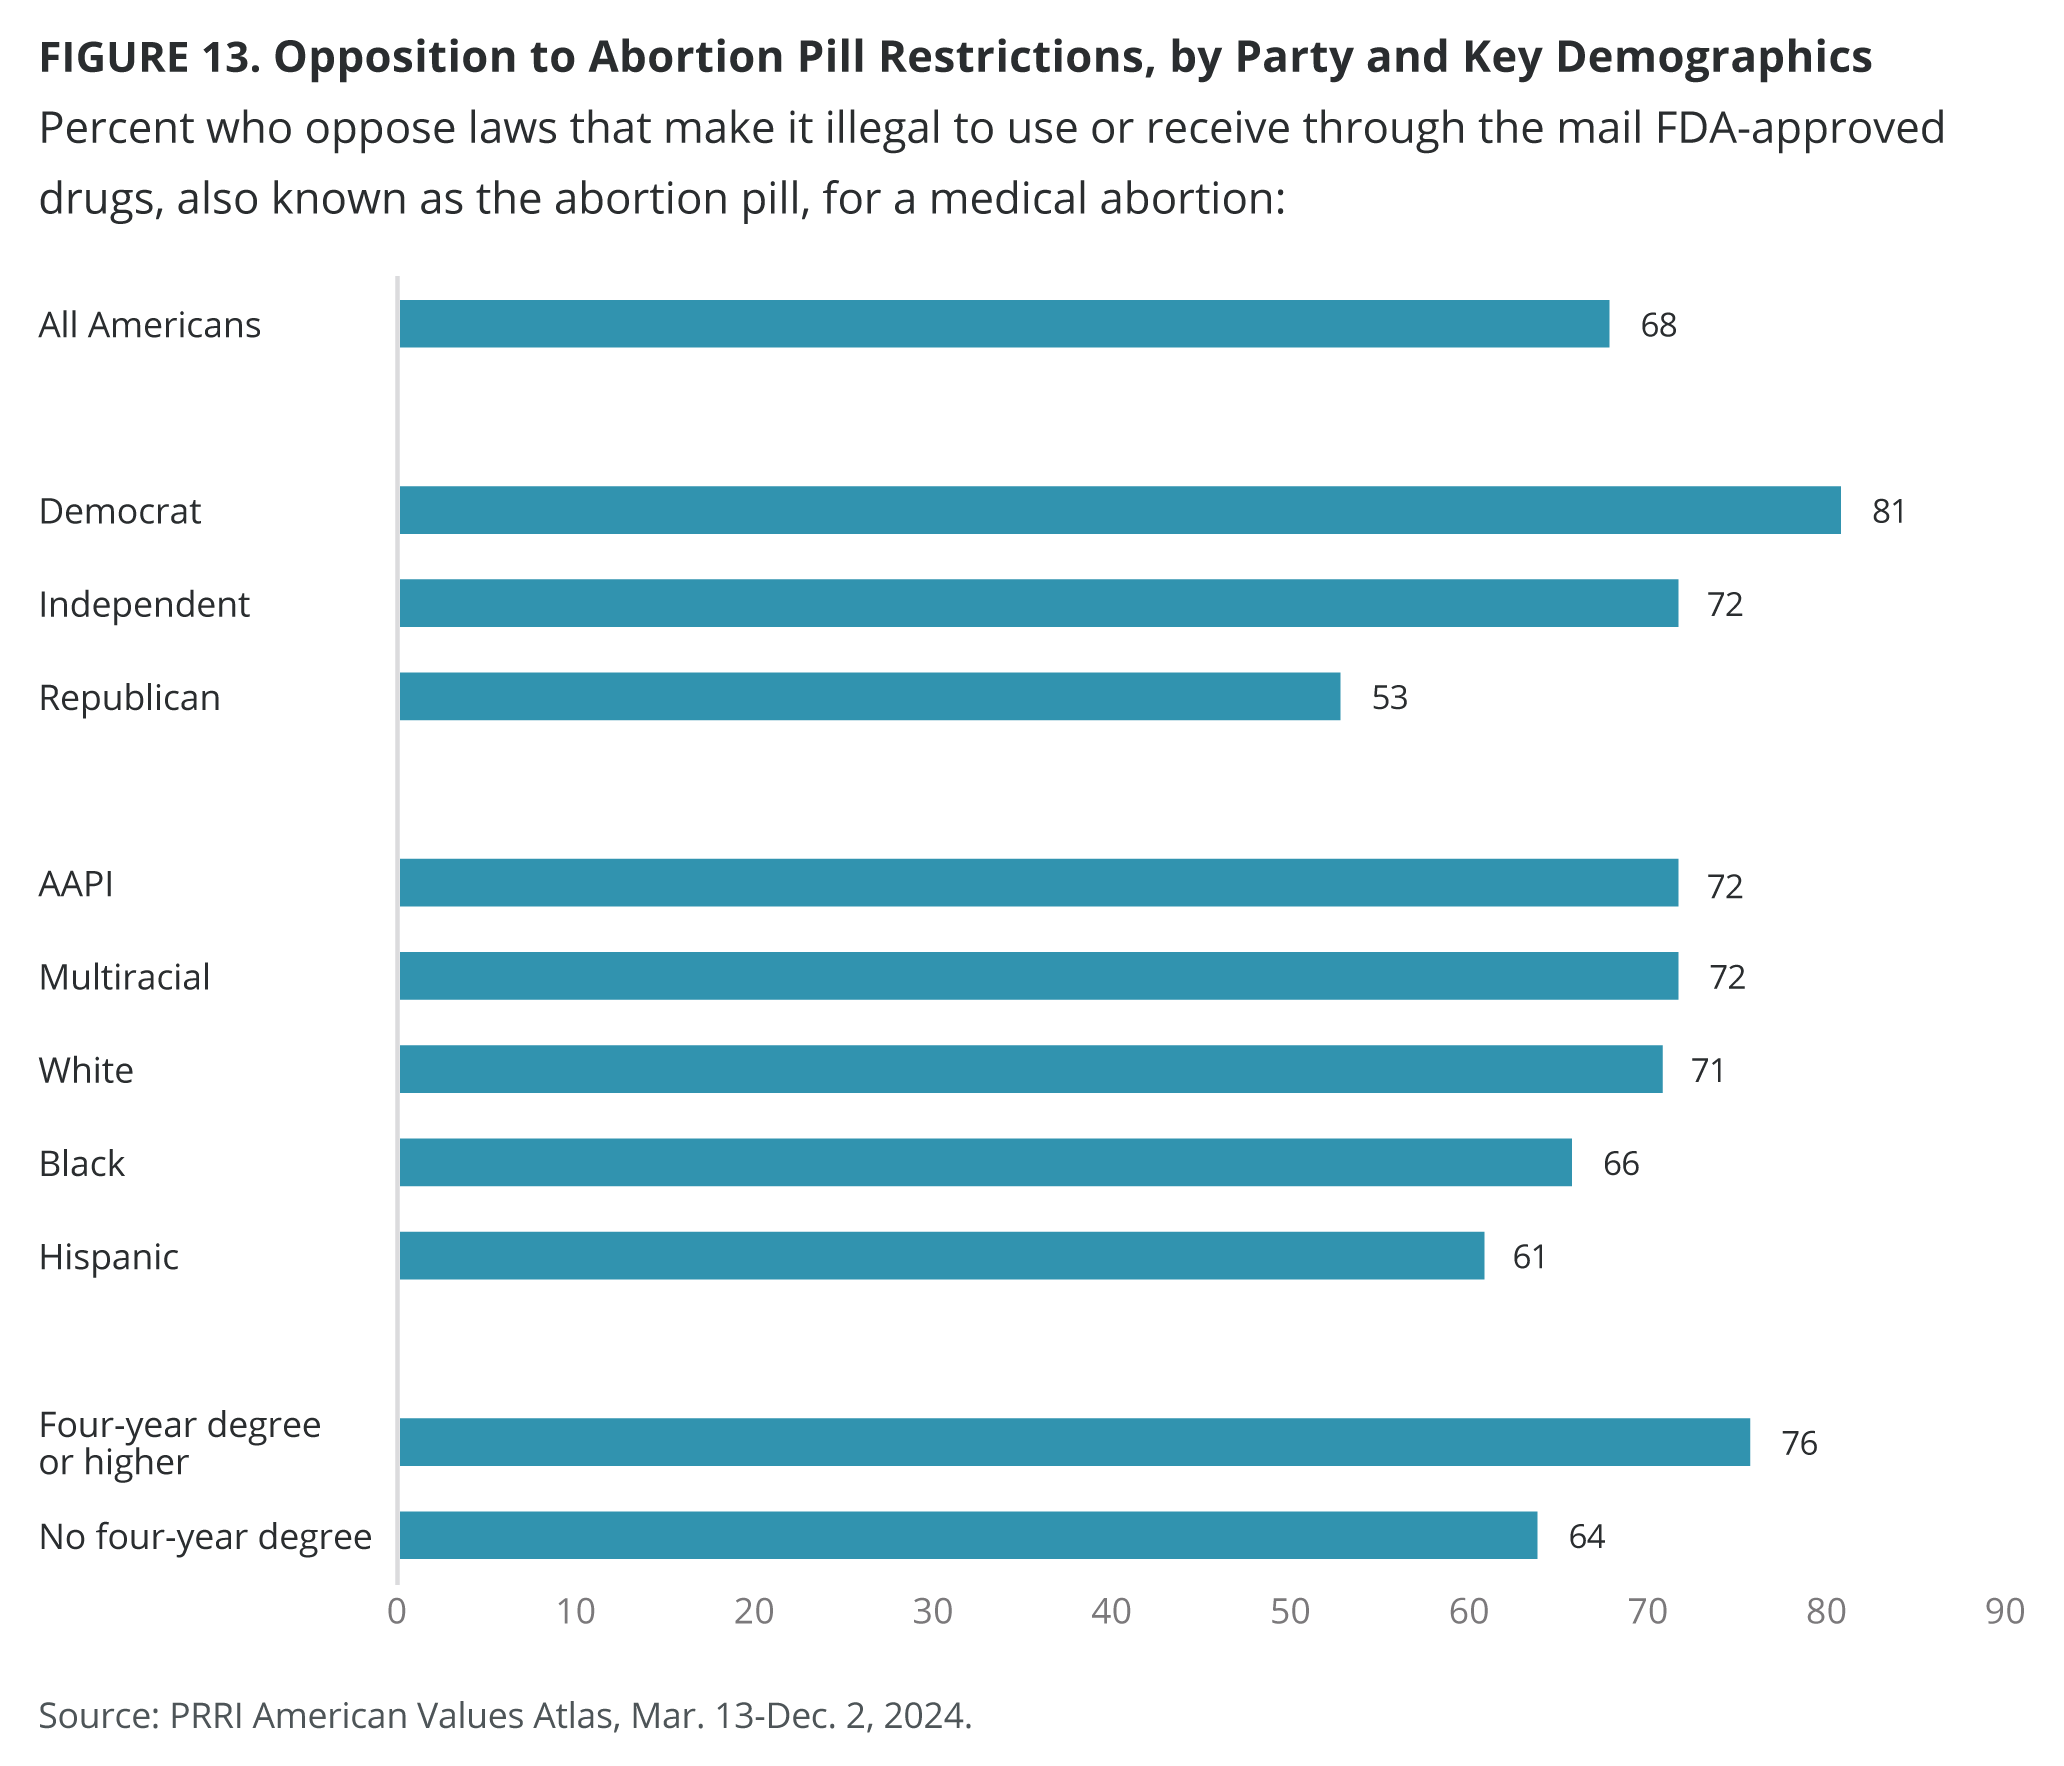
- Over two-thirds of Americans (68%) oppose laws that make it illegal to use or receive through the mail FDA-approved drugs for medical abortion, often called abortion pills, compared with less than three in ten who favor these laws (28%).
- Democrats (81%) and independents (72%) are significantly more likely than Republicans (53%) to oppose laws that make it illegal to use or receive abortion pills through the mail.
- Except for Jehovah’s Witnesses (40%), at least half of all religious groups oppose laws that make it illegal to access abortion pills by mail, including white evangelical Protestants (50%), Hispanic Protestants (51%), and Latter-day Saints (53%).
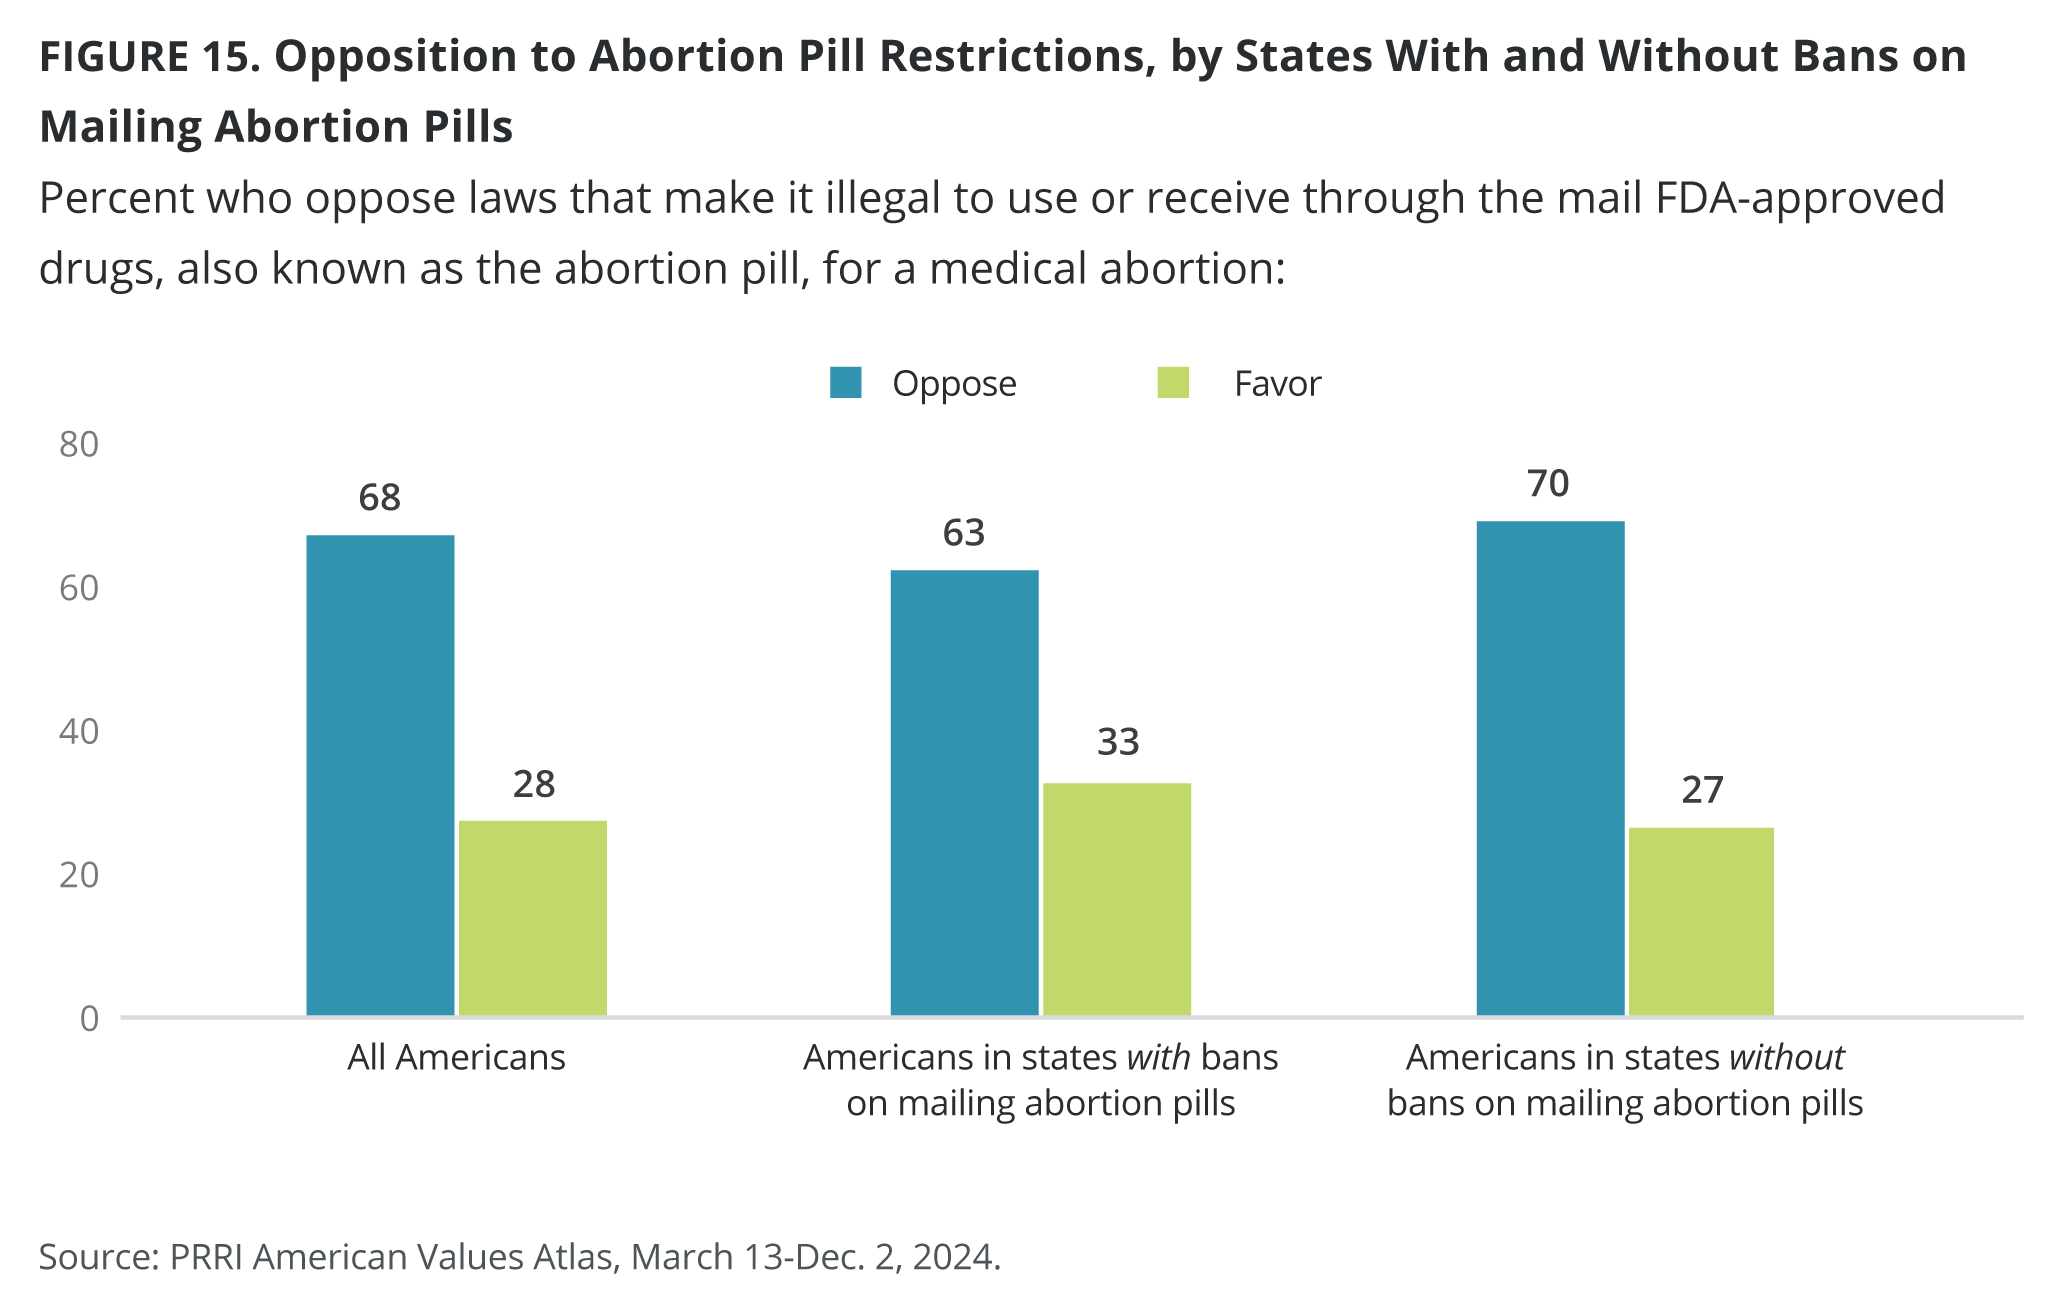
- Arizona, Florida, Oklahoma, and Texas ban providers from mailing abortion pills to patients. Residents in these states are less likely than those who live elsewhere to oppose laws that make it illegal to access abortion pills by mail (63% vs. 70%).
Introduction
Throughout 2024, PRRI interviewed more than 22,000 adults as part of its American Values Atlas, providing an in-depth analysis of the demographic, religious, and political characteristics of Americans’ views on the legality of abortion. In addition to unpacking how such characteristics impact those views, this report also includes new analysis of the intersection between religiosity and abortion legality in each state, and support for Christian nationalism. It concludes with an analysis of Americans’ views on restricting access to abortion pills.
Abortion Legality
More than six in ten Americans (63%) say abortion should be legal in most or all cases, which makes 2024 the fifth consecutive year in which at least 60% of Americans favor abortion legality. In comparison, one-third of Americans (34%) say abortion should be illegal in most or all cases; this includes only 8% of Americans who say abortion should be illegal in all cases.
Party Affiliation
Most Democrats have consistently favored abortion rights, but support has increased in recent years. In 2010, 71% of Democrats said that abortion should be legal in all or most cases, but after a decline to 66% in 2014, support has steadily risen to 85% in 2024. In contrast, about four in ten Republicans (39%) say abortion should be legal in all or most cases, but their support has increased by 4 percentage points since 2010 (35%). Independents (69%) are more likely than all Americans (63%) to support the legality of abortion, with their support increasing notably since 2022, when the U.S. Supreme Court’s landmark Dobbs v. Jackson Women’s Health Organization decision overturned Roe v. Wade (1973) and Planned Parenthood v. Casey (1992), effectively eliminating the federal right to abortion.
The percentage of Americans who say abortion should be illegal in all cases has dropped by half since 2010, declining from 15% to 8% in 2024. Among Democrats, just 4% now hold this view, down from 10% in 2010, reflecting a steady decline over time. Republicans have also become about 10 percentage points less likely to say that abortion should be illegal in all cases, with 13% holding this view in 2024, compared with 22% in 2010. Independents closely mirror all Americans, with only 5% supporting a total ban on abortion.
Gender, Age, and Race
Women (66%) are more likely than men (61%) to say abortion should be legal in all or most cases. Since 2010, men and women have largely supported abortion rights at similar rates, though women have grown slightly more supportive of abortion legality than men in recent years. Democratic women (87%) and men (84%) are significantly more likely than their independent (71% and 67%, respectively) and Republican counterparts (40% and 37%, respectively) to favor abortion legality.
Around six in ten Americans from all age groups say abortion should be legal in all cases. While the majority of Americans under the age of 65 have consistently supported abortion rights, Americans ages 65 and older have gradually increased in support since 2010, from 47% to 63% in 2024.
In 2024, 87% of Democratic young women and 82% of Democratic young men say abortion should be legal in all or most cases, compared with 36% of young Republican women and 31% of young Republican men. These divides between partisans by age and gender remain consistent across other age groups.
Approximately 73% of Asian American and Pacific Islanders (AAPI) and 70% of Black Americans believe abortion should be legal in most or all cases, as do 64% of multiracial Americans, 63% of white Americans, and 59% of Hispanic Americans. Support for abortion legality has grown significantly among both Black (54%) and white Americans (59%) since 2010. In contrast, Hispanic views on abortion have fluctuated over time, with support standing at 55% in 2010.
Religious Affiliation
Majorities across most religious traditions say that abortion should be legal in all or most cases, including Buddhists (84%), Unitarian Universalists (83%), other non-Christians (83%), religiously unaffiliated Americans (83%, up from 76% in 2010), Jewish Americans (79%), Hindus (72%), Black Protestants (71%, up from 56% in 2010), white mainline/non-evangelical Protestants (69%), Muslims (66%), white Catholics (62%, up from 56% in 2010), and Hispanic Catholics (59%). In contrast, Hispanic Protestants (44%), Latter-day Saints (29%), white evangelical Protestants (28%), and Jehovah’s Witnesses (22%) are the only major religious groups where the majority does not support the legality of abortion.
Americans who seldom or never attend religious services (78%) are more likely than Americans who attend services monthly or a few times a year (61%) and Americans who attend services weekly or more (35%) to say that abortion should be legal in most or all cases. Support for abortion legality has remained steady among attenders, and has increased since 2010 among those who seldom or never attend services (72%).
Americans who qualify as Christian nationalism Rejecters (92%) are more likely than Skeptics (66%), Sympathizers (41%), and Adherents (26%) to support the legality of abortion.
Support for the Legality of Abortion by State
A majority of residents in most states and the District of Columbia say that abortion should be legal in all or most cases. Massachusetts (83%), Vermont (80%), Rhode Island (77%), and New Hampshire (75%) are the states with the highest support. In contrast, Arkansas (49%), Idaho (48%), Tennessee (47%), Oklahoma (46%), Utah (44%), Louisiana (42%), and West Virginia (41%) are the only states where fewer than half of their residents support abortion rights.
Around one in ten residents in most states say abortion should be illegal in all cases. Nebraska has the highest percentage holding this view (17%), followed by 14% of residents in South Dakota and Mississippi, 13% of residents in Louisiana, and 12% of residents in North Dakota, South Carolina, and West Virginia. Just 2% of residents in Rhode Island say abortion should be illegal in all cases.
Abortion Views in States Based on States’ Levels of Abortion Restrictions
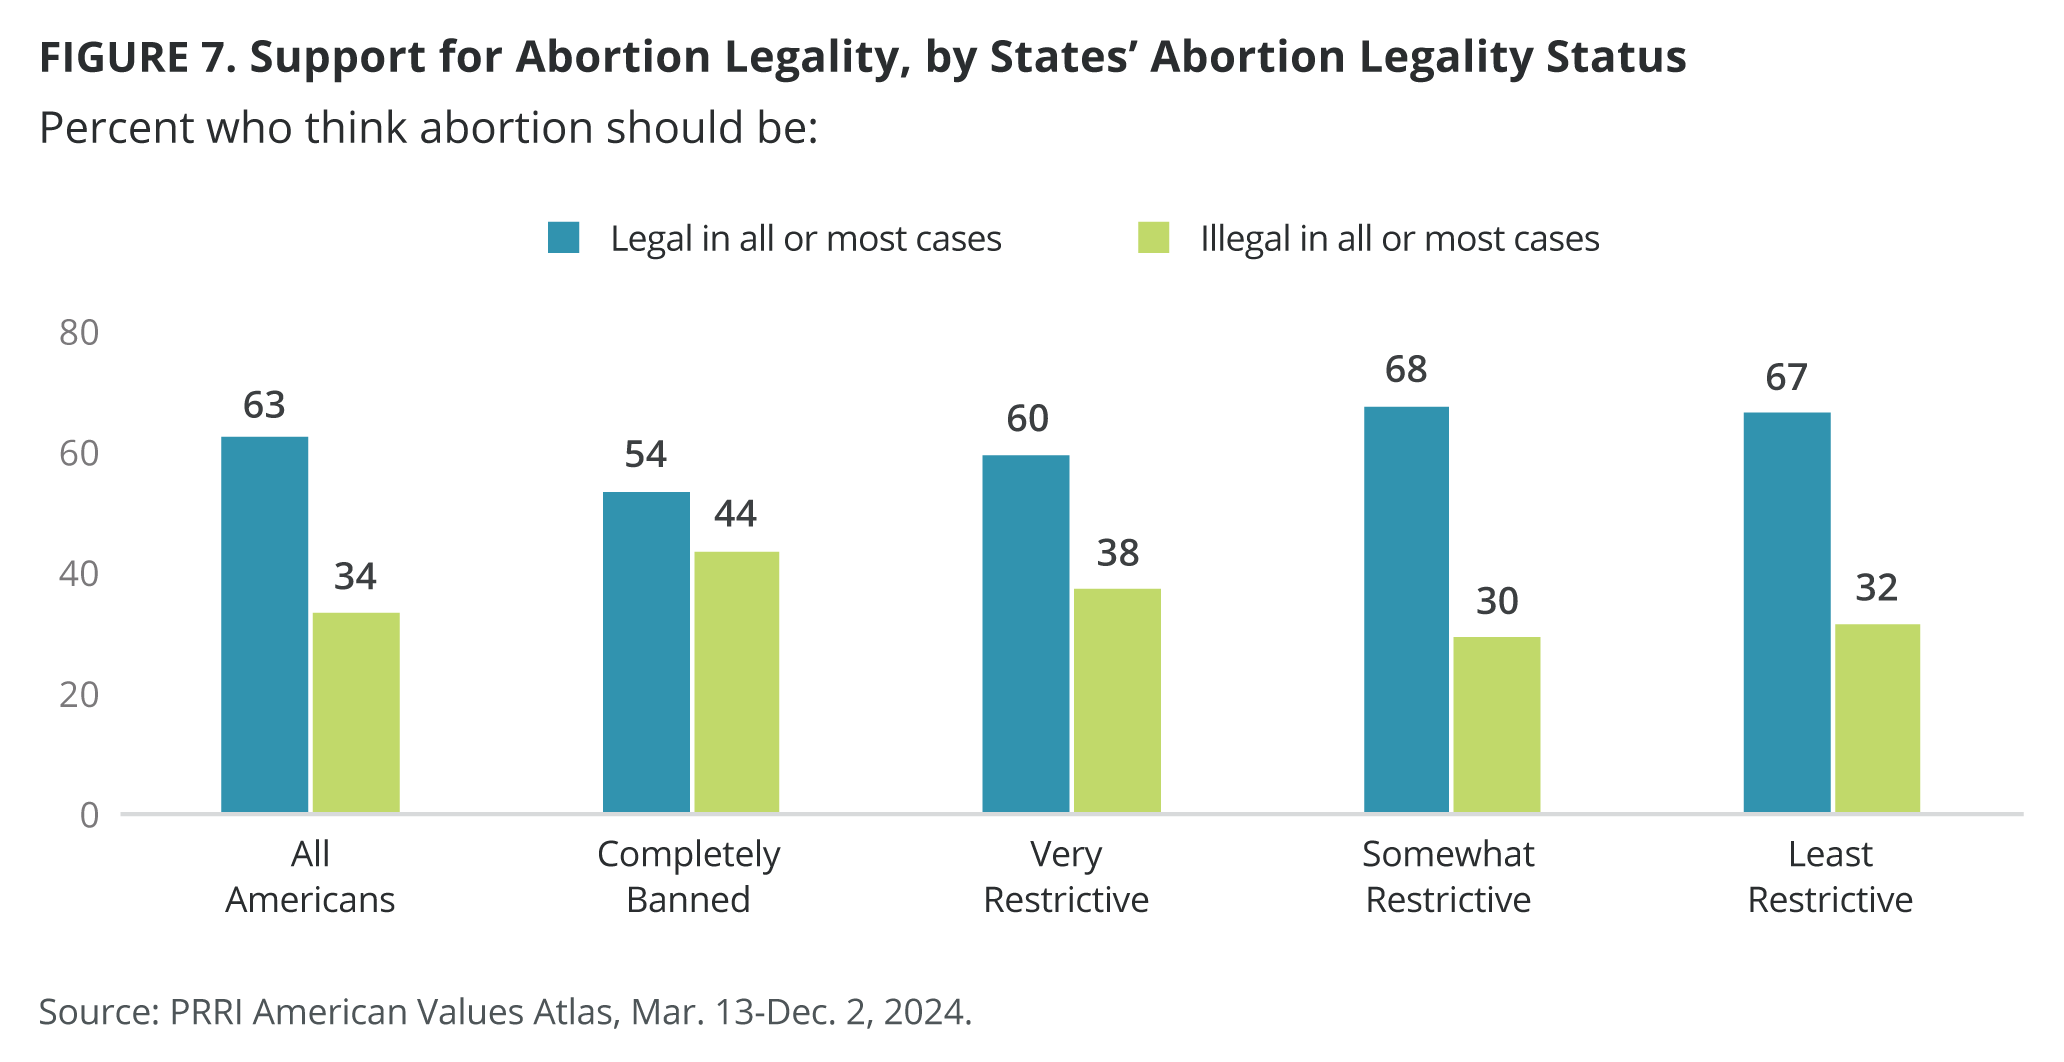
To better understand how existing abortion policies are linked to Americans’ views on abortion legality, PRRI categorized states into four groups based on the legal status of abortion as of February 2025: (1) states where abortion is completely banned, (2) states with very restrictive gestational limits, (3) states with somewhat restrictive gestational limits, and (4) states with the least restrictions.[1]
Americans living in states with more restrictive abortion laws are more likely to oppose abortion, whereas those in less restrictive states show higher levels of support for abortion rights. Specifically, support for abortion legality is lowest in states where abortion is completely banned (54%) and very restrictive (60%). Support increases in states where abortion laws are somewhat restrictive (68%) and least restrictive (67%). In contrast, opposition to abortion legality is highest in states with complete bans (44%) and very restrictive laws (38%) but declines in somewhat restrictive (30%) and least restrictive (32%) states.
Profile of Abortion Legality Supporters vs. Opponents
Party, Age, Education, and Gender
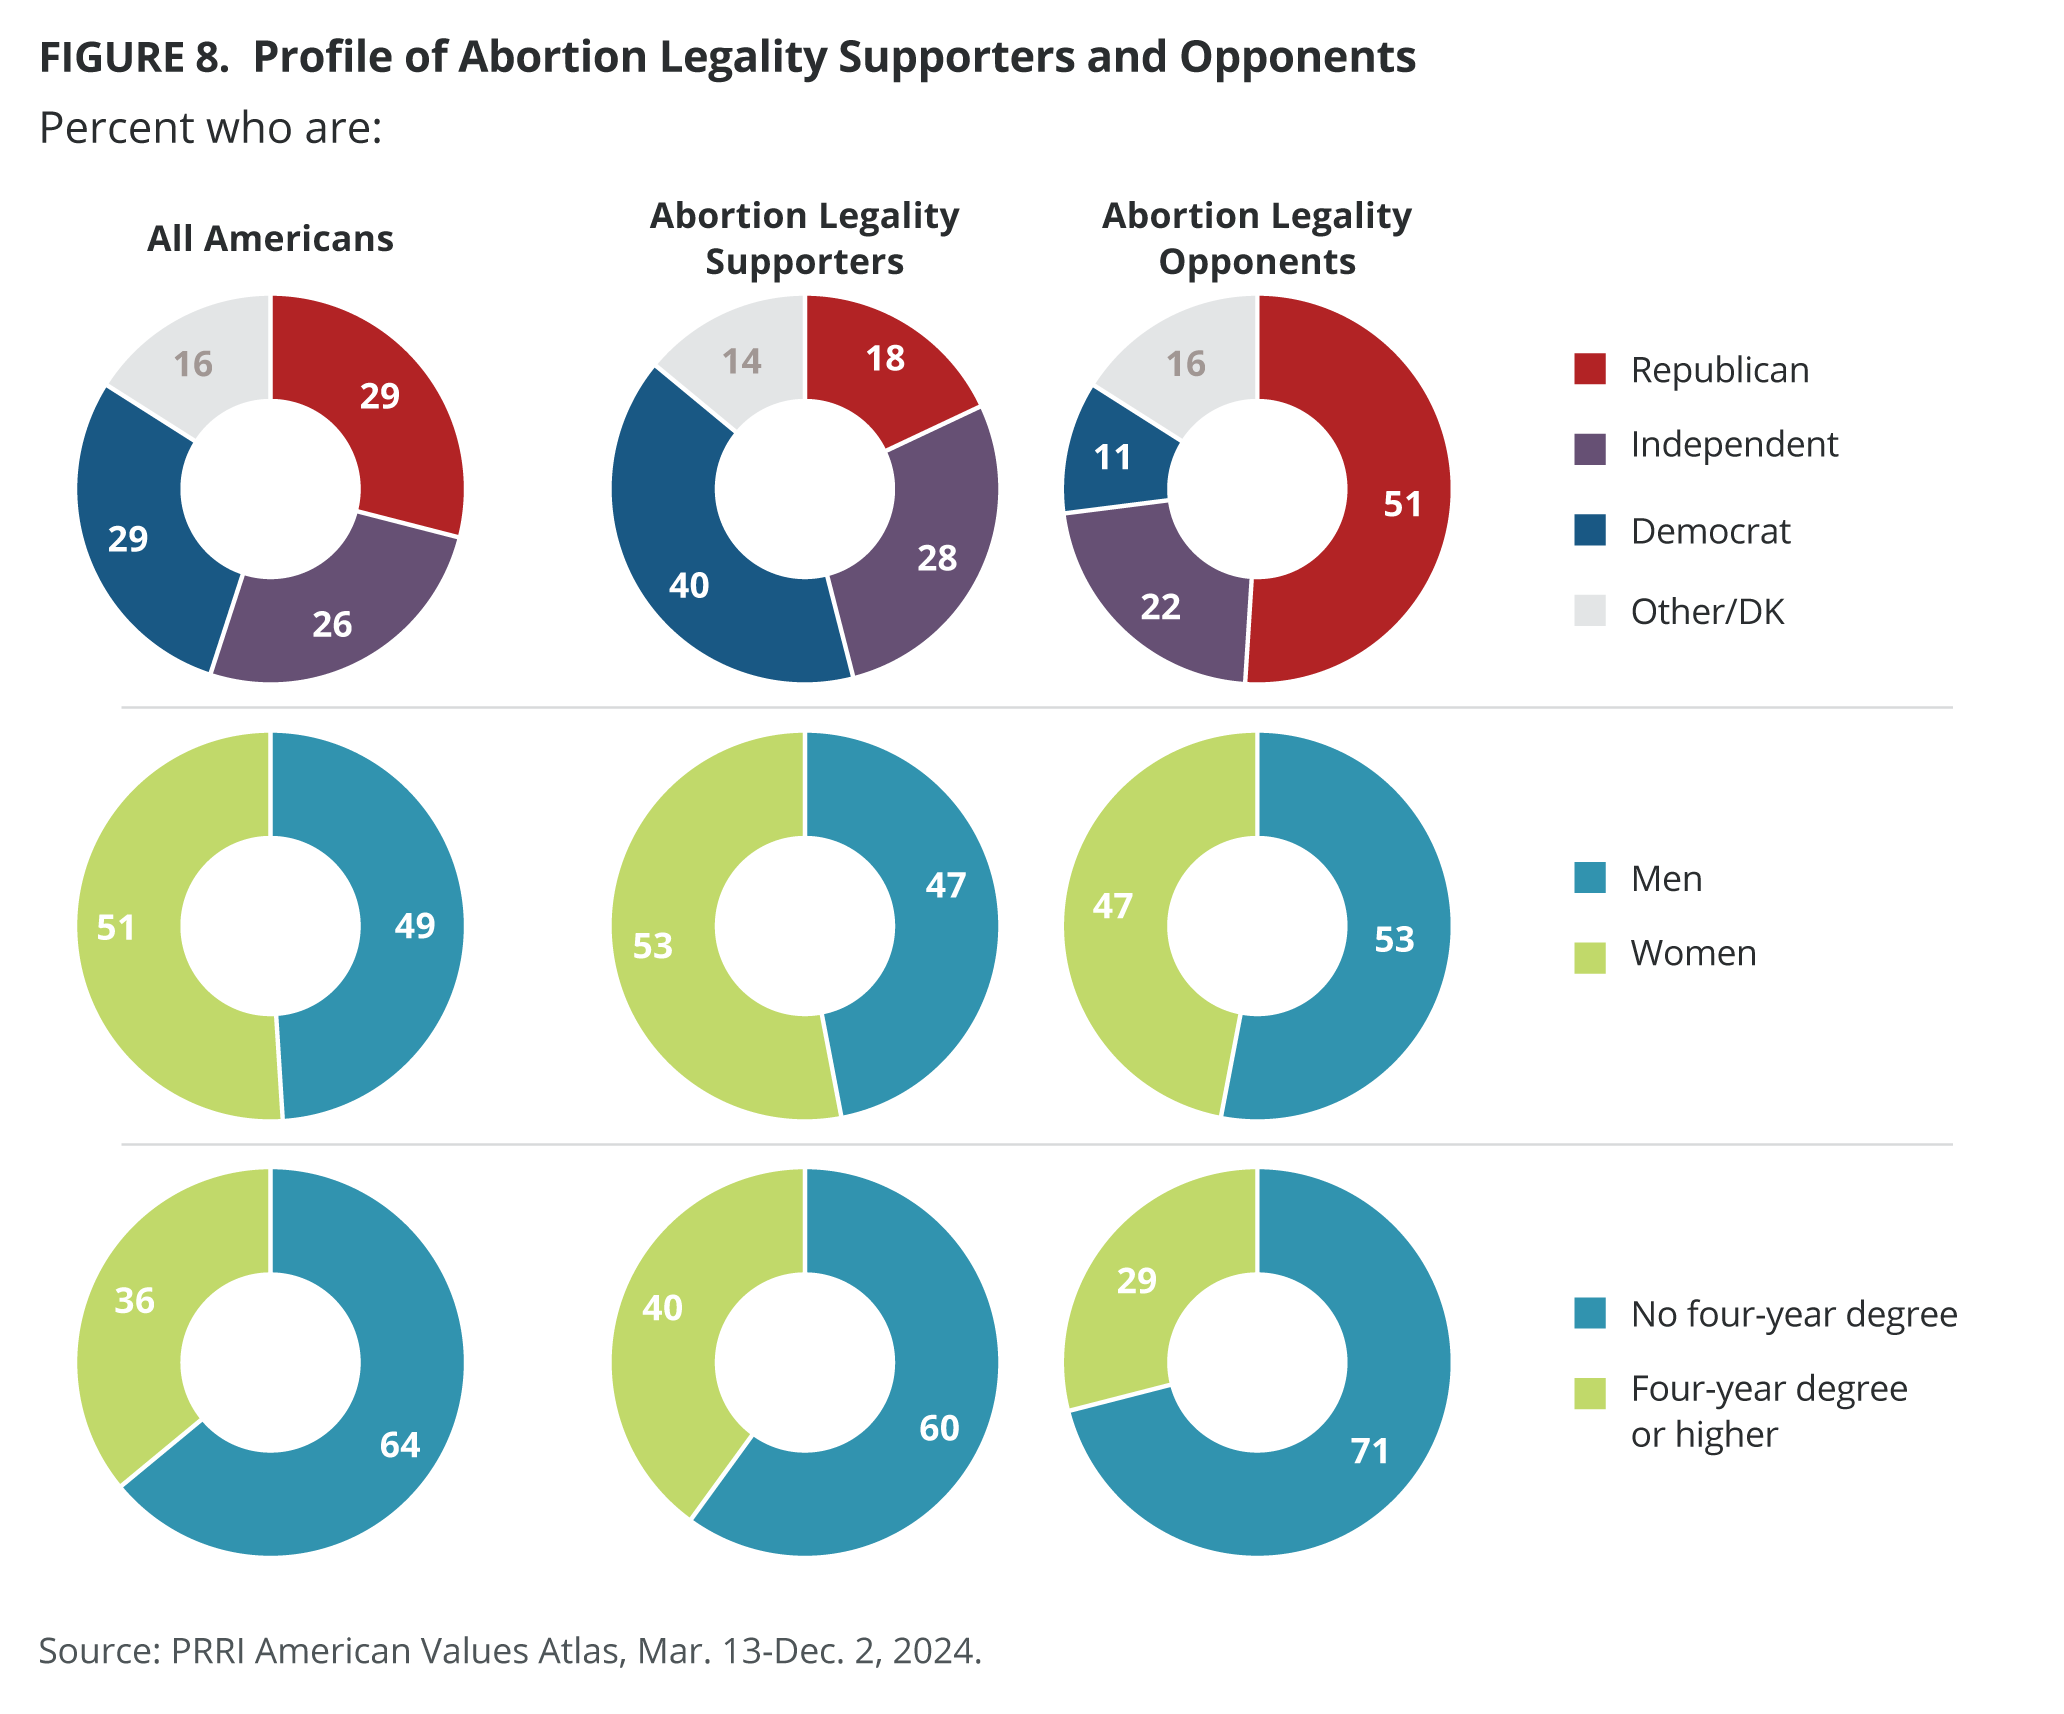
Americans who support abortion legality (40%) are four times as likely as those who oppose it (11%) to identify as Democrats. Conversely, Republican identification is much higher among abortion opponents (51%) than supporters (18%). Independents are slightly more represented among abortion supporters (28%) than opponents (22%). Additionally, abortion legality supporters are more likely to be women (53%) than opponents (47%).
While the age distribution of abortion legality opponents and supporters closely mirrors national averages, abortion legality supporters (40%) are more likely than opponents (29%) to have at least a four-year college degree.
Religious Affiliation
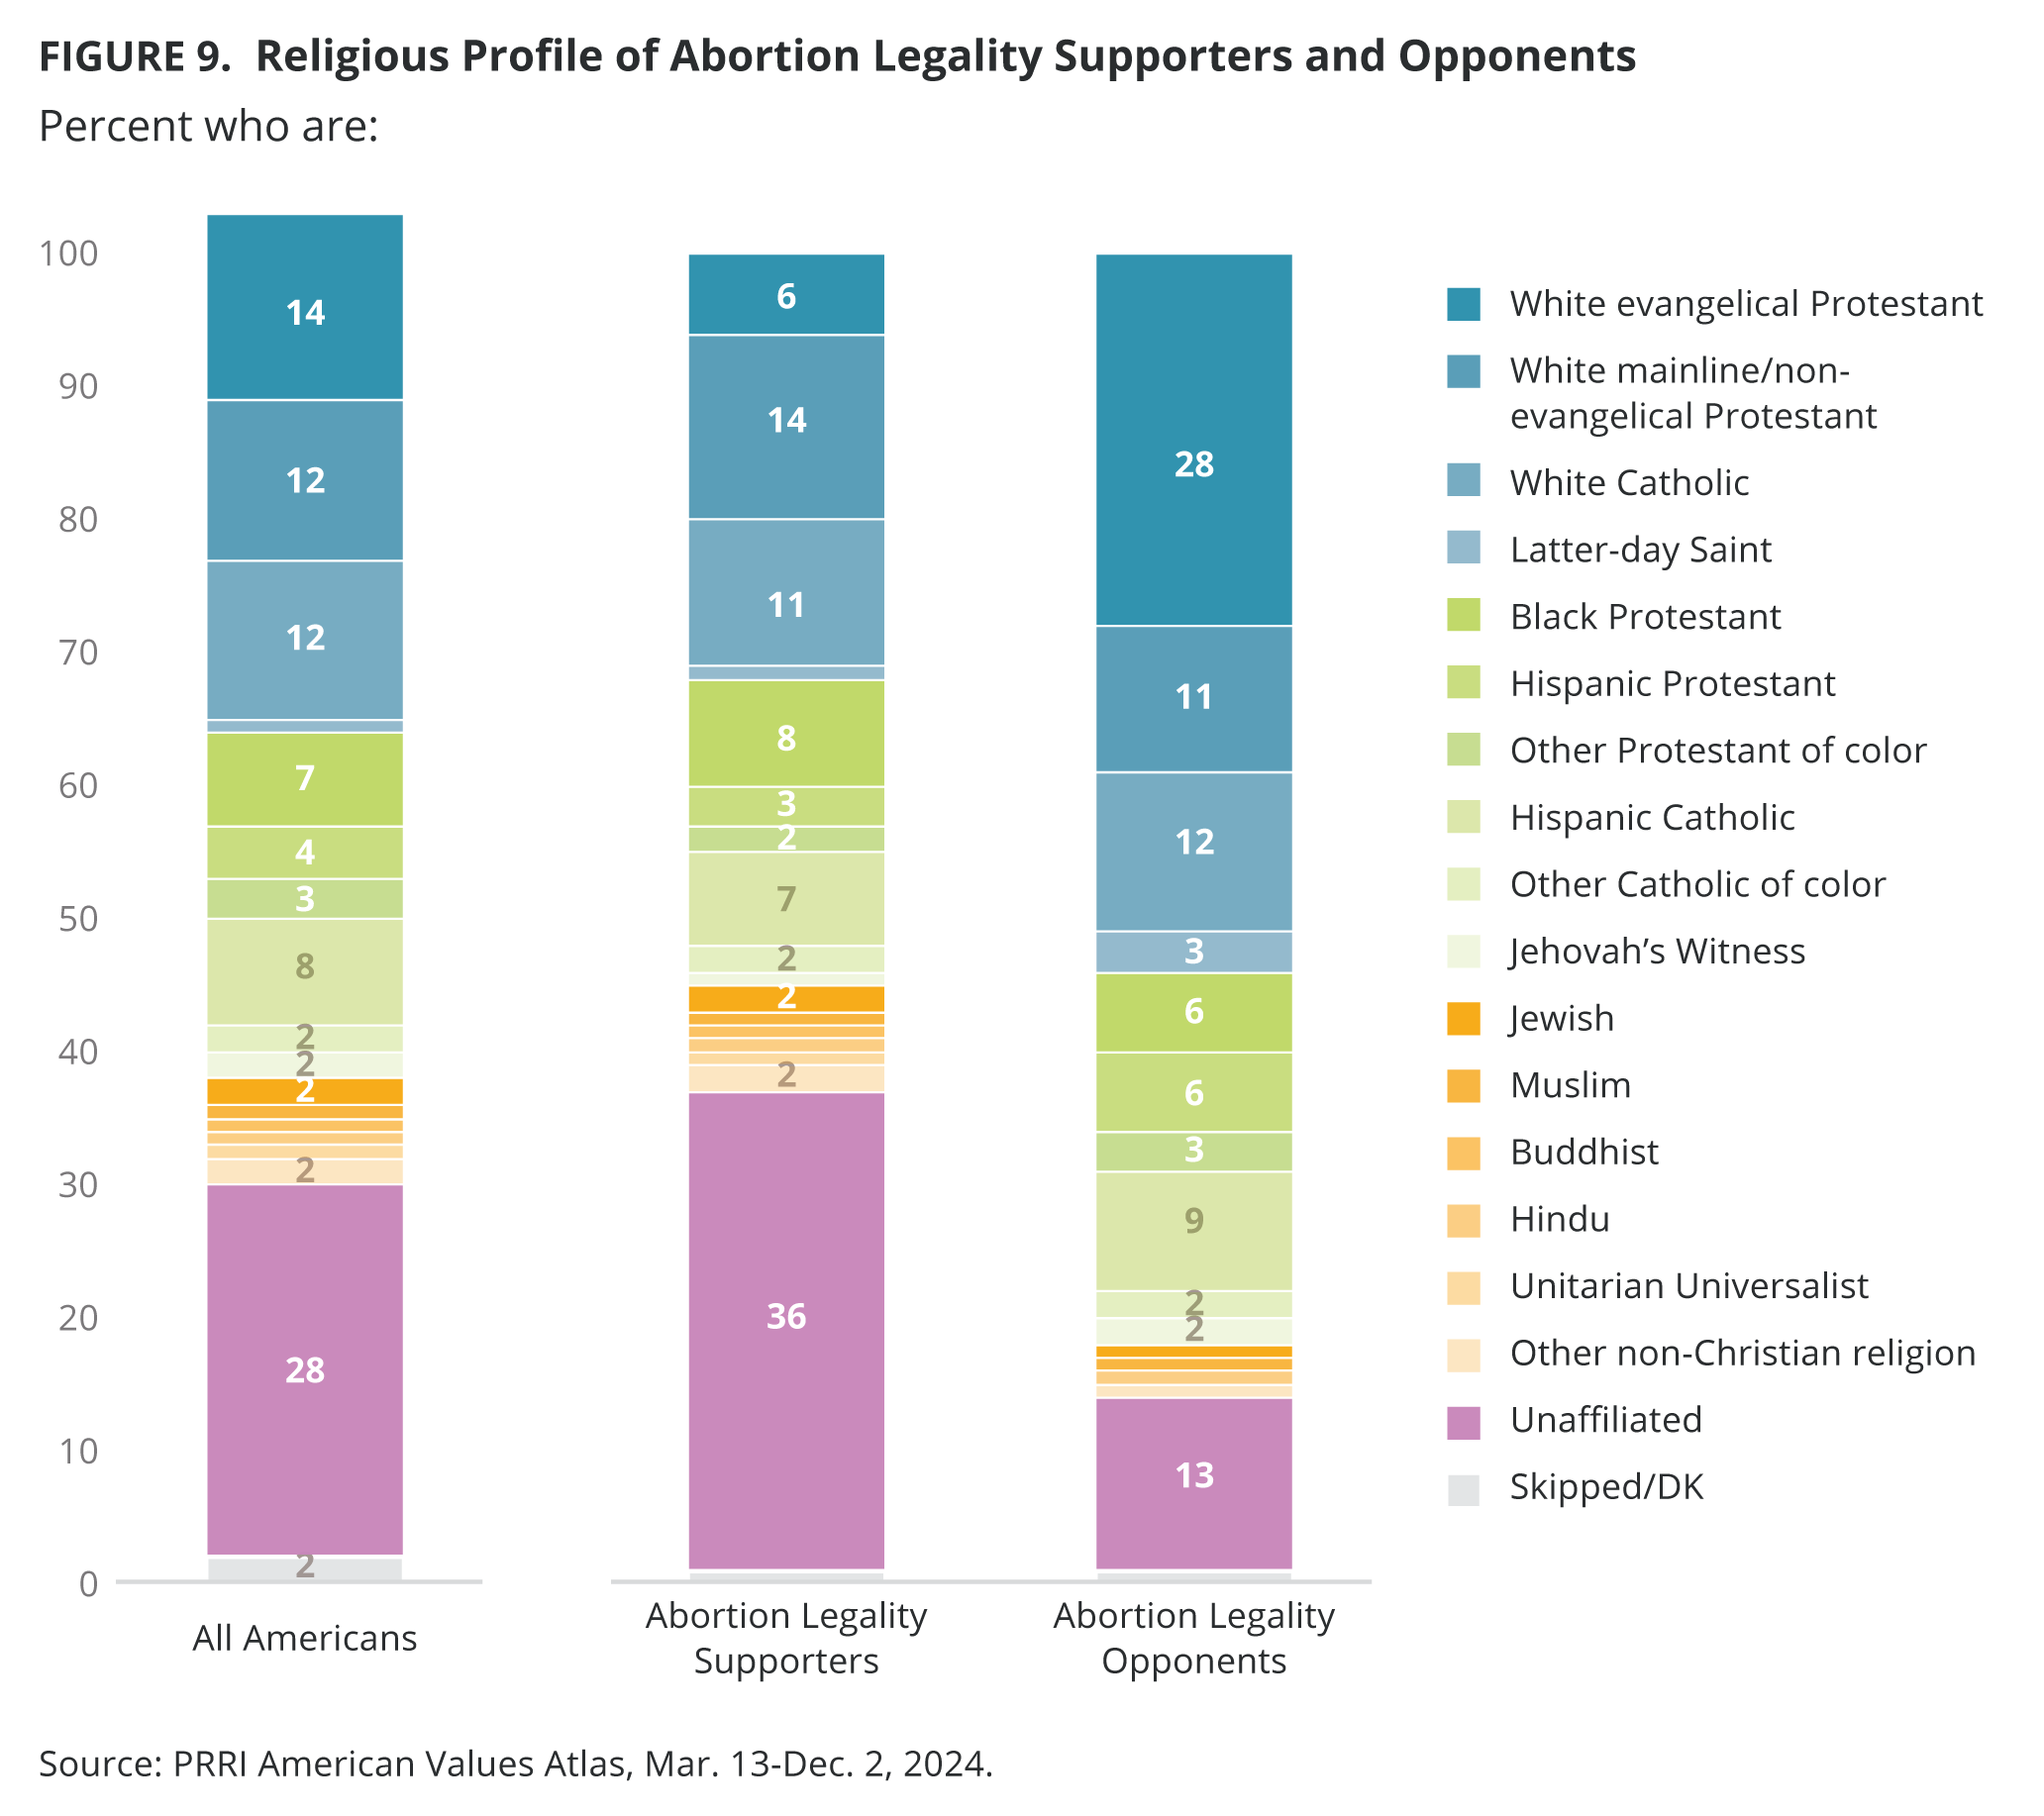
Americans who support the legality of abortion are about three times more likely than those who oppose it to identify as religiously unaffiliated (36% vs. 13%). Supporters are also slightly more likely than opponents to identify as members of a non-Christian religion (8% vs. 4%). Conversely, opponents of the legality of abortion are more likely than supporters to identify as white Christian (55% vs. 32%). This difference is largely driven by white evangelical Protestants who make up 28% of abortion legality opponents, compared with only 6% of supporters. Additionally, opponents are more likely than supporters to identify as Christian of color (28% vs. 23%).
Religious Participation and Christian Nationalism
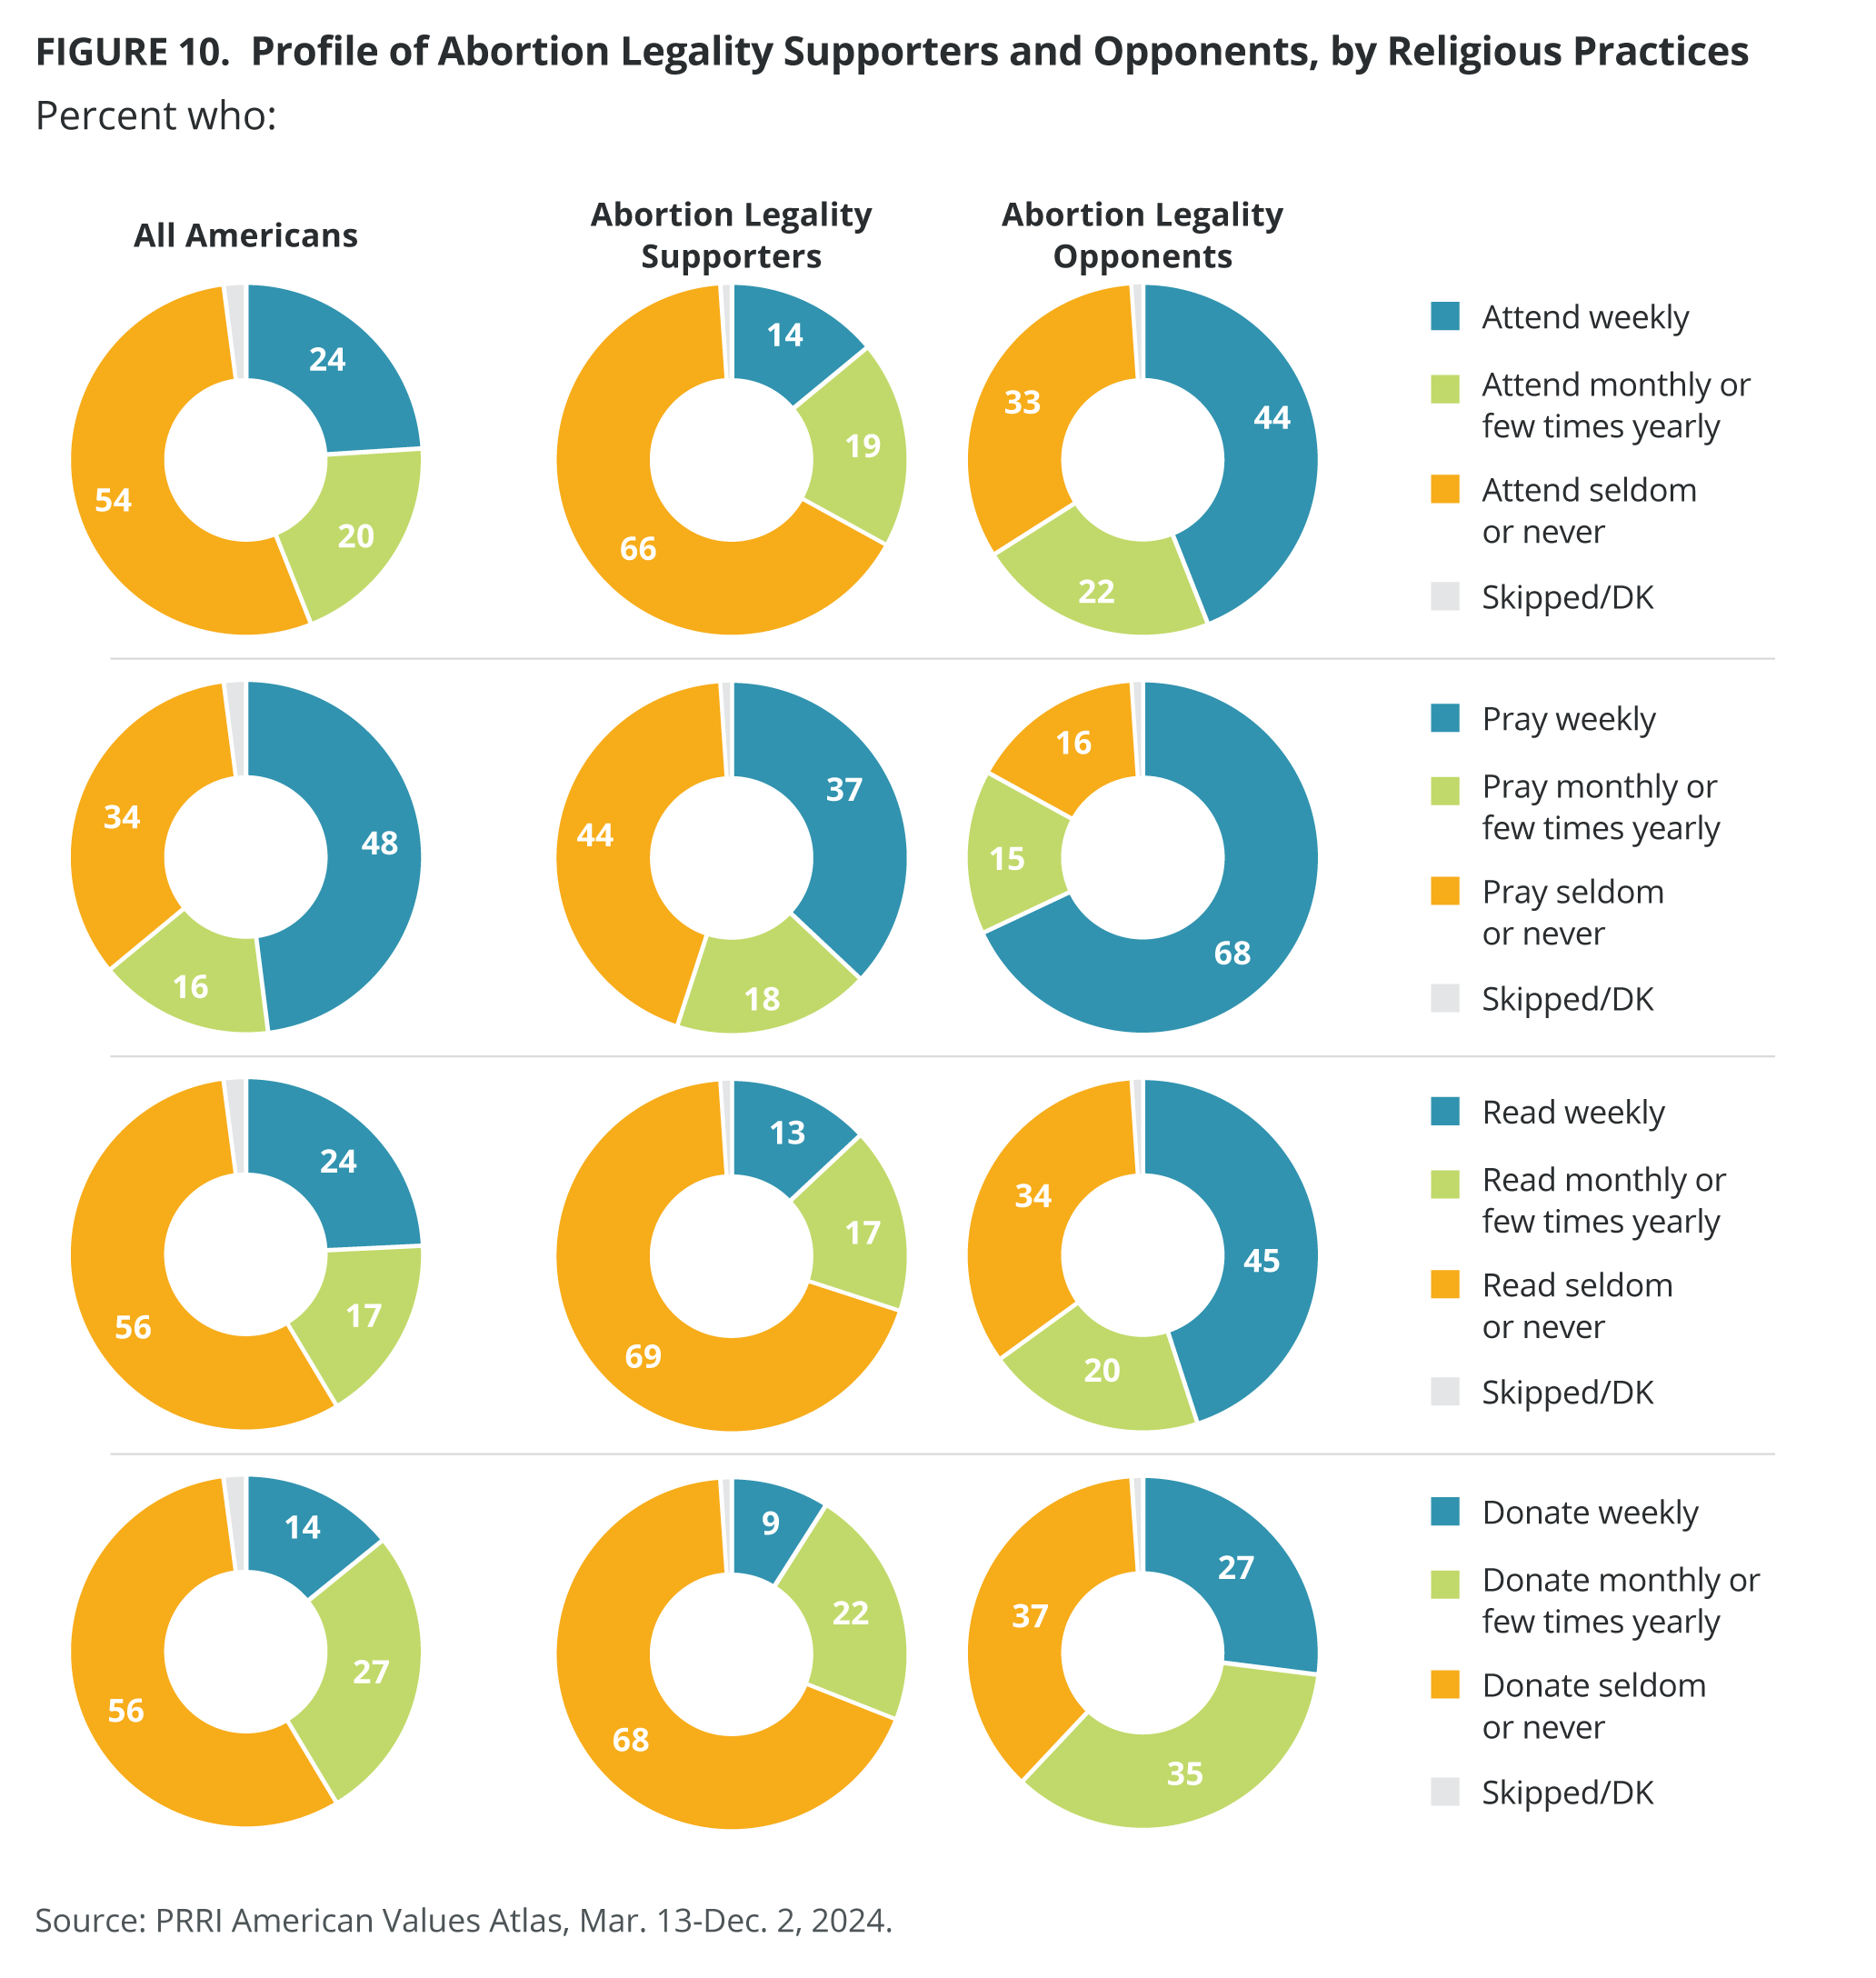
Religious participation plays a more limited role in the lives of abortion legality supporters than it does among opponents. Most supporters of abortion legality report seldom or never reading a religious text (69%), donating to a religious institution (68%), or attending religious services (66%). Additionally, a plurality of supporters prays seldom or never at home (44%). In contrast, most abortion opponents pray at least once a week (68%), while a plurality reads religious texts (45%) and attends religious services at least once a week (44%). Further, one-quarter of abortion opponents donate money to religious services at least once a week (27%).
Supporters of abortion legality are also more likely than opponents to reject Christian nationalist ideology. According to the 2024 PRRI American Values Atlas, 43% of those who support abortion legality qualify as Christian nationalism Rejecters, 38% as Skeptics, 13% as Sympathizers, and only 4% as Adherents. In comparison, among those who oppose abortion legality, just 6% qualify as Rejecters, compared with roughly one-third who qualify as Skeptics (35%) and Sympathizers (34%), and 22% as Adherents.
The Impact of Religious Practices and Christian Nationalism at the State Level
Religious Practices
Frequent participation in religious practices is negatively correlated with support for abortion legality. To measure combined frequent religious practices, PRRI created an additive scale that assigns a value of 1 to respondents who attend religious services, pray, read religious texts, or donate at least once a week, and 0 to all others. These values were then summed up to create a total score, where scores of 1 or higher reflect stronger religious practice and 0 reflect weaker religious practice.[2] The findings show that in fourteen states, mostly in the South, at least 51% of residents frequently attend religious services, pray, read religious texts, or donate to a religious institution.[3]
The scatterplot below shows the relationship between a state’s percentage of its residents who frequently attend religious services, pray, read religious texts, and donate on the X axis, plotted against the percentage of that state’s support for legal abortions in all or most cases. The downward sloping trend line through the distribution indicates that, overall, the higher the percentage of a state’s residents’ frequent practice of religion, the less likely they are to support the legality of abortion.
For instance, while just 26% of residents in Massachusetts frequently participate in religious activities, most of its residents support the legality of abortion in all or in most cases (83%). In contrast, just under half of residents in Louisiana practice religion at least once a week (59%) and 42% support the legality of abortion in most or all cases. Similarly, the majority of residents in Tennessee practice religion frequently (56%) and 47% support abortion in all or most cases. Alabamans are a slight outlier, with about six in ten practicing religion frequently (60%) and supporting the legality of abortion (60%).
Christian Nationalism
Support for Christian nationalism is also negatively correlated with support for abortion legality. The scatterplot below shows the relationship between a state’s average raw score on the Christian nationalism scale (with a range from 0 to 1) on the X axis, plotted against the percentage of that state’s support for abortion legality in most or all cases. The downward sloping trend line through the distribution demonstrates that, overall, the higher states score on the Christian nationalism scale, the less likely they are to support the legality of abortion.
Massachusetts has an average score of 0.20 on the Christian nationalism scale, with 83% of its residents supporting the legality of abortion in most or all cases. Similarly, Washington, Rhode Island, Vermont, and New Jersey all have comparable scores on the Christian nationalism scale (0.21, 0.22, 0.23, and 0.24 respectively) with 73%, 77%, 80%, and 69% of their residents supporting the legality of abortion. In comparison, states like Louisiana and Mississippi have significantly higher average scores on the Christian nationalism scale (both 0.50) and 42% and 52% of their residents say abortion should be legal in all or most cases, respectively.
The Abortion Pill
Over two-thirds of Americans oppose laws that make it illegal to use or receive through the mail FDA-approved drugs for medical abortion (68%), often called abortion pills, while about three in ten favor these laws (28%). Opposition has gone down by 4 percentage points, from 72% in 2022 when the question was first asked.
Party and Demographics
Democrats (81%) and independents (72%) are significantly more likely than Republicans (53%) to oppose laws that make it illegal to use or receive abortion pills through the mail. In 2022, a slightly higher percentage of Democrats (85%), independents (75%), and Republicans (56%) opposed these laws. Men (69%) and women (68%) equally oppose laws that make it illegal to access abortion pills through mail.
There are no significant differences among age groups; however, variations are present across racial groups and education levels. Over seven in ten AAPI (72%), multiracial Americans (72%), and white Americans (71%) oppose laws that make it illegal to access abortion pills through the mail, compared with 66% of Black and 61% of Hispanic Americans. Three in four Americans with a college degree oppose such laws (76%), compared with about two-thirds of those without a college degree (64%).
Religious Affiliation and Christian Nationalism
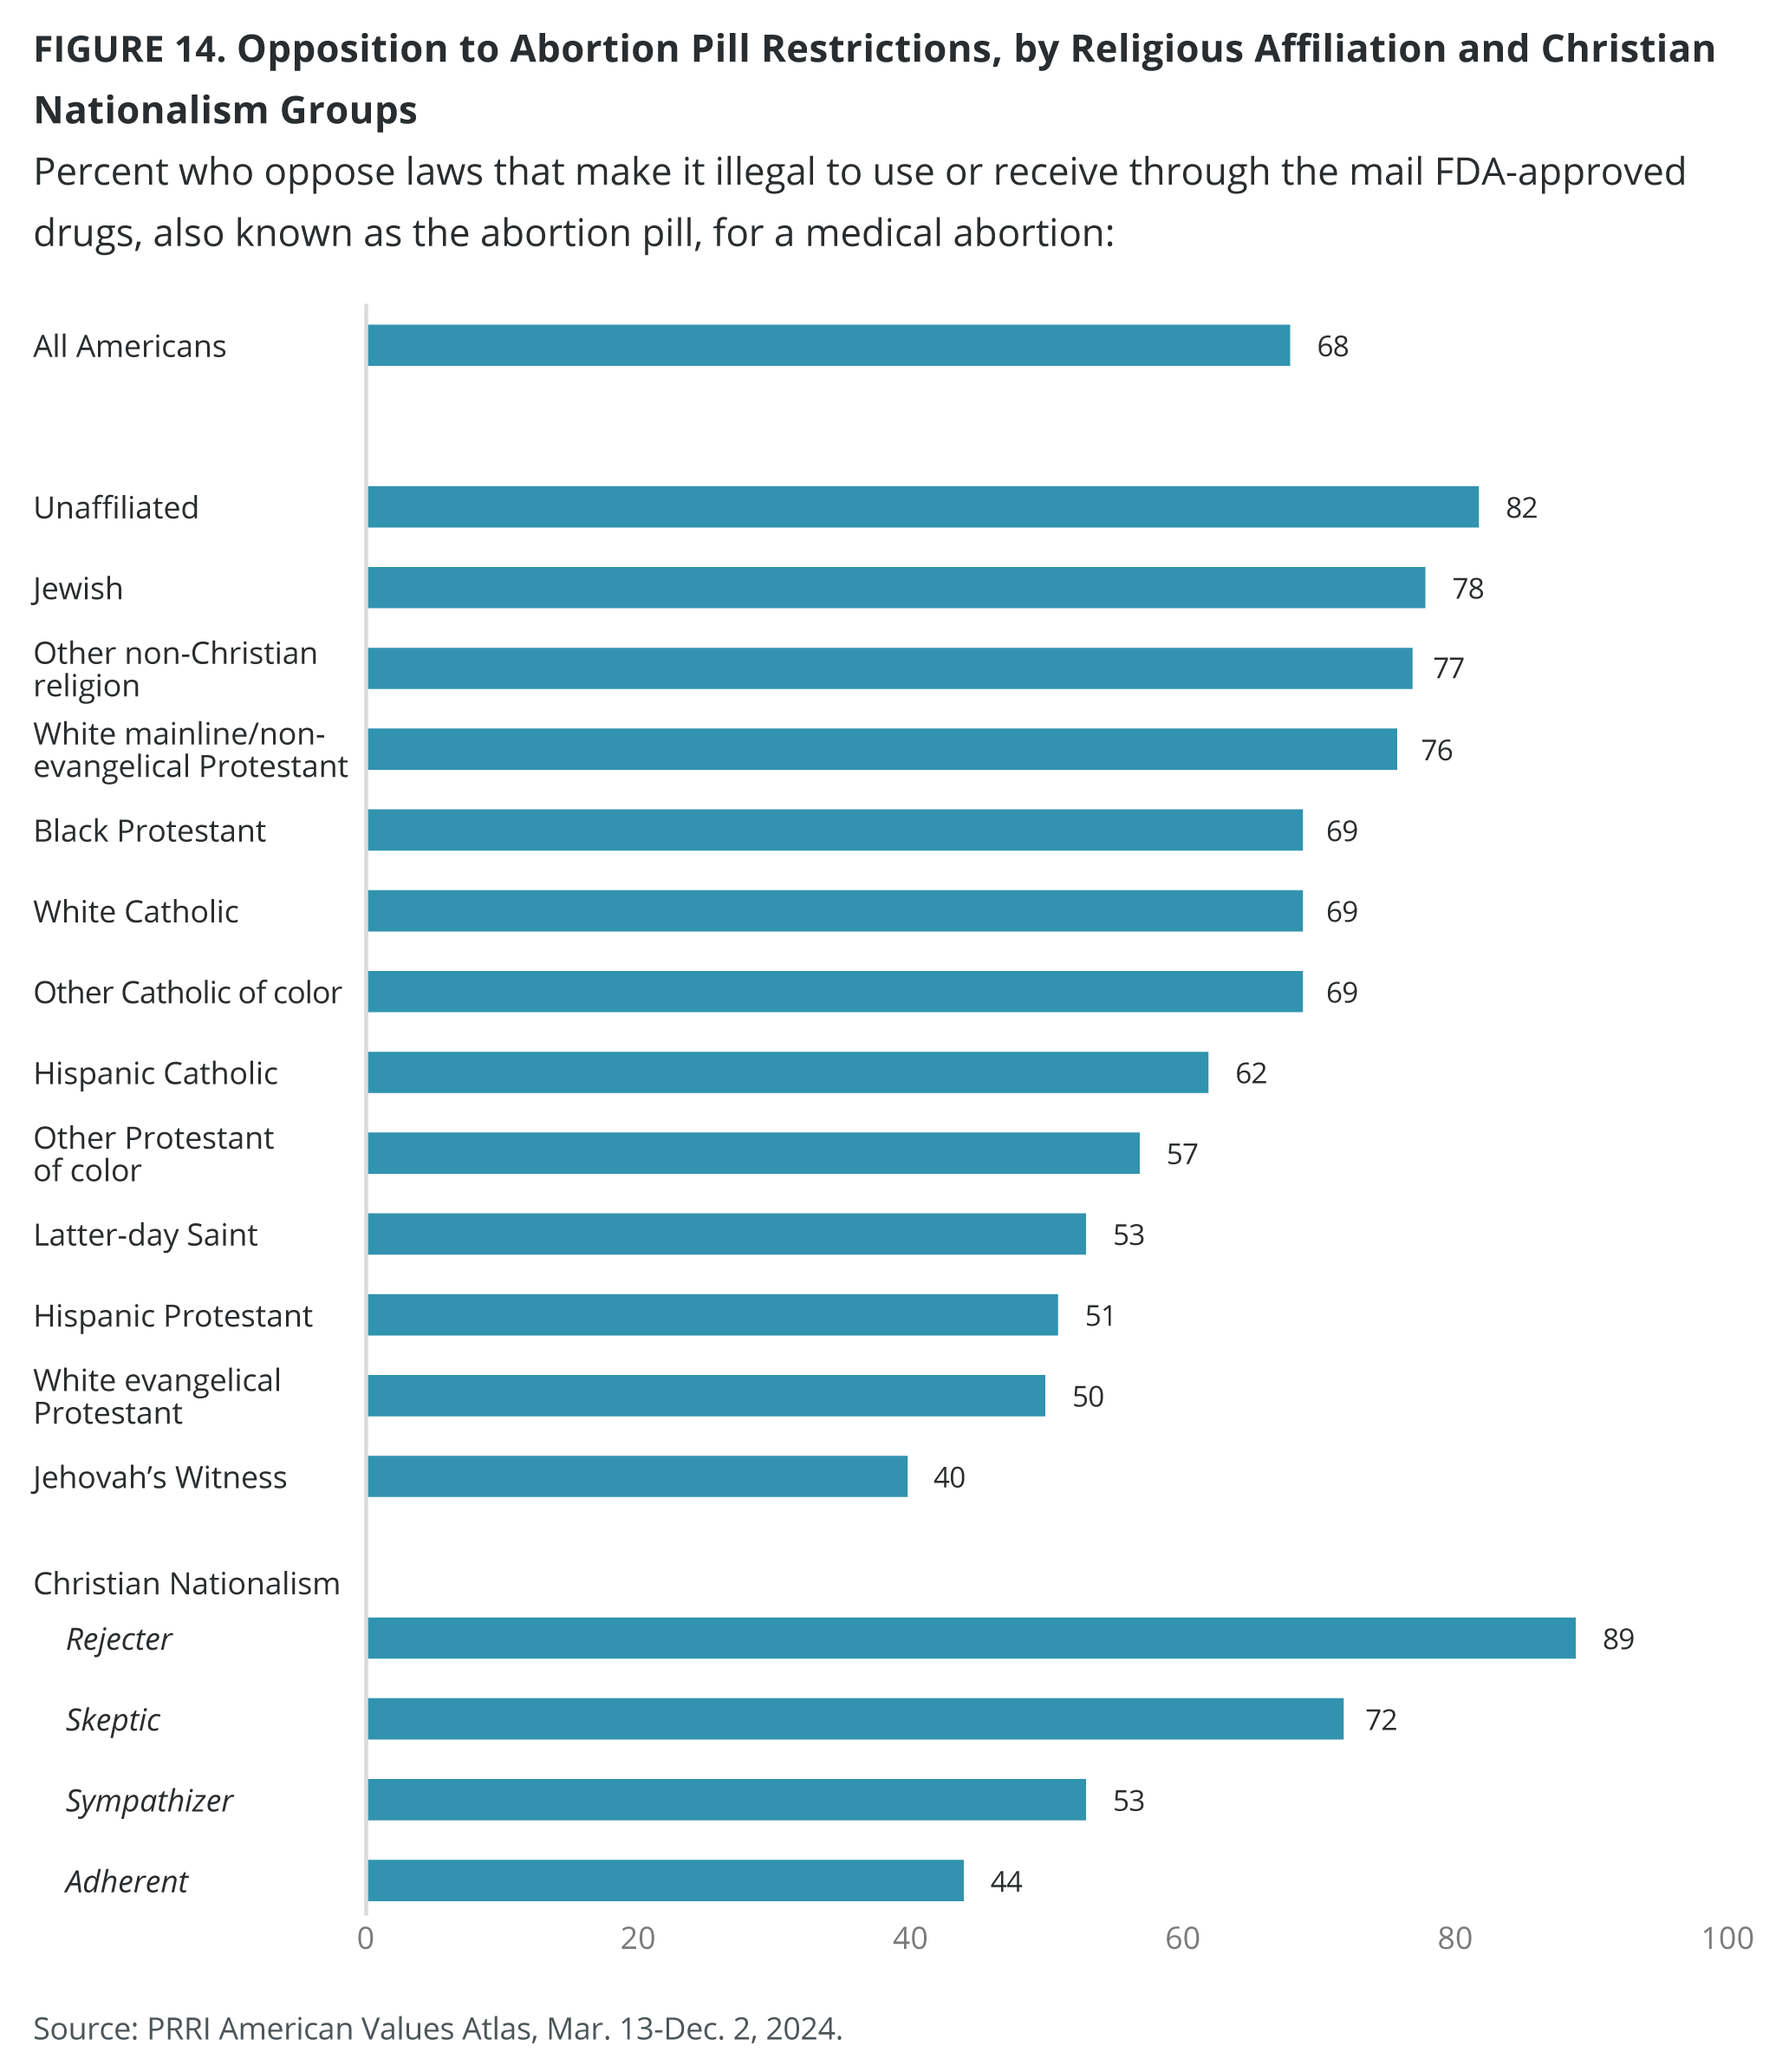
Except for Jehovah’s Witnesses (40%), at least half of all religious groups oppose laws that make it illegal to access abortion pills by mail, including white evangelical Protestants (50%), Hispanic Protestants (51%), and Latter-day Saints (53%). Unaffiliated Americans (82%), Jewish Americans (78%), members of other non-Christian religions (77%), and white mainline/non-evangelical Protestants (76%) are the most likely to oppose such laws. About seven in ten Black Protestants (69%), white Catholics (69%), and other Catholics of color (69%), as well as roughly six in ten Hispanic Catholics (62%) and other Protestants of color (57%), also oppose laws that make it illegal to access abortion pills by mail.[4]
Americans who qualify as Christian nationalism Rejecters (89%) are more likely than Skeptics (72%), Sympathizers (53%), and Adherents (44%) to oppose laws that make it illegal to access abortion pills by mail.
State Bans on Mailing Abortion Pills
Arizona, Florida, Oklahoma, and Texas ban providers from mailing abortion pills to patients. Though still a majority, residents in these states are 7 percentage points less likely to oppose laws that make it illegal to access abortion pills by mail than those who live elsewhere (63% vs. 70%).[5]
APPENDIX A. Survey Methodology
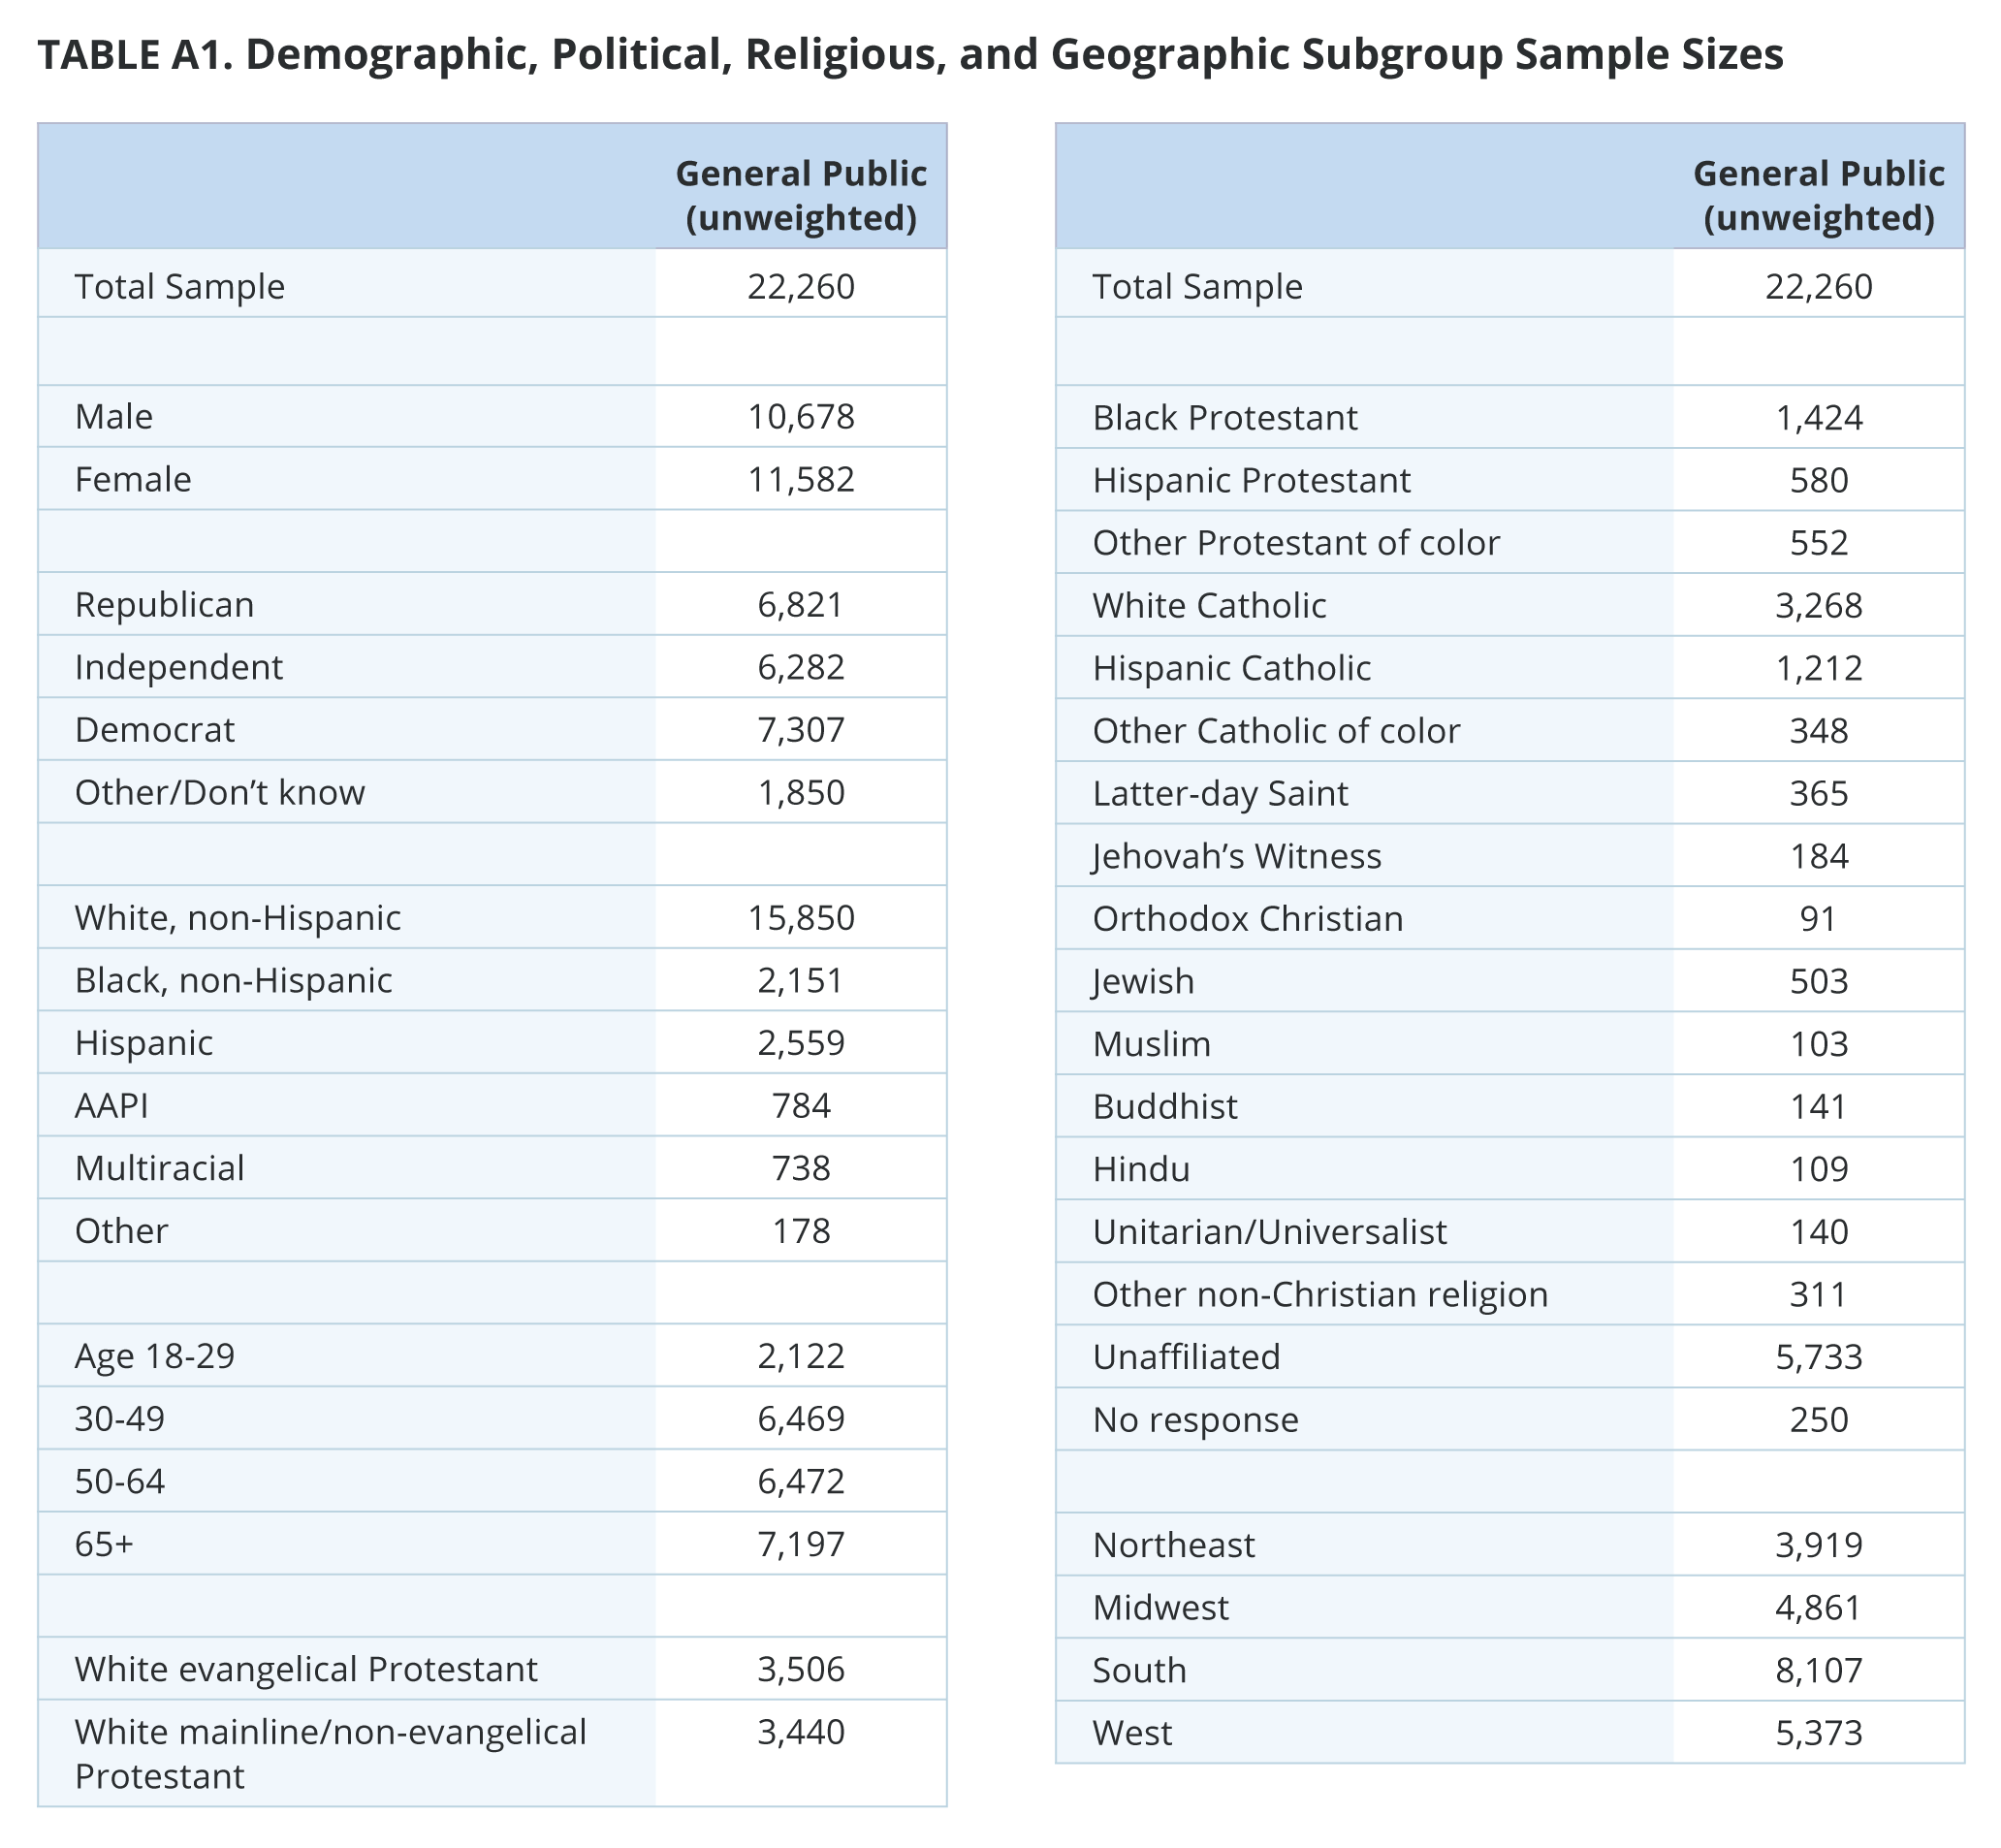
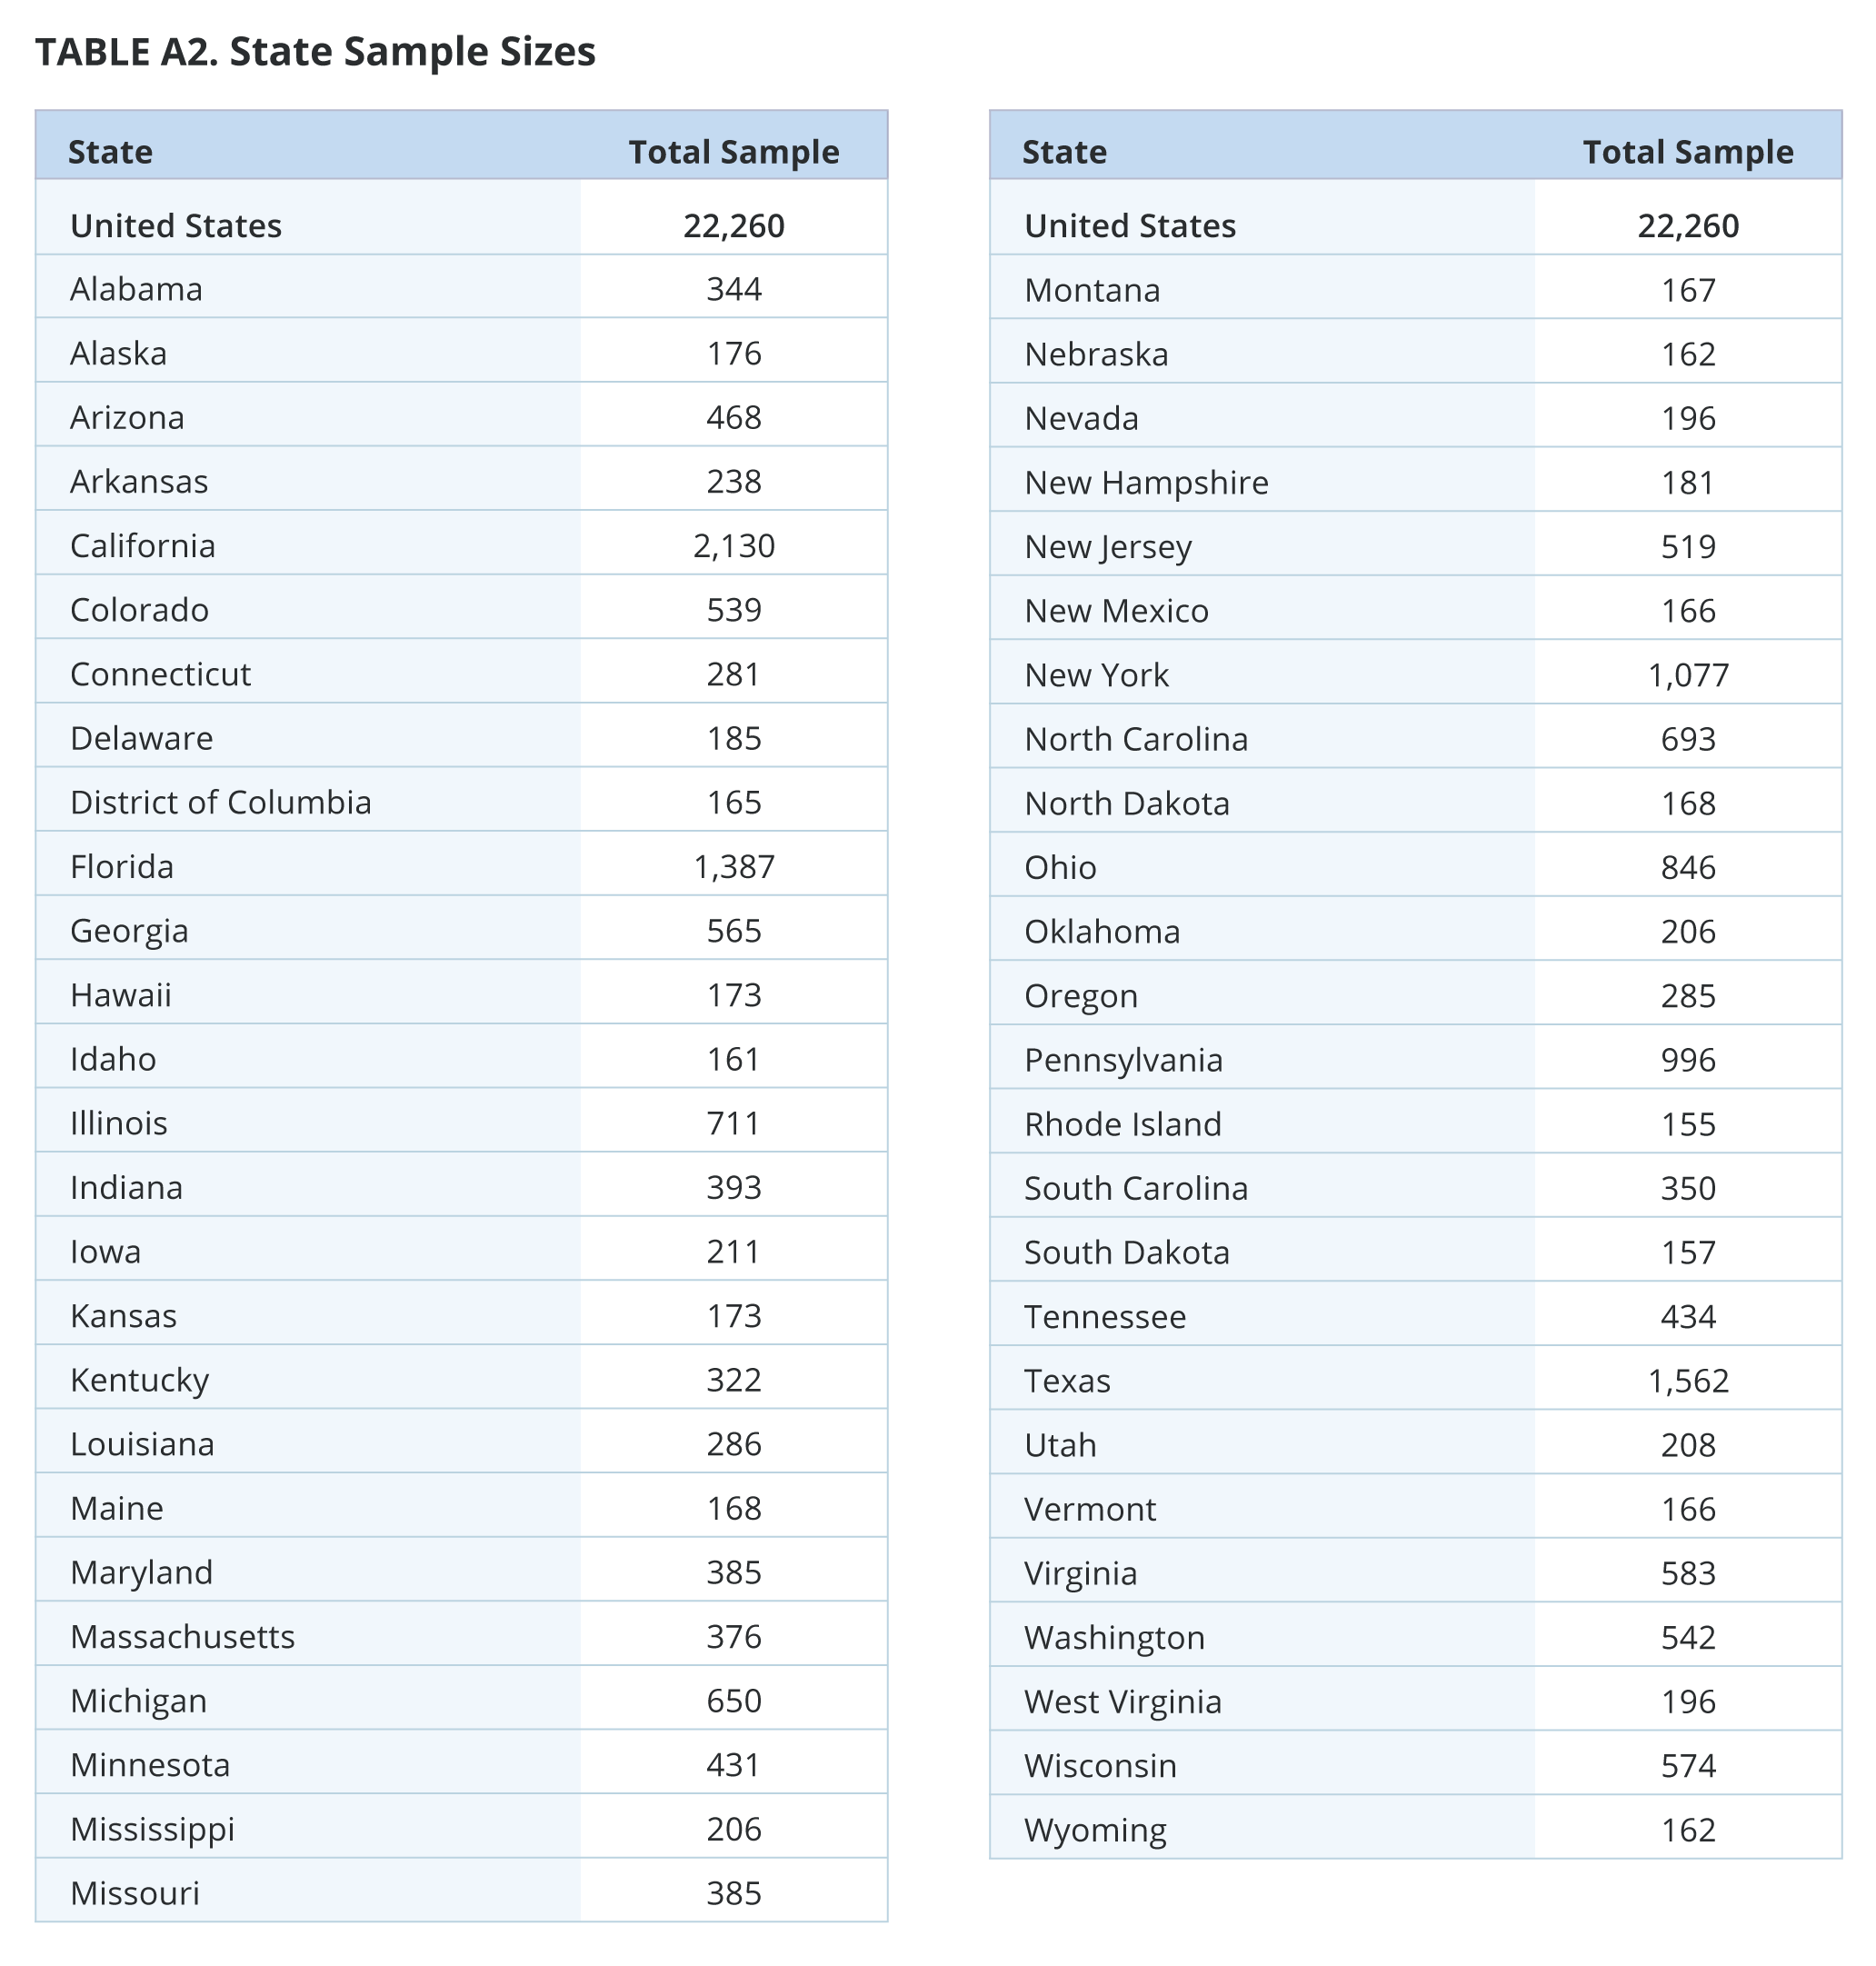
The survey was designed and conducted by PRRI. The survey was made possible through the generous support of Michelle Mercer and Bruce Golden. The survey was carried out among a random representative sample of 22,260 adults (age 18 and up) living in all 50 states in the United States. Among those, 20,642 are part of Ipsos’s KnowledgePanel and an additional 1,618 were recruited by Ipsos using opt-in survey panels to increase the sample sizes to a minimum of n=150 in smaller states. Interviews were conducted online between March 13 and December 2, 2024.
Respondents are recruited to the KnowledgePanel using an addressed-based sampling methodology from the Delivery Sequence File of the USPS – a database with full coverage of all delivery addresses in the U.S. As such, it covers all households regardless of their phone status, providing a representative online sample. Unlike opt-in panels, households are not permitted to “self-select” into the panel; and are generally limited to how many surveys they can take within a given time period.
The initial sample drawn from the KnowledgePanel was adjusted using pre-stratification weights so that it approximates the adult U.S. population defined by the 2023 March Supplement of the Current Population Survey (CPS), except language proficiency, which is not available from CPS, were obtained from the 2022 American Community Survey (ACS). Next, a probability proportional to size (PPS) sampling scheme was used to select a representative sample.
To reduce the effects of any non-response bias, a post-stratification adjustment was applied based on demographic distributions from the CPS, plus language proficiency from the ACS and party affiliation from Pew’s National Public Opinion Reference Survey (NPORS). The post-stratification weight rebalanced the sample based on the following benchmarks: gender, by age, by race/ethnicity, Census division, metro area by race/ethnicity, education by race/ethnicity, and income by race/ethnicity, language proficiency, party affiliation, and state population size. The sample weighting was accomplished using an iterative proportional fitting (IFP) process that simultaneously balances the distributions of all variables. Weights were trimmed to prevent individual interviews from having too much influence on the final results. In addition to an overall national weight, separate weights were computed for certain states (AZ, CO, FL, GA, MI, NC, NV, PA, TX, WI) to ensure that the demographic characteristics of the sample closely approximate the demographic characteristics of the target populations. The state-level post-stratification weights rebalanced the sample based on the following benchmarks: age, race and ethnicity, gender, education, and income, language proficiency (FL and TX only), and 2020 presidential vote choice.
These weights from the KnowledgePanel cases were then used as the benchmarks for the additional opt-in sample in a process called “calibration.” This calibration process is used to correct for inherent biases associated with nonprobability opt-in panels. The calibration methodology aims to realign respondents from nonprobability samples with respect to a multidimensional set of measures to improve their representation.
The margin of error for the national survey is +/- 0.84 percentage points at the 95% level of confidence, including the design effect for the survey of 1.6. In addition to sampling error, surveys may also be subject to error or bias due to question wording, context, and order effects. Additional details about the KnowledgePanel can be found on the Ipsos website: https://www.ipsos.com/en-us/solution/knowledgepanel
[1] States in the completely banned category include Alabama, Arkansas, Idaho, Indiana, Kentucky, Louisiana, Mississippi, Oklahoma, South Dakota, Tennessee, Texas, and West Virginia. (2) States in the very restrictive category include Florida, Georgia, Iowa, Nebraska, North Carolina, Ohio, South Carolina, and Utah. (3) States in the somewhat restrictive category include Arizona, California, Connecticut, Delaware, Hawaii, Illinois, Kansas, Maine, Massachusetts, Missouri, Montana, Nevada, New Hampshire, New York, North Dakota, Pennsylvania, Rhode Island, Virginia, Washington, Wisconsin, and Wyoming. (4) States in the least restrictive category include Alaska, Colorado, Maryland, Michigan, Minnesota, New Jersey, New Mexico, Oregon, Vermont, and the District of Columbia. For more information, see: https://states.guttmacher.org/policies/abortion-policies.
[2] For ease of interpretation, we recoded scores of 1 or higher (ranging from 1 to 4) as 1 to calculate the percentage of frequent religious practices at the state level. The answers across all four questions are highly correlated, with a Cronbach’s alpha of 0.89.
[3] These states are Alabama, Louisiana, South Dakota, Tennessee, Mississippi, Utah, Nebraska, Oklahoma, Texas, Georgia, South Carolina, Idaho, Kentucky, and North Dakota.
[4] Non-Christians include Muslims, Buddhists, Hindus, Unitarian Universalists, and other non-Christian religions.
[5] For more information, see: https://states.guttmacher.org/policies/abortion-policies.
Press Coverage
Republican opposition to abortion declines sharply, survey finds
04.01.2025
Read Online →
Majorities across most faith groups say abortion should be legal — except these four
 The Miami Herald
04.01.2025
Read Online →


