Partisanship Trumps Gender: Sexual Harassment, Woman Candidates, Access to Contraception, and Key Issues in 2018 Midterms
The Legality of Abortion and President Trump's Supreme Court Nominee
Will President Trump’s Supreme Court Nominee Vote to Overturn Roe v. Wade?
If confirmed, nearly half (48%) of Americans believe that President Trump’s Supreme Court nominee would vote to overturn Roe v. Wade, while one-quarter (25%) think the nominee would vote to uphold it. More than one-quarter (27%) express uncertainty or offer no opinion about what the nominee might do.
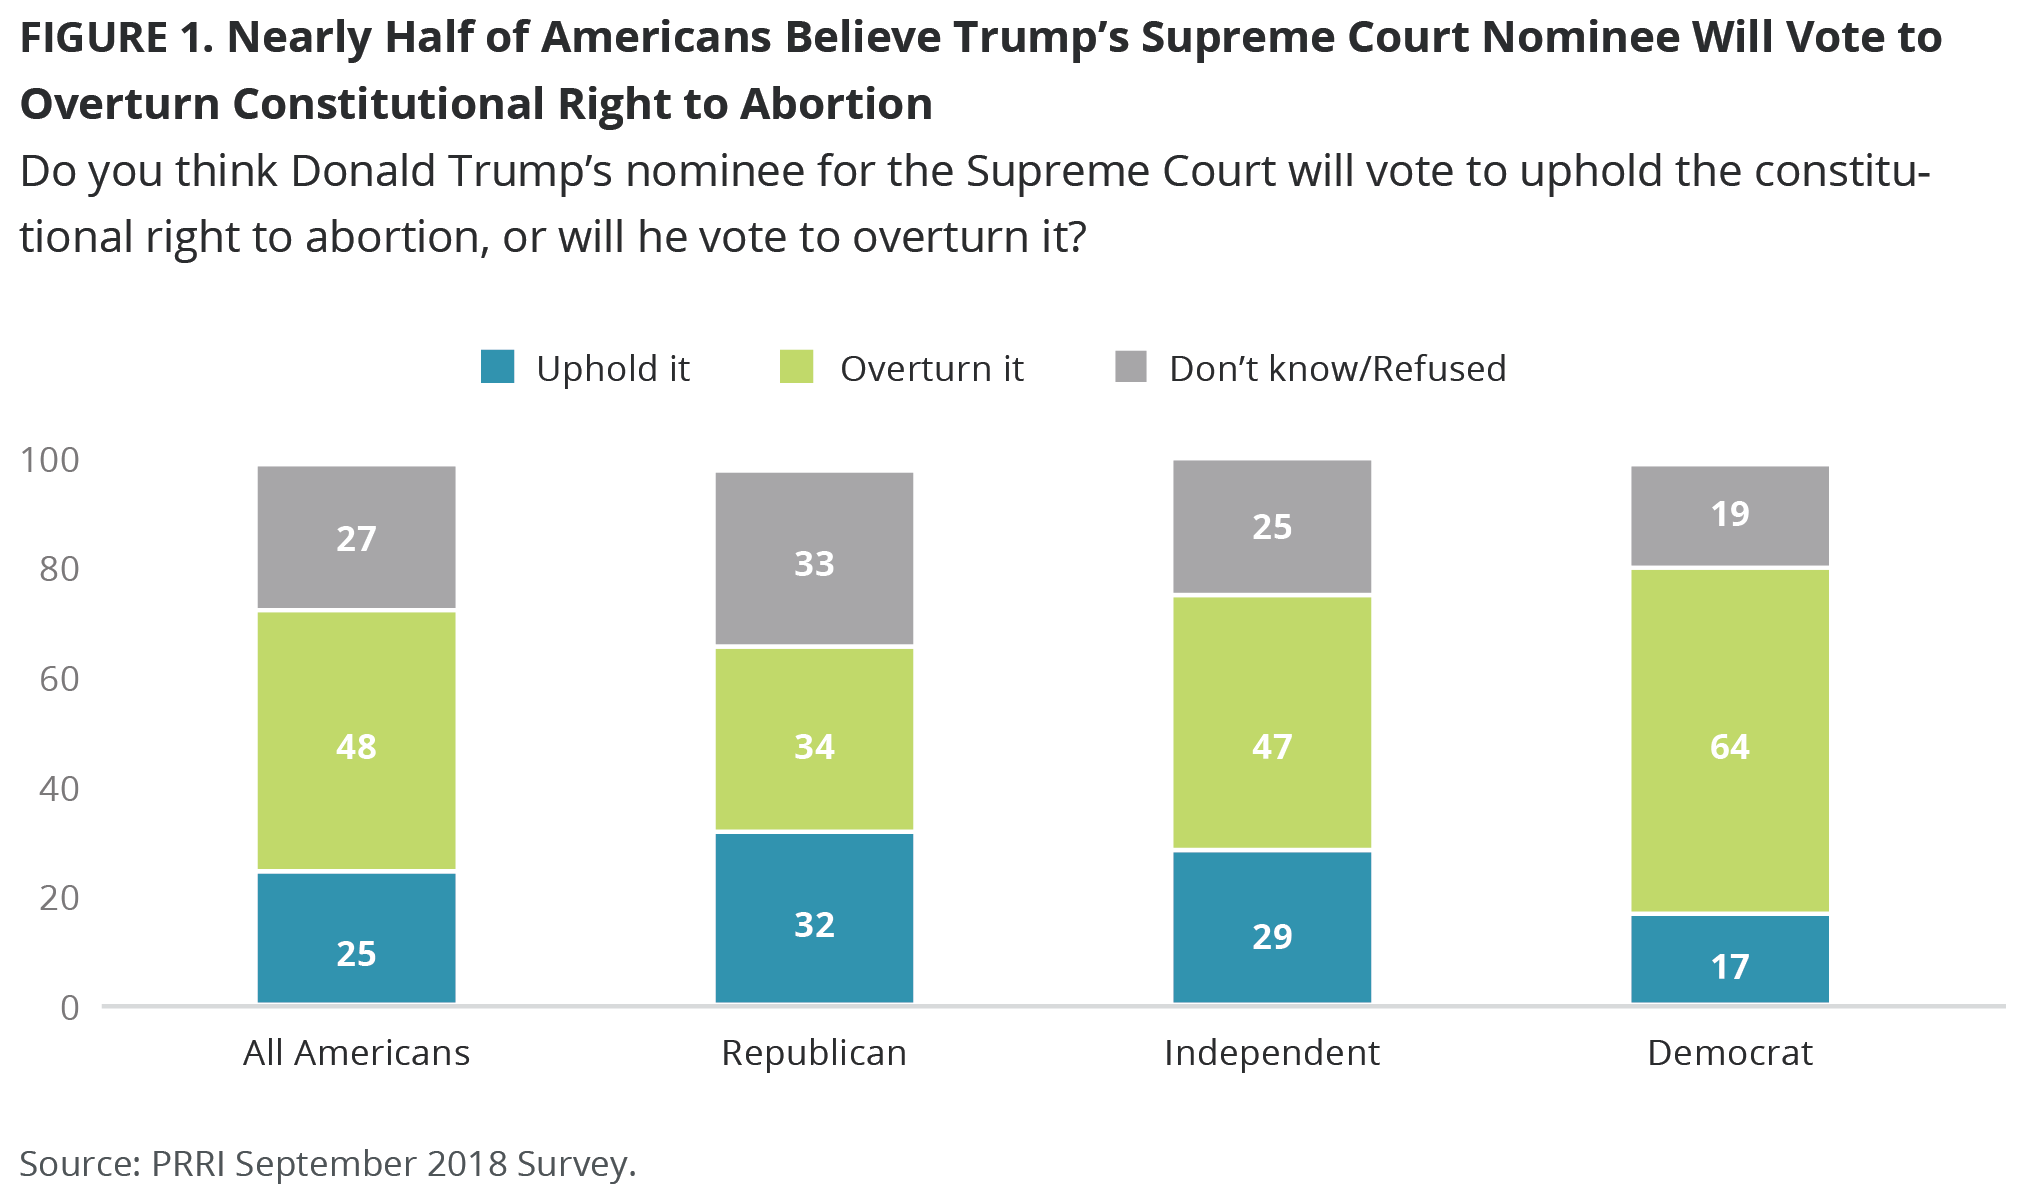
Democrats are significantly more likely than Republicans to believe that President Trump’s Supreme Court nominee would vote to overturn Roe v. Wade. Nearly two-thirds (64%) of Democrats say Trump’s nominee would vote to overturn the decision, compared to 34% of Republicans. Roughly equal numbers of Republicans believe the nominee would vote to uphold the ruling (32%) or report being uncertain (33%).
Should Roe v. Wade be Upheld or Overturned?
A majority (56%) of Americans say that Roe v. Wade — the 1973 ruling that affirmed a constitutional right to abortion — was decided correctly by the Supreme Court and should be upheld, compared to just one-third (33%) who say it was the wrong decision and should be overturned. Eleven percent say they do not know or refused to answer the question.
There are stark partisan divides on this question. Almost three-quarters (73%) of Democrats say that Roe v. Wade was decided correctly by the Supreme Court and should be upheld, compared to about one in five (21%) who say it was decided incorrectly and should be overturned. By contrast, about one-third (34%) of Republicans believe the Roe v. Wade ruling was correct, while a majority (52%) believe it was the wrong decision and ought to be overturned. Notably, Republicans are more than twice as likely as Democrats to offer no opinion (14% vs. 6%).
Among Americans overall, women and men are about equally as likely to believe Roe v. Wade was rightly decided. A majority of women (58%) and men (55%) affirm the 1973 decision and believe it should be upheld.
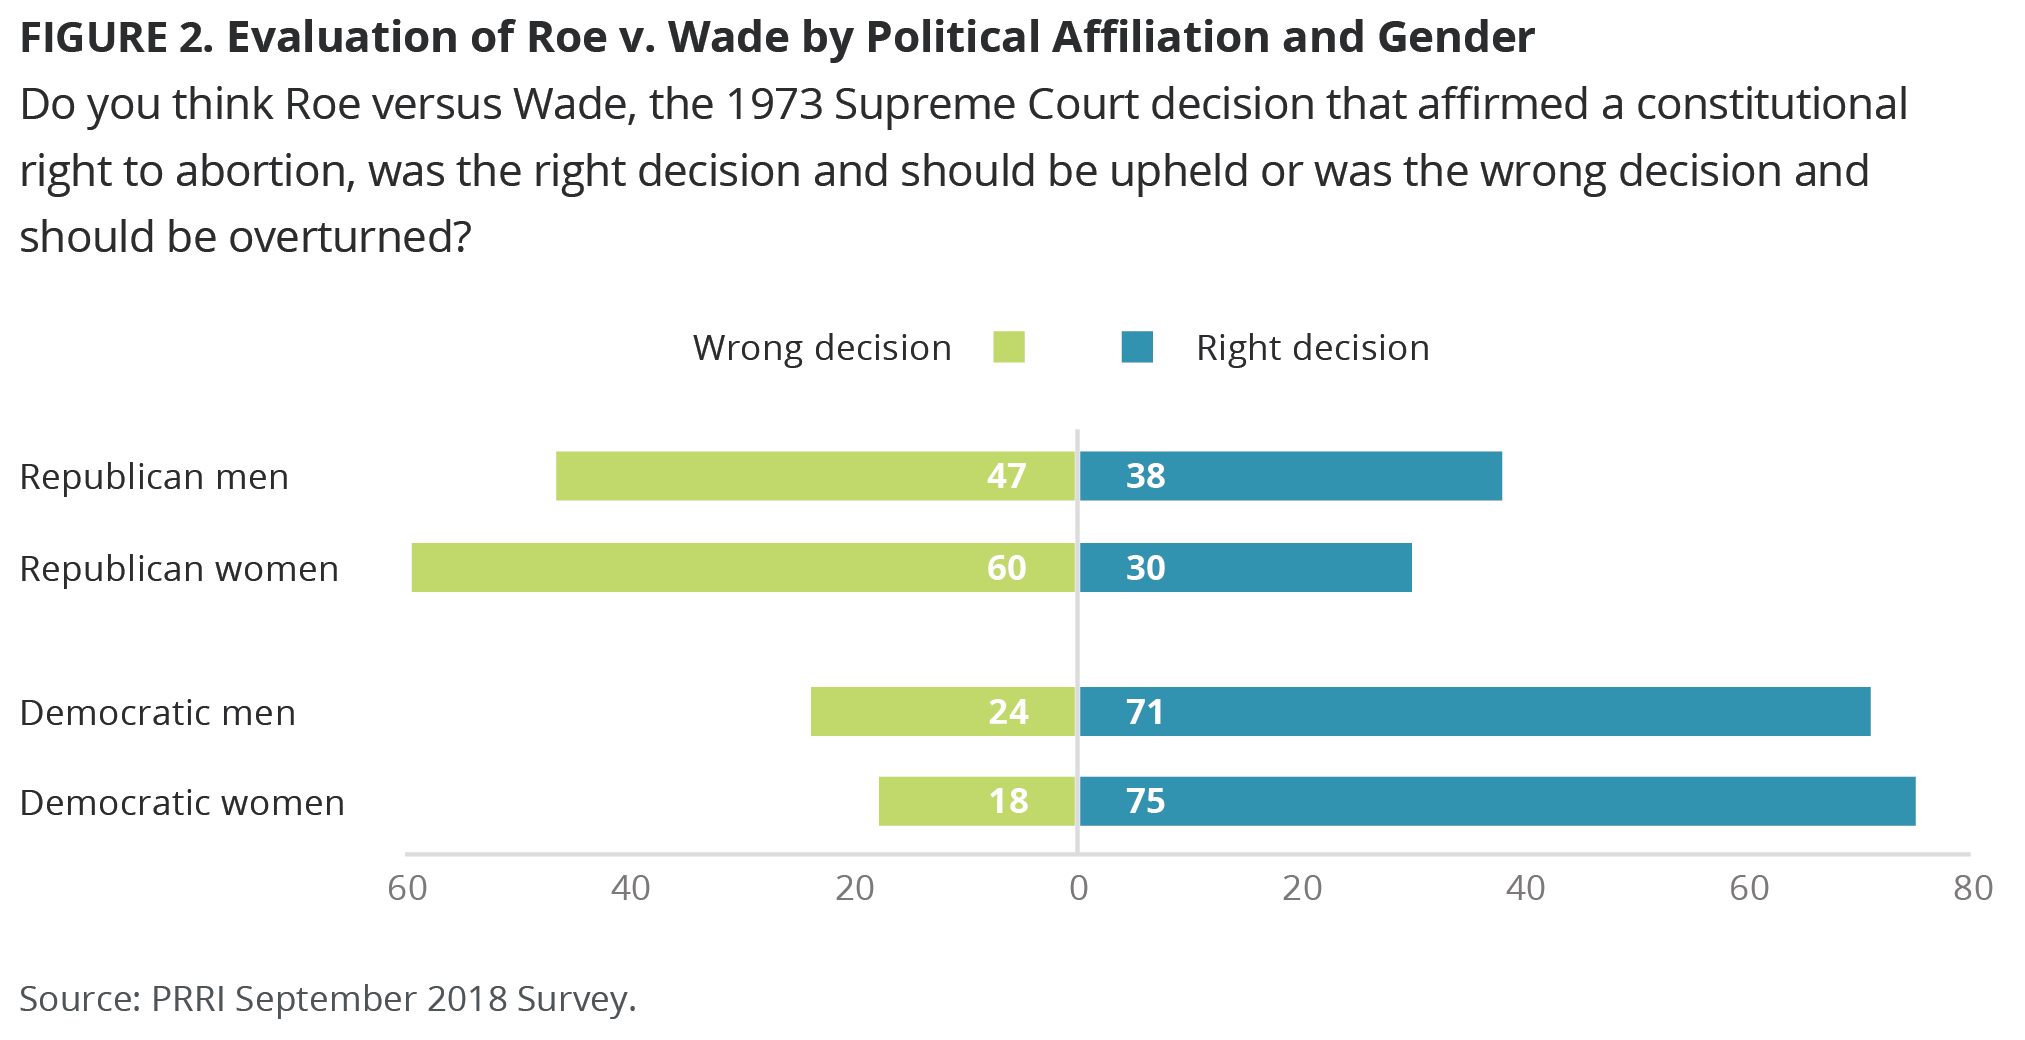
Notably, Republican women are significantly more likely than Republican men to say that Roe v. Wade was incorrectly decided and that it should be overturned (60% vs. 47%). By contrast, roughly equal numbers of Democratic women (75%) and men (71%) say Roe v. Wade was decided correctly.
The partisan gap among women is nearly twice as large as the partisan gap among men. Only 18% of Democratic women, compared to six in ten (60%) Republican women, believe Roe v. Wade was incorrectly decided and should be overturned—a 42-percentage point gap. Among men, only 24% of Democrats, compared to less than half (47%) of Republicans, believe Roe v. Wade was decided incorrectly. Notably, 16% of Republican men say they do not know or refused to answer the question.
White evangelical Protestants are the only major religious group among which a majority believe that Roe v. Wade was decided incorrectly. A majority (56%) of white evangelical Protestants say that it was the wrong decision and should be overturned. By contrast, a majority of religiously unaffiliated Americans (75%), white mainline Protestants (67%), and black Protestants (58%), say it was the right decision. Catholics overall are more divided, with 48% affirming the decision and 40% expressing disapproval of it. However, there is a sharp divide among Catholics. A majority (54%) of white Catholics believe Roe v. Wade was correctly decided. Hispanic Catholics are more divided: only 42% believe Roe v. Wade was the right decision, compared to 47% who say it was the wrong decision and should be overturned.
Uncertainty about the Impact if Roe v. Wade Were Overturned
Americans express a good deal of uncertainty about what would happen to abortion access in their state if Roe v. Wade were overturned. Six in ten (60%) Americans say they are not sure if abortion would be illegal or legal in their state if the Supreme Court overturns Roe v. Wade. Roughly equal numbers of Americans believe abortion would become illegal in their state (19%) or that it would remain legal (17%).
If Roe v. Wade were to be overturned, 16 states have laws that could be used to restrict legal access to abortion services, while nine states have laws that would protect at least some legal access to abortion services.[1] Among Americans residing in states with laws on the books preserving abortion access, only about one-quarter (26%) say abortion would remain legal in their state if Roe v. Wade were overturned, 15% say abortion would become illegal, and 58% say they do not know. Among Americans residing in states with laws designed to restrict abortion access, only 11% say abortion would remain legal in their state if Roe v. Wade were overturned, 23% say abortion would become illegal, and nearly two-thirds (64%) say they do not know.
Legality of Abortion
A majority (59%) of Americans believe that abortion should be legal in all or most cases. Almost four in ten (37%) believe it should be illegal in all or most cases. American attitudes on the legality of abortion have remained largely stable over time.
There are sharp partisan divisions over the legality of abortion. Nearly three-quarters (73%) of Democrats believe abortion should be legal in all or most cases, compared to less than one-quarter (23%) who believe it should be illegal. Conversely, a majority (57%) of Republicans believe it should be illegal in all or most cases, while 40% say it should be legal. Opinions among political independents largely mirror that of the American public as a whole.
Concerns about Health Care Issues: Abortion, Contraception, Costs, and Coverage
Americans prioritize different aspects of healthcare more than others. A majority of Americans say that the rising costs of health care (58%) and protecting health care coverage for pre-existing conditions (53%) is a critical issue for them personally. By contrast, fewer say the same about abortion (41%) and access to contraception (28%).
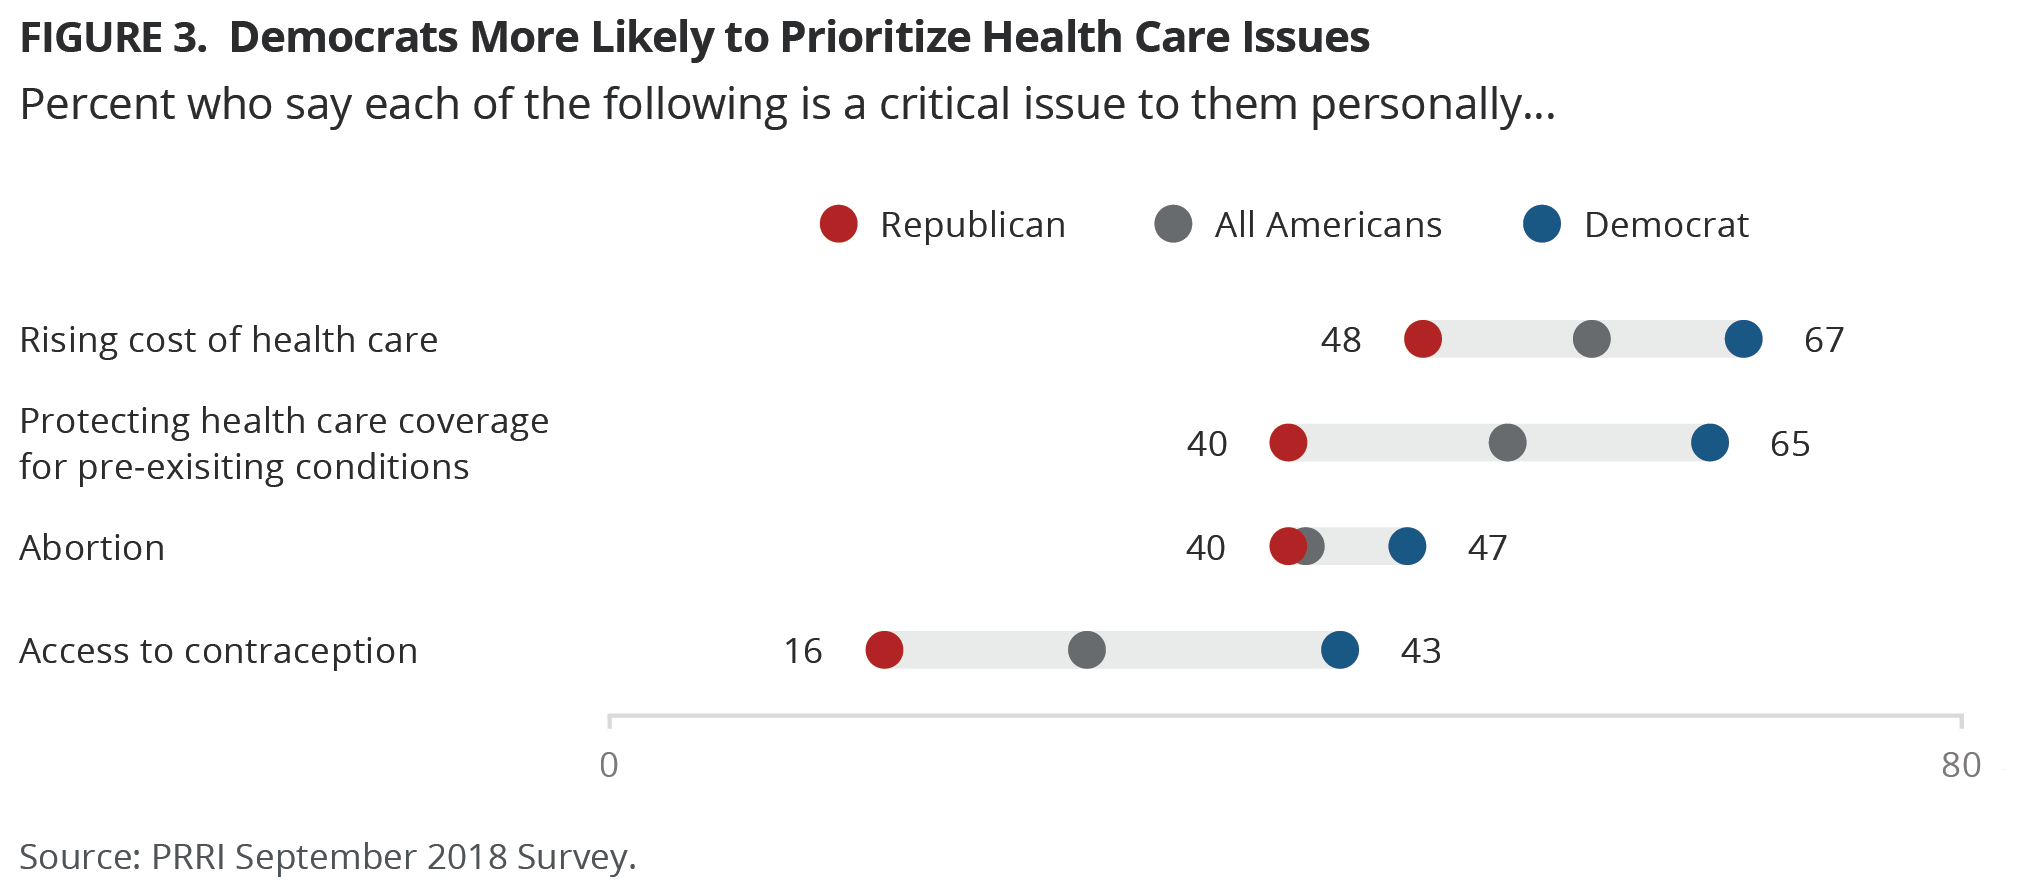
Democrats are much more likely to prioritize these healthcare issues. Democrats are more likely than Republicans to say that the rising costs of health care (67% vs. 48%), protecting health care coverage for pre-existing conditions (65% vs. 40%), abortion (47% vs. 40%), and access to contraception (43% vs. 16%) are critical issues to them personally.
Abortion
More than four in ten (41%) Americans report that abortion is a critically important issue to them, up seven points from 2015 (34% critically important).[2] One-third (33%) say that is one among many important issues to them. About one-quarter (23%) say that abortion is not that important to them.
Women are somewhat more likely than men say the issue of abortion is personally important. More than four in ten (43%) women say abortion is a critical issue, while more than one-third (35%) say it is an important issue among many. Thirty-nine percent of men say abortion is critically important, while 30% say it is one among many important issues. Nearly three in ten (28%) men say that abortion is not that important an issue to them, compared to 19% of women.
Democrats are somewhat more likely than Republicans to prioritize the issue of abortion. Nearly half (47%) of Democrats say that abortion is a critical issue to them, compared to four in ten (40%) Republicans. The reverse was true a few years earlier. In 2015, 43% of Republicans compared to 36% of Democrats said that abortion was a critical concern.
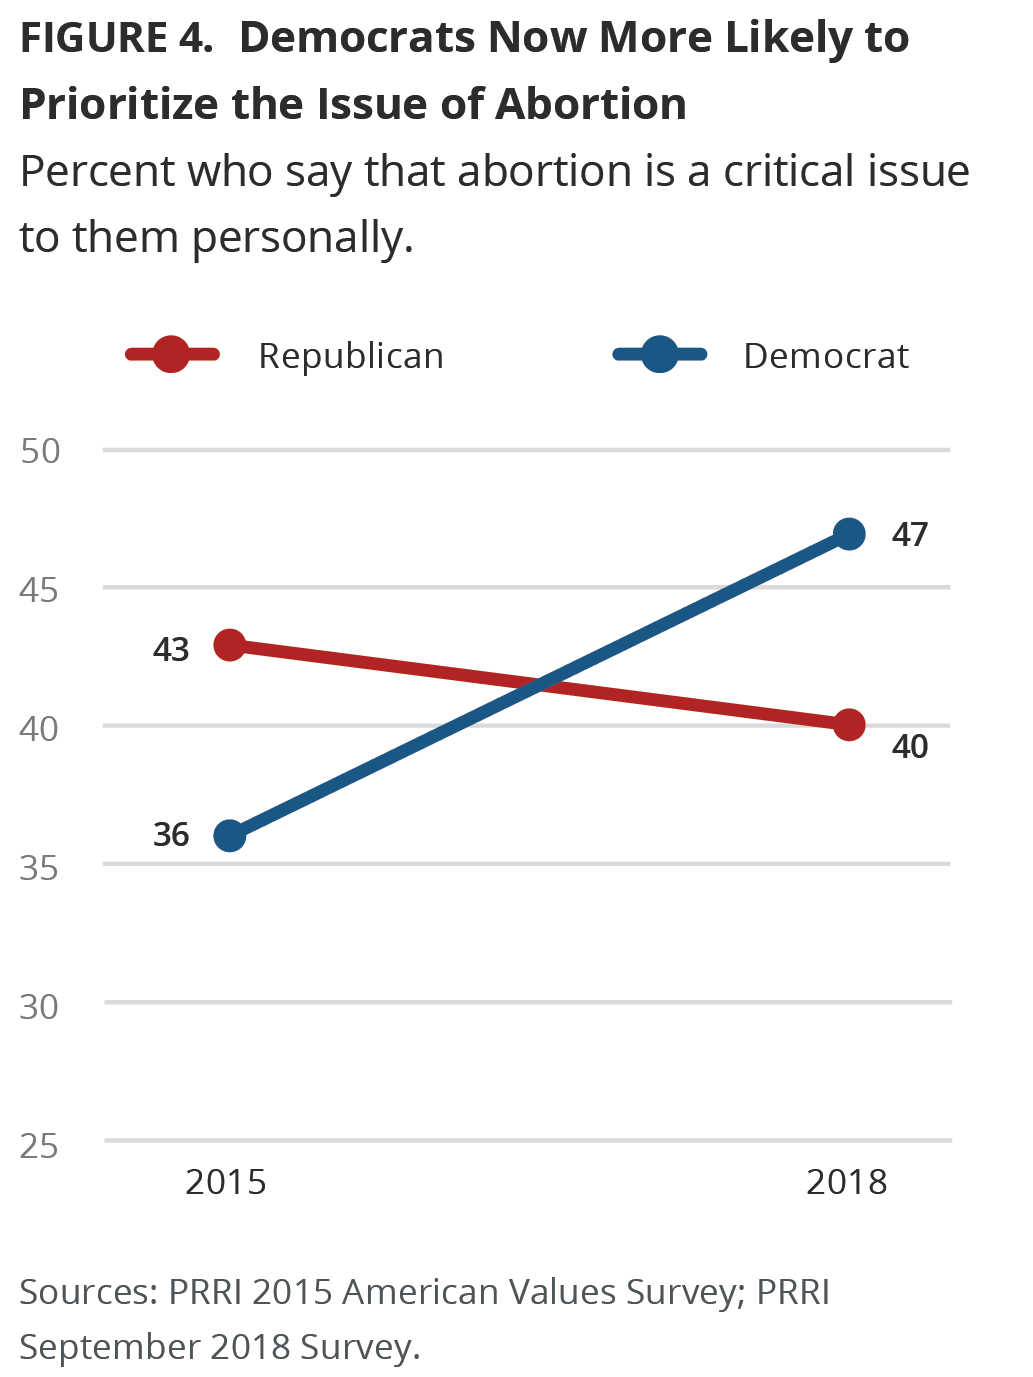
Partisan differences on this issue also vary by age. Younger Democrats (age 18 to 49) are far more likely than younger Republicans to say abortion is a critical issue them (53% vs. 35%). Conversely, older Republicans (age 50 or older) are more likely than older Democrats to prioritize the issue (45% vs. 40%).
The issue of abortion matters somewhat more to nonwhite Americans. Close to half of black (47%) and Hispanic (45%) Americans say it is a critical issue, compared to 39% of white Americans.
The importance of abortion as an issue differs starkly by religious tradition. Half (50%) of white evangelical Protestants — a majority of whom believe abortion should be illegal — and an equal proportion of black Protestants — a majority of whom believe abortion should be legal—report that abortion is a critical concern.[3] About four in ten Catholics (40%) and the religiously unaffiliated (37%), and fewer than one-third of mainline Protestants (32%) say the same. However, Hispanic Catholics (45%) are more likely than white Catholics (37%) to say this is a critical issue to them personally.
The importance of this issue also varies by opinions about the legality of abortion. Over half (52%) of those that say abortion should be illegal in all or most cases say it is a critical issue, compared to only 35% of those who say abortion should be legal in all most cases. This gap is even wider among those who say abortion should be illegal in all cases or legal in all cases. Nearly two-thirds (64%) of those who say abortion should be illegal in all cases view abortion as a critical issue, compared to only around four in ten (41%) of those who say abortion should be legal in all cases.
Access to Contraception
Compared to the issue of abortion, fewer Americans say access to contraception is a critical concern. Fewer than three in ten (28%) say it is a critical issue, and one-third (33%) say it is one among many important issues. More than one-third (36%) say it is not that important of an issue to them personally.
Women are more likely than men to view access to contraception as an important issue. Nearly one-third (32%) of women say access to contraception is a critical issue to them personally, compared to only 23% of men. However, there is a slightly larger gender gap among young people than older Americans. Thirty-six percent of young women (age 18 to 34) say contraception access is critical compared to only 22% of young men. Fewer than three in ten senior women (29%) and senior men (21%) report that this is a critical issue.
There are also significant divides between partisans on this issue. More than four in ten (43%) Democrats, compared to only 16% of Republicans, consider access to contraception to be critical issue to them personally. Over half (52%) of Republicans say this is not that important an issue, compared to only one in five (20%) Democrats.
Similar numbers of black (30%), white (27%), and Hispanic (27%) Americans say it is a critical issue to them.
The priority of this issue also varies across religious traditions. Unaffiliated Americans are the most likely to prioritize access to contraception, with nearly four in ten (39%) saying it is a critical issue to them personally. Comparatively, only 34% of black Protestants, 26% of Catholics, and 17% of white evangelical Protestants say the same.
Rising Health Care Costs
Nearly six in ten (58%) Americans say the rising cost of health care is a critical issue, and about three in ten (28%) say it is one among many important issues. Only 13% of the public say it is not that important to them.
Democrats are far more likely than Republicans to say health care costs are a critical issue to them (67% vs. 48%).
Views of the importance of health care costs also vary by race and ethnicity. Black (60%) and white (59%) Americans are more likely than Hispanic (50%) Americans to personally view health care as a critical issue.
Concerns about rising health care costs also vary by age. Seniors are more likely than young Americans (age 18-29) to say this is a critical issue to them personally (59% vs. 47%).
Insurance Coverage for Pre-existing Conditions
More than half (53%) of the public say protecting health care coverage for pre-existing conditions is something that is critically important to them. Approximately one-third (35%) say it is one among many important issues, while only one in ten (10%) say this is not that important an issue.
Women express significantly greater concerns about pre-existing conditions than men. Nearly six in ten (57%) women say it is a critical issue, compared to fewer than half (48%) of men.
Strong party divides exist for this issue. Nearly two-thirds (65%) of Democrats say that protecting health care coverage for pre-existing conditions is a critical issue, compared to only four in ten (40%) Republicans.
Hispanic Americans stand out to the extent that they are less concerned about the issue of pre-existing conditions in health care coverage. A majority of white (56%) and black Americans (54%) view this as a critical issue, while only four in ten (40%) Hispanics agree.
Attitudes about Reproductive Health Care
Contraception and Financial Security
Americans widely agree that access to contraception is critical for the financial security of women (70% agree vs. 24% disagree).
More than three-quarters (76%) of women, compared to 64% of men, agree that access to contraceptives are critical to the financial security of women.
There are stark partisan divides on the question of the role of contraception in women’s financial security. There is near consensus among Democrats that access to contraception is critical for the financial security of women, with almost nine in ten (86%) expressing this view. Republicans are divided on whether contraception is essential for women’s financial security (50% agree vs. 43% disagree). However, there is a considerable split among Republicans by gender. Six in ten (60%) Republican women agree that contraception is critical for women’s financial security, compared to just 43% of Republican men.
There is widespread agreement across racial and ethnic groups that contraception is necessary for women’s financial security. Roughly three-quarters of black (76%) and Hispanic (74%) Americans agree with this statement, as do nearly seven in ten (68%) white Americans.
Requiring Employer Health Care Plans to Cover Cost of Birth Control
Americans broadly believe employers ought to provide their employees with health care plans that cover contraception or birth control at no cost, whether they are publicly held corporations (66%), privately owned corporations (61%), religiously-affiliated hospitals (59%), religiously affiliated colleges and universities (54%), or privately owned small businesses (53%). Views have not changed significantly on this issue since 2014. [4]
Americans are more divided over whether churches and places of worship should be required to offer health care insurance that covers contraception. Less than half (45%) of the public believes that churches and other places of worship should have to provide these types of insurances plans to their employees at no cost, while half (50%) disagree. In 2014, only 42% supported this requirement for churches and other places of worship, while a majority (53%) opposed it.
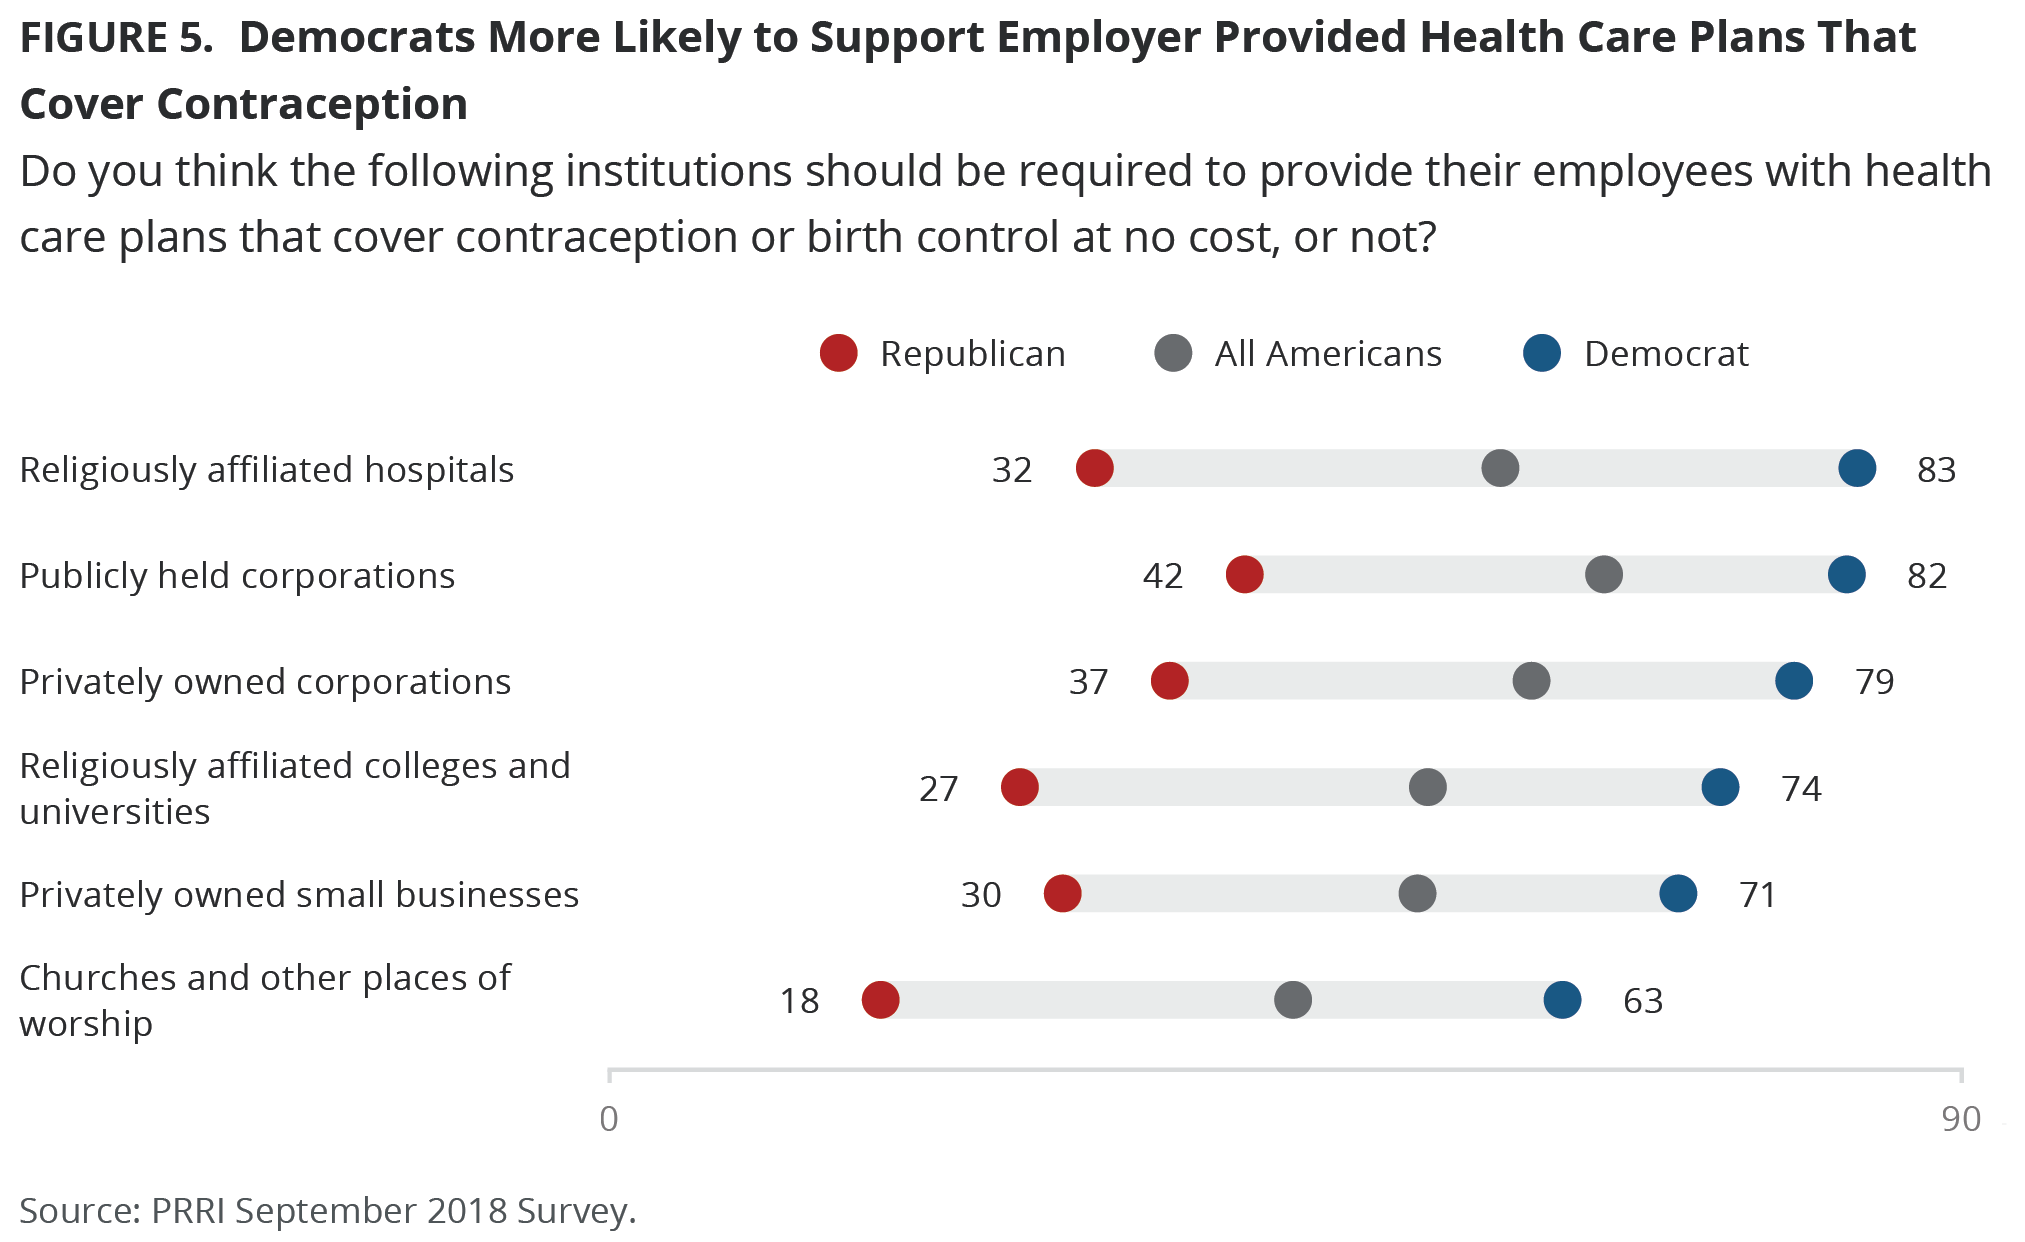
Republicans and Democrats are deeply divided on this issue. Democrats are almost twice as likely as Republicans to say that publicly held corporations should be required to provide employees with contraception coverage through their health insurance plans (82% vs. 42%). Democrats are also far more likely than Republicans to say the privately owned corporations (79% vs. 37%), religiously affiliated hospitals (83% vs. 32%), religiously affiliated colleges (74% vs. 27%) and privately owned small businesses (71% vs. 30%), should have this requirement. Finally, more than six in ten (63%) Democrats, compared to only 18% of Republicans, say churches and other places of worship should have to provide contraception coverage to their employees.
Women consistently express higher support than men for contraception coverage requirements across all different employer types. Women are more likely than men to say that publicly held corporations (70% vs. 60%), privately owned corporations (68% vs. 55%), religiously affiliated hospitals (65% vs. 53%), religiously affiliated colleges and universities (59% vs. 49%), privately owned small businesses (57% vs. 48%), and churches and other places of worship (49% vs. 40%) should be required to offer health insurance plans that provide contraception coverage at no cost.
Most religious groups believe non-religious employers should provide contraception coverage in employee insurance plans. For example, a majority of religiously unaffiliated Americans (72%), Catholics (63%), and white mainline Protestants (60%) say privately-owned corporations should provide their employees with health care coverage that includes contraception. Even a sizable minority of white evangelical Protestants (42%) agree with this requirement for privately-owned corporations.
By contrast, fewer than half of Catholics (48%), white mainline Protestants (37%), and white evangelical Protestants (34%) say churches and places of worship ought to be required to provide contraception coverage to their employees. Even among the religiously unaffiliated, only slightly more than half (52%) believe churches should have to make these types of health care policies available to their employees.
Religiously Based Service Refusals by Pharmacists
Two-thirds (67%) of Americans do not favor a policy that allows pharmacists with religious objections to refuse to provide contraceptives to women who have a valid prescription. Only about one-quarter (26%) of Americans favor such a policy.
More than seven in ten (71%) women and nearly two-thirds (64%) of men believe pharmacists should not be allowed to refuse filling valid prescriptions for contraceptives because of their religious beliefs.
Despite a significant gap between Republicans and Democrats, majorities of both parties say that pharmacists should not be allowed to refuse to provide contraceptives. More than three-quarters (76%) of Democrats and a majority (56%) of Republicans oppose such a policy. Independents closely mirror the public overall.
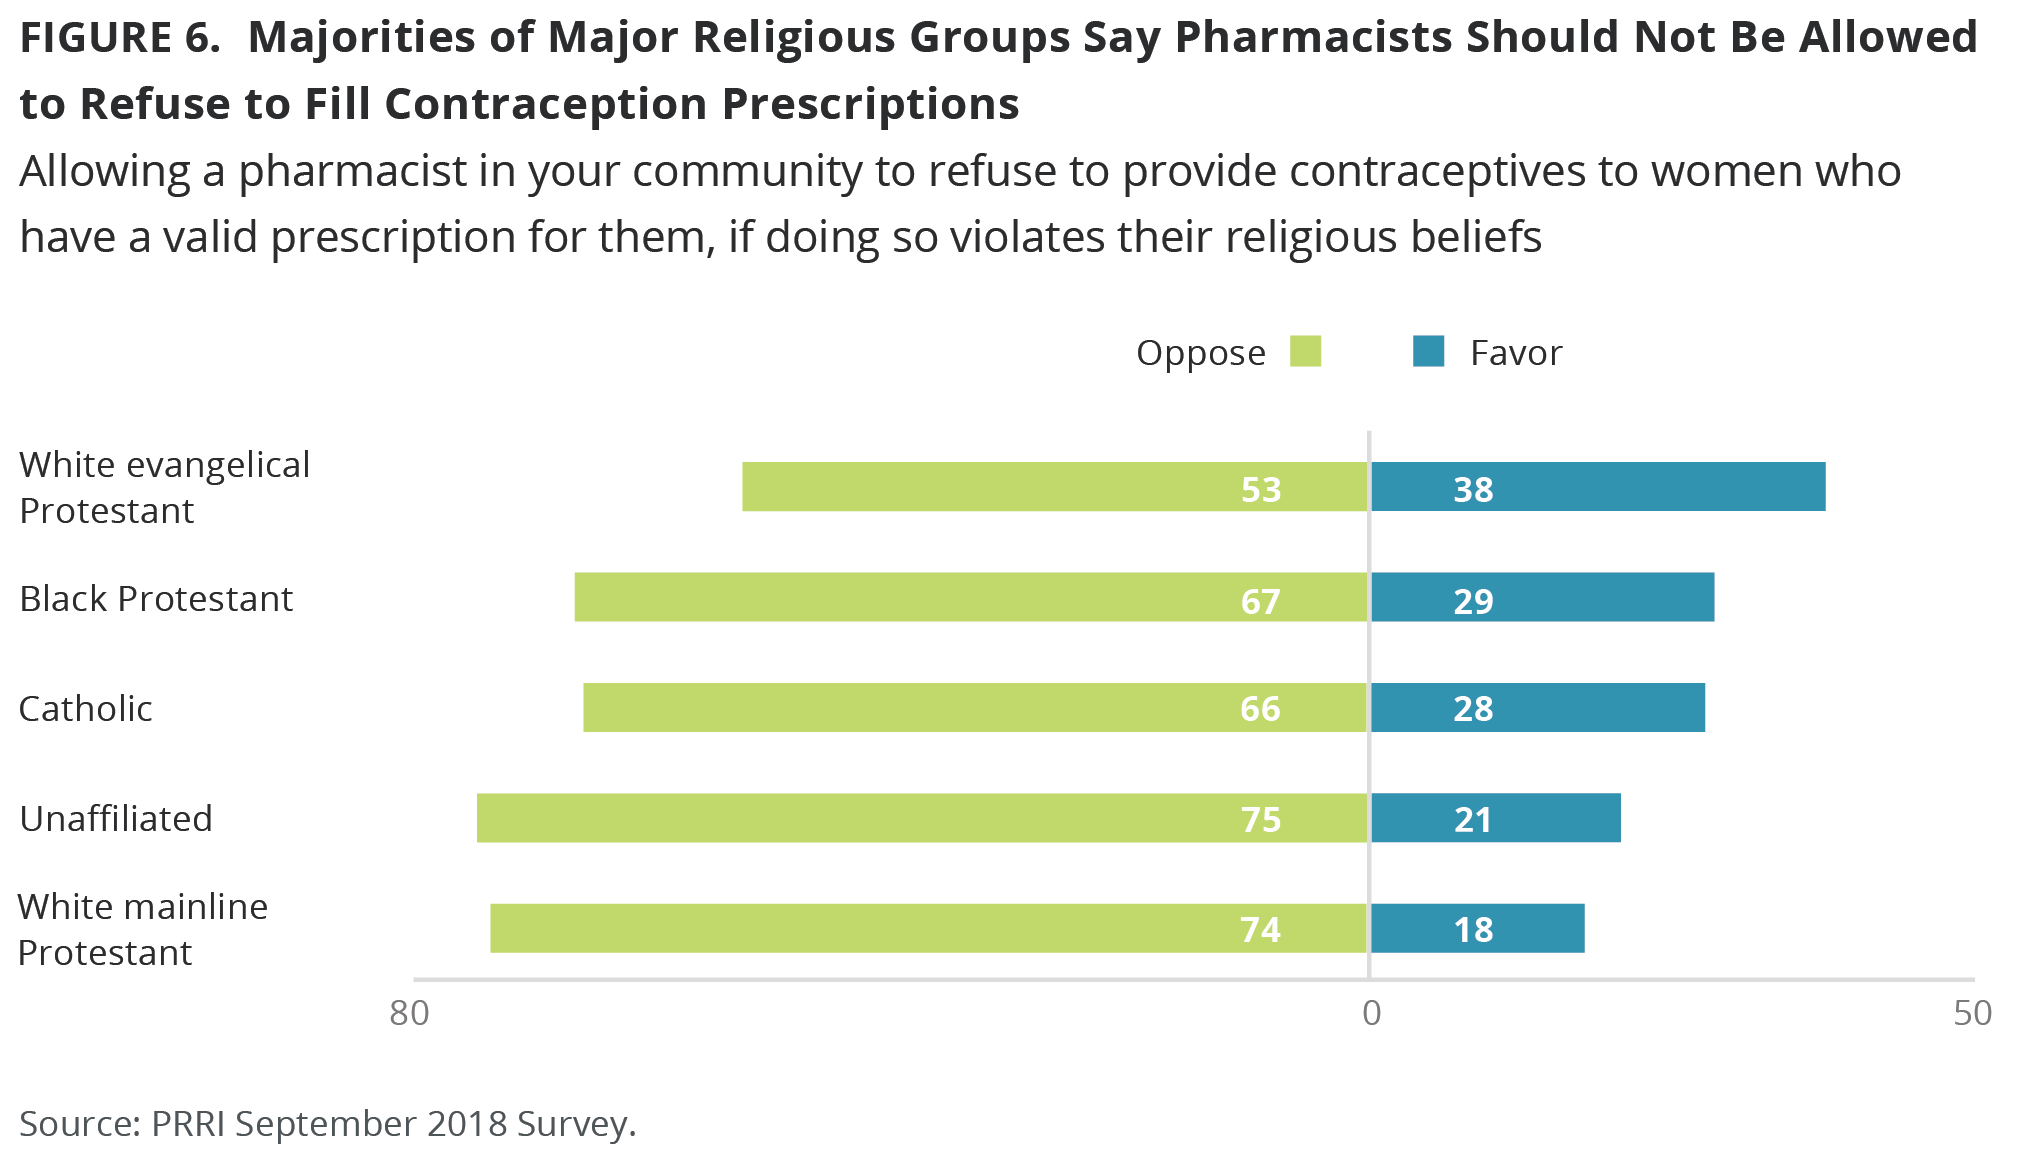
Majorities of every religious group, including white evangelical Protestants, say pharmacists should not be allowed to refuse to provide contraceptives. A majority of religiously unaffiliated (75%), white mainline Protestants (74%), black Protestants (67%), Catholics (66%) and white evangelical Protestants (53%) oppose a policy that would allow pharmacists to refuse to fill contraceptive prescriptions on religious grounds.
Abortion Services and Federal Funding
Should Health Care Professionals Who Receive Federal Funding be Prevented from Discussing Abortion with their Patients?
Americans are generally opposed to policies or laws that would prevent health care providers who receive federal funding from discussing abortion with their patients. Six in ten (60%) Americans oppose such a policy, while roughly one-third (31%) support it. Nine percent of Americans report no opinion.
There are only modest differences across the partisan divide. Roughly six in ten Democrats (62%) and Republicans (59%) oppose a policy or law that would prevent health care providers who receive federal funding from discussing abortion with their patients. The views of independents closely track the public overall.
Opposition to policies and laws that would prevent health care providers from discussing abortion with their patients is also fairly consistent across major religious groups. A majority of Hispanic Catholics (56%), white mainline Protestants (59%), white evangelical Protestants (60%), black Protestants (63%), white Catholics (64%), and the religiously unaffiliated (65%) oppose a policy that would prevent health care providers who receive federal funding from discussing abortion with their patients.
Preventing Federal Funds from Going to Organizations That Provide Abortion Services
A majority of Americans also reject a policy that prevents federal funds from going to reproductive health care organizations who provide abortions, even though those funds cannot be used for abortions. A slim majority (53%) of Americans oppose such a rule, while four in ten (40%) are in favor.
Democrats strongly reject such a rule, while Republicans are more divided. Six in ten (60%) Democrats are opposed to a policy in which federal funds are prohibited from going to reproductive health organizations that provide abortions. By contrast, a slim majority (51%) of Republicans are in favor of such a policy, even though those funds cannot pay for the abortions themselves. More than four in ten (43%) Republicans are opposed to such a rule.
Black Americans are notably less likely to support a policy where federal funding is blocked from going to organizations that provide abortion services, even though the funds cannot be used for the abortion procedures. Only three in ten (30%) black Americans would support such a rule, while nearly six in ten (59%) are opposed. White and Hispanic Americans roughly mirror the population as a whole on this issue.
No major religious group shows majority support for a policy where federal funds are restricted from going to reproductive health organizations who provide abortions, despite the federal funds not being used for abortions. White evangelical Protestants are evenly divided on this issue (46% favor vs. 46% oppose). White mainline Protestants are similarly divided (44% favor vs. 49% oppose). Other religious groups are more decisively opposed to restricting federal funds from going to reproductive health organizations that provide abortions — though the funds are not used for abortions — including white Catholics (55%), Hispanic Catholics (57%), religiously unaffiliated Americans (59%), and black Protestants (63%).
The Gender Pay Gap and Sexual Harassment in the Workplace
Concerns about the Gender Pay Gap
Three in ten (30%) say that the pay gap between men and women is a critical issue to them personally, while about one-third (35%) say it is one among many important issues. Another one-third (31%) say it is not that important an issue.
Nearly four in ten (39%) women, compared to only 22% of men, say that the pay gap between men and women is a critical issue. Notably, almost four in ten (39%) men say that the pay gap is not that important an issue.
Black Americans are much more likely than white or Hispanic Americans to say the gender pay gap is a critical issue. More than four in ten (42%) black Americans see the pay gap between men and women as a critical issue, compared to fewer than three in ten white (29%) and Hispanic (26%) Americans.
Partisans prioritize the gender pay gap differently. Close to half (45%) of Democrats say that the gender pay gap is critically important to them personally, and a similar number (38%) say that it is one among many important issues. Only 15% of Democrats say that the gender pay gap is not that important an issue. By contrast, only 14% of Republicans say the pay gap is a critical issue while 30% it is one among many important concerns. A majority (52%) of Republicans say that the gender pay gap is not important.
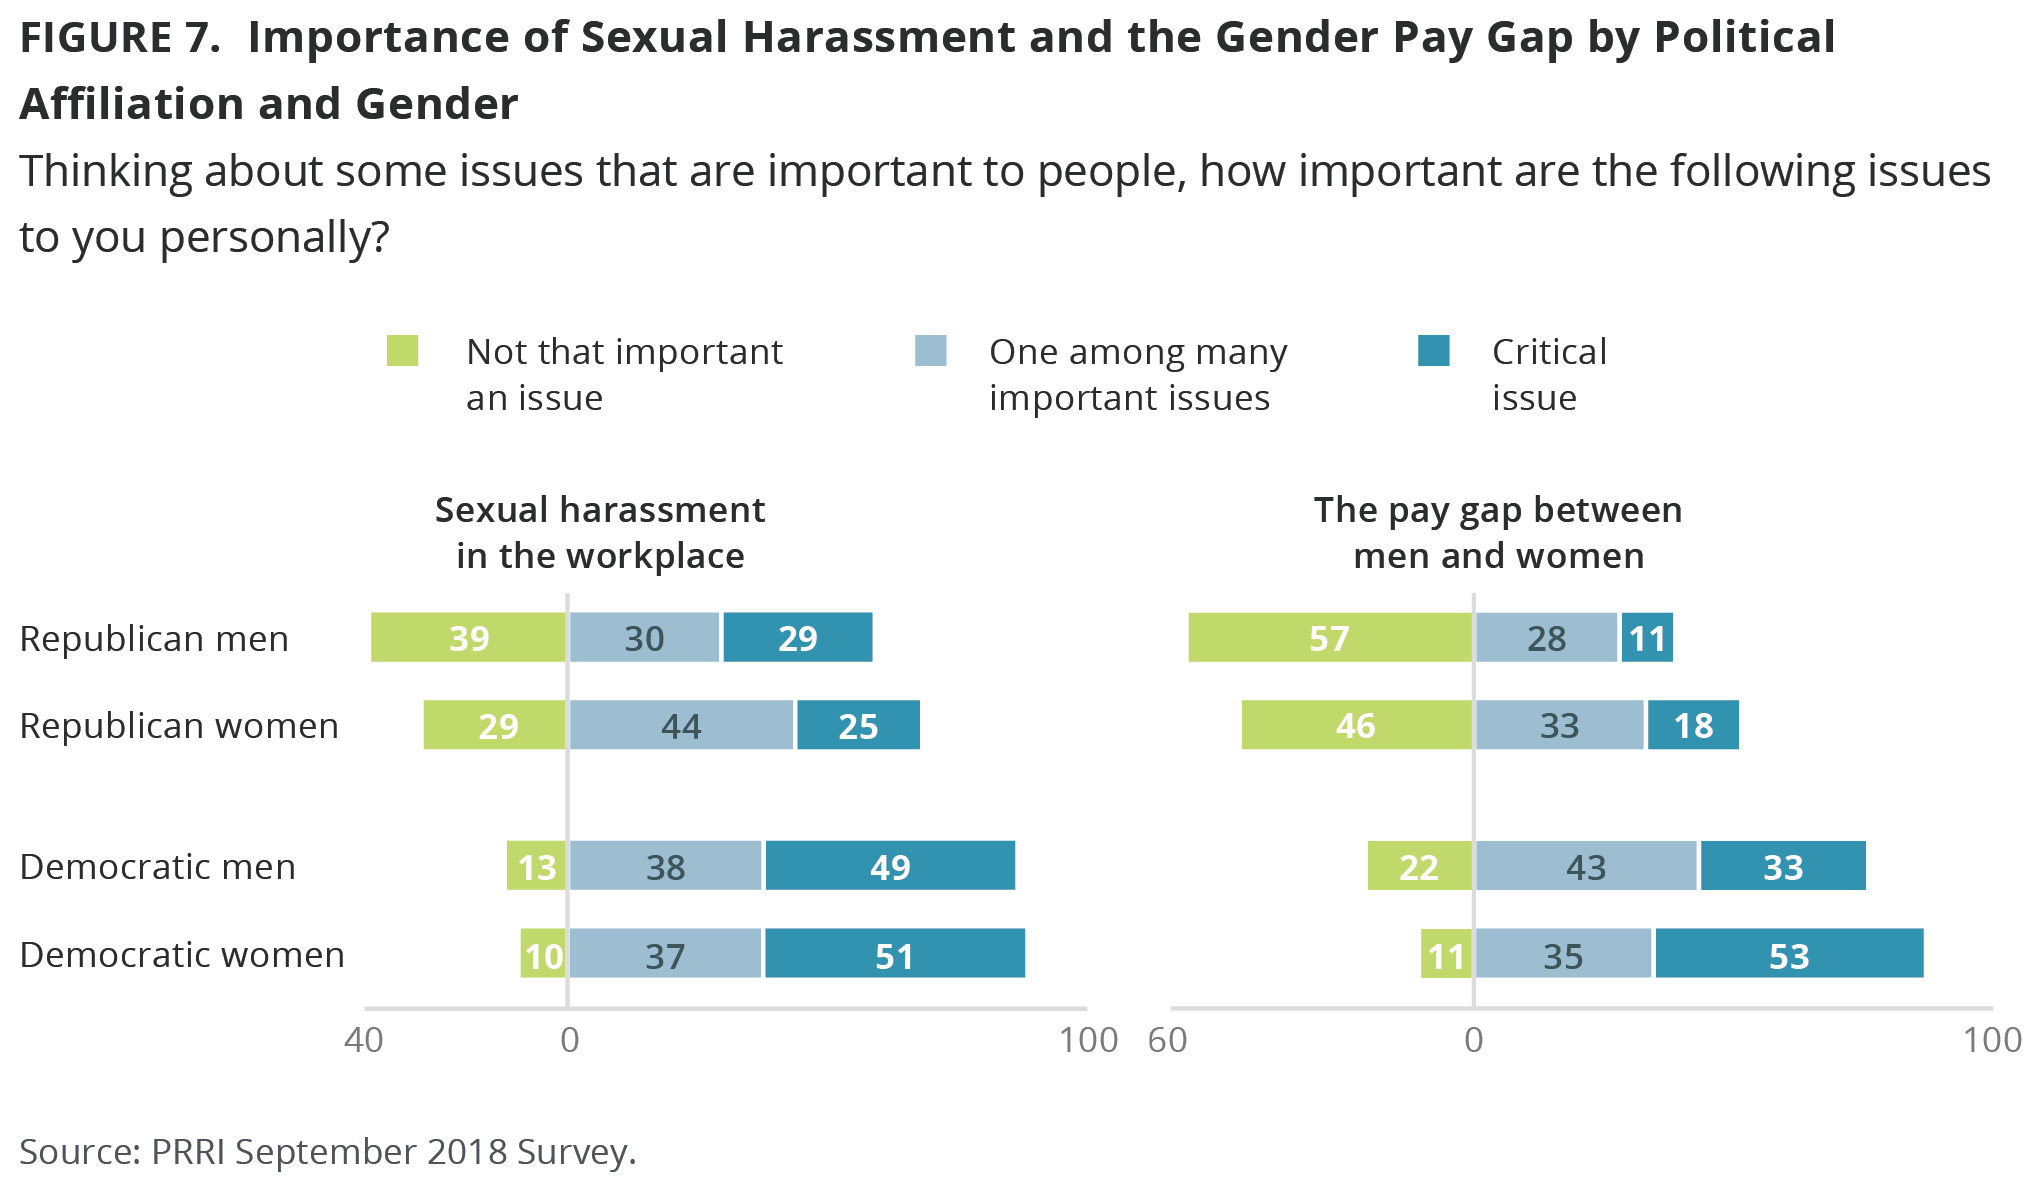
There is a substantial and uneven gender divide among partisans. Democratic women are significantly more likely than Democratic men to say that the gender pay gap is a critical issue to them personally (53% vs. 33%). The gender gap is more modest among Republicans, although Republican women are still more likely than Republican men to say it is a critical issue (18% vs. 11%). A majority (57%) of Republican men and nearly half (46%) of Republican women say the pay disparity between men and women is not that important to them.
Concerns about Sexual Harassment in the Workplace
About four in ten (39%) Americans say that sexual harassment in the workplace is a critical issue to them personally, while roughly as many (37%) say that it is one among many important issues. About one in five (22%) say that it is not that important an issue.
About four in ten women (41%) and men (37%) say that sexual harassment in the workplace is a critical issue to them personally.
However, there is substantial age divide among both women and men. Nearly half (48%) of young women (age 18 to 34), compared to only 39% of women age 65 or over, say sexual harassment is a critical issue to them. Similarly, four in ten (40%) young men (age 18 to 34), compared to 30% of senior men, say it is a critical issue. Notably, more than one-third (34%) of senior men say sexual harassment is not an important issue.
Democrats are much more likely than Republicans to see sexual harassment in the workplace as a critical issue. Half (50%) of Democrats say sexual harassment in the workplace is a critical issue to them personally, compared to 27% of Republicans. More than one-third (34%) of Republicans say it is not that important an issue.
There is a notable gender divide among Republicans on this issue. While Republican women and men are about as likely to say sexual harassment in the workplace is a critical issue (25% vs. 29%), Republican women are more likely than Republican men to say that it is one among many important issues (44% vs. 30%). Republican men are more likely than Republican women to say this issue is not that important (39% vs. 29%). Among Democrats, men and women prioritize this issue at essentially the same rate.
Sexual Harassment in the Workplace: Safety in Reporting, Fears of False Accusations
Three-quarters (75%) of workers believe that if they were sexually harassed at work, they could safely report their experience without it negatively affecting their career or job prospects, while about one in five (22%) do not think this would be possible.[5]
Eight in ten (80%) currently employed women, compared to seven in ten (70%) men, feel like they could safely report sexual harassment without repercussions.
The vast majority of Americans also do not worry about being falsely accused of sexual harassment at work. More than eight in ten (84%) do not worry that they will be falsely accused, while fewer than one in five say they worry somewhat (12%) or a great deal (4%).
Men are more likely than women to say that they worry about being falsely accused of sexual harassment. One in five (20%) men worry about being falsely accused, but nearly eight in ten (78%) do not worry about this. More than nine in ten (91%) women do not worry about being falsely accused of sexual harassment at work.
No group expresses greater concern about being falsely accused of sexual harassment than young men. Nearly three in ten (28%) young men report being worried about the possibility of being falsely accused of sexual harassment at work.
The 2018 Elections
Likelihood of Voting
Six in ten (60%) Americans say they are absolutely certain to vote in the 2018 congressional election in November, and an additional 15% say they probably will vote. Less than one-quarter (24%) put their odds of voting at 50-50 or less, including just 12% who say they are definitely not voting.
Notably, women and men are just about as likely to say they will be voting this election. Roughly six in ten women (62%) and men (59%) say they are absolutely certain to vote in the 2018 congressional election. Compared to the last midterm election, women are more likely to report that they are intending to vote. In 2014, more than half (56%) of women and 56% of men reported that they were absolutely certain to vote.
There is also little difference in the reported likelihood to vote between partisans. About seven in ten Republicans (71%) and Democrats (69%) say they are absolutely certain to vote in the upcoming election. Compared to the last midterm election, Democrats are more likely to report that they are intending to vote. In 2014, about six in ten (61%) Democrats and 70% of Republicans reported that they were absolutely certain to vote.[6]
Consistent with turnout patterns in previous elections, seniors (age 65 or older) are significantly more likely than young Americans (age 18 to 29) to report that they intend to vote. While three-quarters (75%) of seniors say they are absolutely certain to vote in the election, just about four in ten (41%) young Americans say the same. A similar number (38%) of young Americans reported that they were absolutely going to vote in the 2014 midterm. However, a greater share of young people say they are probably going to turn out to vote this year than said the same in 2014 (25% vs. 19%).
Across race and ethnicity, there are big differences in likelihood to vote. Two-thirds (67%) of whites and nearly six in ten (58%) blacks say they are absolutely certain to vote. Hispanics are significantly less likely to say the same, with only slightly more than one-third (35%) of Hispanics saying they are absolutely certain to vote. Among whites, those with a four-year college degree are significantly more likely than those without a college degree to report they are absolutely certain to vote (82% vs. 59%).
Compared to the last midterm election, white Americans – particularly those with a four-year college degree — are more likely to report that they are going to vote. In 2014, about six in ten (62%) whites said they were absolutely certain they were going to vote. Among whites, more than seven in ten (74%) of those with a college education and more than half (56%) of those without a college education said the same. Black and Hispanic Americans report being about as likely to turn out to vote in 2018 as in 2014.
Vote Preference in the Congressional Midterm Elections
Heading into the 2018 congressional election this November, Democratic candidates have a seven-point advantage over Republican candidates. Nearly half (49%) of registered voters say that they would prefer the Democratic candidate in their election district if the election were held today, while about four in ten (42%) say they would vote for the Republican candidate.[7]
Today, registered voters are more likely to say they would prefer Democratic candidates than at about this time in 2014. In 2014, registered voters were split on their choice for candidates, with roughly equal numbers saying they would prefer to vote for the Democratic candidates (45%) and Republican candidates (43%).[8]
There is a sizable gender gap in voting preferences. A majority (56%) of women voters report that if the election were held today they would prefer the Democratic candidate while just over one-third (35%) say they would prefer the Republican candidate. By contrast, half (50%) of men say they would support the Republican candidate compared to about four in ten (41%) who say they would support the Democratic candidate.
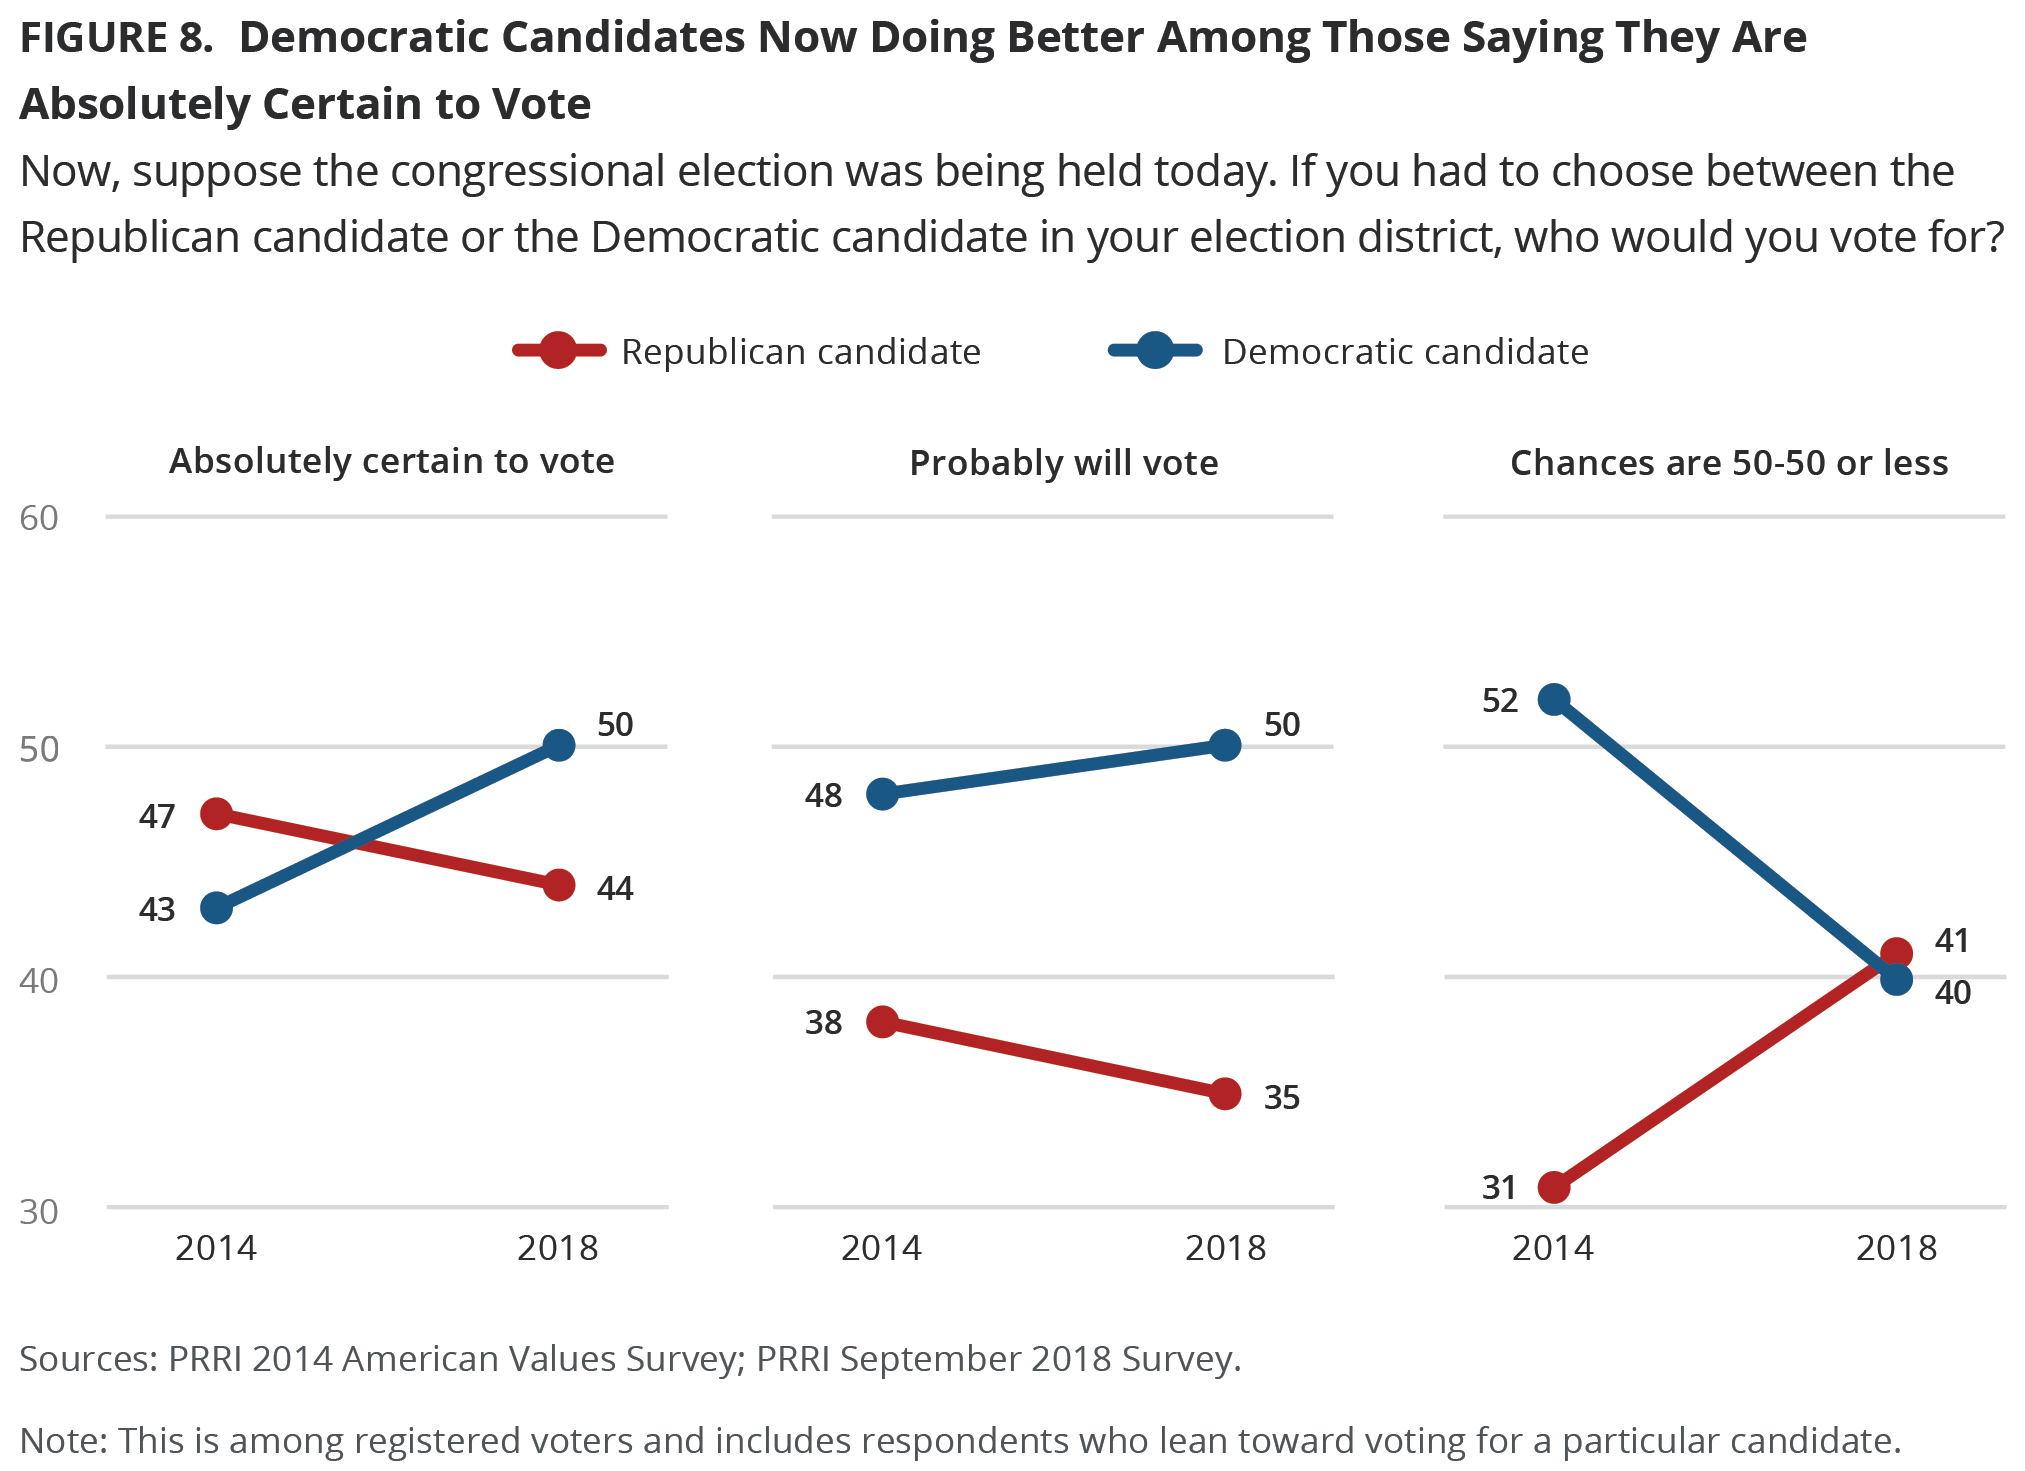
Democrats are also doing well among those registered voters who report the highest likelihood of voting. Registered voters who say they are absolutely certain to vote are more likely to prefer the Democratic candidate (50%) over the Republican candidate (44%). Similarly, half (50%) of those saying they will probably vote prefer the Democratic candidate while just over one-third (35%) say they prefer the Republican candidate. It is only among lower propensity voters – those reporting that there is a 50-50 chance that they will vote or less– where preferences for the Democratic candidate (40%) and the Republican candidate (41%) are roughly equal.
This relationship was noticeably different during the past midterm election cycle. In 2014, the Republican candidate was more popular than the Democratic candidate among those absolutely certain to vote (47% vs. 43%) and less popular among those with a 50-50 chance of voting or less (31% vs. 52%).
Candidate preference differs greatly by race and ethnicity. The vast majority (82%) of black registered voters and nearly two-thirds (65%) of Hispanic voters say they would support the Democratic candidates in their election district. White voters are more likely to favor the Republican candidate over the Democratic candidate (49% vs. 41%). Among white Americans, there are deep divides by education. Those without a four-year college degree favor the Republican candidate over the Democratic candidate (51% vs. 37%) while the opposite is true for those with a college education (45% vs. 49%).
Compared to the last midterm election, Democrats are doing better among most of these groups. In 2014, over one-third (36%) of white registered voters said they preferred the Democratic candidate, including one-third (33%) of those without a college degree and 41% of those with a college degree. Additionally, nearly six in ten (58%) Hispanic registered voters said they preferred the Democratic candidate.
Candidate preferences differ greatly by religious tradition. The Republican candidates are more popular than the Democratic candidates among white evangelical Protestants (71% vs. 20%). By contrast, the Democratic candidates are more popular than Republican candidates among black Protestants (88% vs. 10%), Hispanic Catholics (67% vs. 27%), and the religiously unaffiliated (64% vs. 27%). White mainline Protestants (46% vs. 44%) and white Catholics (47% vs. 42%) are divided in their preferences with roughly equal numbers favoring the Republican and Democratic candidates in their district.
Favorability of President Trump
A majority (52%) of all Americans have an unfavorable view of Donald Trump, with around four in ten (42%) viewing him favorably. Opinions of Trump have remained stable since early 2017 when 52% expressed a negative view of him.[9]
Women and men are of very different opinions about Trump. Six in ten (60%) women view Trump unfavorably, with only around one-third (35%) viewing him favorably. Men, by contrast, report having a more positive than negative view of the president (50% vs. 45%).
Trump’s favorability differs starkly across racial and ethnic groups. Strong majorities of black (75%) and Hispanic (67%) Americans view Trump unfavorably. Whites are more divided, with roughly half viewing Trump favorably (50%) and unfavorably (47%).
Members of most major religious traditions have an unfavorable view of Trump. White evangelical Protestants are the only major religious group to view Trump favorably. More than seven in ten (72%) white evangelical Protestants have a favorable opinion of Trump; Trump’s favorability among white evangelical Protestants has remained relatively unchanged since he took office in 2017. By contrast, three-quarters (75%) of black Protestants, nearly two-thirds (65%) of the religiously unaffiliated, and nearly six in ten (59%) Catholics view Trump unfavorably. White mainline Protestants are about equally split (48% favorable vs. 49% unfavorable). Among Catholics, there are sharp race and ethnicity divides. Three-quarters (75%) of Hispanic Catholics view Trump negatively, while white Catholics are divided (46% favorable vs. 50% unfavorable).
Preference for a Man or Woman Candidate
Most Americans say that all things being equal, they have no gender preference for congressional candidates in their districts this upcoming election. Seven in ten (70%) Americans say the gender of the candidate does not matter to them. Almost one in five (17%) say they would prefer a woman, compared to 11% who say they would prefer a man.
Women are more likely than men to express a preference for female candidates. About two-thirds (66%) of women and more than seven in ten (74%) men say the gender of the candidate does not matter. However, women are almost twice as men to say they prefer female candidates (22% vs. 12%).
While majorities of both Democrats and Republicans say candidate gender is not important, Democrats are more likely than Republicans to express a preference for female candidates. Majorities of both Republicans (75%) and Democrats (63%) say a candidate’s gender does not matter to them. However, more than one-quarter (27%) of Democrats say they would prefer a female candidate, compared to only six percent of Republicans.
There are also significant gender divides within parties. Democratic women are more likely than Democratic men to express a preference for female candidates (33% vs. 18%), but Republican women are more likely than Republican men to express a preference for a male candidate (23% vs. 14%).
Would the Country be Better Off with More Women in Office?
Although most Americans say they do not have a gender preference for political candidates, six in ten (60%) believe that the country would benefit if we had more women in political office, compared to 29% who disagree. Views have not shifted significantly since 2016, when a similar number (58%) expressed this opinion.[10]
Women are more likely than men to agree that more women in office would benefit the country (67% vs. 54%).
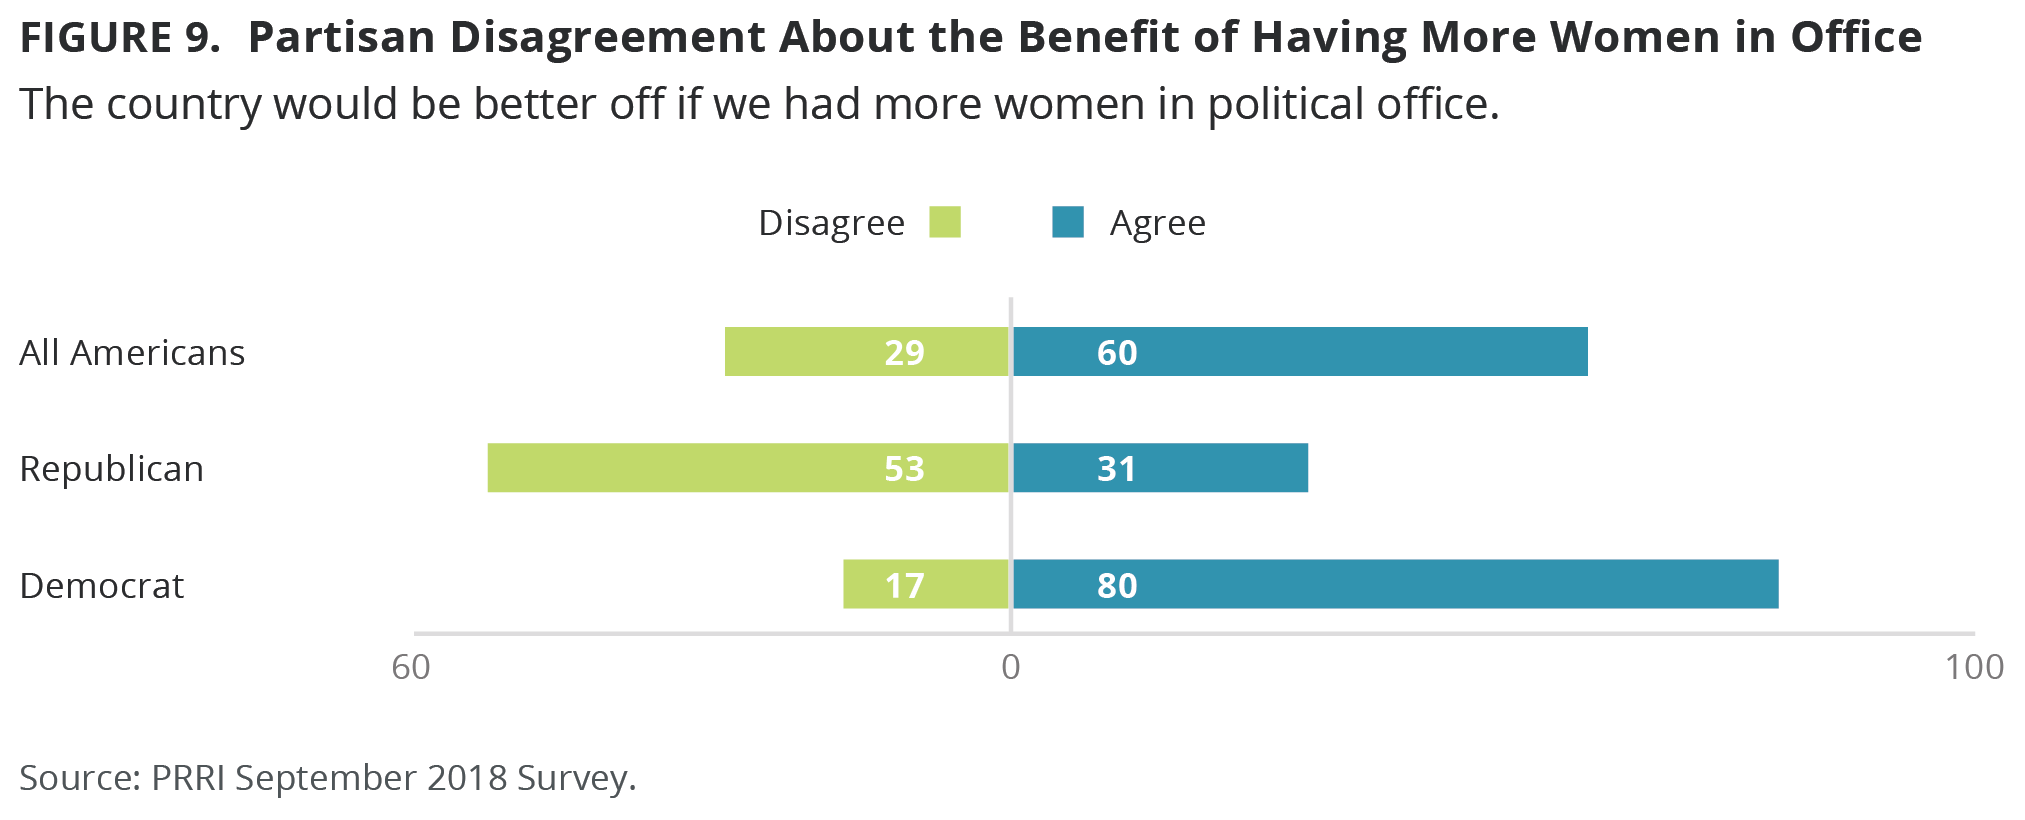
There is a nearly fifty-point partisan divide in attitudes about the benefit of increased representation of women in political office. An overwhelming majority (80%) of Democrats agree that more women in office would benefit the country, compared to only 31% of Republicans. A majority of Republicans (53%) do not believe the country would be better off with more female representation, and nearly one in five (16%) of Republicans say they do not know or refused to answer the question.
Would You Vote for Someone Accused of Sexual Harassment?
Six in ten (60%) say that they would definitely not vote for a political candidate if they had been accused of sexual harassment by multiple people, while nearly one-third (32%) say they would still consider voting for them if they agreed with them on the issues.
Women are much more likely than men to say they would not vote for such a candidate. More than two-thirds (68%) of women, compared to 53% of men, say they would definitely not vote for a candidate accused by multiple people of sexual harassment. Only 26% of women, but nearly four in ten (38%) men, say they would still consider voting for such a candidate. However, there is a considerable generation gap among men. Nearly six in ten (59%) younger men (age 18 to 34), compared to fewer than half (47%) of senior men (ages 65 and older), say they would rule out voting for someone accused of sexual harassment by multiple people. Forty-six percent of senior men say they would still consider voting for such a candidate. The views of younger and senior women are not significantly different.
There are stark political contrasts on this issue as well. An overwhelming majority (81%) of Democrats say they would definitely not vote for someone accused of sexual harassment by multiple people, while only 34% of Republicans say this fact would preclude their support. A majority (56%) of Republicans say they would still consider voting for a candidate facing multiple accusations of sexual harassment.
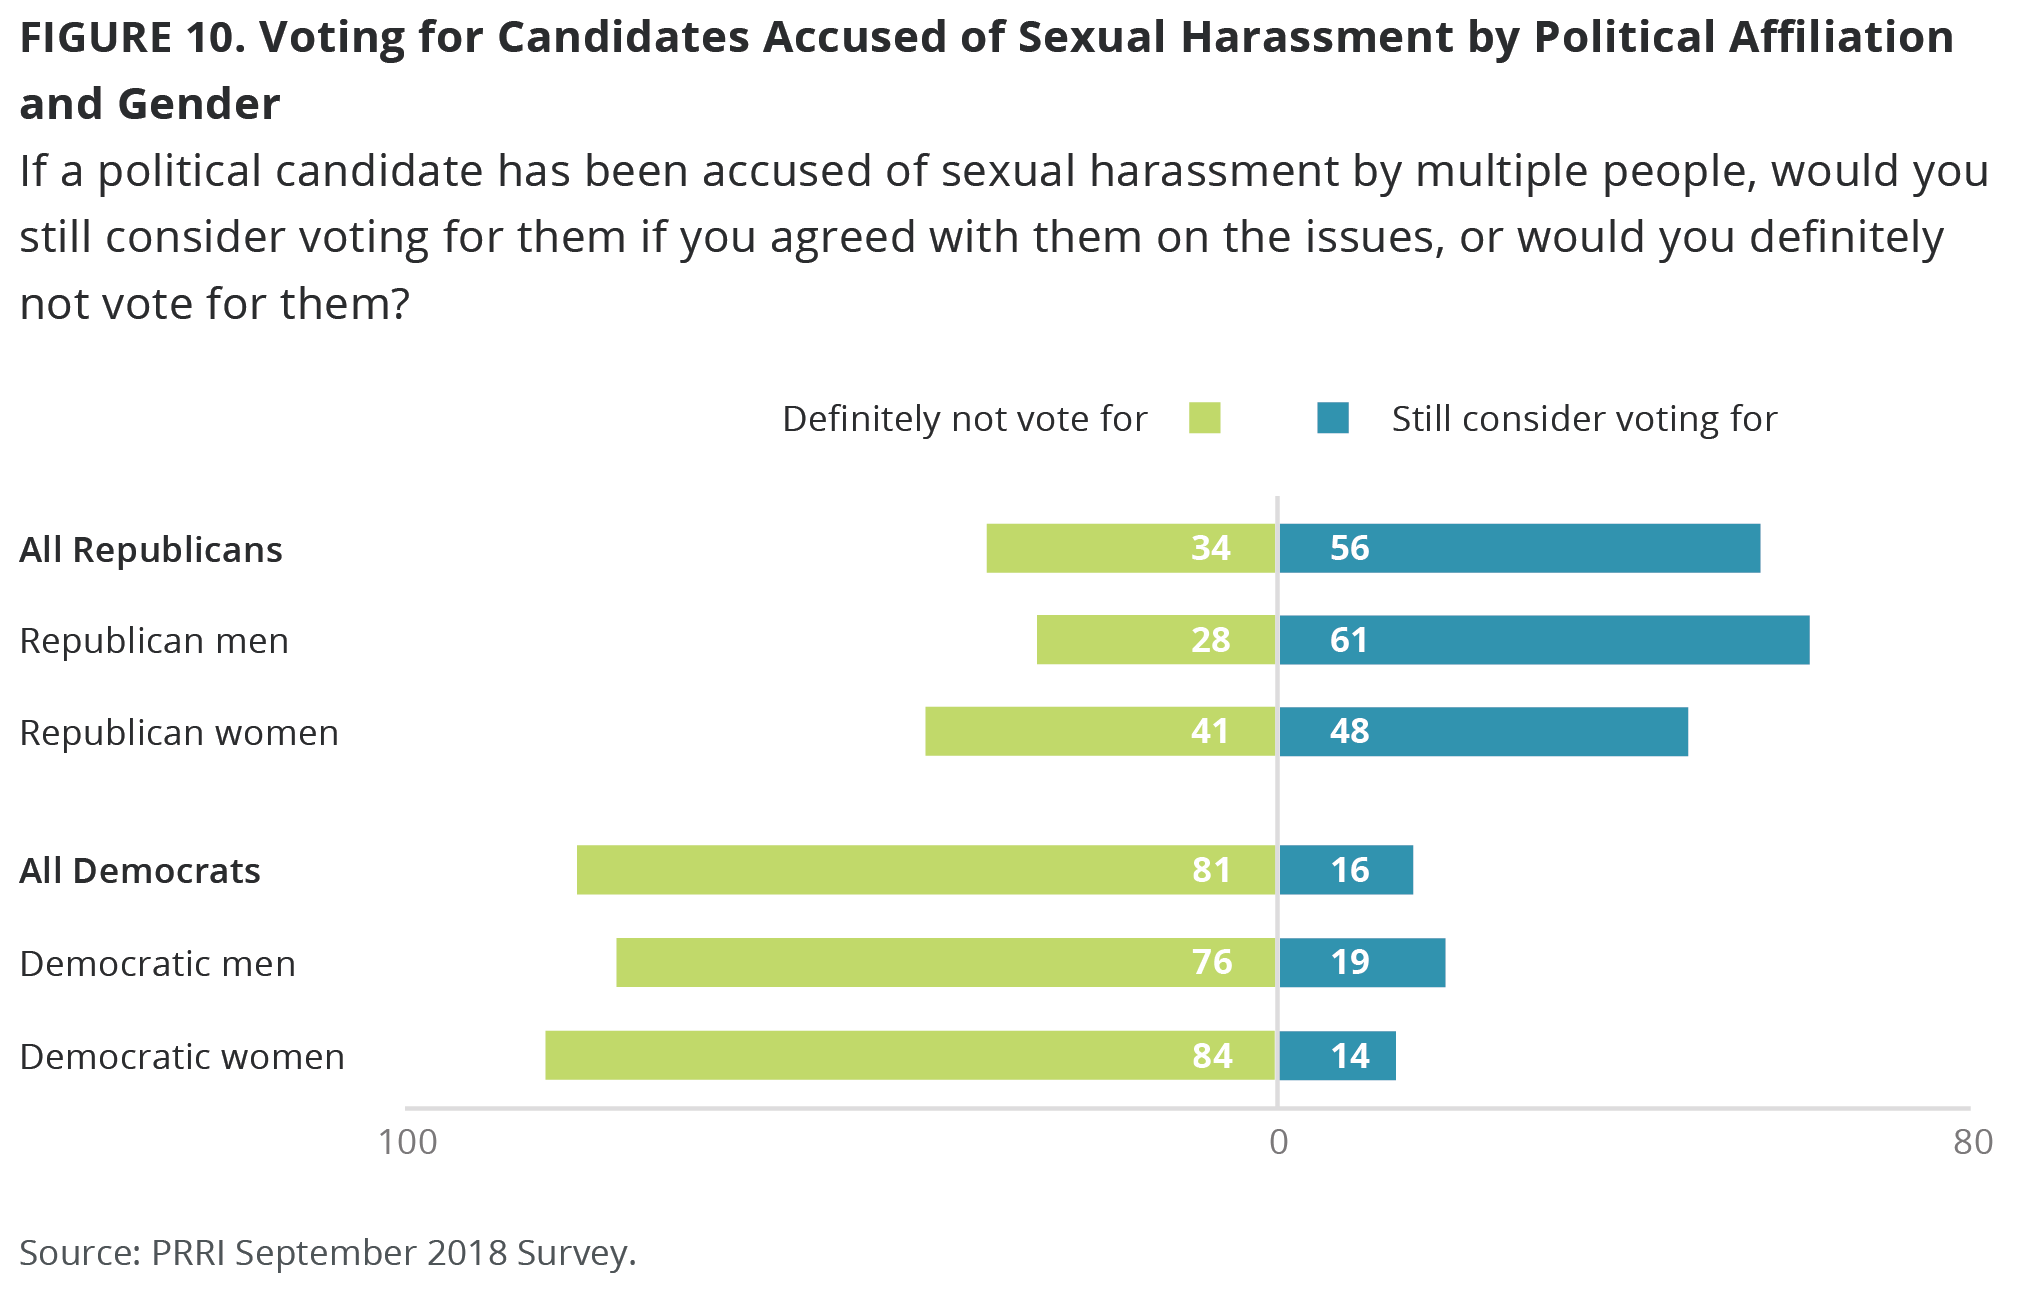
However, there are important differences among Republicans by gender. More than six in ten (61%) Republican men say they would still consider voting for a candidate accused of sexual harassment by multiple people. Republican women are more divided, with 48% reporting that they would support such a candidate and 41% reporting that they would not. The views of Democratic women and men are mostly aligned, with more than three-quarters of each group reporting that they would not vote for a candidate with multiple sexual harassment accusations against them (84% and 76%, respectively).
Survey Methodology
The survey was designed and conducted by PRRI. The survey was made possible by a generous grant from an anonymous donor with additional support from The Nathan Cummings Foundation, Unitarian Universalist Veatch Program at Shelter Rock, and The New World Foundation. Results of the survey were based on bilingual (Spanish and English) RDD telephone interviews conducted between August 22, 2018 and September 2, 2018 by professional interviewers under the direction of SSRS. Interviews were conducted among a random sample of 1,856 adults 18 years of age or older living in the United States (1,124 respondents were interviewed on a cell phone). The selection of respondents within households was accomplished by randomly requesting to speak with the youngest adult male or female currently living in the household.
Data collection is based on stratified, single-stage, random-digit-dialing (RDD) sample of landline telephone households and randomly generated cell phone numbers. The sample is designed to represent the total U.S. adult population and includes respondents from all 50 states, including Hawaii and Alaska. The landline and cell phone samples are provided by Marketing Systems Group.
The weighting is accomplished in two separate stages. The first stage of weighting corrects for different probabilities of selection associated with the number of adults in each household and each respondent’s telephone usage patterns. In the second stage, sample demographics are balanced to match target population parameters for gender, age, education, race and Hispanic ethnicity, region (U.S. Census definitions), population density and telephone usage. The population density parameter was derived from Census 2010 data. The telephone usage parameter came from an analysis of the July-December 2017 National Health Interview Survey. All other weighting parameters are derived from an analysis of the U.S. Census Bureau’s May 2017 Current Population Survey.
The sample weighting is accomplished using an iterative proportional fitting (IFP) process that simultaneously balances the distributions of all variables. Weights were trimmed to prevent individual interviews from having too much influence on the final results. The use of these weights in statistical analysis ensures that the demographic characteristics of the sample closely approximate the demographic characteristics of the target populations.
The margin of error for the survey is +/- 2.7 percentage points at the 95% level of confidence. The design effect for the survey is 1.4. In addition to sampling error, surveys may also be subject to error or bias due to question wording, context and order effects.
| Table 1. Demographic, Political, and Religious Subgroup Sample Sizes
(All figures are unweighted) |
|
| N= | |
| Total Sample | 1,856 |
| Male | 968 |
| Female | 888 |
| Republican | 493 |
| Independent | 709 |
| Democrat | 568 |
| White, non-Hispanic | 1,237 |
| Black, non-Hispanic | 168 |
| Hispanic | 248 |
| Age 18-29 | 263 |
| 30-49 | 471 |
| 50-64 | 483 |
| 65+ | 637 |
| White evangelical Protestant | 324 |
| White mainline Protestant | 302 |
| Black Protestant | 114 |
| Catholic | 366 |
| White Catholic | 202 |
| Hispanic Catholic | 122 |
| Religiously unaffiliated | 382 |
Endnotes
[1] The analysis presented here uses a state classification scheme created by the Guttmacher Institute. For more details, please visit: https://www.guttmacher.org/state-policy/explore/abortion-policy-absence-roe
[2] PRRI 2015 American Values Survey.
[3] More than six in ten (64%) white evangelical Protestants say abortion should be illegal in all or most cases, while 55% of black Protestants say abortion should be legal in all or most cases.
[4] PRRI May 2014 Survey.
[5] All analysis in this section was conducted among those who are working full-time or part-time. “Workers” includes all American adults who are currently employed in a full-time or part-time position.
[6] PRRI 2014 American Values Survey.
[7] Analysis in this section is limited to those who reported that they were registered to vote. In addition, reported vote intentions include those who say they lean towards a major party candidate.
[8] PRRI 2014 American Values Survey.
[9] PRRI January 2017 Survey.
[10] PRRI 2016 American Values Survey.
Recommended citation:
Robert P. Jones, PhD, Daniel Cox, PhD, Rob Griffin, PhD, Maxine Najle, PhD, Molly Fisch-Friedman, and Alex Vandermaas-Peeler. “Partisanship Trumps Gender: Sexual Harassment, Woman Candidates, Access to Contraception, and Key Issues in 2018 Midterms.” PRRI. 2018. https://www.prri.org/research/abortion-reproductive-health-midterms-trump-kavanaugh.


