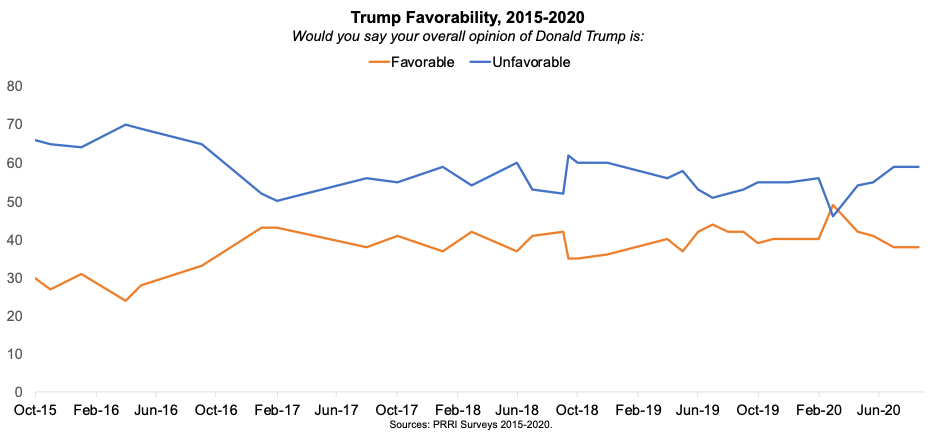
President Donald Trump’s favorability has remained stable since July 2020. Fewer than four in ten (38%) Americans hold favorable views of Trump and nearly six in ten (59%) view him unfavorably. Trump’s current favorability is the same as it was in July (38% favorable, 59% unfavorable) and it is not significantly different from May (41% favorable, 55% unfavorable) or April (42% favorable, 54% unfavorable), but it is substantially down from his high point in March (49% favorable, 46% unfavorable). The current numbers are slightly lower than his 2019 average (41% favorable, 55% unfavorable), but again, the difference is not statistically significant.
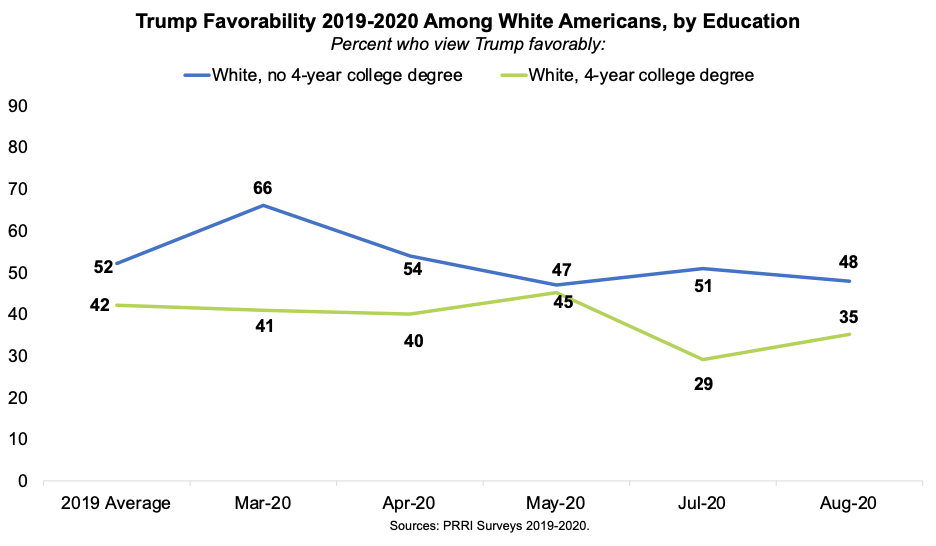
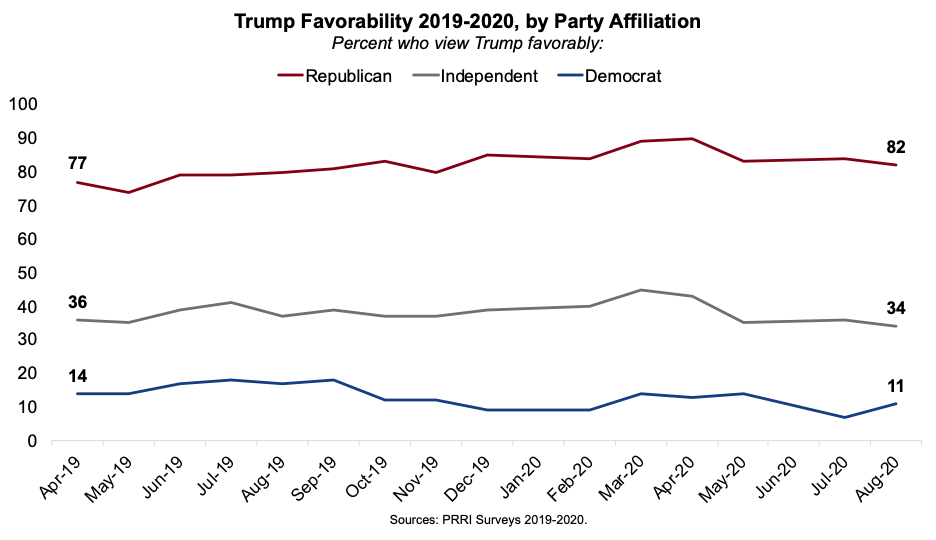
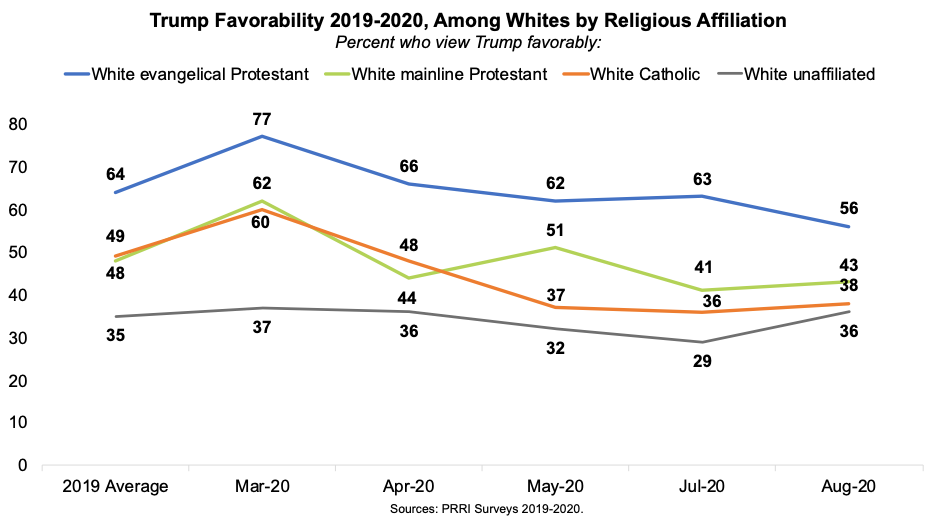
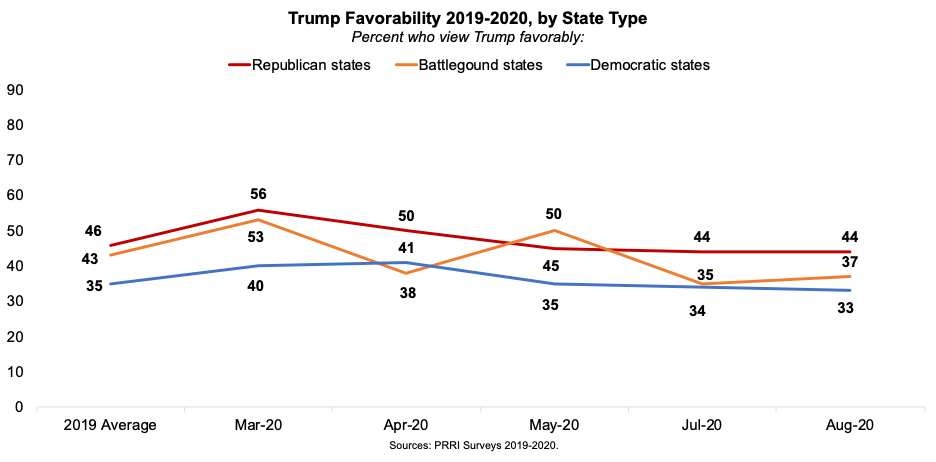
Favorable views of Trump remain essentially unchanged across many demographic groups since July 2020. None of the July-August differences shown in the charts are statistically significant. However, differences between 2019 averages and August 2020 are significant for Democrats (from 15% to 11%), men (from 47% to 42%), Americans ages 30 to 49 (from 39% to 31%) and Americans living in battleground states (from 43% to 37%). Notably, since 2019 favorable views of Trump have declined significantly among white Americans overall (from 49% to 44%) and among a number of important white subgroups, including white Christians overall (from 54% to 46%), white Catholics (from 49% to 38%), and white Americans with a four-college degree (42% to 35%).
Biden Favorability
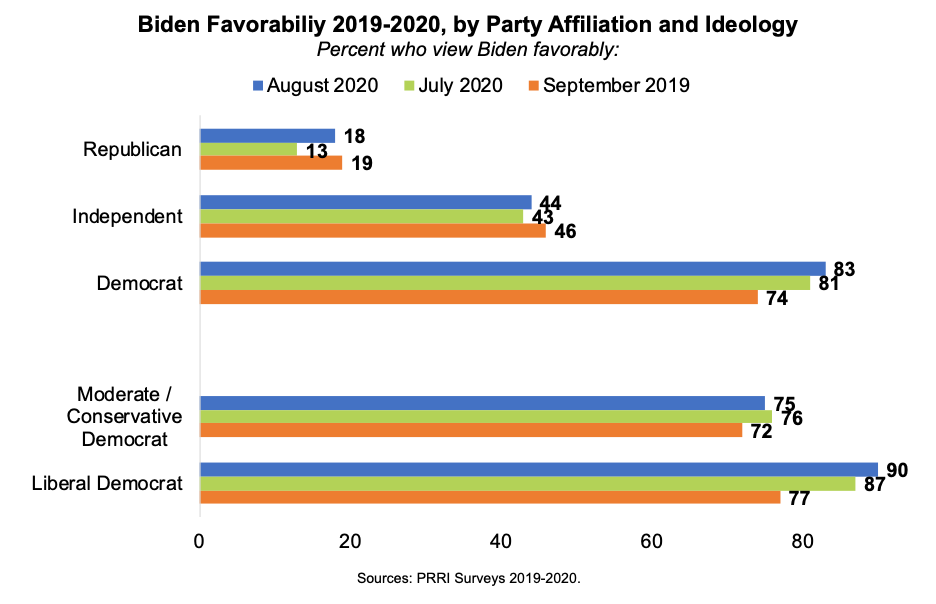
Americans remain more positive toward the former vice president and presumptive Democrat presidential nominee Joe Biden, with a slim majority (51%) now holding a favorable view, and 45% holding an unfavorable view of Trump’s competitor. This is up slightly, but not significantly, from July (48% favorable), and still unchanged since September 2019, when 49% viewed Biden favorably and 45% unfavorably.
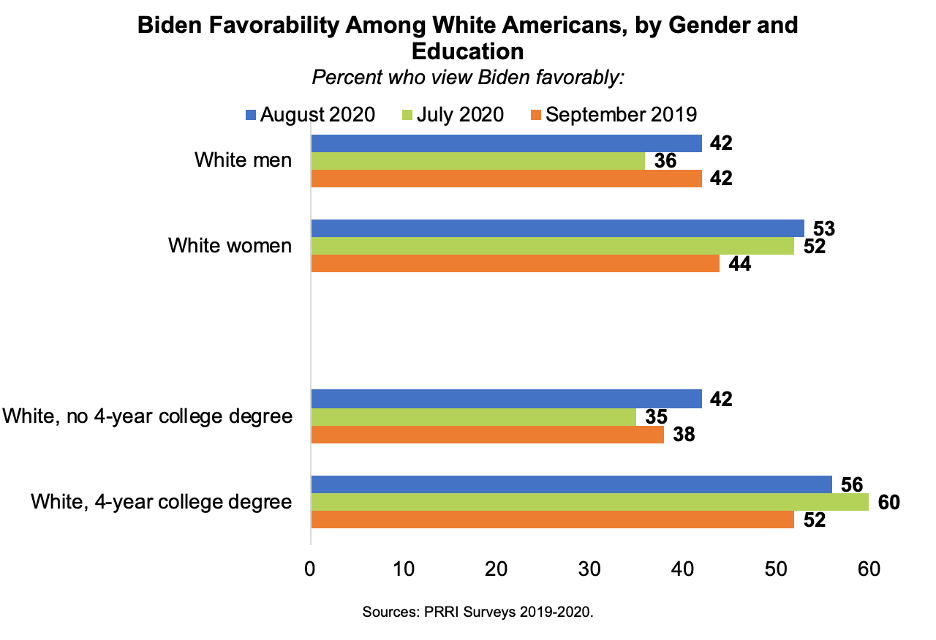
Views of Biden by party and ideology have not significantly shifted, although the increase among Republicans (18%) relative to July (13%) is a trend to keep an eye on. Similarly, although not statistically significant, the upward movement among white men (42% compared to 36% in July) and white Americans without four-year college degrees (42% compared to 35% in July) could become important if it continues. Favorable views of Biden have increased significantly among white Catholics. Almost two-thirds (66%) now hold favorable views of him, compared to 40% in July.

Topline and Survey Methodology
PRRI August 2020 Survey
August 4, 2020 – August 9, 2020
N=1,009
Would you say your overall opinion of Donald Trump is very favorable, mostly favorable, mostly unfavorable, or very unfavorable?
| Very favorable | Mostly
favorable |
Mostly unfavorable | Very unfavorable | Have not heard of | Don’t Know/ Refused | |
| August 4-9 | 16 | 22 | 18 | 41 | * | 3=100 |
| July 7-12 | 18 | 20 | 21 | 38 | * | 3=100 |
| June 29-July 5 | 15 | 20 | 19 | 42 | * | 3=100 |
| May 26-31 | 18 | 23 | 19 | 36 | 0 | 3=100 |
| April 21-26 | 17 | 26 | 20 | 34 | * | 2=100 |
| March 17-22 | 24 | 25 | 17 | 29 | * | 4=100 |
| February 11-16 | 20 | 20 | 17 | 39 | * | 4=100 |
| March–Dec. 2019 | 19 | 22 | 18 | 37 | 1 | 4=100 |
Would you say your overall opinion of Joe Biden is very favorable, mostly favorable, mostly unfavorable, or very unfavorable?
| Very favorable | Mostly
favorable |
Mostly unfavorable | Very unfavorable | Have not heard of | Don’t Know/ Refused | |
| August 4-9, 2020 | 15 | 36 | 22 | 23 | 2 | 3=100 |
| July 7-12, 2020 | 14 | 34 | 20 | 25 | 3 | 4=100 |
| Sept. 2019 | 13 | 35 | 24 | 21 | 4 | 1=100 |
| Sept. 2013 | 9 | 31 | 22 | 26 | 8 | 4=100 |
| Sept. 2012 | 16 | 28 | 21 | 24 | 4 | 8=100 |
The survey was designed and conducted by PRRI. Results of the survey are based on bilingual (Spanish and English) RDD telephone interviews conducted between August 4 and August 9, 2020, by professional interviewers under the direction of SSRS. Interviews were conducted among a random sample of 1,009 adults 18 years of age or older living in the United States (704 respondents were interviewed on a cell phone). The margin of error for the survey is +/- 3.5 percentage points at the 95% level of confidence, which includes the design effect for the survey of 1.4.


