

In the 2020 election, Joe Biden narrowly won Arizona by an extremely slim margin: 49.4% of the state’s votes went to Biden, while 49.1% went to former President Donald Trump. Using data from PRRI’s 2023 American Values Atlas, this Spotlight Analysis presents a demographic and religious profile of Arizonians and the issues that are vital to their voting choices ahead of this fall’s presidential election.
- The median age of adults in Arizona is 52, slightly above the median age of all Americans (48).
- A plurality of Arizonans (37%) have a high school education or less. Arizonans are more likely to have some college education than all Americans (33% vs. 27%), but less likely to have a four-year degree (16% vs. 20%) More than one in ten Arizonans (14%) have a postgraduate degree.
- Around six in ten Arizonans are white (65%), followed by around one-quarter who identify as Hispanic (22%), 5% as Native American, 4% as Black, 2% as Asian Americans and Pacific Islanders (AAPI), and 2% as multiracial. Compared with the national average, Arizona has a higher percentage of residents who identify as Hispanic (26% in Arizona vs. 17% nationally) and Native American (5% vs. 1%), but a lower percentage of Black residents (4% vs. 12%).
- Three in ten Arizonans identify as independent (31%) or Republican (30%) while more than one-fourth identify as Democratic (26%). Arizonans are less likely to identify as Democrats compared with Americans as a whole (26% vs. 31%, respectively).
- Nearly four in ten Arizonans (38%) identify ideologically as conservative, followed by 33% who identify as moderate and 25% as liberal. Arizonans are more likely to identify as conservative compared with the national average (38% vs. 34%, respectively).
- Using PRRI’s Christian nationalism scale, the majority of Arizonans qualify as either Christian nationalism Rejecters (32%) or Skeptics (38%), while 18% qualify as Christian nationalism Sympathizers and 9% as Adherents.
Arizona’s Religious Landscape
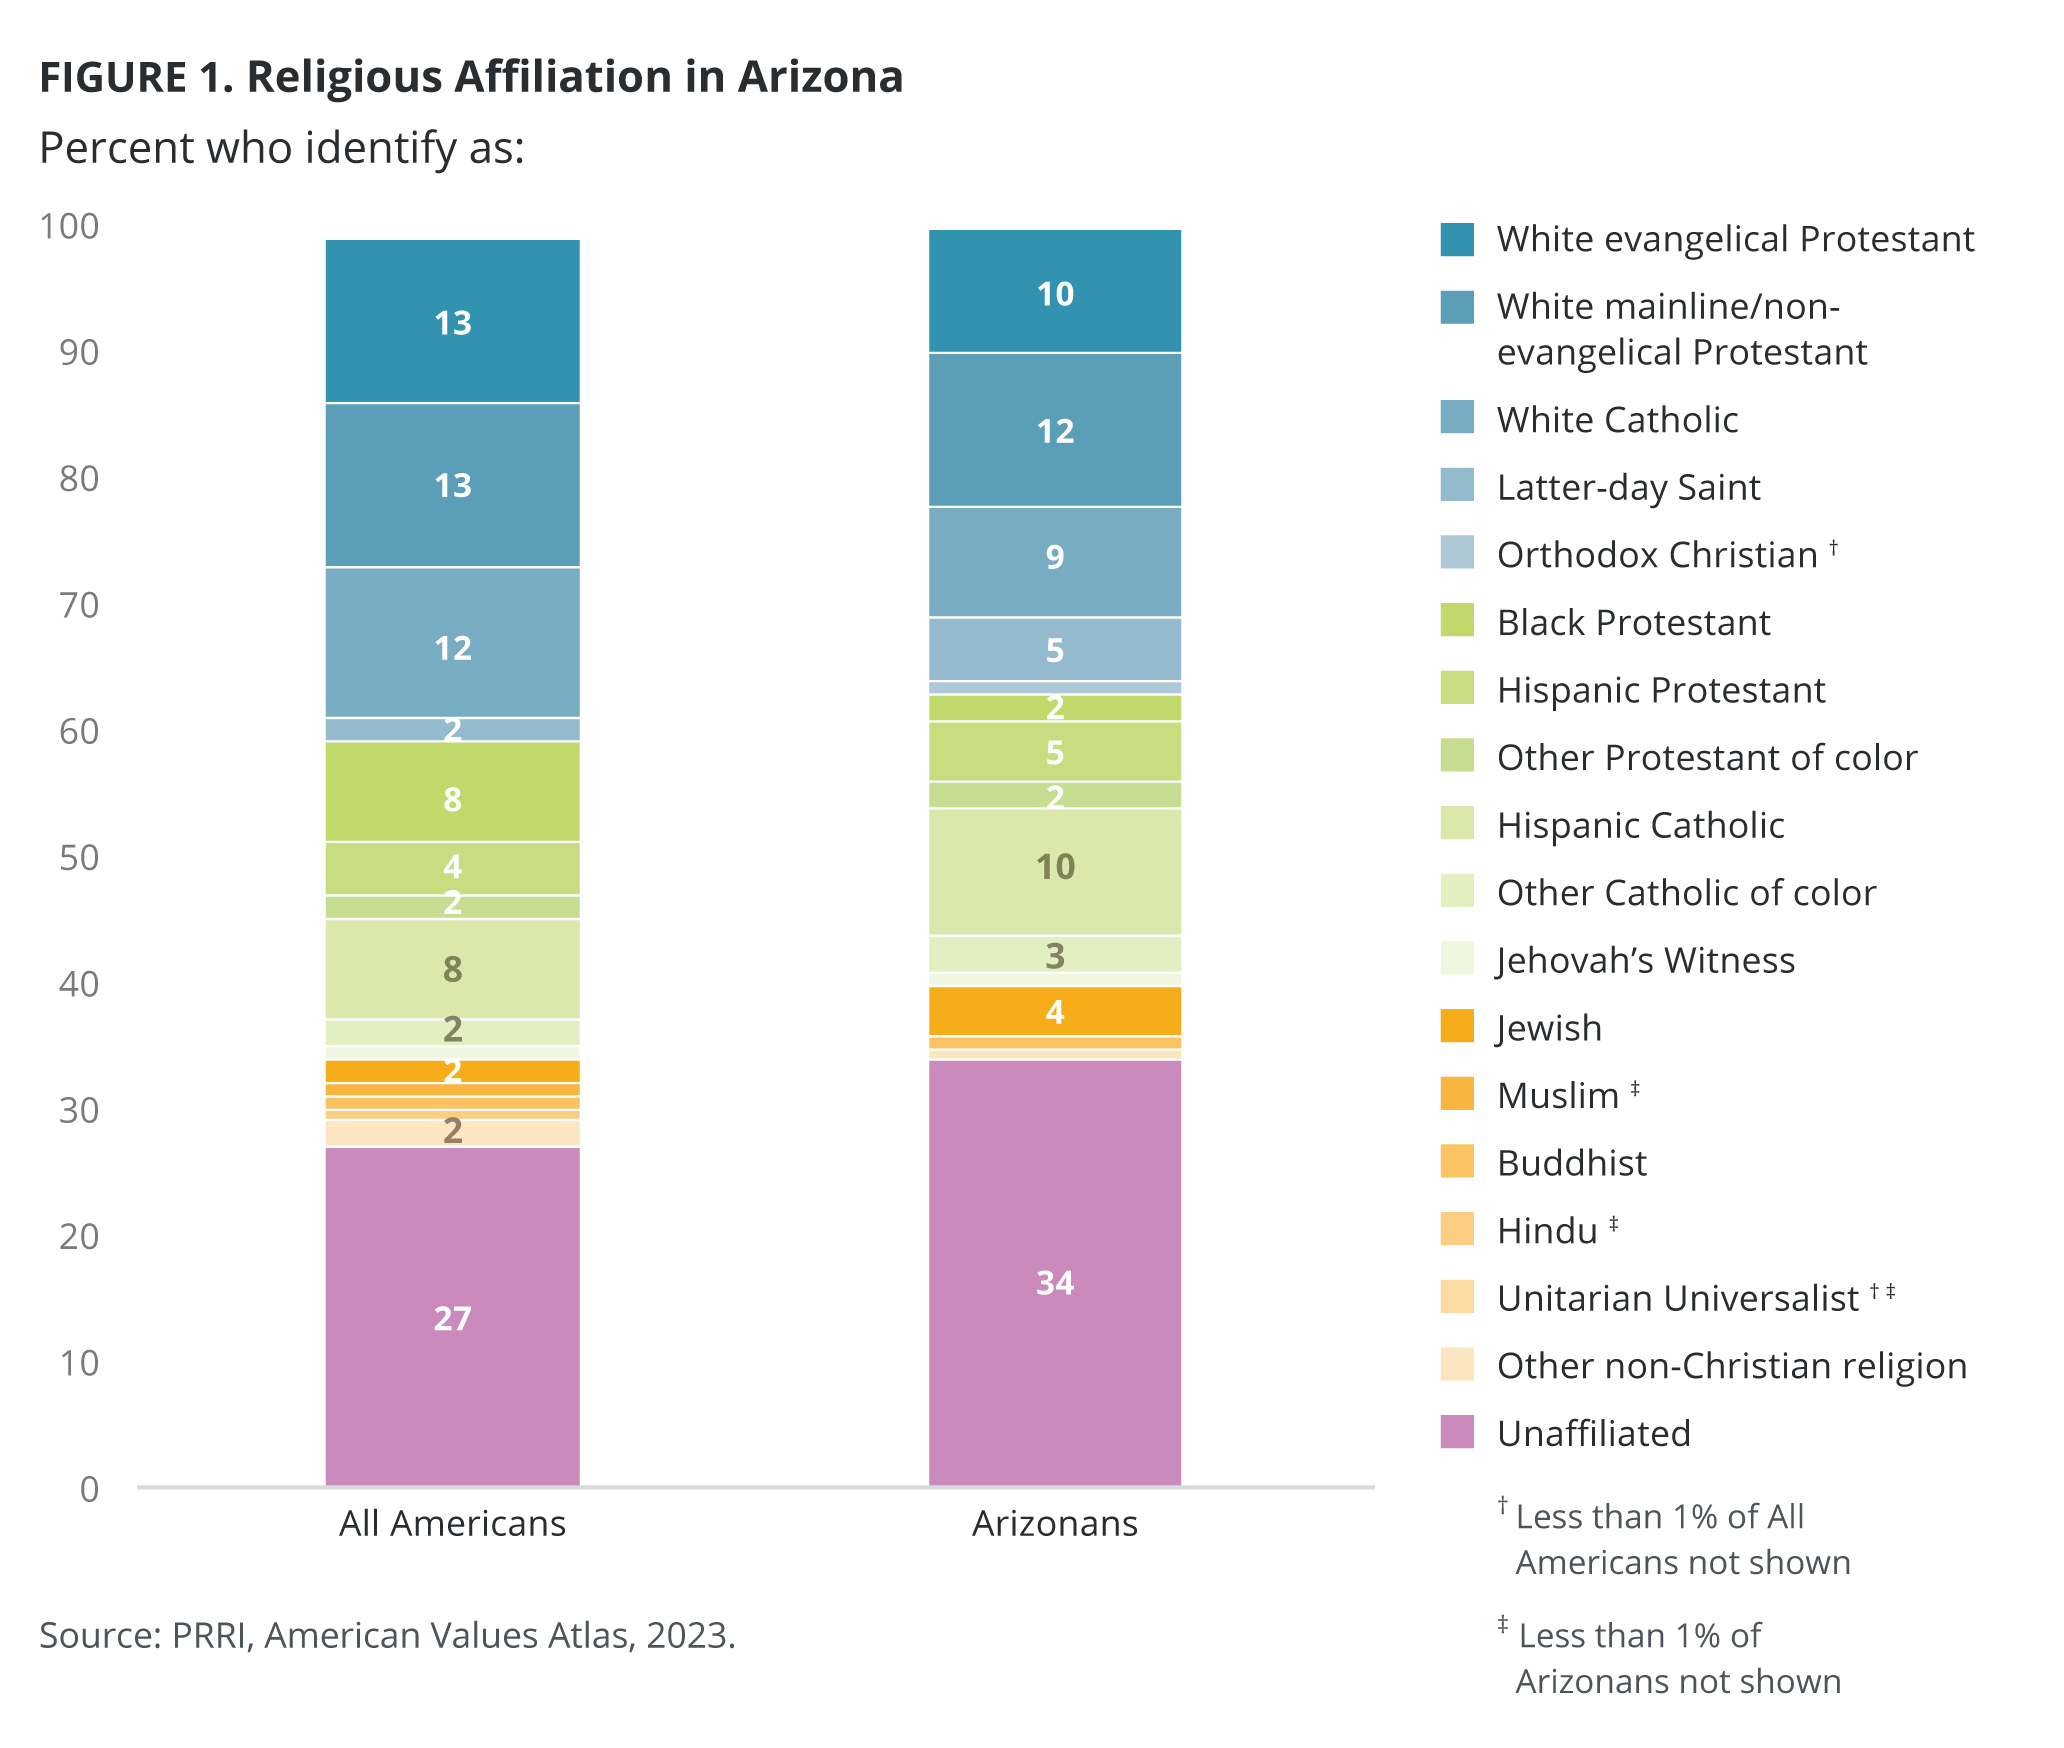
A plurality of Arizona residents are religiously unaffiliated (34%), compared with 27% of all Americans. Arizonans are less likely than Americans nationally to identify as Black Protestants (2% vs. 8%, respectively). Around one in ten Arizonans identify as white mainline/non-evangelical Protestant (12%), white evangelical Protestant (10%), Hispanic Catholic (10%), and white Catholic (9%). Arizona has similar rates to the national average of other Christian and non-Christian groups.
Arizonans’ Litmus Test Issues by Party Affiliation
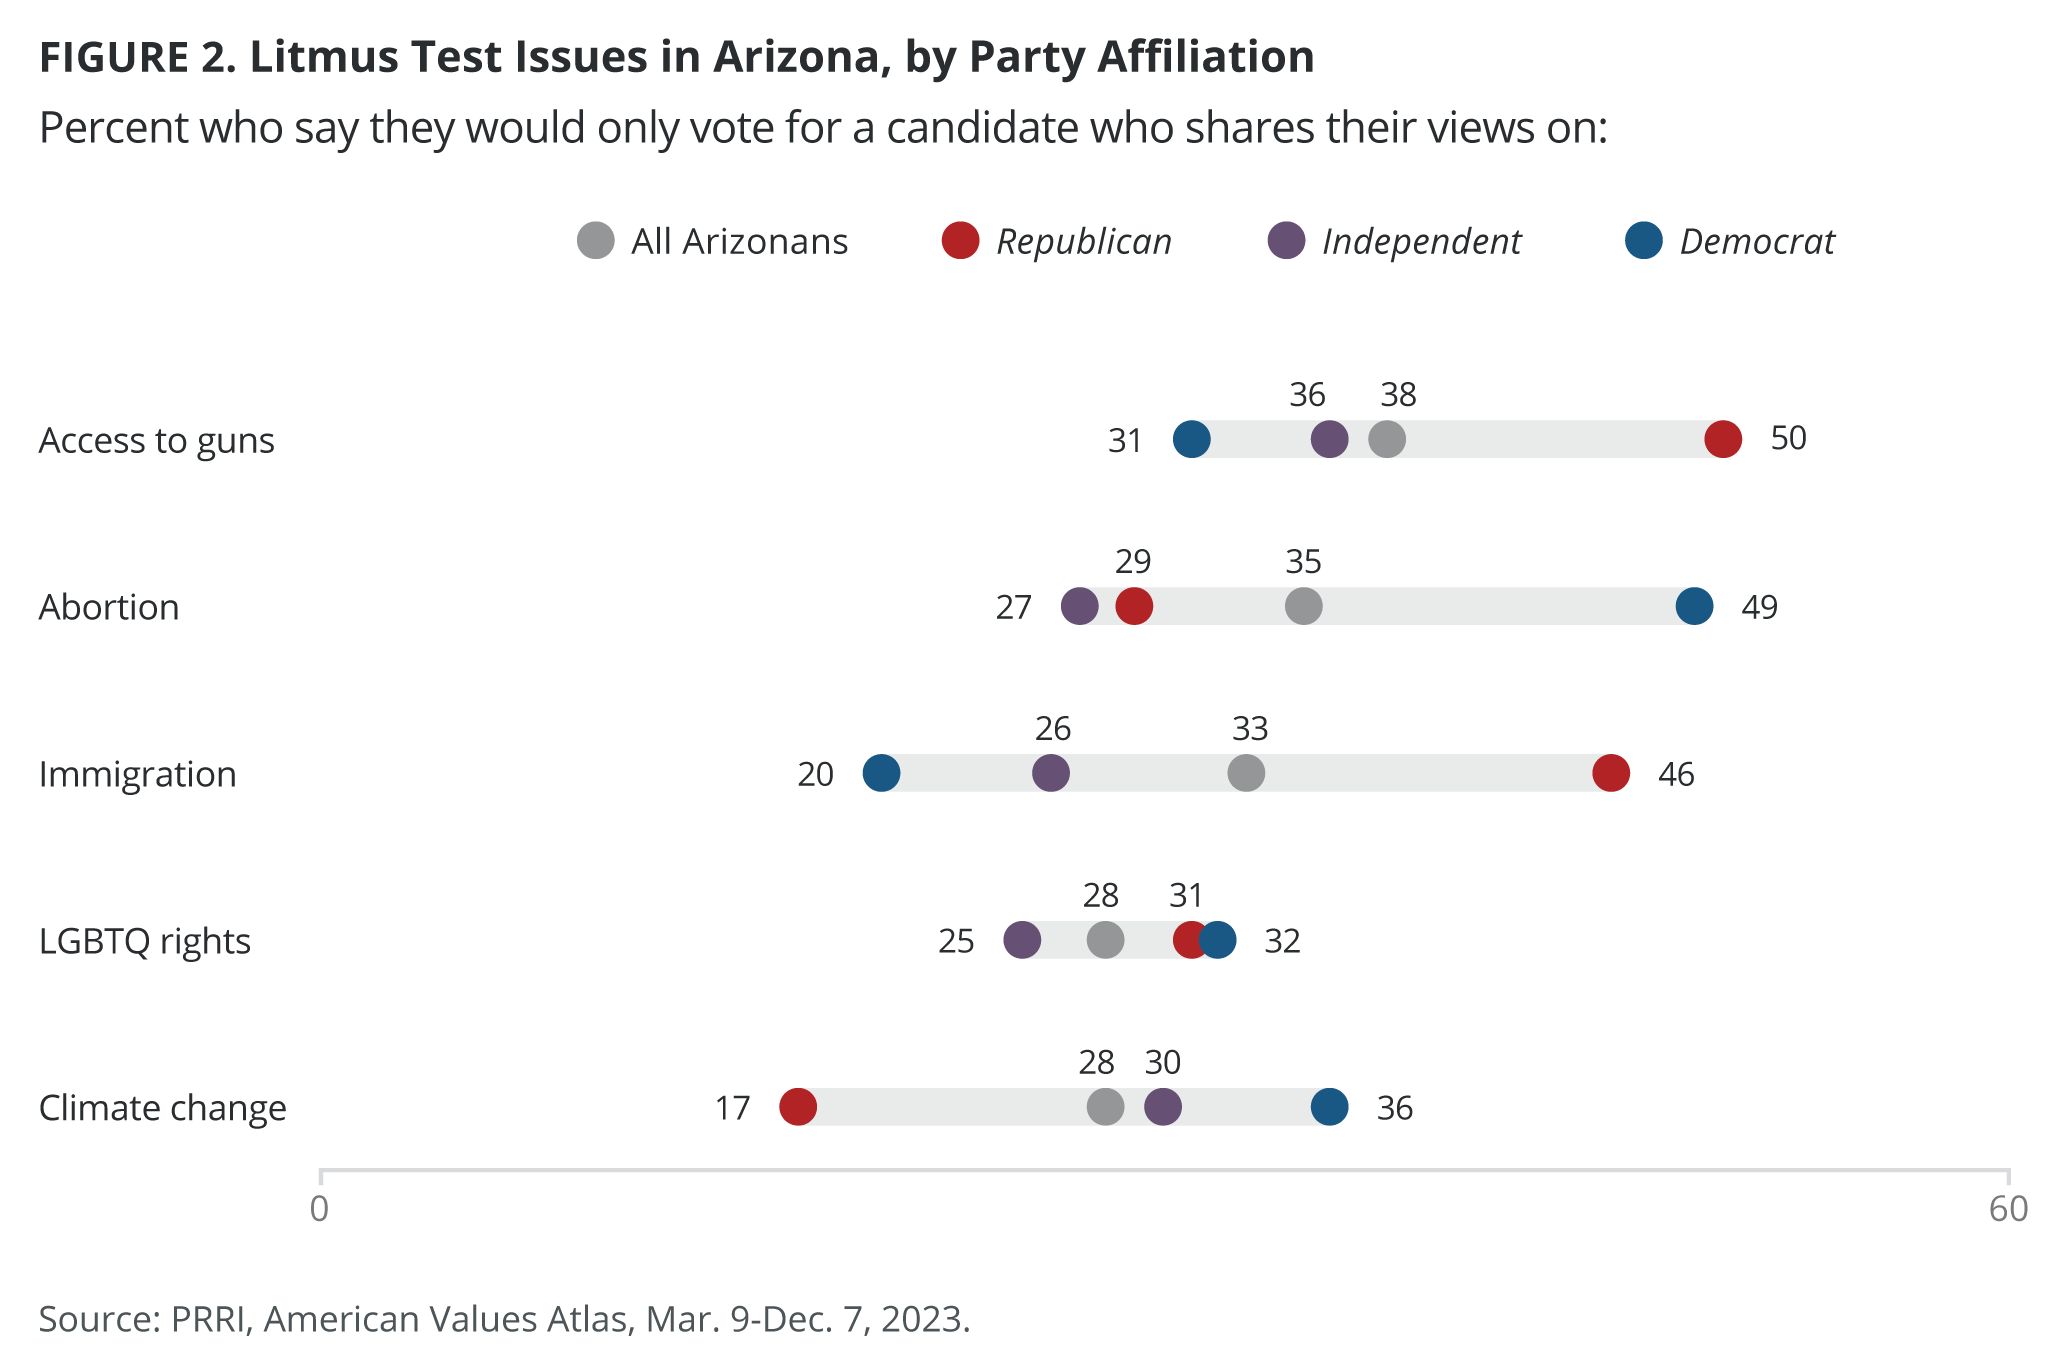
Four in ten Arizonans (38%) say they would only vote for a candidate who shares their views on access to guns. Arizona Republicans (50%) are more likely than Democrats (31%) to hold this stance. More than one-third of independent Arizonans (36%) see access to guns as a litmus test issue.
Less than four in ten Arizonans (35%) would only vote for a candidate who shares their views on abortion. Nearly half of Arizonans Democrats (49%) would vote for a candidate based on their abortion views, compared with 29% of Republicans and 27% of independents.
One-third of Arizonans (33%) consider immigration a litmus test issue when voting for a candidate. Arizona Republicans (46%) are more likely than independents (26%) and Democrats (20%) to say they would only vote for a candidate who shares their views on immigration.
Less than three in ten Arizonans (28%) would only vote for a candidate who shares their views on LGBTQ rights. Similar percentages of Democrats (32%) and Republicans (31%), as well as 25% of independents, would only vote for a candidate who shares their view on LGBTQ rights.
Less than three in ten Arizonans (28%) say they would only vote for a candidate who shares their views on climate change. Arizona Democrats (36%) are more than twice as likely as Republicans (17%) to only vote for a candidate who shares their views on climate change; three in ten independent Arizonans (30%) say the same.
Attitudes Toward LGBTQ Rights in Arizona
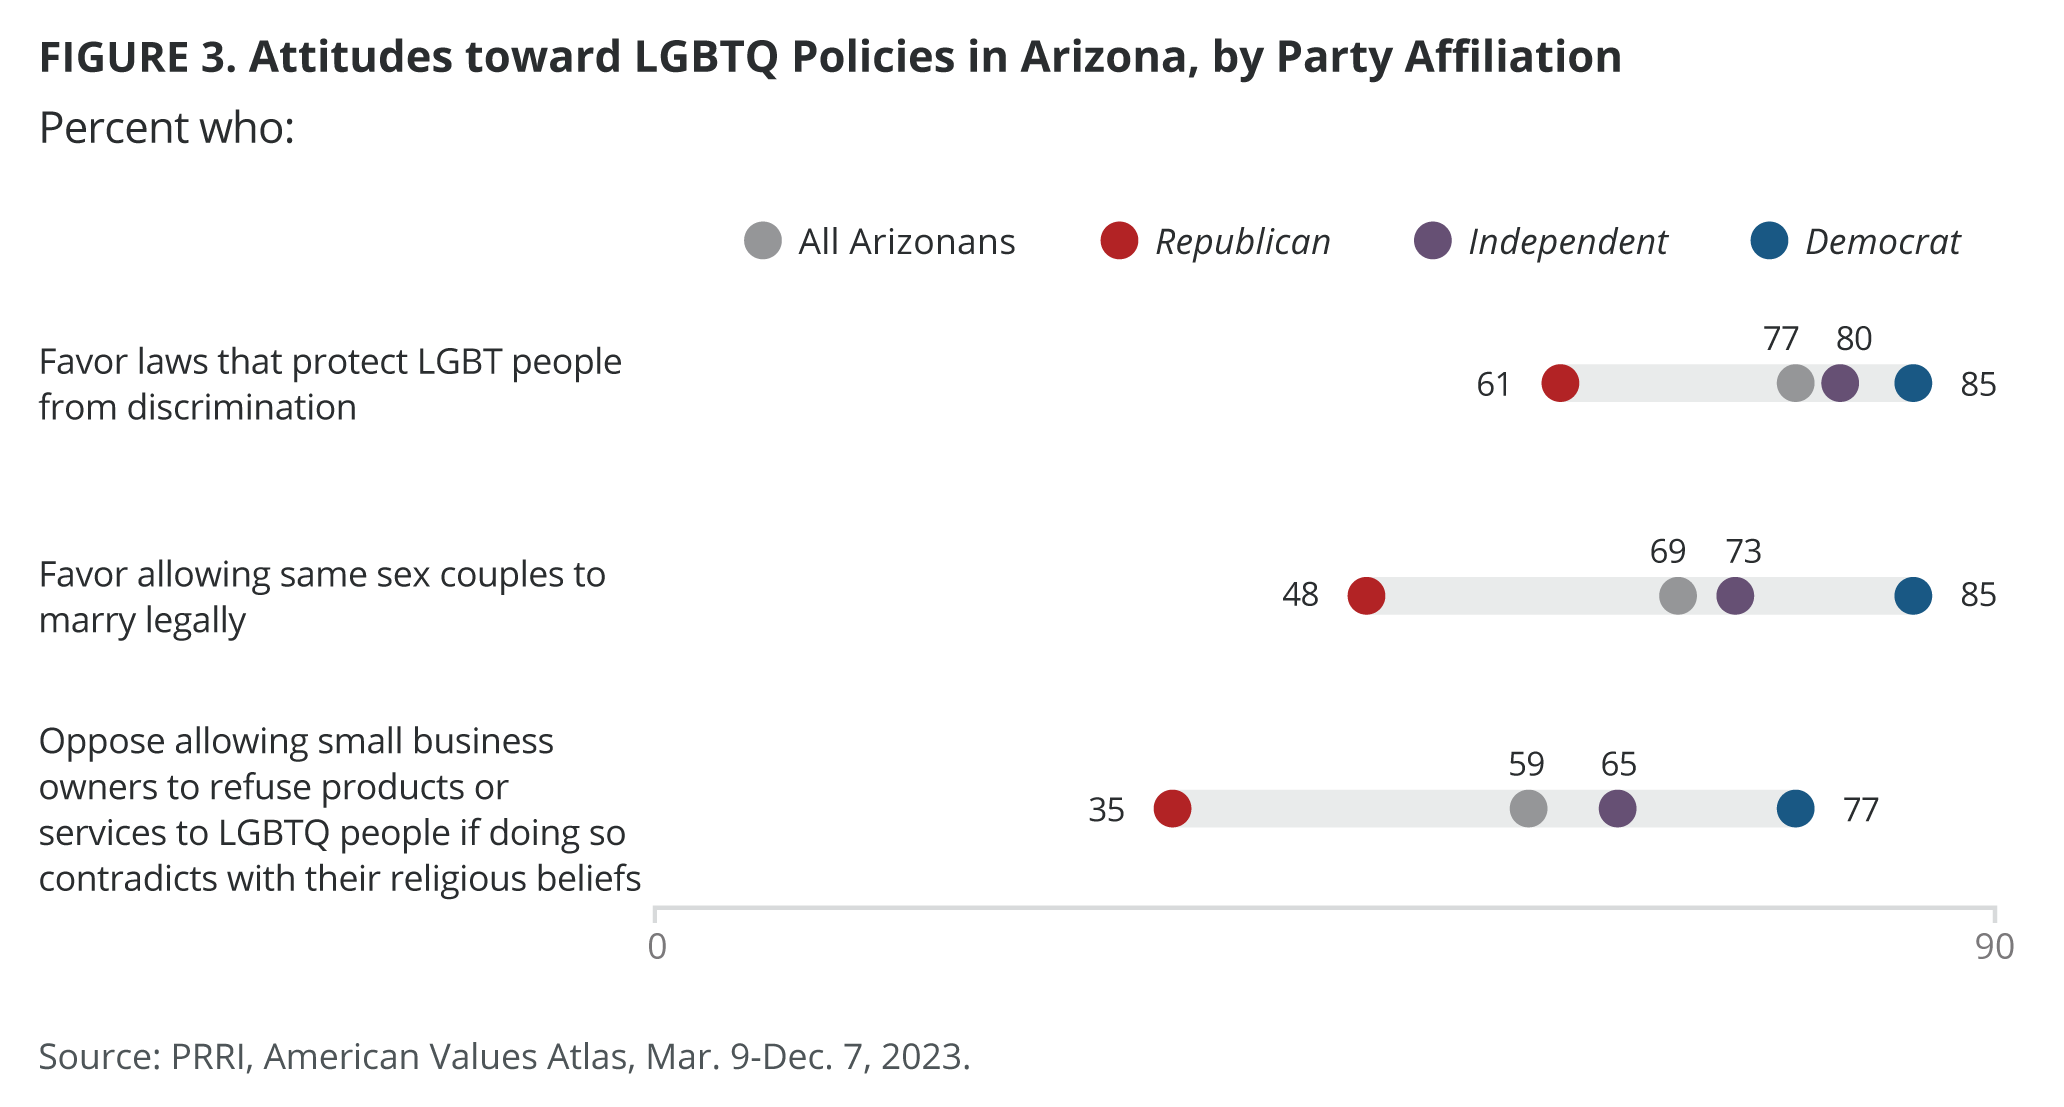
More than three in four Arizonans (77%) favor laws that protect LGBTQ people from discrimination in jobs, public accommodations, and housing, while less than two in ten (19%) oppose them. Arizona Democrats (85%) and independents(80%) are more likely than Republicans (61%) to favor nondiscrimination laws for LGBTQ people.
The majority of Arizona residents (59%) oppose allowing small business owners to refuse products or services to LGBTQ people, if doing so violates their religious beliefs, while 37% favor it. The majority of Arizona Democrats (77%) and independents (65%) oppose religiously based refusals, compared with 35% of the state’s Republicans.
Nearly seven in ten Arizonans (69%) favor allowing same-sex couples to marry legally while 27% oppose. Arizona Republicans (48%) are less likely than Democrats (85%) and independents (73%) to support same-sex marriage.
Attitudes Towards Abortion in Arizona
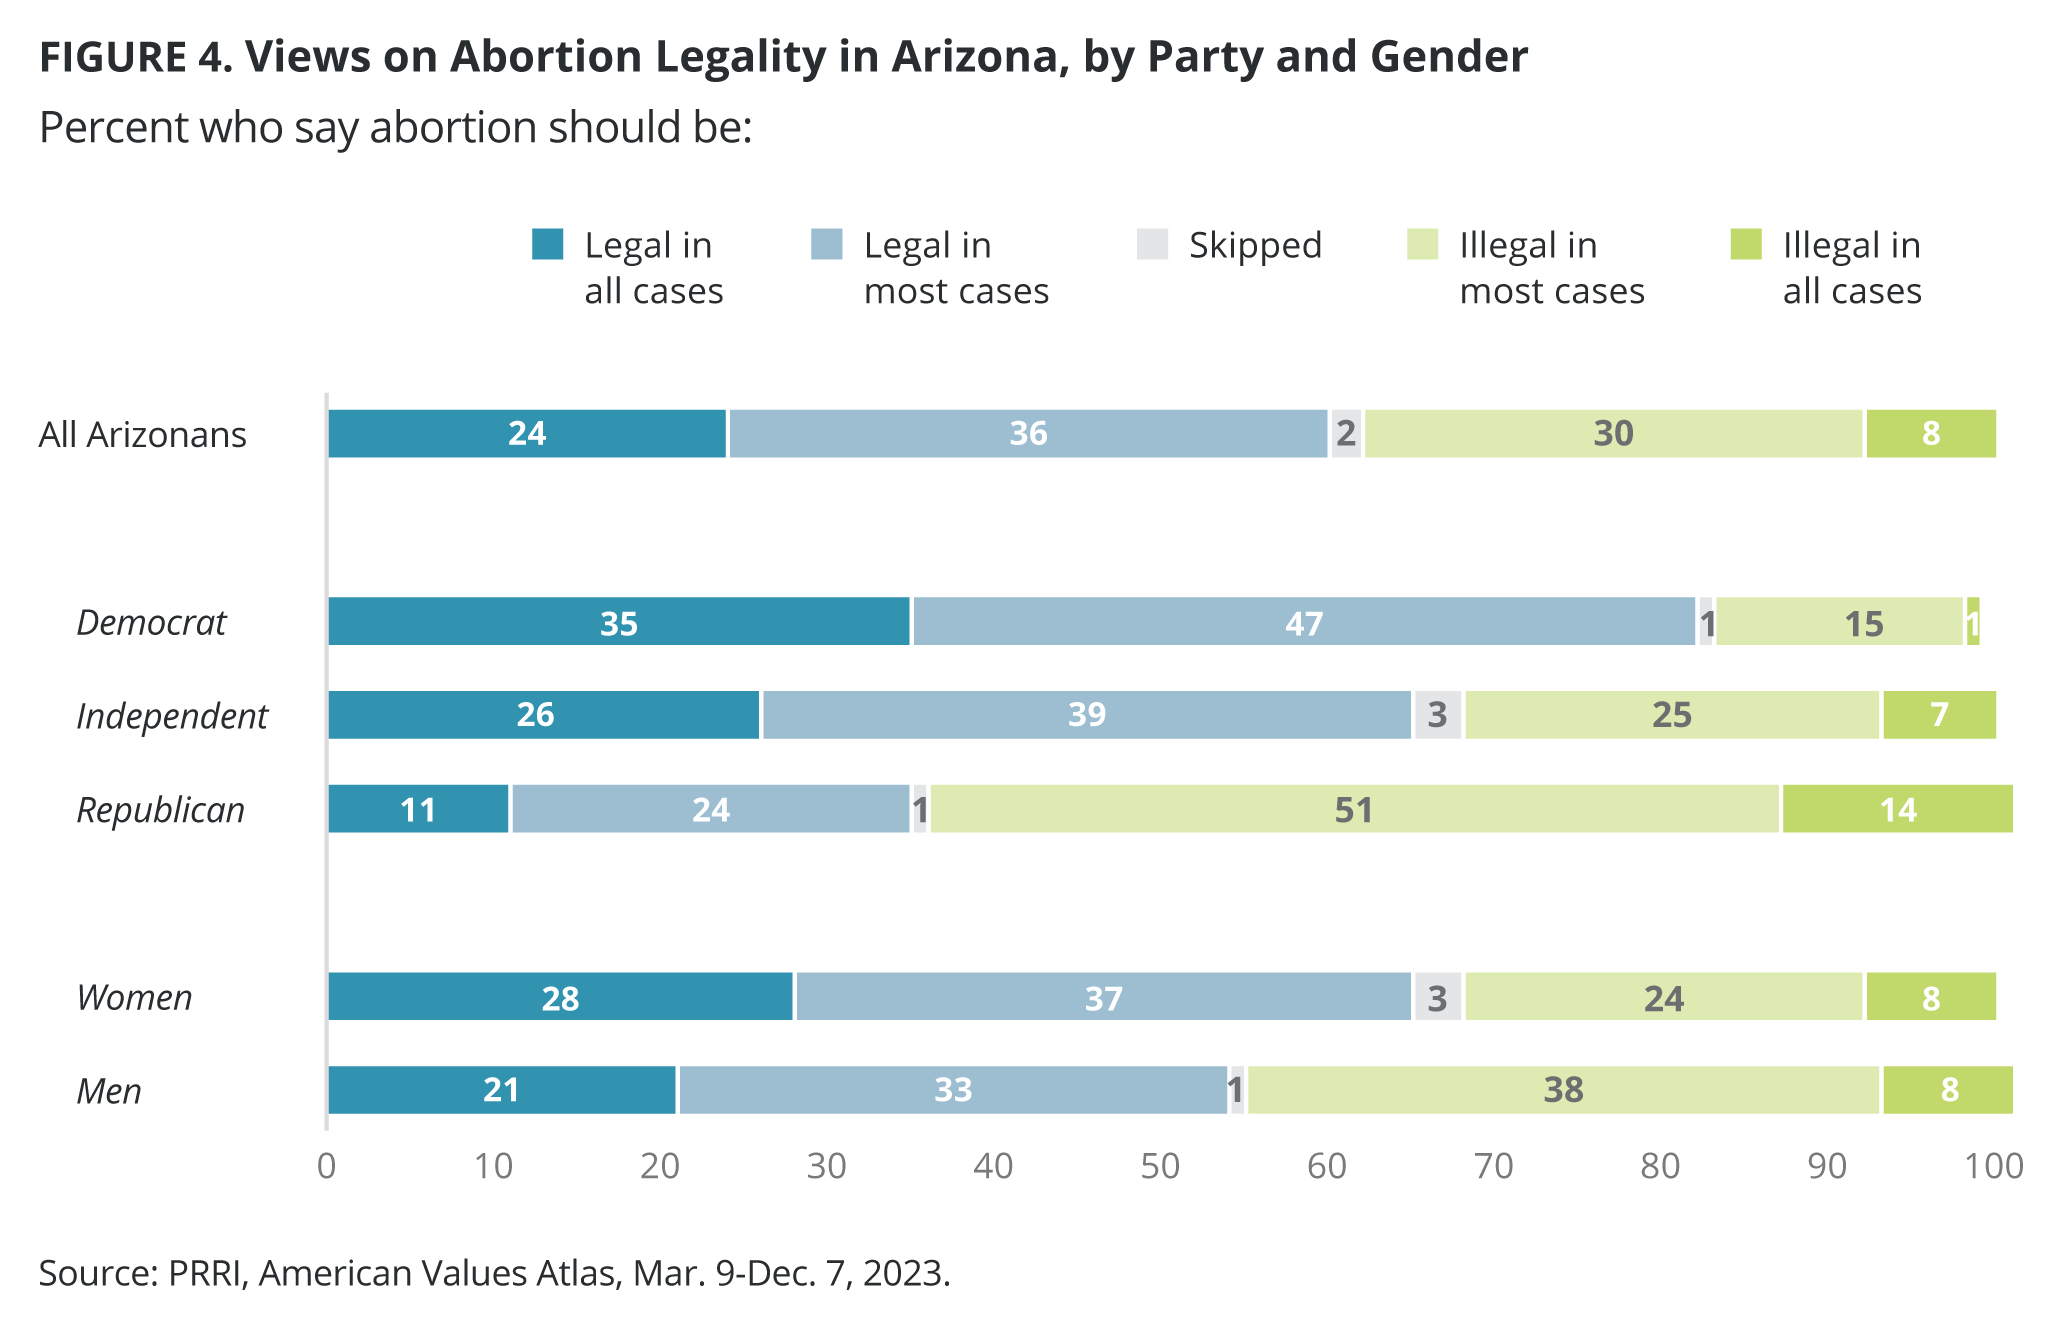
Arizona currently has stricter abortion laws than many other states, however, six in ten Arizonans (60%) say abortion should be legal in all or most cases, including nearly one in four (24%) who say it should be legal in all cases and more than one-third (36%) who say it should be legal in most cases. Nearly four in ten Arizonans (38%) believe abortion should be illegal, including three in ten (30%) who say it should be illegal in most cases and only 8% who say it should be illegal in all cases.
More than eight in ten Arizona Democrats (82%) say abortion should be legal in all or most cases, compared with around two-thirds of independents (65%) and around one-third of Arizona Republicans (35%). In Arizona, women are more likely than men to support abortion legality (65% vs. 54%, respectively).
Explore the 2024 battleground states in additional PRRI Spotlight Analyses:


