A Shifting Landscape: A Decade of Change in American Attitudes about Same-Sex Marriage and LGBT Issues
Executive Summary
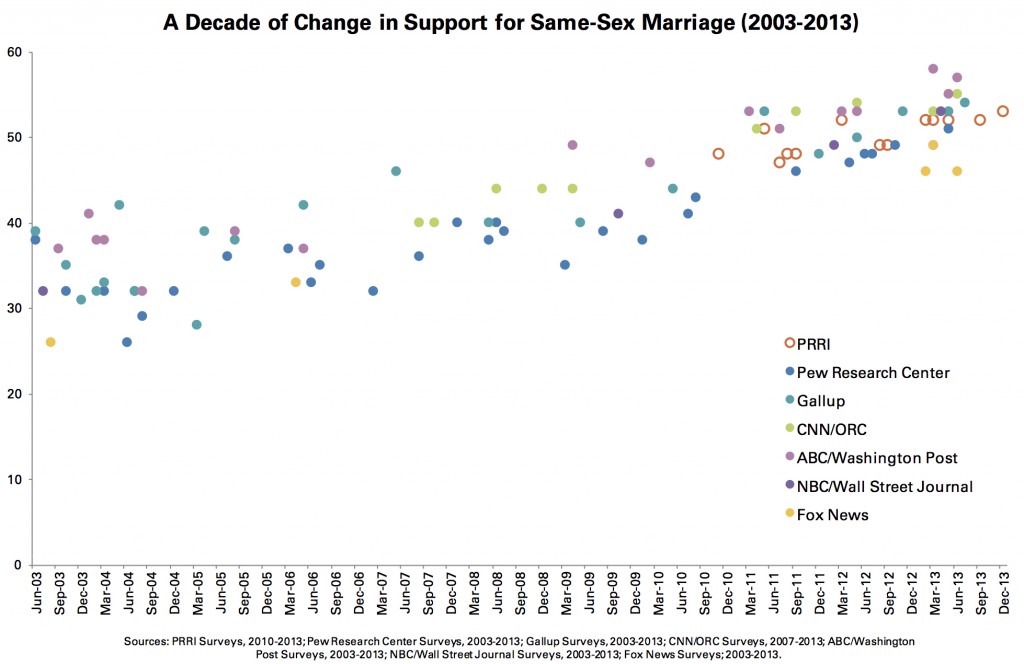
 Support for same-sex marriage jumped 21 percentage points from 2003, when Massachusetts became the first state to legalize same-sex marriage, to 2013. Currently, a majority (53%) of Americans favor allowing gay and lesbian couples to legally marry, compared to 41% who oppose. In 2003, less than one-third (32%) of Americans supported allowing gay and lesbian people to legally marry, compared to nearly 6-in-10 (59%) who opposed.
Today, roughly equal numbers of Americans say they strongly favor (22%) legalizing same-sex marriage as say they strongly oppose it (20%). By contrast, a decade earlier strong opponents (35%) outnumbered strong supporters (9%) by roughly a 4-to-1 ratio.
Today, majorities of Americans in the Northeast (60%), West (58%), and Midwest (51%) favor allowing gay and lesbians to legally marry, while Southerners are evenly divided (48% favor, 48% oppose).
Political divisions on the issue of same-sex marriage have widened over time. The gap in support for same-sex marriage between Democrats and Republicans has increased from 21 percentage points in 2003 to 30 points today. In 2003, roughly 4-in-10 Democrats (39%) and political independents (39%) favored same-sex marriage, compared to 18% of Republicans. Currently, nearly two-thirds (64%) of Democrats and nearly 6-in-10 (57%) independents support same-sex marriage, compared to only 34% of Republicans. More than 6-in-10 (62%) Republicans oppose same-sex marriage.
In 2003, all major religious groups opposed same-sex marriage, with the exception of the religiously unaffiliated. Today, there are major religious groups on both sides of the issue. Religiously unaffiliated Americans (73%), white mainline Protestants (62%), white Catholics (58%), and Hispanic Catholics (56%) all favor allowing gay and lesbian couples to marry. A majority (83%) of Jewish Americans also favor legalizing same-sex marriage. Hispanic Protestants are divided; 46% favor allowing gay and lesbian couples to legally marry and 49% oppose. By contrast, nearly 7-in-10 (69%) white evangelical Protestants and nearly 6-in-10 (59%) black Protestants oppose same-sex marriage. Only 27% of white evangelical Protestants and 35% of black Protestants support same-sex marriage.
Today, nearly 7-in-10 (69%) Millennials (ages 18 to 33) favor same-sex marriage, compared to 37% of Americans who are part of the Silent Generation (ages 68 and older). The generation gap today, or the difference in support for same-sex marriage between America’s youngest and oldest cohorts, is now 32 points, roughly as wide as it was in 2003.
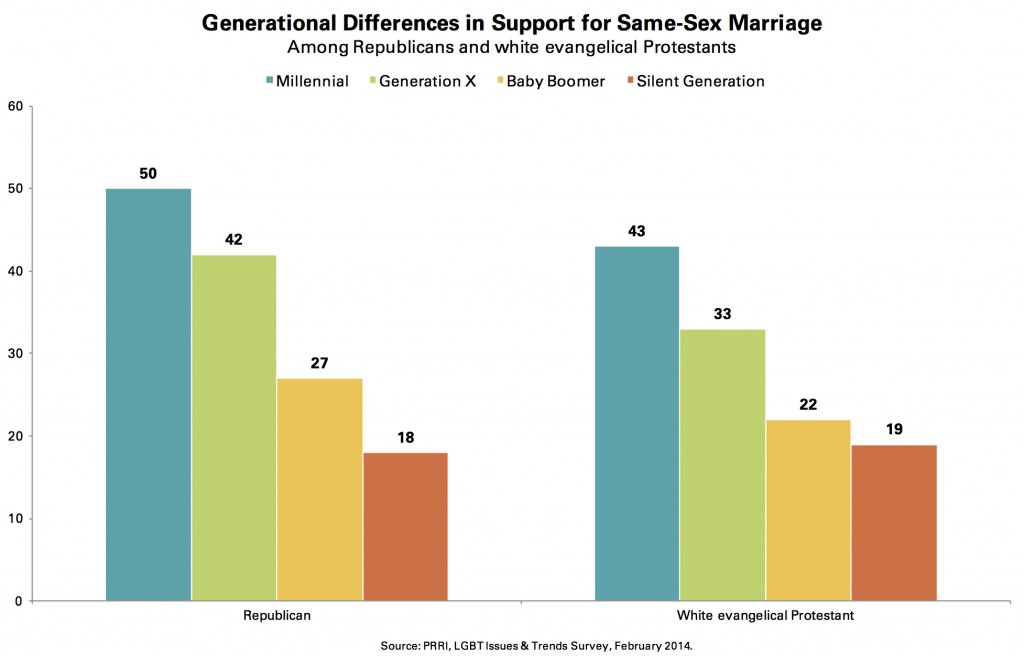
It is difficult to overstate the effect age has on support for same-sex marriage, which is evident even among groups that oppose same-sex marriage. Half (50%) of Millennial Republicans favor allowing gay and lesbian couples to marry, a view shared by only 18% of Republicans who are members of the Silent Generation. Nearly 6-in-10 (59%) black Millennials say gay and lesbian people should be allowed to legally marry, compared to only 39% of black Americans overall. White evangelical Protestant Millennials are more than twice as likely to favor same- sex marriage as the oldest generation of white evangelical Protestants (43% vs. 19%).
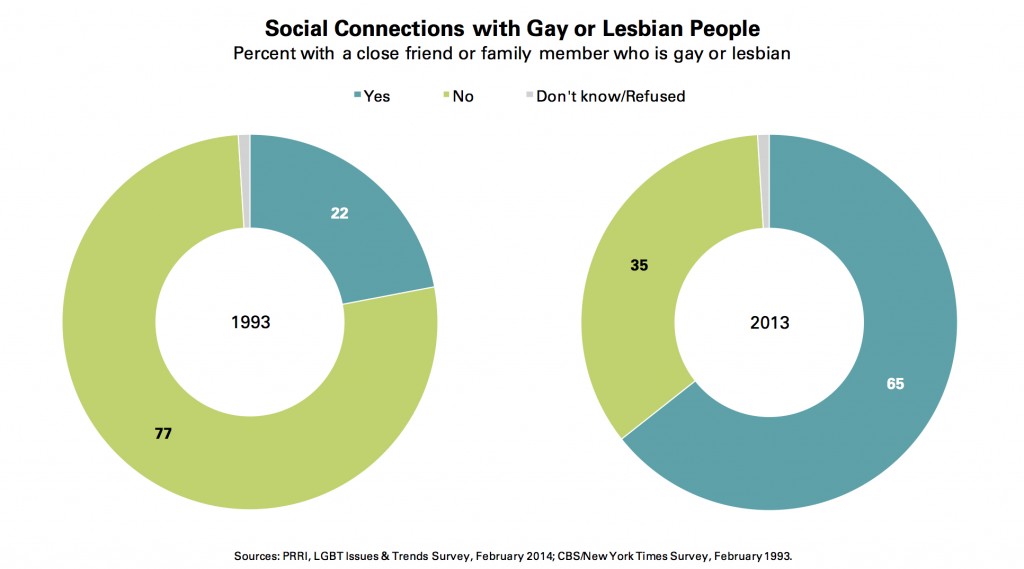
Nearly two-thirds (65%) of Americans report having a close friend or family member who is gay or lesbian, nearly three times the number (22%) who reported having such a relationship in 1993. Americans who have a close friend or family member who is gay or lesbian are 27 points more likely than those who do not to favor allowing gay and lesbian couples to legally marry (63% vs. 36%). This “family and friends” effect is present across all major demographic, religious and political groups.
A slim majority of Americans (52%) currently prefer same-sex marriage be decided by the states while more than 4-in-10 (43%) say the issue should be decided at the national level. Today, 6-in-10 (60%) opponents of same-sex marriage think the question of whether to legalize same-sex marriage should be decided by the states. By contrast, a majority (54%) of same-sex marriage supporters prefer the issue be decided at the national level. In 2006, however, the preferences of each group were reversed.
Even though most polls since 2012 have shown a majority of Americans favor allowing gay and lesbian couples to legally marry, only about one-third (34%) of the public believe that most Americans favor same-sex marriage. Nearly half (49%) of the public incorrectly believe that most Americans oppose same-sex marriage, and roughly 1-in-10 (9%) believe the country is divided on the issue.
Regular churchgoers (those who attend at least once or twice a month), particularly those who belong to religious groups that are supportive of same-sex marriage, are likely to overestimate opposition for same-sex marriage in their churches by 20 percentage points or more.
- About 6-in-10 (59%) white mainline Protestants believe their fellow congregants are mostly opposed to same-sex marriage. However, among white mainline Protestants who attend church regularly, only 36% oppose allowing gay and lesbian people to legally marry while a majority (57%) actually favor this policy.
- Roughly three-quarters (73%) of Catholics believe that most of their fellow congregants are opposed to same-sex marriage. However, Catholics who regularly attend church are in fact divided on the issue (50% favor, 45% oppose).
Millennials report a nearly 20-point gap between the views of their families and the views of their friends. Nearly half (49%) of Millennials say most of their family members oppose same-sex marriage, compared to 41% who say most of their family members support it. In contrast, only 30% of Millennials say most of their friends oppose same-sex marriage, while nearly twice as many (59%) say most of their friends favor same-sex marriage. Americans from the Silent Generation are equally likely to say that most of their friends (57%) and family members (56%) oppose same-sex marriage.
Americans strongly support laws that would protect gay and lesbian people from discrimination in the workplace. More than 7-in-10 (72%) Americans favor laws protecting gay and lesbian people from job discrimination, compared to less than one-quarter (23%) who oppose.
- Solid majorities of both political parties and every major religious group support workplace nondiscrimination laws for gay and lesbian people.
- Three-quarters (75%) of Americans incorrectly believe it is currently illegal under federal law to fire or refuse to hire someone because they are gay, lesbian, bisexual, or transgender. Only 15% of Americans correctly say that such discrimination is currently legal under federal law, while nearly 1-in-10 (9%) offer no opinion.
Roughly 6-in-10 (58%) Americans favor allowing gay and lesbian couples to adopt children. Support has increased substantially since 1999, when 38% of Americans favored allowing gays and lesbians to adopt children. The partisan divisions on attitudes toward adoption largely mirror the findings on support for same-sex marriage.
- Majorities of every generational cohort except the Silent Generation favor allowing gay and lesbian couples to adopt children. Seven-in-ten (70%) Millennials, 58% of Generation X, and 52% of Baby Boomers favor allowing gay and lesbian couples to adopt children. Among members of the Silent Generation, only 42% favor this policy while 49% are opposed.
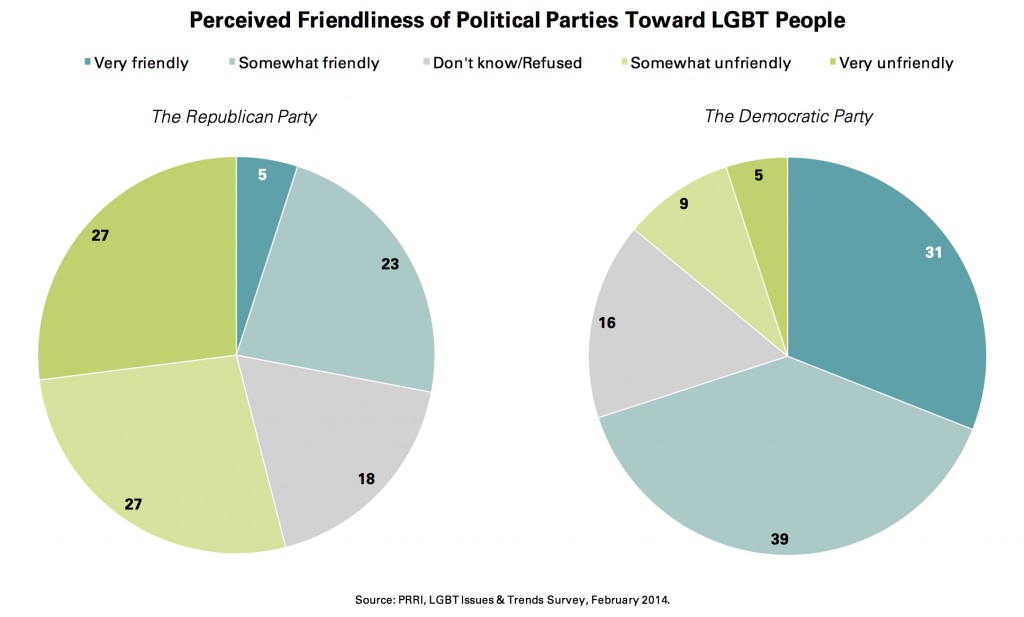
By a ratio of more than 2-to-1, the Democratic Party is perceived as being friendlier toward LGBT people than the Republican Party. Seven-in-ten (70%) Americans say the Democratic Party is friendly toward LGBT people, compared to 14% who say it is unfriendly. Sixteen percent say they don’t know or refused to provide an opinion. By contrast, fewer than 3-in-10 (28%) Americans say the Republican Party is friendly toward LGBT people, while a majority (54%) believe the Republican Party is unfriendly toward LGBT people; roughly 1-in-5 (18%) offer no opinion.
- LGBT Americans are as likely as Americans overall (70%) to say that the Democratic Party is friendly toward LGBT people, compared to 20% who say the party is unfriendly. Fifteen percent of LGBT Americans think the Republican Party is friendly toward LGBT people, compared to more than 7-in-10 (72%) who say the GOP is unfriendly toward LGBT people.
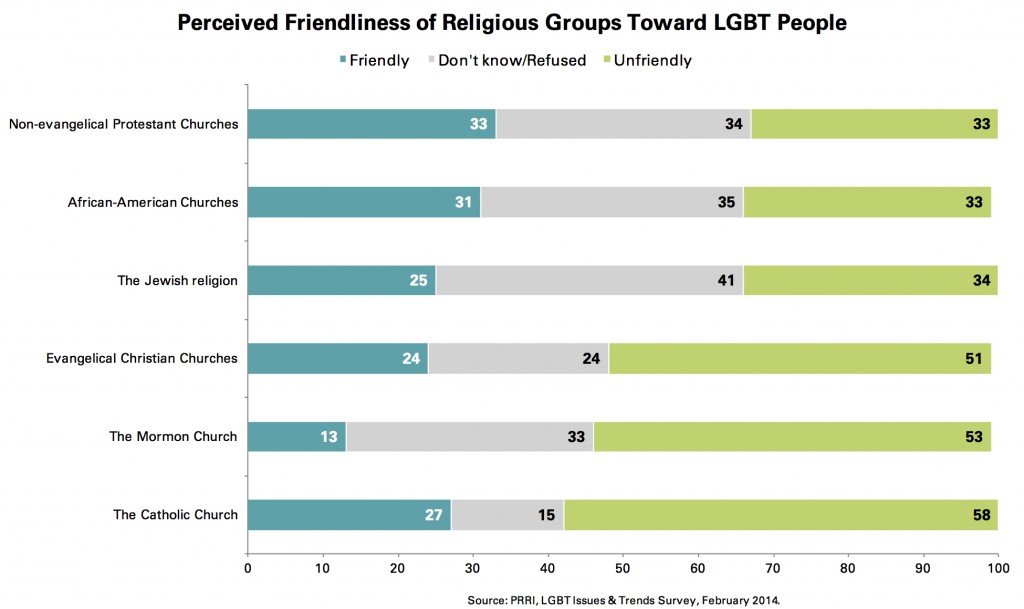
Majorities of Americans perceive three religious groups to be unfriendly to LGBT people: the Catholic Church (58%), the Mormon church (53%), and evangelical Christian churches (51%). Perceptions of non-evangelical Protestant churches, African-American churches and the Jewish religion are notably less negative.
- At least two-thirds of LGBT Americans perceive both the Catholic Church (73%) and evangelical Christian churches (67%) as being unfriendly toward LGBT people.
Nearly 6-in-10 (58%) Americans agree that religious groups are alienating young people by being too judgmental on gay and lesbian issues. Seven-in-ten (70%) Millennials believe that religious groups are alienating young adults by being too judgmental on gay and lesbian issues. Only among members of the Silent Generation do less than a majority (43%) believe religious groups are alienating young people by being too judgmental about gay and lesbian issues.
- Gay, lesbian, bisexual and transgender Americans are also far more likely than other Americans to report leaving their childhood religion. Like Americans overall, few LGBT Americans were raised outside a formal religious tradition (8% vs. 7%). However, nearly 4-in-10 (37%) LGBT Americans are now unaffiliated, compared to 21% of Americans. Overall, roughly 3-in-10 (31%) LGBT Americans left their childhood religion to become religiously unaffiliated.
The current survey, using self-identification, finds 5.1% of the adult population identifies as either gay, lesbian, bisexual or transgender. Notably, Americans overestimate the size of the LGBT population by a factor of 4 (20% median estimate). Only 14% of Americans accurately estimate the gay and lesbian population at 5% or less.
Today, majorities of Americans say that transgender Americans (71%), gay and lesbian people (68%), and people with HIV or AIDS (53%) face a lot of discrimination in the United States.
- Roughly two-thirds (66%) of Americans agree bullying of gay and lesbian teenagers is a major problem in schools today, while nearly one-quarter (23%) disagrees. The belief that bullying of gay and lesbian youth is a major problem in schools is broadly shared across partisan and religious lines.
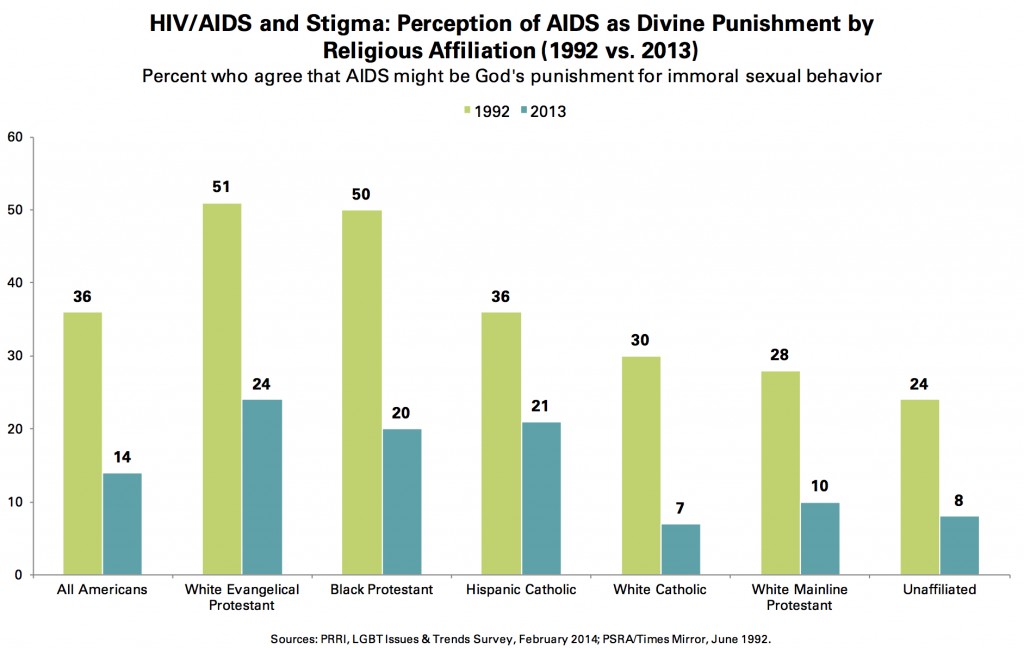
The percentage of Americans who believe AIDS might be God’s punishment for immoral sexual behavior has fallen dramatically over time. Fourteen percent of Americans agree with the idea that AIDS might be God’s punishment for immoral sexual behavior, while 81% disagree. In 1992, more than twice as many Americans (36%) agreed that AIDS might be God’s punishment for immoral sexual behavior while fewer than 6-in-10 (57%) disagreed.
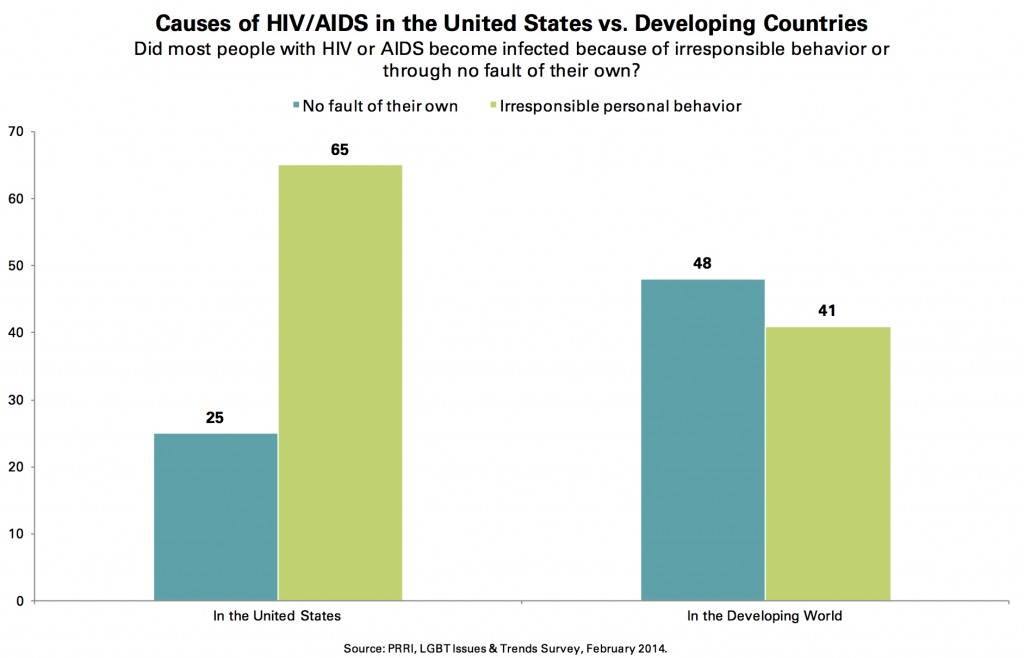
Americans are significantly more likely to say those who are living with HIV or AIDS in the United States became infected because of irresponsible behavior than to say the same about those living with HIV or AIDS in the developing world.
- Nearly two-thirds (65%) of Americans say that people with HIV or AIDS in the United States became infected because of irresponsible personal behavior, while just one-quarter (25%) say they became infected through no fault of their own.
- By contrast, only about 4-in-10 (41%) Americans believe that people who have contracted HIV in the developing world did so because of irresponsible behavior. Nearly half (48%) say they contracted the disease through no fault of their own.
I. The U.S. Social Context: Religion, Cultural Change, and Traditional Values
Shifting Religious Affiliation: 2003-2013
The American religious landscape is evolving rapidly. During the last decade, the proportion of religiously unaffiliated Americans has more than doubled—22% identify as unaffiliated today compared to 8% in 2003.(1) Other religious groups have witnessed modest but notable declines. During the last decade, the white Protestant population in the United States contracted significantly. White evangelical Protestants make up 19% of the adult population today, down from 24% in 2003, and white mainline Protestants, who represent 14% of the adult population today, made up 21% of Americans in 2003. While the proportion of Catholics in America has remained largely steady during the last decade, there has been a sea change in the ethnic makeup of the Catholic population. In 2003, Catholics were 68% white and 22 % Hispanic; among Catholics in 2013, the percentage of Hispanics has grown to 34%, while the percentage of whites has declined to 60%.
Evaluations of Changes in American Culture Since the 1950s
Americans are divided on whether American culture and way of life was better in the 1950s or is better today. Forty-four percent of Americans believe that American culture and life in the United States has changed for the better since the 1950s, while a nearly identical number (46%) say it has changed for the worse. Views about cultural changes since the 1950s divide Americans along a variety of important demographic dimensions: political, religious, racial, and generational.
Democrats are most likely to say American culture and way of life is better now than it was in the 1950s, with nearly 6-in-10 (59%) in agreement; independents (42%), Republicans (31%), and members of the Tea Party (22%) are significantly less likely to say the same. Republicans (62%) and Tea Party members (70%) on the other hand, are more likely to say American culture and way of life have changed for the worse since the 1950s than either independents (48%) or Democrats (32%).
No group of Americans is more convinced that American culture and way of life has changed for the worse than white evangelical Protestants. More than 7-in-10 (71%) white evangelical Protestants believe that the current cultural landscape is worse than it was in the 1950s. About half of white mainline Protestants (49%) and white Catholics (50%) also believe things were better in the 1950s, though a substantial minority of each group believes things have changed for the better (43% and 42% respectively). Nearly 6-in-10 (57%) black Protestants and roughly two-thirds (65%) of Hispanic Catholics and Jews (67%) say that American culture and way of life today represents an improvement from the 1950s.
Half of religiously unaffiliated Americans also believe the American way of life today is better than it was in the 1950s, although roughly 4-in-10 (39%) disagree. However, among self-identified atheists and agnostics—who represent 28% of the unaffiliated— nearly 6-in-10 (59%) say American culture and way of life today is better than it was in the 1950s.
White non-Hispanic Americans have a significantly different perspective from black non-Hispanic Americans and Hispanic Americans about American culture and life in the 1950s. A majority (52%) of white Americans believe that American culture has changed for the worse since the 1950s, a view shared by about one-third of black (33%) and Hispanic Americans (31%). Roughly 6-in-10 black Americans (57%) and Hispanic Americans (58%) say that American culture and way of life is better today than it was in the 1950s.
Judgments about the 1950s vary significantly by age. A majority of Millennials (ages 18 to 33) (52%) and nearly half of Generation X (ages 34 to 48) (49%) believe that American culture and way of life has improved since the 1950s, while only 41% of Baby Boomers (ages 49 to 67) and 29% of the Silent Generation (ages 68 and older) agree. A majority of Baby Boomers (52%) and the Silent Generation (61%) believe American culture and way of life has gotten worse since the mid-20th century mark.
What Makes America Great: Openness to Change vs. Protecting Tradition
A majority (54%) of Americans believe that what makes America great is that “it is open to change and new ways of doing things,” while roughly one-third (34%) believe that protecting traditional values and ways of doing things is what makes America great. Nearly 1-in-10 (9%) say either that both of these things or neither of these things is what makes America great.
Americans are sharply divided by generation in their views about the source of American greatness. Nearly two-thirds (66%) of Millennials believe that being open to change and new approaches is what makes the country great, a view shared by fewer members of Generation X (53%), Baby Boomers (50%), and members of the Silent Generation (45%).
Members of different political parties also hold different views about change and tradition. Seven-in-ten (70%) Democrats and a majority of independents (56%) believe that American greatness derives from being open to change and new ways of doing things, while only about one-third (34%) of Republicans and 28% of Tea Party members agree. A majority of Republicans (53%) and nearly 6-in-10 (58%) members of the Tea Party say that what makes America great is that it protects traditional values and ways of doing things.
White evangelical Protestants stand out from other religious groups in their belief that American greatness stems from protecting traditional values. A majority (54%) of white evangelical Protestants believe that protecting traditional values is what makes America great. By contrast, all other religious groups believe that American greatness comes from being open to change, including 52% of Catholics, 56% of white mainline Protestants, 65% of the religiously unaffiliated, 66% of black Protestants, and 83% of Jewish Americans.
II. The Evolution of Opinion on Same-sex Marriage (2003–2013)
Few public policy issues have experienced as dramatic a shift in public opinion as same-sex marriage. Currently, a majority (53%) of Americans favor allowing gay and lesbian couples to legally marry while 41% oppose. When Massachusetts became the first state to legalize same-sex marriage in 2003, fewer than one-third (32%) of Americans supported allowing gay and lesbian people to legally marry. Nearly 6-in-10 (59%) Americans were opposed, including 35% who were strongly opposed.
During the next several years, public opinion registered only a modest increase in support for same-sex marriage. By 2008, most surveys found about 4-in-10 Americans favored allowing gay and lesbian people to legally marry, while a majority were opposed. Views shifted more quickly during the following three years. By 2011, four different surveys, including one conducted by PRRI, recorded majority support for same-sex marriage for the first time ever.(2)
A Decade of Change on Same-sex Marriage
In addition to the dramatic increase in overall support for same-sex marriage, the intensity of support and opposition has also undergone considerable change during the last decade. Today, roughly equal numbers of Americans say they strongly favor (22%) same-sex marriage as say they strongly oppose (20%) it. By contrast, a decade earlier strong opponents (35%) outnumbered strong supporters (9%) by roughly a 4-to-1 ratio.
Although support for same-sex marriage has increased by 21 percentage points among the general public during the last decade (from 32% to 53%), increases have not been uniform across all subgroups.
Geographic Divides
In 2003, support for same-sex marriage fell short of a majority in all regions of the country. Fewer than half of Americans living in the Northeast (42%), West (36%), Midwest (33%), and South (22%) favored allowing gay and lesbian couples to legally marry.
Today, there are substantial geographic divisions in views about same-sex marriage. Roughly 6-in-10 Americans who live in the Northeast (60%) and West (58%) favor allowing gay and lesbians to legally marry. A slim majority (51%) of Americans who live in the Midwest also favor, while 43% oppose. Southerners are evenly divided, with 48% who favor allowing gay and lesbian couples to marry and 48% who oppose.
These regional differences are also apparent among individual states. Roughly 6-in-10 Americans who live in California (59%), Pennsylvania (61%), and New York (60%) favor allowing gay and lesbian couples to marry. A smaller majority of Americans who live in Illinois (52%), Ohio (53%) and Virginia (52%) also favor same-sex marriage. Fewer than half of North Carolinians (47%) and Texans (48%) favor same-sex marriage. Florida stands out as an exception among Southern states with nearly 6-in-10 (57%) Floridians expressing support for same-sex marriage. See Appendix 2 for breakdowns of selected states across key issues.
Political Divides
Political differences on the issue of same-sex marriage have widened over time. The gap in support for same-sex marriage between Democrats and Republicans has increased from 21 percentage points in 2003 to 30 points today. In 2003, roughly 4-in-10 Democrats (39%) and independents (39%) favored same-sex marriage, compared to 18% of Republicans. Currently, nearly two-thirds (64%) of Democrats and nearly 6-in-10 (57%) independents support same-sex marriage, compared to only 34% of Republicans. More than 6-in-10 (62%) Republicans oppose same-sex marriage.
There is also a notable division between the 36% of Republicans who identify as white evangelical Protestant and the majority who do not. White evangelical Protestant Republicans are less than half as likely as non-evangelical Republicans to support same-sex marriage (18% vs. 42%). Conversely, about 8-in-10 (79%) white evangelical Protestant Republicans oppose same-sex marriage, compared to 52% of non-evangelical Republicans.
Religious Divides
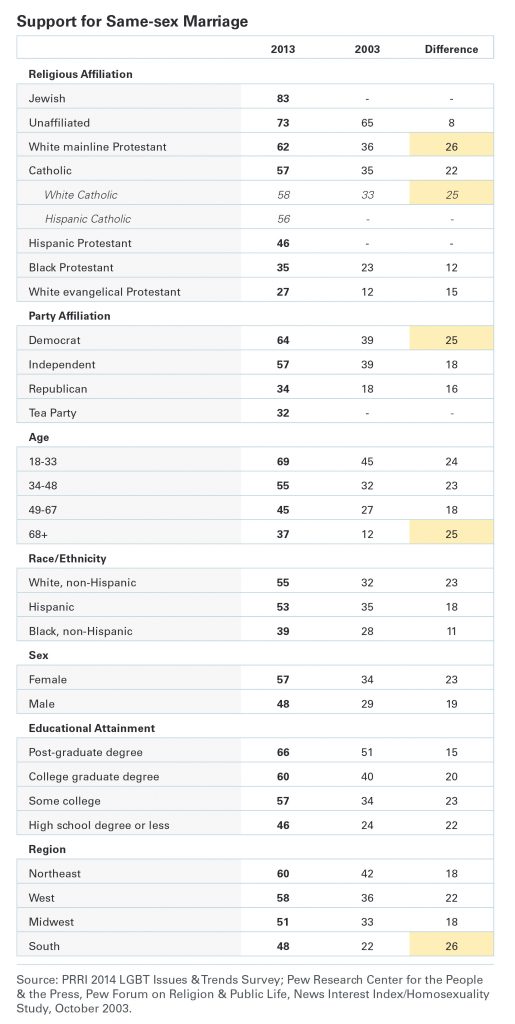
In 2003, the issue of same-sex marriage divided Americans between the religious and the non-religious. While nearly two-thirds (65%) of religiously unaffiliated Americans favored allowing gay and lesbian people to legally marry, all major religious groups were strongly opposed. In 2003, fewer than 4-in-10 white mainline Protestants (36%), Catholics (35%), black Protestants (23%), and white evangelical Protestants (12%) supported same-sex marriage.
Racial and Ethnic Divides
New fault lines have emerged among racial and ethnic groups on the issue of same-sex marriage that were not evident ten years ago. In 2003, fewer than 4-in-10 white (32%), black (28%), and Hispanic Americans (3) (35%) supported same-sex marriage. Solid majorities of each group were opposed. Today, there is a considerable racial divide on the issue. A majority of white (55%) and Hispanic Americans (53%) favor allowing gay and lesbian couples to legally marry, compared to fewer than 4-in-10 (39%) black Americans. Notably, though a majority of Hispanics overall favor same-sex marriage, there are stark religious divisions among this group. A majority (56%) of Hispanic Catholics favor same-sex marriage, but Hispanic Protestants are more divided (46% favor, 49% oppose).
Gender Divides
The gender divide has also increased during the last 10 years. In 2003, there was a modest 5-point gender gap, with 34% of women and 29% of men expressing support for same-sex marriage. Roughly 6-in-10 men and women were opposed. The gender gap has nearly doubled today to 9 points, with 57% of women now expressing support for same-sex marriage compared to 48% of men.
LGBT Americans
Not surprisingly, LGBT Americans overwhelmingly support same-sex marriage. Close to 9-in-10 (86%) LGBT people support allowing gay and lesbian couples to legally marry, while 11% are opposed.
Generational Divides
Generational divisions have largely remained constant since 2003, with America’s youngest adults continuing to be among the strongest supporters of same-sex marriage. Fewer than half (45%) of the youngest group of adults (ages 18 to 33) favored allowing gay and lesbian people to marry in 2003, compared to 12% of the oldest group of adults (ages 68 and older). This difference represented a 33-point generation gap on the issue in 2003. Today, nearly 7-in- 10 (69%) Millennials (ages 18 to 33) favor same-sex marriage, compared to 37% of Americans who are part of the Silent Generation (ages 68 and older). Notably, support among both the youngest and the oldest groups of Americans has increased by nearly equal amounts during the last decade—24 percentage points among Millennials and 25 percentage points among the Silent Generation. The generation gap today, or the difference in support for same-sex marriage between America’s youngest and oldest cohorts, is now 32 points, roughly as wide as it was in 2003.
Generation Gaps Among Groups Opposed to Same-sex Marriage
It is difficult to overstate the effect age has on support for same-sex marriage. Even among groups that strongly oppose same-sex marriage, there are significant generational gaps. White evangelical Protestant Millennials are more than twice as likely to favor same-sex marriage as the oldest generation of white evangelical Protestants (43% vs. 19%). Although a majority (54%) of white evangelical Millennials oppose same-sex marriage, opposition remains considerably lower than among white evangelical Protestants who are a part of the Silent Generation (79%).
The generation gap among Republicans is even wider. Half (50%) of Millennial Republicans favor allowing gay and lesbian couples to marry, a view shared by only 18% of Republicans who are members of the Silent Generation. Conversely, fewer than half (45%) of Millennial Republicans report that they are opposed to same-sex marriage, compared to 75% of Republicans who are a part of the Silent Generation.
Black Americans are another group in which generational divisions are quite stark. While only 39% of black Americans overall favor allowing gay and lesbian people to legally marry, nearly 6-in-10 (59%) black Millennials say gay and lesbian people should be allowed to legally marry.
Southerners on the whole are evenly divided on the issue of same-sex marriage (48% favor, 48% oppose), but there is also a significant generation gap among residents of this region. Nearly two-thirds (65%) of Millennial Southerners favor allowing gay and lesbian people to marry, compared to 28% of Southerners who are part of the Silent Generation.
A similar pattern exists among rural Americans. Overall, 44% of rural Americans favor allowing gay and lesbian couples to marry, compared to 52% who oppose. But here, too, age plays a significant role. Among rural Millennials, 62% favor allowing gay and lesbian couples to legally marry, compared to 33% of rural Americans who are a part of the Silent Generation.
III. The Politics of Same-sex Marriage
Who Should Decide? States vs. the Federal Government
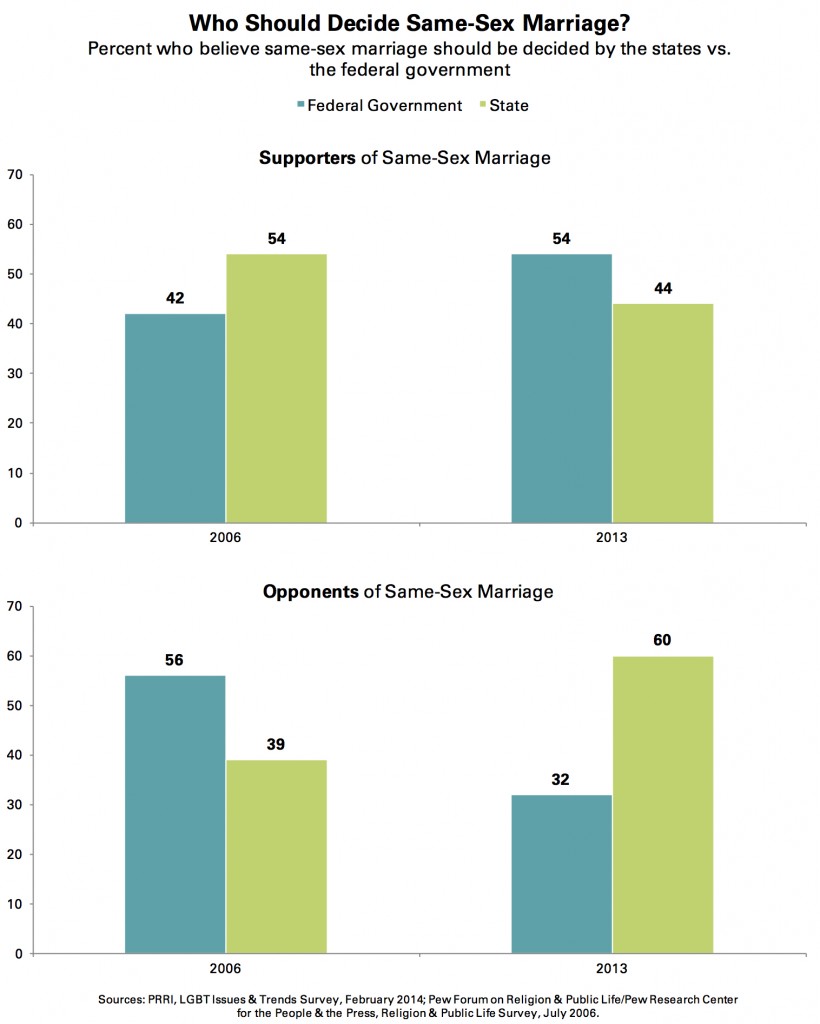
Americans of different political backgrounds hold varying views about who should decide the issue. A majority (53%) of Democrats prefer a federal decision on the issue of same-sex marriage, while more than 4-in-10 (42%) believe the issue should be left up to the states. In contrast, a majority (55%) of independents, more than 6-in-10 (63%) Republicans, and nearly two-thirds (66%) of members of the Tea Party say the issue of same-sex marriage should be decided by the states.
There is some evidence, however, that preferences about federal versus state solutions are more pragmatic than principled. As support for same-sex marriage has risen, supporters and opponents of same-sex marriage have reversed their preferences for federal versus state solutions. Today, 6-in-10 (60%) opponents of same-sex marriage think the question of whether to legalize same-sex marriage should be decided by the states, while about one-third (32%) think it should be decided at the national level. By contrast, a majority (54%) of same-sex marriage supporters prefer the issue be decided at the national level rather than be left up to the states (44%). However, in 2006 the preferences of each group were reversed. That year, most same-sex marriage supporters preferred allowing the states to make the decision about whether it was legal (54%). Meanwhile, a majority (56%) of those who opposed same-sex marriage preferred a national decision. This reversal suggests that those who believe public opinion is on their side may prefer federal solutions, while those who believe they are in the minority may prefer more localized solutions that allow for the cultural context of states to prevail.
Perceptions of Political Parties’ Friendliness Toward LGBT People
In May 2012, President Barack Obama announced his support for same-sex marriage, an issue later addressed by both the Democratic National Convention and the Republican National Convention.(4)
By a ratio of more than 2-to-1, the Democratic Party is perceived as being friendlier toward LGBT people than the Republican Party. Seven-in-ten (70%) Americans say the Democratic Party is friendly toward LGBT people, compared to 14% who say it is unfriendly. Sixteen percent say they don’t know or refused to provide an opinion. By contrast, fewer than 3-in-10 (28%) Americans say the Republican Party is friendly toward LGBT people, while a majority (54%) believe the Republican Party is unfriendly toward LGBT people; roughly 1-in-5 (18%) offer no opinion.
There are significant differences in the perceptions of self-identified Republicans, Democrats, and independents about how friendly or unfriendly the major political parties are toward LGBT people.
Perceptions of the Democratic Party do not differ across political groups. Very few Republicans (12%), Democrats (12%) or independents (16%) believe the Democratic Party is unfriendly toward LGBT people. Most Americans say the Democratic Party is friendly toward LGBT people, including 76% of Republicans, 77% of Democrats and 67% of independents.
There are more substantial political differences in views of the Republican Party’s stance toward gay, lesbian, bisexual and transgender people. More than 7-in-10 (70%) Democrats and 53% of independents believe the Republican Party is unfriendly to LGBT people. In contrast, Republicans are divided in their perceptions of their own party: 45% think the GOP is friendly toward LGBT people, while 41% think the party is unfriendly. Americans who are part of the Tea Party movement are also divided in their perceptions, though they are more likely to say the GOP is friendly (46%) than unfriendly (40%).
The opinions of Americans who identify as gay, lesbian, bisexual, or transgender generally mirror Americans overall in their perceptions of the Democratic Party, but they are significantly more likely than Americans overall to say the Republican Party is unfriendly to LGBT people. LGBT Americans are as likely as Americans overall (70%) to say that the Democratic Party is friendly toward LGBT people, compared to 20% who say the party is unfriendly. Only 15% of LGBT Americans think the Republican Party is friendly toward LGBT people, compared to more than 7-in-10 (72%) who say the GOP is unfriendly toward LGBT people.
Salience of Same-sex Marriage
Same-sex marriage ranks lower than most issues in terms of personal importance. Overall, nearly half of Americans say same-sex marriage is either a critical issue to them personally (24%) or one among many important issues (25%). Nearly half (48%) of Americans say the issue of same-sex marriage is not that important to them personally. Same-sex marriage ranks below jobs and unemployment (62%), health care (57%), immigration (34%), HIV and AIDS (33%), and abortion (31%) as a critical issue to Americans.
Opponents of same-sex marriage are more likely than supporters to say the issue is of critical importance to them personally. More than 6-in-10 same-sex marriage opponents consider the issue of same-sex marriage to be either a critical issue to them personally (38%) or one among many important issues (23%); more than one-third (36%) say the issue is not important to them personally. By contrast, more than 4-in-10 (43%) same-sex marriage supporters say the issue is either a critical issue (14%) or one among many important issues (29%) to them personally; a majority (54%) say the issue is not that important to them.
Fewer than 3-in-10 Republicans (28%) and Democrats (26%) consider same-sex marriage to be a critical issue to them personally, while 1-in-5 (20%) independents say the same. Democrats (30%) are more likely than Republicans (23%) and independents (24%) to say that it is one important issue among many. A majority of independents (53%), nearly half (47%) of Republicans, and about 4-in-10 Democrats (41%) say that same-sex marriage is not that important to them personally.
The salience of same-sex marriage does not differ between states where same-sex marriage is legal and those where it is not. About 1-in-5 (22%) Americans living in states where same-sex marriage is legal and one-quarter (25%) of Americans living in states where same-sex marriages are not recognized say that same-sex marriage is a critical issue to them personally.
Finally, Americans who identify as gay, lesbian, bisexual or transgender are only slightly more likely than Americans overall to say that same-sex marriage is a critical issue to them personally. A majority of LGBT Americans consider same-sex marriage to be either a critical issue (31%) or one among many important issues (25%) to them personally; 42% say that same-sex marriage is not that important to them personally.
IV. Same-sex Marriage and Religion
Conflict Between Religious Beliefs & Same-sex Marriage
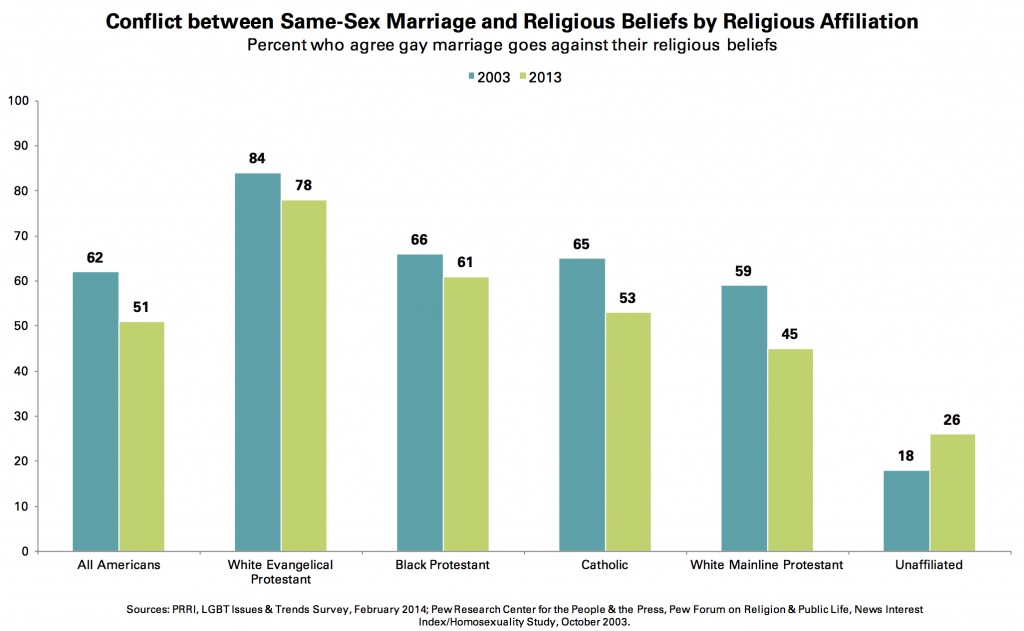
Today, a slim majority (51%) of Americans agree that same-sex marriage goes against their religious beliefs, but nearly as many (45%) disagree. The percentage of Americans who believe that same-sex marriage violates their religious beliefs has fallen by 11 points during the past decade. In 2003, more than 6-in-10 (62%) Americans reported that same-sex marriage was inconsistent with their religious beliefs.(5)
There are major differences in how Americans of different religious backgrounds see the relationship between same-sex marriage and their religious beliefs. Nearly 8-in-10 (78%) white evangelical Protestants agree that same-sex marriage goes against their religious beliefs, including nearly two-thirds (64%) who completely agree. More than 6-in-10 (61%) black Protestants and a majority (56%) of Hispanic Protestants also believe same-sex marriage violates their religious beliefs. A majority (53%) of Catholics overall also perceive conflict between the issue and their faith, however there are substantial ethnic divisions. Nearly 6-in-10 (58%) white Catholics report a conflict between their religious beliefs and same-sex marriage, compared to less than half (45%) of Hispanic Catholics. Less than half (45%) of white mainline Protestants say their religious beliefs are at odds with the issue of same-sex marriage, while half (50%) disagree. Only 17% of Jewish Americans and 26% of the religiously unaffiliated say same-sex marriage goes against their religious beliefs.
Are Religious Groups Alienating Young Adults Over LGBT Issues?
Most Americans agree that religious groups are alienating young people by being too judgmental about gay and lesbian issues. Nearly 6-in-10 (58%) Americans agree that religious groups are alienating young people, while roughly one-third (35%) disagree. However, there is considerable disagreement between older and younger Americans on this question as well as some differences of opinion among America’s religious communities.
Millennials stand out in their belief that religious groups are alienating young people. Seven-in-ten (70%) Millennials believe that religious groups are alienating young adults by being too judgmental about gay and lesbian issues. Nearly 6-in-10 (58%) members of Generation X also agree, along with 53% of Baby Boomers. Only among members of the Silent Generation do less than a majority (43%) believe that religious groups are alienating young people, while nearly identical numbers (44%) disagree. Thirteen percent of America’s oldest generation report being unsure.
Strong majorities of Jewish Americans (79%) and religiously unaffiliated Americans (74%) agree that religious groups are alienating young people by being too judgmental about gay and lesbian issues. Roughly 6-in-10 white mainline Protestants (61%) and black Protestants (58%) also agree that the stances religious organizations are taking on gay and lesbian issues are turning off young people. A majority of Catholics overall (55%) also agree, but there are significant differences of opinion between white Catholics (62%) and Hispanic Catholics (42%). The only religious groups among which less than a majority agrees that religious groups are alienating young people by being too judgmental on gay and lesbian issues are Hispanic Protestants (48% agree, 44% disagree) and white evangelical Protestants (41% agree, 51% disagree).
There are significant generational divisions among some religious groups regarding the effect church stances on gay and lesbian issues have on young people. A majority (55%) of white evangelical Protestant Millennials believe religious groups are turning off young people because they are being too judgmental about gay and lesbian issues. Only one-third (33%) of white evangelical Protestants who are members of the Silent Generation agree; a majority (56%) disagree. A smaller generational divide is evident among Catholics, with nearly 6-in- 10 (59%) Catholic Millennials reporting that religious organizations are alienating young people compared to less than half (45%) of Catholics who are part of the Silent Generation.
Reasons for Leaving Religion
Nearly 1-in-5 (17%) American adults report being raised in a religious tradition but are now religiously unaffiliated. Although Americans give a range of reasons for disaffiliating from their childhood faith,(6) previous research has found that negative religious teachings on gay and lesbian relationships—that they are sinful or immoral—are one of the factors in more Americans’ decision to become religiously unaffiliated.(7)
Among Americans who left their childhood religion and are now religiously unaffiliated, about one-quarter say negative teachings about or treatment of gay and lesbian people was a somewhat important (14%) or very important (10%) factor in their decision to disaffiliate. More than 7-in-10 Americans who have disaffiliated from their childhood religion report that was not too important (17%) or not at all important as a factor (54%).
Millennials who disaffiliated are much more likely than older Americans to report that negative teachings about homosexuality were an important factor in their decision. Among Millennials who no longer identify with their childhood religion, nearly one-third say that negative teachings about, or treatment of, gay and lesbian people was either a somewhat important (17%) or very important (14%) factor in their disaffiliation from religion. Nearly two-thirds of Millennials who disaffiliated say that negative religious teachings about gay and lesbian people were either not too important (21%) or not at all important (44%) a factor in their decision. In contrast, fewer than 1-in-5 Baby Boomers (19%) and Silent Generation Americans (17%) who disaffiliated report that this was a somewhat or very important reason for their leaving.
Notably, former Catholics are not any more likely than former Protestants to say that negative teachings about gay and lesbian people were an important reason they left the church (28% vs. 23%).
Perceptions of Religious Groups’ Friendliness Toward LGBT People
There are substantial differences in Americans’ perceptions of various religious groups’ friendliness toward lesbian, gay, bisexual, and transgender (LGBT) people. Notably, a significant number of Americans report being unable to offer an opinion one way or the other.
Majorities of Americans perceive three religious groups to be unfriendly to LGBT people: the Catholic Church, the Mormon church, and evangelical Christian churches. Compared to other major religious groups, the Catholic Church is perceived to be the group most unfriendly to LGBT people. Nearly 6-in-10 (58%) Americans believe the Catholic Church is unfriendly to LGBT people, more than twice the number (27%) who believe the Catholic Church is friendly. Fifteen percent of the public report having no opinion or being unsure about the Catholic Church’s friendliness to LGBT people. A majority (53%) of Americans also believe the Mormon Church is unfriendly to LGBT people, compared to only 13% who see it as being friendly. Notably, one-third (33%) offer no opinion or report being unsure about the Mormon Church’s friendliness toward LGBT people. Similarly, a majority (51%) of Americans perceive evangelical Christian churches to be unfriendly toward LGBT Americans, more than twice the number (24%) who see them as being friendly. Roughly one-quarter (24%) offer no opinion or are unsure about evangelical Christian churches’ friendliness toward LGBT people.
Perceptions of non-evangelical Protestant churches, African-American churches and the Jewish religion are notably less negative. One-third (33%) of Americans believe non-evangelical Protestant churches are unfriendly, equal to the number who believe they are friendly (33%) or offer no opinion (34%). African-American churches are viewed similarly, with roughly equal numbers reporting they are unfriendly (33%), friendly (31%), or offering no opinion (35%). Probably reflecting lower levels of personal experience with Jewish Americans and synagogues, more than 4-in-10 (41%) of Americans offer no opinion about whether the Jewish religion was friendly to LGBT people. Those who register an opinion are more likely to perceive the Jewish religion as being unfriendly than friendly to LGBT people (34% vs. 25%).
Not surprisingly, members of religious groups are much more likely than Americans overall to say their own church or religious tradition is friendly toward LGBT people. Nearly 4-in- 10 (38%) Catholics say the Catholic Church is friendly toward gay and lesbian people compared to 27% of Americans overall. Notably, however, Catholics (55%) are roughly as likely as Americans overall (58%) to say the Catholic Church is unfriendly to LGBT people. White evangelical Protestants are also more likely than Americans overall to perceive evangelical Christian churches as friendly to LGBT people (39% vs. 24%). Only about 4-in-10 (41%) white evangelical Protestants say their churches are unfriendly to LGBT people, 10 points lower than the perception among the general population. Black Protestants see AfricanAmerican churches as being much more friendly to LGBT people than do Americans overall. A majority (53%) of black Protestants believe their churches are friendly toward LGBT people, a view shared by fewer than one-third (31%) of the general public. Nearly 4-in-10 (37%) black Protestants say their churches are unfriendly to LGBT persons. White mainline Protestants judge non-evangelical Protestant churches as being about as friendly as Americans overall (37% vs. 33%), while 36% say they are unfriendly.
More than two-thirds of lesbian, gay, bisexual, and transgender Americans perceive both the Catholic Church (73%) and evangelical Christian churches (67%) as being unfriendly toward LGBT people.
V. The Power of Social Contexts
The Effect of Having a Close Friend or Family Member who is Gay or Lesbian
Nearly two-thirds (65%) of Americans report having a close friend or family member who is gay or lesbian, nearly three times the number (22%) who reported having such a relationship in 1993.(8) Additionally, roughly 1-in-10 (9%) Americans report having a close friend or family member who is transgender. Overall, majorities of Americans from nearly all demographic, religious and political groups report having a close friend or family member who is gay or lesbian.
Millennials (71%) are more likely than members of the Silent Generation (46%) to say they have a close friend or family member who is gay or lesbian. Likewise, women (70%) are more likely than men (59%) to have a close friend or family member who is gay or lesbian.
There are only modest differences in the levels of social connections to gay and lesbian people between religious groups. Seven-in-ten Jewish Americans (70%) and religiously unaffiliated Americans (70%) and roughly two-thirds of black Protestants (67%), white Catholics (66%), Hispanic Protestants (65%), white mainline Protestants (64%), and Hispanic Catholics (63%) say they have a close friend or family member who is gay or lesbian. White evangelical Protestants are only slightly less likely than other religious groups to say they have a close friend or family member who is gay or lesbian (58%).
Previous research has demonstrated that having a close friend or family member who is gay or lesbian is strongly associated with support for same-sex marriage.(9) Americans who have a close friend or family member who is gay or lesbian are 27 points more likely than those who do not to favor allowing gay and lesbian couples to legally marry (63% vs. 36%). This “family and friends” effect is present across all major demographic, religious and political groups.
For example, Republicans who have a close friend or family member who is gay or lesbian more than twice as likely as Republicans who do not to support same-sex marriage (43% vs. 21%). Likewise, Democrats who have a close friend or family member who is gay or lesbian are nearly 30 percentage points more likely than Democrats who do not to support same-sex marriage (73% vs. 44%).
Social Networks and Views on Same-sex Marriage
Perceptions of the General Public’s Views on Same-sex Marriage
Public knowledge about support for same-sex marriage lags significantly behind the reality, perhaps because of how rapidly opinion has changed on this issue in recent years. Even though polls now consistently show a majority of Americans favor allowing gay and lesbian couples to legally marry (currently, 53% favor, 41% oppose), only about one-third (34%) of the public report that most Americans favor same-sex marriage. Nearly half (49%) of the public believe that most Americans oppose same-sex marriage, and roughly 1-in-10 (9%) believe the country is divided on the issue.
Opponents and supporters of same-sex marriage are each more likely to believe that the country is on their side, but opponents of same-sex marriage are significantly more likely to misperceive public opinion than supporters. Nearly half (46%) of same-sex marriage supporters believe the nation as a whole also favors allowing gay and lesbian people to legally marry, but notably, nearly as many (40%) incorrectly believe their position is in the minority. Eight percent of same-sex marriage supporters believe the nation is divided on the issue. By contrast, those who oppose same-sex marriage believe the country is on their side. By a ratio of roughly 3-to-1 (62% vs. 21%), opponents of same-sex marriage are more likely to say that Americans overall oppose rather than support same-sex marriage. Nearly 1-in-5 Americans who oppose same-sex marriage report that the country is divided on the issue (8%) or that they do not know (9%).
There are also significant partisan differences. Democrats are more likely than Republicans to have an accurate perception of public opinion on same-sex marriage. Democrats are evenly divided between those who believe that most Americans support same-sex marriage (42%) and those who believe that most Americans oppose (43%). Nearly 1-in-10 (8%) Democrats say the country is evenly divided. By contrast, 27% of Republicans believe that most Americans support same-sex marriage, while 57% incorrectly believe most Americans are opposed. Eight percent of Republicans say the country is evenly divided, and as many (8%) report being unsure or did not offer an opinion.
Similarly, younger Americans are more likely than older Americans to have an accurate view of the current state of public opinion on same-sex marriage. Millennials are about evenly split between those who believe that most Americans support same-sex marriage (42%) and those who believe that most Americans are opposed (46%); 7% say the country is divided. By contrast, roughly one-quarter (23%) of Americans who are members of the Silent Generation say that most Americans support same-sex marriage. A majority (53%) believe that most Americans are opposed while 7% say Americans are divided; notably, 16% say they do not know or refused the question.
Self-identified LGBT Americans are more likely than Americans overall to believe most of the country supports same-sex marriage, but even among this group, less than half (48%) correctly say that most Americans favor it. Nearly 1-in-10 (9%) LGBT Americans say the country is evenly divided on the issue, and nearly 4-in-10 (38%) believe that most Americans oppose same-sex marriage.
Perceptions of the Views of Families and Friends on Same-sex Marriage
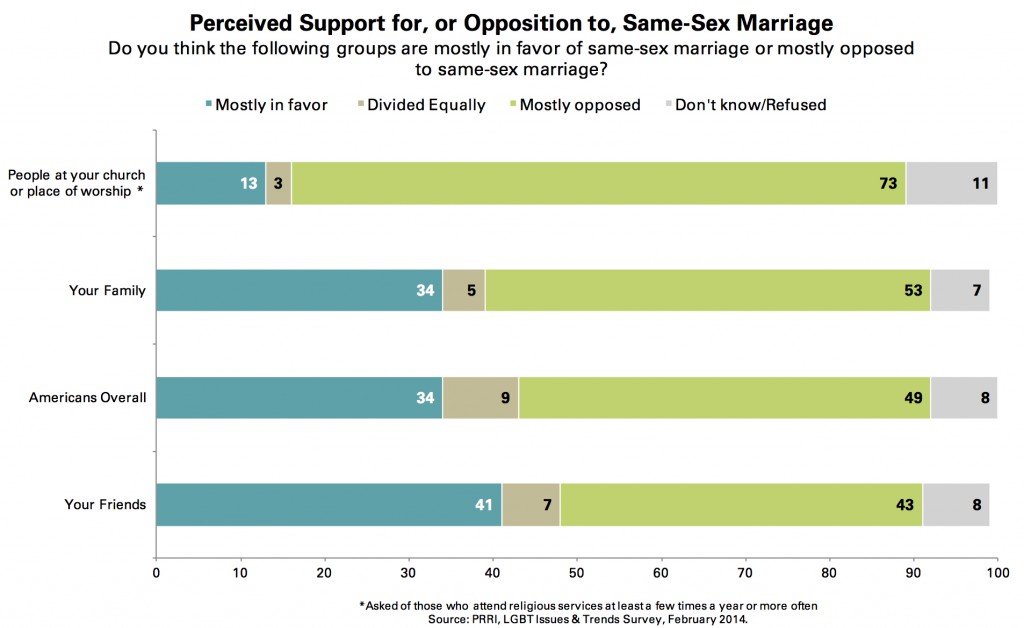
Americans report that the views of their family members often diverge from the views of their friends on the issue of same-sex marriage. A majority (53%) of Americans report that most of their family members are opposed to same-sex marriage, 5% say their family members are divided, and roughly one-third (34%) say most of their family members favor same-sex marriage. By contrast, nearly as many Americans say most of their friends favor same-sex marriage (41%) as say most of their friends oppose it (43%); 7% say their friends are about evenly divided on the issue.
A majority (57%) of Americans who support same-sex marriage say most of their family members also favor the policy, compared to 30% who say that most of their family members are opposed to it. Among opponents, the views of family members are even more cohesive: 85% report that most of their family members also oppose same-sex marriage, while only 6% say that most of their family members favor same-sex marriage. With regard to friends, roughly 7-in-10 (68%) same-sex marriage supporters say most of their friends also support same-sex marriage, while roughly three-quarters (76%) of same-sex marriage opponents say their friends also oppose same-sex marriage.
Millennials report a nearly 20-point gap between the views of their families and the views of their friends. Nearly half (49%) of Millennials say most of their family members oppose same-sex marriage, compared to 41% who say most of their family members support it. In contrast, only 30% of Millennials say that most of their friends oppose same-sex marriage, compared to nearly twice as many (59%) who say most of their friends favor same-sex marriage. Americans from the Silent Generation are equally likely to say that most of their friends (57%) and family members (56%) oppose same-sex marriage.
Republicans say most of their friends and family members share their views, while Democrats have more divided networks of families and friend. Republicans are more than three times more likely to report that most of their family members oppose same-sex marriage than they are to say most support it (71% vs. 20%). Republicans are twice as likely to report that most of their friends oppose same-sex marriage (60%) as they are to say most of their friends support it (28%). Democrats, however, are divided: 44% say most of their family members are opposed to legalizing same-sex marriage, compared to 43% who say most of their family members support the policy. A majority (52%) of Democrats say most of their friends favor same-sex marriage, while roughly one-third (34%) say most of their friends oppose it.
Women and men have similar perceptions of their families’ opinions on the issue of same-sex marriage. Fifty-six percent of men and 51% of women say most of their family members are opposed to same-sex marriage. However, men and women differ substantially in how they perceive the views of their friends. Among men, nearly half (49%) say most of their friends oppose same-sex marriage, compared to 36% who say most of their friends favor same-sex marriage. Among women, however, the balance is the opposite. Only 38% of women say most of their friends oppose same-sex marriage, compared to nearly half (47%) who say most of their friends favor same-sex marriage.
Unlike Americans overall, a majority of self-identified LGBT Americans report that most of their family members and most of their friends favor allowing gay and lesbian people to marry. A majority (56%) of LGBT Americans say most of their family members favor same-sex marriage, compared to one-third (33%) who say most of their family members oppose. An even greater number (75%) of LGBT Americans say most of their friends favor same-sex marriage; about 1-in-5 (19%) say most of their friends oppose same-sex marriage.
Americans’ opinions on same-sex marriage are highly correlated with their perceptions of the opinions of most of their family and friends. Among Americans who say most of their friends favor same-sex marriage, nearly 9-in-10 (87%) also support the policy. Similarly, among Americans who say most of their friends oppose same-sex marriage, 73% also oppose it. This pattern holds true for views of family members as well.
For example, among Republicans who report that most of their friends favor same-sex marriage, nearly 8-in-10 (78%) say they themselves favor same-sex marriage. Similarly, among Democrats who report that most of their friends oppose same-sex marriage, two-thirds (67%) also report being opposed.
This pattern is generally consistent across subgroups, but is less pronounced among younger Americans of the Millennial generation, many of whom break with their families’ higher opposition to same-sex marriage.
Perceptions of the Views of Fellow Religious Congregants on Same-sex Marriage
Among Americans who attend religious services at least a few times a year, nearly three-quarters (73%) say most of their fellow congregants oppose same-sex marriage, compared to just more than 1-in-10 (13%) who say people in their church favor same-sex marriage. While majorities of all religious groups say most of their fellow congregants oppose same-sex marriage, there is a wide range of diversity in perception by religious affiliation.
White evangelical Protestants are the most likely to report that most people in their church oppose same-sex marriage (86%); only 5% of white evangelical Protestants say most people in their church favor same-sex marriage. Roughly 8-in-10 Hispanic Protestants (80%) and black Protestants (79%) also say most of their fellow churchgoers are opposed to same-sex marriage. About 7-in-10 Catholics (69% of Hispanic Catholics and 71% of white Catholics) say most of their fellow churchgoers oppose same-sex marriage. Finally, about 6-in-10 (59%) white mainline Protestants say most of their fellow churchgoers oppose same-sex marriage.
Regular churchgoers (those who attend at least once or twice a month), particularly those who are members of religious groups that are more supportive of same-sex marriage, are likely to underestimate support for same-sex marriage in their churches by 20 points or more. For example, as noted above, about 6-in-10 (59%) white mainline Protestants believe their fellow congregants are mostly opposed to same-sex marriage. However, among white mainline Protestants who attend church regularly, only 36% oppose allowing gay and lesbian people to legally marry while a majority (57%) actually favor this policy. Similarly, roughly three-quarters (73%) of Catholics believe that most of their fellow congregants are opposed to same-sex marriage. However, Catholics who regularly attend church are in fact divided over the issue (50% favor, 45% oppose). Among groups who are more opposed to same-sex marriage, such as white evangelical Protestants and black Protestants, perceptions of their congregations are more in line with their actual views on the issue.
The Unique Social Environments of Republicans and White Evangelical Protestants in the Millennial Generation
Although Republicans and white evangelical Protestants overall are more likely than the general public to report having both families and networks of friends who are mostly opposed to same-sex marriage, younger Republicans’ and younger white evangelical Protestants’ friendship networks are more divided.
A majority of Millennial Republicans (64%) and Millennial white evangelical Protestants (72%) report their families are mostly opposed to same-sex marriage. However, Millennial Republicans and Millennial white evangelical Protestants are embedded in more diverse friendship networks than their older cohorts. Roughly half (49%) of Millennial Republicans, say most of their friends oppose allowing gay and lesbian couples to legally marry, but nearly as many (42%) say that most of their friends support the policy or say their friends are evenly divided (7%). Among older Republicans, 74% say most of their friends oppose same-sex marriage, while only 11% say most of their friends favor the policy. A similar pattern is evident among Millennial white evangelical Protestants: 43% say most of their friends oppose same-sex marriage, 36% say most of their friends support it, and 14% say their friends are evenly divided on the issue. By contrast, 8-in-10 (80%) white evangelical Protestants who are members of the Silent Generation say most of their friends oppose same-sex marriage.
VI. The Nature vs. Nurture Debate
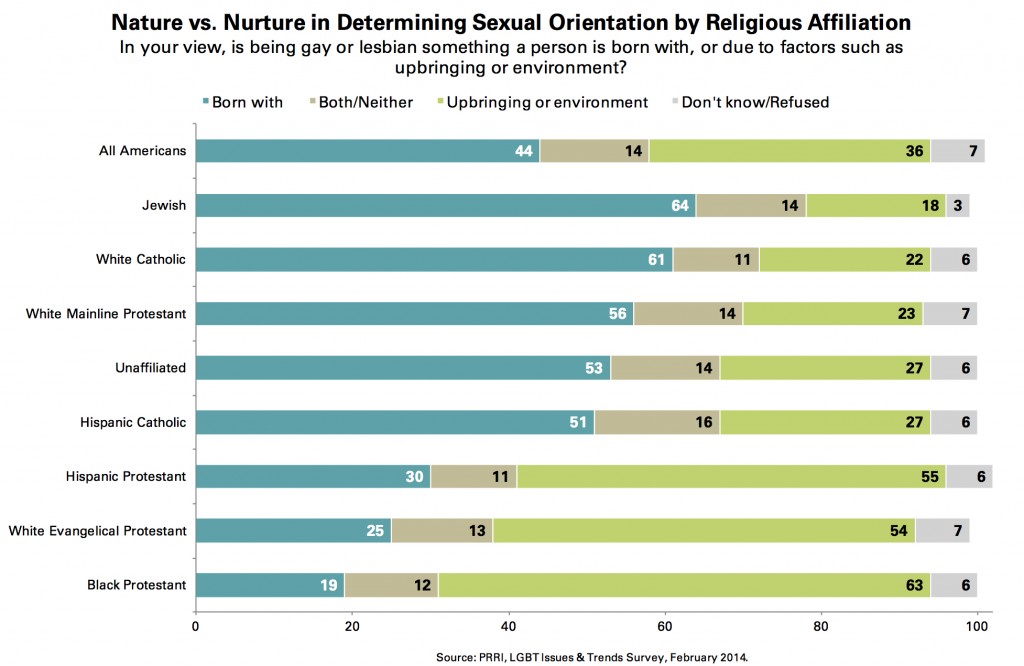
The debate over whether homosexuality is an inherent trait or the result of external forces such as upbringing or environment continues today, though the balance of opinion on the question has shifted significantly during the last decade. Currently, more than 4-in-10 (44%) Americans believe that being gay or lesbian is “something a person is born with,” compared to 36% who say it is “due to factors such as upbringing or environment”; 12% say it is both. In 2003, the balance of opinion was reversed, with nearly 4-in-10 (38%) Americans reporting that homosexuality was something one is born with and more than 4-in-10 (44%) saying it was caused by upbringing or environment; 11% said it was both.(10)
Political affiliation is a significant factor associated with how people view homosexuality. A majority (53%) of Democrats believe being gay or lesbian is something a person a person is born with, compared to 30% who believe it is the result of upbringing or environment. By contrast, about one-third of Republicans (34%) and Tea Party members (33%) believe being gay or lesbian is innate, compared to 44% of Republicans and 45% of Tea Party members who believe it is the result of environmental factors.
Independents are more divided, with 44% believing it is innate, and 37% saying it is the result of environmental factors. There are also strong racial divisions evident in the debate. Nearly half (49%) of white Americans view sexuality as an innate trait, while 32% say it is due to factors such as upbringing, and 12% say it is combination of both. Hispanic Americans are divided in their views; more than 4-in-10 (43%) say that being gay and lesbian is an innate characteristic while nearly as many (37%) say it is related to upbringing or environment. Thirteen percent of Hispanics say it is a combination of the two. Fully 6-in-10 (60%) black Americans believe that being gay or lesbian is the result of upbringing and environment, while only 21% say it is an innate characteristic.
Views about whether homosexuality is an inherent or an acquired trait vary substantially by religious affiliation. A majority of Jewish Americans (64%), white Catholics (61%), white mainline Protestants (56%), the religiously unaffiliated (53%), and Hispanic Catholics (51%) believe sexual orientation is an innate trait. Other religious groups are less likely to believe sexual orientation is innate. Only 3-in-10 (30%) Hispanic Protestants, one-quarter (25%) of white evangelical Protestants, and less than 1-in-5 (19%) black Protestants believe homosexuality is something a person is born with.
Education is also associated with how Americans view sexuality. Nearly 6-in-10 (58%) of those with a post-graduate degree and roughly half (51%) of those with a college degree believe sexuality is an intrinsic trait, compared to 4-in-10 (39%) Americans who have a high school education or less.
Among those who say they have a close friend or family member who is gay or lesbian, half (50%) say homosexuality is an intrinsic trait, while 3-in-10 (30%) say it is due to a person’s upbringing or environment. Among those who do not have a close friend or family member who is gay or lesbian, roughly one-third (32%) say it is inherent, while 47% say it is the result of environmental factors.
There is a strong correlation between beliefs about the causes of sexual orientation and support for same-sex marriage. Among those who believe sexuality is an innate trait, more than three-quarters (76%) favor allowing gay and lesbian couples to legally marry; only 20% are opposed. Conversely, among those who believe being gay or lesbian is due to upbringing or environment, less than 3-in-10 (28%) support same-sex marriage; 67% are opposed.
VII. Parenting and Adoption by Gay and Lesbian Couples
Perceptions of Gay and Lesbian Couples as Parents
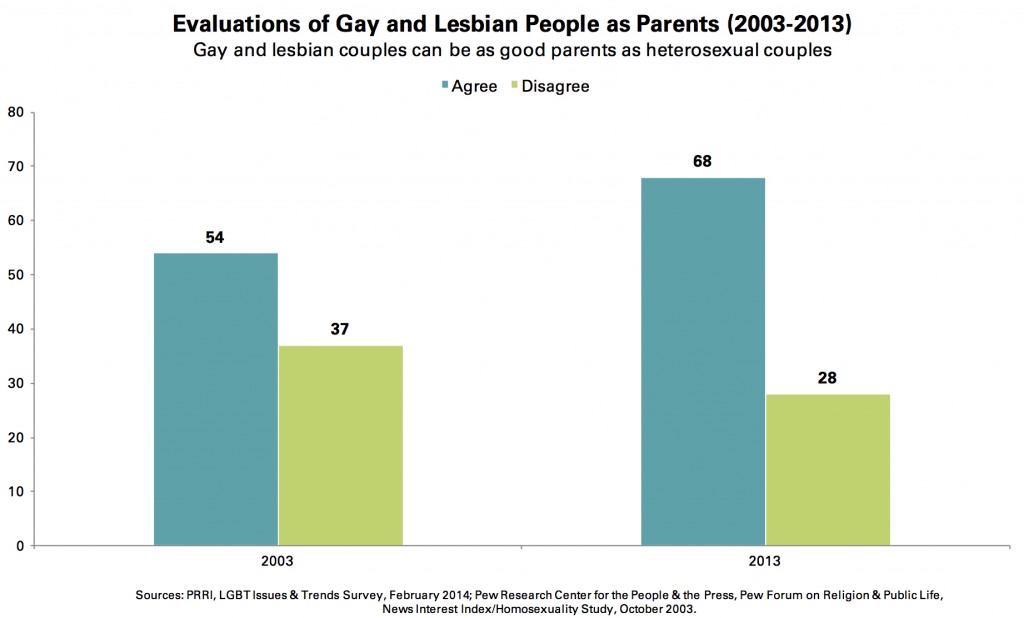
Today, more than two-thirds (68%) of Americans believe gay and lesbian couples can be as good as heterosexual couples as parents, while less than 3-in-10 (28%) Americans disagree. Agreement on this question has increased 14 points since 2003, when 54% of Americans believed gay and lesbian couples could be as good as heterosexual couples as parents, compared to 37% who disagreed.(11)
Judgments about the ability of gay and lesbian couples to be good parents cross party lines, though there are substantial differences in the degree of agreement. More than 7-in-10 Democrats (74%), and independents (71%) agree that gay and lesbian couples can be as good as parents as heterosexual couples while smaller majorities of Republicans (55%) and Tea Party members (52%) also agree. More than 4-in-10 Republicans (41%) and members of the Tea Party (42%) believe gay and lesbian couples cannot be as good as parents as heterosexual couples.
Majorities of all racial groups agree gay and lesbian couples can be as good as heterosexual couples as parents. Seven-in-ten (70%) of white Americans, nearly two-thirds (65%) of Hispanic Americans, and 6-in-10 (60%) black Americans agree gay and lesbian couples can be as good as heterosexual couples as parents.
A majority of all religious groups, with the exception of white evangelical Protestants, agree that gay and lesbian couples can be as good as heterosexual couples as parents. Roughly 8-in-10 religiously unaffiliated Americans (82%), Jewish Americans (81%), white mainline Protestants (77%), about 7-in-10 white Catholics (72%) and Hispanic Catholics (66%), and about 6-in-10 Hispanic Protestants (59%), and black Protestants (58%) agree gay and lesbian couples can be as good as parents as heterosexual couples. White evangelical Protestants are divided, with 49% agreeing and 48% disagreeing.
Millennials are more likely than older Americans to agree gay and lesbian couples can be as good as heterosexual couples as parents. Nearly 8-in-10 (79%) Millennials agree, compared to half (50%) of Americans who are part of the Silent Generation. These generational differences also affect views within religious groups, particularly among more conservative groups. For example, more than twice as many younger white evangelical Protestants as older white evangelical Protestants agree gay and lesbian couples can be as good as parents as heterosexual couples (66% vs. 32%).
Adoption by Gay and Lesbian Couples
Roughly 6-in-10 (58%) Americans favor allowing gay and lesbian couples to adopt children. Support has increased substantially since 2006, when 46% of Americans favored allowing gay couples to adopt children.(12) Views shifted less dramatically during the first half of the last decade, as 38% of Americans expressed support for allowing gay and lesbian couples to adopt children in 1999.(13)
The partisan divisions on attitudes toward adoption largely mirror the findings on support for same-sex marriage. More than 6-in-10 Democrats (66%) and independents (61%) favor allowing gay and lesbian couples to adopt children, compared to 42% of Republicans and 40% of those who identify with the Tea Party movement. Notably, a majority (52%) of Millennial Republicans favor allowing gay and lesbian couples to adopt children, compared to only 31% of Republicans who are a part of the Silent Generation.
As with the issue of same-sex marriage, there are significant differences among racial groups with regard to gay and lesbian couples adopting children. Majorities of white Americans (60%) and Hispanic Americans (54%) favor allowing gay and lesbian people to adopt children, compared to 44% of black Americans. Half (50%) of black Americans oppose allowing gay and lesbian couples to adopt children.
The divisions between religious groups on the issue of adoption closely track the divisions on the issue of same-sex marriage. Majorities of Jews (80%), the religiously unaffiliated (75%), white mainline Protestants (68%), white Catholics (63%), and Hispanic Catholics (56%) support allowing gay and lesbian couples to adopt children. Hispanic Protestants are divided on the issue, with 46% in favor of allowing gay and lesbian couples to adopt children and 50% opposed. Majorities of black Protestants and white evangelical Protestants oppose allowing gay and lesbian couples to adopt children. A majority (54%) of black Protestants are opposed to same-sex couples adopting children, compared to 40% who favor it. More than 6-in-10 (61%) white evangelical Protestants oppose allowing gay and lesbian couples to adopt children, including 3-in-10 (31%) who strongly oppose; only one-third (33%) of white evangelical Protestants favor adoption rights for gay and lesbian couples. Millennial white evangelical Protestants are about twice as likely as white evangelical Protestants who are part of the Silent Generation to support allowing gay and lesbian couples to adopt (46% vs. 24%). However, half (50%) of Millennial white evangelical Protestants oppose this policy.
Majorities of every generational cohort except the Silent Generation favor allowing gay and lesbian couples to adopt children. Seven-in-ten (70%) Millennials, 58% of Generation X, and 52% of Baby Boomers favor allowing gay and lesbian couples to adopt children. Among members of the Silent Generation, only 42% favor this policy compared to 49% who oppose.
VIII. Employment Nondiscrimination Laws for Gay and Lesbian People
Support for Discrimination Protections for Gay and Lesbian Persons in the Workplace
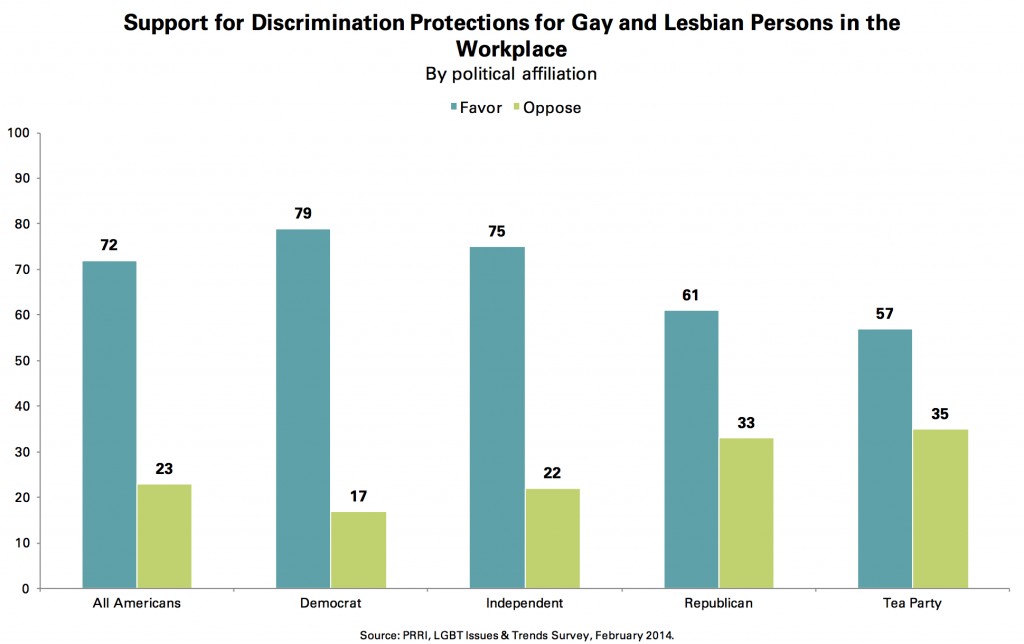
Americans strongly support laws that would protect gay and lesbian people from discrimination in the workplace. More than 7-in-10 (72%) Americans favor laws protecting gay and lesbian people from job discrimination, compared to less than one-quarter (23%) who oppose. Solid majorities of both political parties and in every major religious group support workplace nondiscrimination laws for gay and lesbian people.
Majorities of Democrats (79%), independents (75%), and Republicans (61%) favor laws protecting gay and lesbian people against employment discrimination, as do a majority (57%) of Tea Party members.
More than 8-in-10 Jewish Americans (88%) and religiously unaffiliated Americans (82%) and three-quarters of white mainline Protestants (75%) favor laws protecting gay and lesbian people from job discrimination, as do roughly 7-in-10 white Catholics (73%), Hispanic Catholics (73%), Hispanic Protestants (70%), and black Protestants (69%), and a majority of white evangelical Protestants (57%).
Knowledge of Employment Nondiscrimination Laws
The vast majority of Americans incorrectly believe it is currently illegal under federal law to discriminate on the basis of sexual orientation or gender identity. Three-quarters (75%) of Americans incorrectly believe it is currently illegal under federal law to fire or refuse to hire someone because they are gay, lesbian, bisexual, or transgender. Only 15% of Americans correctly say that such discrimination is currently legal under federal law, while nearly 1-in- 10 (9%) offered no opinion.
Majorities of all political affiliations incorrectly believe it is currently illegal under federal law to discriminate on the basis of sexual orientation or gender identity. Democrats (21%) and Tea Party members (18%) are slightly more likely than independents (13%) and Republicans (11%) to know such job discrimination protections do not exist.
Notably, nearly 7-in-10 (68%) Americans who identify as LGBT incorrectly believe job discrimination on the basis of sexual orientation is illegal, a rate comparable to the three-quarters (75%) of all Americans who believe it is illegal.(14)
IX. Perceptions of Discrimination and Bullying in Society
Discrimination Against Gay, Lesbian, and Transgender Americans Compared to Other Groups
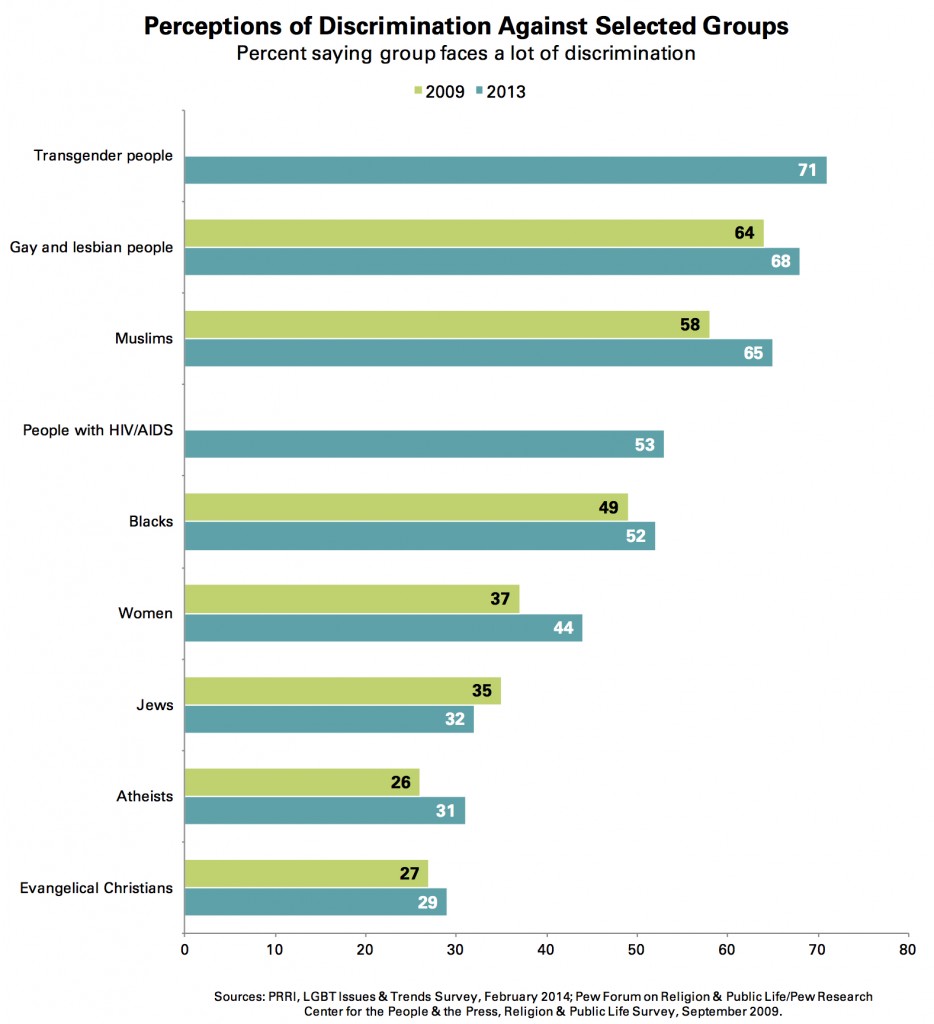
Today, roughly two-thirds (68%) of Americans believe that gay and lesbian people face a lot of discrimination in the United States, while similar numbers (71%) say transgender Americans face a lot of discrimination. In 2009, 64% of Americans reported that gay and lesbian people faced a lot of discrimination.(15)
Similar numbers of Americans also perceive that Muslims (65%) face a lot of discrimination in the United States today. A majority of Americans say that people with HIV or AIDS (53%) and black Americans (52%) also face considerable amounts of discrimination in American society. Less than half (44%) of Americans say that women confront a lot discrimination, while only about one-third believe there to be a lot of discrimination against Jewish Americans (32%), atheists (31%), and evangelical Christians (29%).
Americans who are members of these groups are significantly more likely than those who are not to believe their own group faces a lot of discrimination in society today. For instance, nearly half (45%) of white evangelical Protestants believe that people like them face a lot of discrimination in society. More than 8-in-10 (83%) black Americans report that there is a lot discrimination against black Americans in the United States, compared to fewer than half (45%) of white Americans who say the same. A majority (54%) of women believe they face a lot of discrimination in America today, while only 32% of men agree. Self-identified gay and lesbian people are also more likely than heterosexual Americans to believe they face considerable discrimination (83% vs. 68%).
Americans believe the bullying of gay and lesbian youth is a major problem in many American schools. Roughly two-thirds (66%) of Americans agree bullying of gay and lesbian teenagers is a major problem in schools today, while nearly one-quarter (23%) disagree. The belief that bullying of gay and lesbian youth is a major problem in schools is broadly shared across partisan and religious lines. Notably, LGBT Americans and those with closer ties to LGBT people are more likely to see bullying as a major problem. Eighty percent of self-identified LGBT people, compared to 67% of heterosexual people, see the bullying of gay and lesbian youth as a major problem. Similarly, 71% of those who have a close friend or family member who is gay or lesbian see bullying as a major school problem, compared to 58% of those who do not have close ties to someone who is gay or lesbian.
Difficulty of Living Openly as Gay or Lesbian
People perceive that living openly as a gay or lesbian person in their community is easier today than it was even a few years ago. A majority (55%) of Americans say that it is not too difficult or not at all difficult to live openly as a gay or lesbian person while 4-in-10 (41%) believe it is somewhat or very difficult.(16) In 2011, less than half (45%) of Americans thought it was not too difficult to live openly as a gay or lesbian person, compared to a slim majority (51%) of Americans who reported that living openly as a gay or lesbian person was somewhat or very difficult.
There are notable regional differences in perceptions of how easy or difficult it is for gay and lesbian people to live openly in society. More than 4-in-10 Americans living in the Midwest (47%), South (43%), and West (42%) say living openly as a gay or lesbian person in the United States today is either somewhat or very difficult, while significantly fewer people living in the Northeast (34%) say the same. People living in urban and suburban areas are less likely to say it is difficult to live openly as a gay or lesbian in America today (39% and 41%, respectively), than Americans living in rural areas, among whom nearly half (47%) say it is difficult.
Americans living in states that recognize same-sex marriage are similarly less inclined to believe that it is difficult to live openly as a gay or lesbian person than those living in states where it is not.(17) Fewer than 4-in-10 (37%) Americans living in states that recognize same-sex marriages believe it is difficult to live openly as a gay or lesbian person in their community. Close to half (45%) of Americans living in states where neither same-sex marriage nor civil unions for gay and lesbian couples are legally recognized believe living openly as a gay or lesbian person is difficult in their community.
Self-identified LGBT people are evenly divided on whether they think it is difficult to live openly in society. Forty-nine percent say it is very or somewhat difficult to live openly as a gay or lesbian person, while just as many (49%) say that it is not too or not at all difficult.
X. Profile of LGBT Americans
Size of the LGBT Population in the United States
Estimates of the size of the gay, lesbian, bisexual and transgender population in the United States have produced somewhat different results due to different measurement approaches, such as measuring same-sex sexual behavior or attraction, household relationships, and self-identification. Recent estimates of the gay, lesbian, bisexual, and transgender population range from 1.7% to 5.6% of the U.S. adult population.(18) The current survey, using self-identification, finds 5.1% of the adult population identifies as either gay, lesbian, bisexual or transgender.(19)
Notably, when asked to estimate the percentage of gay and lesbian people in the United States today, Americans overall overestimate the size of the LGBT population by a factor of 4 (20% median estimate). Only 14% of Americans accurately estimate the gay and lesbian population at 5% or less.(20)
A majority (55%) of LGBT Americans live in states that prohibit same-sex marriage and civil unions; 7% live in states that recognize civil unions but not marriage for gay and lesbian couples, and 38% live in states that allow gay and lesbian couples to legally marry.
Religious Identity, Beliefs and Participation of LGBT Americans
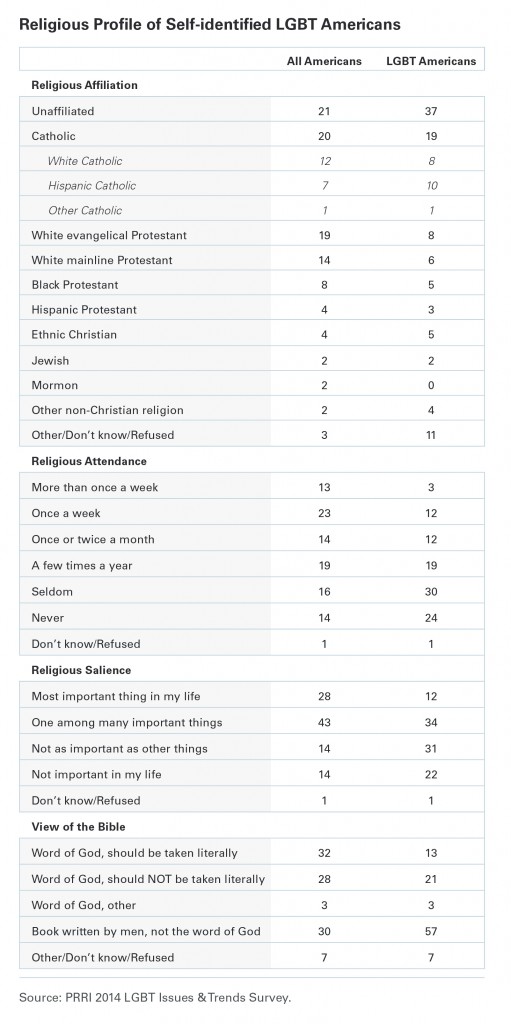
The religious profile of LGBT people differs sharply from Americans overall. Nearly 4-in- 10 (37%) Americans who identify as gay, lesbian, bisexual or transgender report being religiously unaffiliated, nearly twice the rate of the public overall (21%). However, this is partly explained by the fact that self-identified LGBT Americans are more likely to be Millennials, a group with higher rates of disaffiliation. For example, nearly half (49%) of self-identified LGBT people are Millennials, compared to 29% of the general population who are part of the Millennial Generation.
Nearly 1-in-5 (19%) LGBT Americans identify as Catholic, a rate comparable to all Americans (20%). LGBT people are substantially less likely than Americans on the whole to identify as a member of Protestant religious traditions, including white evangelical Protestant (8% vs. 19%), white mainline Protestant (6% vs. 14%), and black Protestant (5% vs. 8%). Gay, lesbian, bisexual and transgender Americans are also far more likely than other Americans to report leaving their childhood religion. LGBT Americans are about as likely as Americans overall to have been raised outside a formal religious tradition (7% vs. 8%). However, nearly 4-in-10 (37%) LGBT Americans are now unaffiliated, compared to 21% of Americans overall. Put another way, roughly 3-in-10 (31%) of LGBT Americans left their childhood religion to become religiously unaffiliated.
Consistent with their lower rates of religious affiliation, gay and lesbian Americans report going to services less often than Americans overall. Fifteen percent of gay and lesbian people say they attend religious services weekly or more, compared to 36% of Americans overall. Most gay and lesbian Americans (54%) say they attend religious services seldom or never, a significantly larger share than the 3-in-10 (30%) Americans overall who report attending services this often.
Gay and lesbian Americans are also less likely to emphasize the place of religion in their lives than Americans overall, though a significant number still do. Nearly half of LGBT Americans say religion is either the most important thing in their lives (12%) or one among many important things (34%). Among Americans overall, roughly 7-in-10 say religion is either the most important thing (28%) in their lives or one among many important things (43%). A majority of LGBT Americans say religion is not as important as other things (31%) or is not at all important in their daily life (22%).
LGBT Americans are much less likely than Americans overall to have a literal view of the Bible. Only 13% of LGBT Americans say the Bible is the word of God and that everything in it should be taken literally, while another 21% believe the Bible is the word of God but not everything should be taken literally. A majority (57%) of LGBT Americans say the Bible is not the word of God, but rather a book written by men. By comparison, more than 6-in- 10 Americans believe the Bible is the word of God including roughly one-third (32%) who believe it should be taken literally; 28% believe the Bible is the word of God but that it should not be interpreted literally. Only 30% of Americans say the Bible is not the word of God but rather a book written by men.
Political Ideology and Party Affiliation
The politics of LGBT Americans differ significantly from the general public. A plurality (40%) identify as liberal, significantly more than the 24% of Americans who say the same. Nearly 4-in-10 (37%) LGBT Americans identify as politically moderate, compared to 32% of Americans overall. Compared to all Americans, LGBT Americans are less than half as likely as to identify as conservative (16% vs. 37%).
When it comes to party affiliation, roughly half (49%) of LGBT Americans identify as political independents, significantly more than the 4-in-10 (40%) Americans overall who identify as independents. LGBT Americans are modestly more likely to identify as Democrats (36% vs. 29%), and about half as likely to identify as Republicans (9% vs. 22%).
XI. Judgments about the Morality of Personal Behavior
Among four types of personal behaviors measured—smoking marijuana, viewing pornography, having an abortion, and sex between two adults of the same gender—smoking marijuana was viewed as the least morally objectionable. Roughly 4-in-10 (42%) Americans say smoking marijuana is morally wrong, compared to half (50%) who believe it is morally acceptable. A slim majority (51%) of Americans say that sex between adults of the same gender is morally wrong, while more than 4-in-10 (43%) say it is morally acceptable. A majority (54%) of Americans also believe that having an abortion is morally wrong, compared to only one-third (33%) who say it is morally acceptable. Importantly, more than 1-in-10 (11%) Americans say that the morality of having an abortion depends on the particular circumstances. Nearly two-thirds (65%) of the public say viewing pornography is morally wrong, while fewer than 3-in-10 (29%) say it is morally acceptable.
There are substantial generational divisions in judgments about the morality of each behavior. Millennials are more than twice as likely as the Silent Generation to say that smoking marijuana is morally acceptable (63% vs. 30%). There is a similarly sized generation gap in views about same-gender sexual relations. A majority (56%) of Millennials say sex between two adults of the same gender is morally acceptable, while only 29% of the Silent Generation agree. Close to half (45%) of Millennials say that viewing pornography is morally acceptable, five times the number of Silent Generation Americans who agree (9%). However, Millennial views of the moral acceptability of abortion differ only modestly from those of the Silent Generation Fifty-two percent of Millennials say having an abortion is morally wrong, compared to 55% of Americans in the Silent Generation. Millennials are somewhat more likely to say that abortion is morally acceptable (36% vs. 26%), while Silent Generation Americans are somewhat more likely to say that the morality of abortion depends on the situation (15% vs. 9%).
There are stark differences in how religious groups view the morality of these personal behaviors. White evangelical Protestants are most likely to have negative moral judgments about each behavior included in the survey. White evangelical Protestants consider viewing pornography (88%), sex between two adults of the same gender (78%), having an abortion (75%) and smoking marijuana (59%) all to be morally wrong. In contrast, fewer than half of white mainline Protestants morally object to smoking marijuana (41%), sex between adults of the same gender (41%) or having an abortion (45%). However, more than 6-in-10 (63%) white mainline Protestants say viewing pornography is morally wrong. The judgments of white Catholics differ considerably from those of Hispanic Catholics. Fewer than half of white Catholics say smoking marijuana (38%) and same-gender sexual relations are morally wrong (46%), while a majority say having an abortion (56%) and viewing pornography (67%) are morally wrong. In contrast, large majorities of Hispanic Catholics say viewing pornography (78%), having an abortion (77%), smoking marijuana (66%) are morally wrong, while fewer—though still a majority (53%)—say sex between two adults of the same gender is morally wrong. Comparatively few religiously unaffiliated Americans have moral reservations about any of these behaviors, including smoking marijuana (24%), sex between adults of the same gender (28%), having an abortion (31%), or viewing pornography (40%).
The Morality-Legality Gap
Despite misgivings about certain types of personal behavior, these moral judgments do not always translate into policy preferences. While a slim majority (51%) of the public believe sex between people of the same gender is morally wrong, fewer (41%) oppose allowing gay and lesbian people to marry. Similarly, while a majority (54%) of Americans believe having an abortion is morally wrong, fewer (41%) say abortion should be illegal in all or most cases.
On the issue of marijuana legalization, views about morality more closely track views on legality. Half (50%) of the public believe using marijuana is morally acceptable while roughly the same number (51%) favor making the use of marijuana legal.
XII. Views about HIV/AIDS in the United States and Developing Countries
AIDS as Divine Punishment
The percentage of Americans who believe AIDS might be God’s punishment for immoral sexual behavior has fallen dramatically over time. Fourteen percent of Americans agree with the idea that AIDS might be God’s punishment for immoral sexual behavior, while 81% disagree. In 1992, more than twice as many Americans (36%) agreed that AIDS might be God’s punishment for immoral sexual behavior, while fewer than 6-in-10 (57%) disagreed.(21)
Although majorities of all religious groups disagree with the idea that AIDS might be God’s punishment for immoral sexual behavior, there are notable differences between religious groups. Nearly one-quarter of white evangelical Protestants (24%) and Hispanic Protestants (24%) along with 1-in-5 (20%) black Protestants, believe that AIDS might be God’s punishment for immoral sexual behavior. In contrast, about 1-in-10 white mainline Protestants (10%), Catholics (11%) and religiously unaffiliated Americans (8%) agree that AIDS might be a form of divine retribution. Hispanic Catholics are three times more likely to believe this than white Catholics (21% vs. 7%).
Views about whether AIDS might be divine punishment have shifted dramatically among religious groups. In 1992, more than half of white evangelical Protestants (51%) and half of black Protestants (50%) agreed that AIDS could be God’s punishment for immoral sexual behavior. Thirty-six percent of Hispanic Catholics and 30% of white Catholics also agreed that AIDS might be divine punishment for immoral sexual behavior. Fewer than 3-in-10 white mainline Protestants (28%) and religiously unaffiliated Americans (24%) thought that AIDS was the result of God punishing immoral sexual behavior.
Majorities of all political groups reject the idea that AIDS could be punishment from God for immoral sexual behavior. However, members of the Tea Party (24%) and Republicans (19%) are somewhat more likely than Democrats (13%) and independents (14%) to see AIDS as a divine punishment.
Differences in Perceptions of HIV/AIDS in the United States and Developing Countries
Perceptions about the most important health issues facing the United States and the world differ substantially. Thirty-six percent of Americans say obesity is the single most urgent health problem facing the United States. Fewer Americans mention cancer (26%), hunger (10%), diabetes (9%), and heart disease (8%). Only 5% report that HIV/AIDS is the most urgent health problem facing the United States.
There are significant racial differences in perceptions of the most pressing health problems facing the United States. While equal numbers of both black and white Americans believe that cancer is the most urgent health problem facing the country (27% vs. 27%), white Americans are significantly more likely to believe that obesity is America’s most pressing health problem (39% vs. 27%). Conversely, black Americans are much more likely than white Americans to say HIV/AIDS is the nation’s most pressing health concern (14% vs. 2%).
Americans’ perceptions of the most urgent problems facing the world differ starkly. Four-in-ten (40%) Americans say that hunger is the most pressing health issue, significantly more than those who mention cancer (22%), obesity (14%) or HIV/AIDS (9%). Only 1-in-20 Americans believe that heart disease (5%) or diabetes (5%) are the most urgent health problems in the world.
Americans also hold starkly different opinions about how Americans versus people in developing countries contracted HIV. Americans are significantly more likely to say those who are living with HIV/AIDS in the United States became infected because of irresponsible behavior than they are to say the same about those living with HIV/AIDS in the developing world. Nearly two-thirds (65%) of Americans say that people with HIV/AIDS in the United States became infected because irresponsible personal behavior, while just one-quarter (25%) say they became infected through no fault of their own. In contrast, only 4-in-10 (41%) Americans believe that people who contracted HIV in the developing world did so because of irresponsible behavior. Nearly half (48%) say they contracted the disease through no fault of their own. There are few differences on this issue among Americans from different political, religious, racial backgrounds.
Notably, Americans with a close friend or family member who is gay or lesbian are only slightly more likely than those without a close friend or family member who is gay or lesbian to say people living with HIV/AIDS became infected through no fault of their own (28% vs. 19%).
Endnotes
1 Unless otherwise noted, references to 2003 figures in this report come from the Pew Research Center’s News Interest Index/ Homosexuality Survey, October 2003.
2 Gallup (53%), CNN (51%), ABC News and the Washington Post (53%) and Public Religion Research Institute (51%) all found majority support for same-sex marriage in the spring of 2011.
3 Results for Hispanic Americans from Pew Research Center’s News Interest Index/Homosexuality Survey include less than 100 respondents (N=89) and should be interpreted with caution.
4 The 2012 Republican Party platform explicitly opposed same-sex marriage (http://www.foxnews.com/politics/2012/08/28/ gop-oks-platform-barring-abortions-gay-marriage), while the Democratic Party added support for same-sex marriage to their 2012 platform (http://www.npr.org/2012/09/04/160562404/democratic-platform-endorses-gay-marriage).
5 The 2003 version of the question used the phrase “would go against my religious beliefs,” while the 2013 question used the phrase “goes against my religious beliefs.”
6 The 2012 American Values Survey found the top three reasons Americans cited for leaving their childhood faith were that they no longer believed in God or the teachings of their former faith, they disliked organized religion or believed it caused problems, or because of personal experiences.
7 Hout and Fischer (2002) found that the conservative stance some religious organizations took on gay and lesbian issues was an important reason why some Americans were disaffiliating. See Hout, Michael, and Claude S. Fischer. 2002. “Why More Americans Have No Religious Preference: Politics and Generations.” American Sociological Review 67(2): 165–90.
8 CBS/New York Times Survey, February 1993.
9 Herek, Gregory M. and John P. Capitanio. 1996. “‘Some of My Best Friends’: Intergroup Contact, Concealable Stigma and Heterosexuals’ Attitudes Toward Gay Men and Lesbians.” Personality and Social Psychology Bulletin, 22 (412-424).
10 Gallup Poll, May 2003.
11 Pew Research Center for the People & the Press, Pew Forum on Religion & Public Life Survey, News Interest Index/Homosexuality Study, October 2003.
12 Pew Research Center for the People & the Press, Pew News Interest Poll, March 2006.
13 Pew Research Center for the People & the Press, News Interest Index Survey, September 1999. In both 2006 and 1999 the question asked respondents whether they strongly favored, favored, opposed or strongly opposed the following: “Allowing gays and lesbians to adopt children?”
14 Because the question was asked of half the total sample the results for LGBT Americans are based on fewer than 100 respondents (N=99) and should be interpreted with caution.
15 All the figures from 2009 are based on the Pew Forum on Religion & Public Life/Pew Research Center for the People & the Press, Religion & Public Life Survey, September 2009. The language in the Pew question included “gays and lesbians” instead of gay and lesbian people.
16 Public Religion Research Institute, Millennials, Religion & Gay and Lesbian Issues Survey, July 2011.
17 States included are those where same-sex marriage was legal by the end of 2013. These states are: California, Connecticut, Delaware, the District of Columbia, Hawaii, Illinois, Iowa, Maine, Maryland, Massachusetts, Minnesota, New Hampshire, New Jersey, New Mexico, New York, Rhode Island, Vermont, and Washington.
18 Gates, Gary J. “How many people are lesbian, gay, bisexual, and transgender?” The Williams Institute, April 2011.
19 The current survey asked about gay, lesbian, and bisexual identity separately from transgender identity in order to allow respondents to identify as transgender independently of their identification as gay, lesbian, or bisexual.
20 The survey also reveals that Americans generally overestimate the sizes of other minority groups in the United States, including the Jewish population (20% median estimate vs. 2% actual), atheists (20% median estimate vs. 3% actual), Muslims (15% median estimate, vs. 1% actual), and Hispanics (30%, median estimate vs. 17% actual).
21 PRSA/Times Mirror Survey, June 1992
22 Telephone usage refers to whether respondents have only a landline telephone, only a cell phone or both types.
Recommended citation:
Jones, Robert P., Daniel Cox, and Juhem Navarro-Rivera. “A Shifting Landscape: A Decade of Change in American Attitudes about Same-sex Marriage and LGBT Issues.” PRRI. 2014. http://www.prri.org/research/2014-lgbt-survey/.

