
White working-class Americans have consistently played a pivotal role in U.S. elections, increasingly aligning with the Republican Party. PRRI research from the 2016 presidential election, for instance, shows that 64% of white working-class voters backed President Donald Trump. Trump’s support among this key demographic remains high, with two in three white working-class voters once again backing him in 2024, according to PRRI’s Post-Election Survey.
PRRI developed a model to test various factors in predicting support for Trump among white working-class voters in the 2016 election, finding that aside from partisanship, much of the support for Trump was driven by cultural concerns, including fears of immigrants and cultural displacement. At the same time, while economic fatalism predicted support for Trump, personal economic hardship predicted support for Clinton in 2016, which ran counter to popular media narratives claiming that Trump’s appeal to the white working class was primarily due to the economic pressures that they faced.
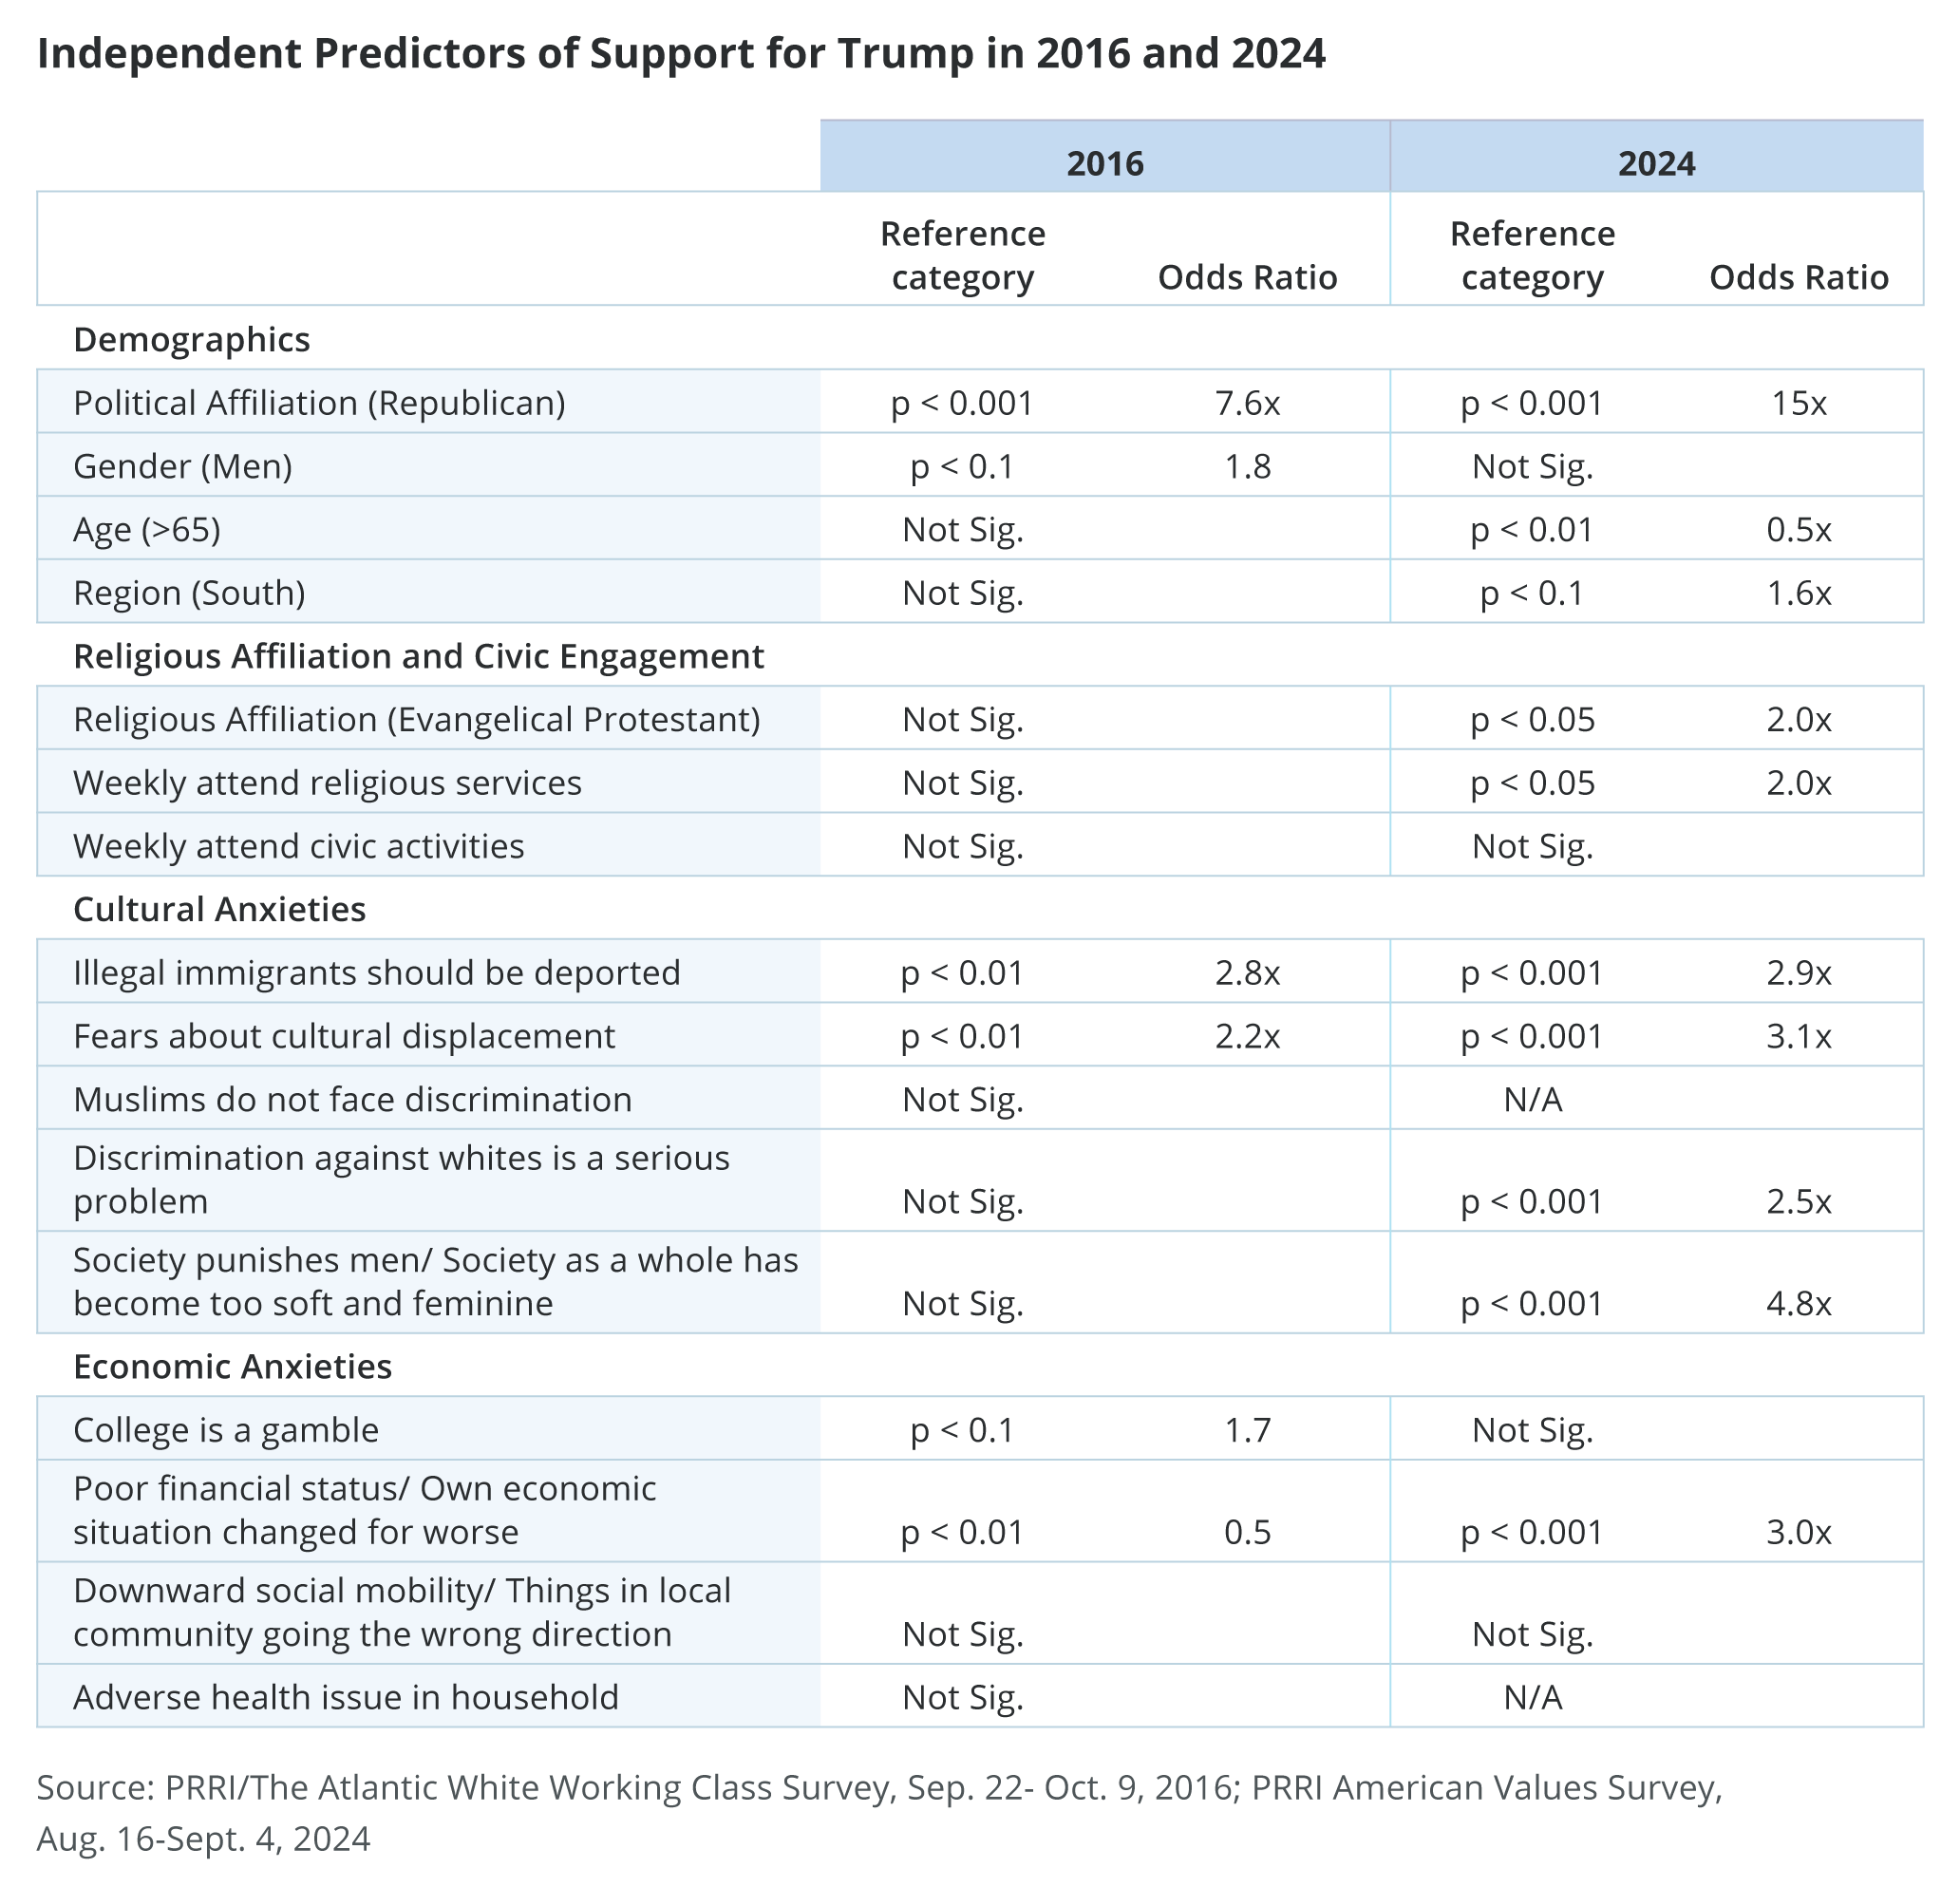
Using data from the 2024 PRRI American Values Survey, we again conducted a logistic regression model among white working-class voters to determine the roots of white-working class support for Trump, replicating as many variables as possible to the original model we conducted in 2016 or substituting similar questions.[1]
The models incorporate various demographic characteristics, including gender, age, region, Republican identity, and evangelical Protestant affiliation. Our logistic regression model also controls for the frequency of worship attendance (weekly or more) and civic engagement (weekly or more). In addition, the model accounts for cultural anxiety through indicators such as agreement with the “Great Replacement Theory” — the belief that immigrants are invading the country and replacing its cultural and ethnic identity — support for deporting immigrants, attitudes about gender, and perceptions of reverse discrimination. Finally, measures of economic anxiety are included, such as the belief that college is a gamble, as well as perceptions of a worsening personal economic situation and concerns about the local community’s future direction.
Partisanship and Demographic Factors:
- Identifying as Republican was strongly predictive of Trump support in both 2016 and 2024, although partisanship became an even stronger predictor in 2024: white working-class voters who identified as Republican were at least 15 times more likely to support Trump than those who did not identify as Republican in 2024.
- In 2016, we found that white working-class men were marginally more likely to support Trump than women, but this relationship was no longer statistically significant in 2024. Instead, in 2024, senior Americans ages 65 and older were significantly less likely than younger Americans to support Trump, while Southerners were twice as likely as non-Southerners to do so.
Religious Affiliation and Civic Engagement:
- Unlike in 2016, identifying as an evangelical Protestant and attending religious services weekly or more are now significantly related to Trump support in 2024. White working-class evangelicals and white working-class frequent religious service attenders are twice as likely as those who identify with other religious groups or attend religious services less frequently to support Trump.
Fears about Cultural Displacement and Reverse Discrimination:
- The salience of the “Great Replacement Theory” — the belief that immigrants are invading the country and replacing its cultural and ethnic identity — in driving support for Trump increased in 2024 from 2016, with those in the white working class who agree with this sentiment now three times as likely to have supported Trump. Those who oppose the idea that generations of slavery and discrimination against Black people and Native Americans have given white people unfair economic advantages were roughly three times as likely as those who do not share this view to favor Trump; in 2016, views about whether discrimination faced by white people has become a serious problem—a slightly different take on racial discrimination — did not emerge as a significant predictor.
Support for Deporting Immigrants Living in the Country Illegally:
- White working-class Americans who favor deporting undocumented immigrants remained roughly three times as likely as those who oppose this policy to express a preference for Trump in 2024, comparable to 2016.
Support for Patriarchal Views:
- Views about gender emerged as a powerful predictor in explaining support for Trump in 2024; white working-class voters who agree that society as a whole has become too soft and feminine were nearly five times as likely as those who disagree to support Trump. In contrast, the belief that “society seems to punish men just for acting like men,” another measure of patriarchal thinking, was not a driving factor for support for Trump in 2016 among the white working class.
Economic Anxieties:
- While the belief that college education is a gamble was no longer a significant factor in predicting support for Trump in 2024 as it was in 2016, white working-class Americans who perceive their personal financial situation as worse than the previous year were three times more likely to support Trump in 2024. In contrast, in 2016, individuals who perceived their personal financial situation as becoming worse were more likely to support Clinton than Trump.

Overall, our 2024 model demonstrates that partisanship remains the biggest factor in explaining support among the white working class for Donald Trump. Beyond partisanship, however, cultural anxieties remained strong predictors of white working-class Americans’ support for President Trump in 2024, particularly agreement with the “Great Replacement Theory.” Conservative views about immigration policy continued to drive support for Trump in 2024.
At the same time, the 2024 model reveals a shifting landscape with respect to the role of culture and religion in shaping white working-class support for Trump. Notably, attitudes about gender emerged as the second strongest predictor of support among the white working class in 2024. Moreover, unlike in 2016, attitudes regarding racial discrimination also helped independently explain support for Trump in 2024, as well as Christian born-again status and church attendance, with such voters being at least twice as likely as those who disagree with discrimination views, those who were not born-again, or attend church less frequently to have backed Trump.
Finally, economic concerns as they relate to support for Trump shifted as well. While concerns about whether a college education is a gamble disappeared as a significant factor driving support for Trump in 2024, those facing financial hardship were three times more likely to favor Trump in 2024. This reversed the pattern from 2016 which found that white working-class Americans facing economic hardship actually favored Clinton over Trump.
[1] To keep consistency and comparable results with 2016, PRRI ran our 2024 model with pre-election data, which included most of the same parameters examined in 2016. For robustness checks, we conducted this analysis using the 2024 PRRI Post-Election Survey with some of the same parameters, which produced largely similar results. The multivariate analysis is conducted among registered voters who reported supporting a particular candidate, including third-party candidates. Registered voters who reported being unsure of who they voted for or who refused to identify the candidate they supported were not included in the analysis.