In Middle America, Nebraskans Struggle with a Changing Cultural Landscape
Nebraska’s Political and Social Profile
Compared to the U.S. as a whole, Nebraska leans more Republican and less independent. Nationally, there are more Democrats (32%) than Republicans (25%), and more independents (41%) than either party. By comparison, just over one-third of Nebraskans (35%) identify as Republican, while around three in ten (29%) identify as Democrat. About one-third identify as independent (22%) or say they identify with a different party or express no partisan preference (12%).
Compared to older Nebraskans, younger Nebraska adults are more likely to be independent and are more equally balanced in their partisanship. One-third (33%) of young Nebraskans (ages 18-29) identify as independent, and they are equally likely to identify as Republican (24%) or Democrat (24%). Generally speaking, as age increases, the proportion of independents decreases, and Republican and Democrat numbers increase. Nebraska seniors (ages 65 and over) are nearly twice as likely as young Nebraska adults under the age of 30 to identify as Republican (47%), while 33% identify as Democrat, and only 17% identify as independent.
Nebraskans are predominantly white (83%), while just under one in ten are Hispanic (8%), 4% are black, and 5% are another race. While the number of nonwhite Nebraskans is relatively small, their characteristics differ in several meaningful ways. Nonwhite Nebraskans are significantly younger, with more than three in four (77%) under age 50, compared to 48% of white Nebraskans. Four in ten (41%) nonwhite Nebraskans were born in the state, compared to a majority (55%) of white Nebraskans. And nonwhite Nebraskans (21%) are less likely than white Nebraskans (32%) to have a college degree.
The political profiles of whites versus nonwhites are also significantly different. Among whites, 38% identify as Republican, 29% identify as Democrat, and 21% identify as independent. Among nonwhites, 22% identify as Republican, 34% identify as Democrat, and 27% identify as independent.
Nearly three-quarters (73%) of Nebraskans identify as Christians, 23% are religiously unaffiliated, and 4% identify with a non-Christian religion. Around half of Nebraskans identify as either white mainline Protestant (28%) or Catholic (24%), while fewer identify as white evangelical Protestants (13%) or as non-white Protestants (6%). Compared to the rest of the U.S.,[1] white mainline Protestants make up a much larger proportion of Nebraskans than Americans (13%). Proportions of unaffiliated Nebraskans, Catholic Nebraskans, and white evangelical Protestants are similar to their national proportions (25%, 20%, and 15% respectively).
Nearly one in ten (8%) Nebraskans report working in the meat packing or agricultural industry, and an additional 20% say they have a close friend or family member in the industry. Nebraskans with and without college degrees are similarly likely to work in the industry (6% and 9%, respectively), and Nebraskans with a college degree are more likely to say a close friend or family member works in the industry (25%) than those without a college degree (18%). Men are more likely than women to report working in the industry (13% vs. 5%). There are no meaningful racial divides between whites and non-whites for working in the industry (8% for each) or knowing someone who does (21% and 16%, respectively).
Views of President Trump
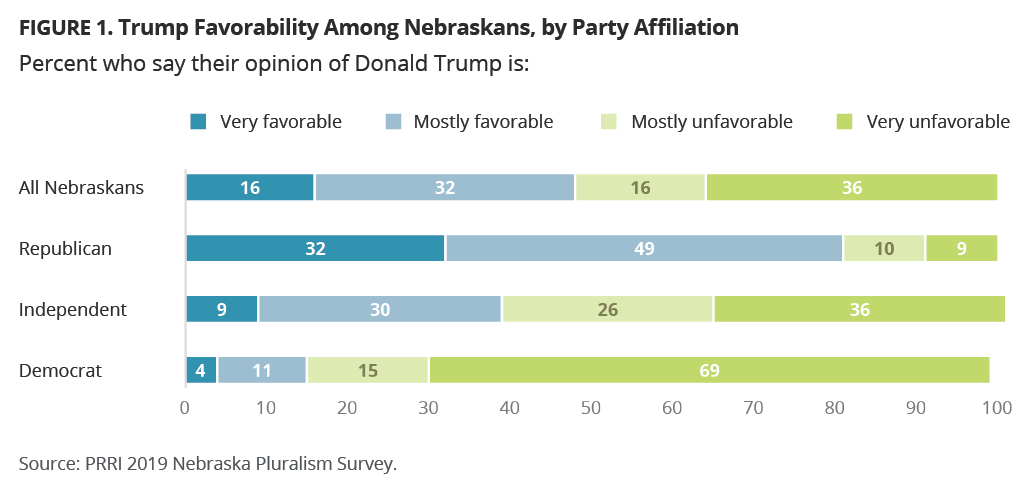
Nebraskans are divided in their opinions about President Donald Trump, with 48% who say their opinion of him is either very or mostly favorable, and 52% who say their opinion is either mostly or very unfavorable. However, there is an intensity gap: Fewer Nebraskans have very favorable views (16%) than very unfavorable views (36%).
Trump’s favorability ratings are strong among Republicans (81%), including 32% who say they hold very favorable views of him. Only 19% hold mostly or very unfavorable views. On the other side of the aisle, 84% of Democrats report negative views of Trump, including 69% of Democrats who say they have very unfavorable views of Trump. A majority (62%) of independents hold unfavorable views, compared to 39% who are favorable toward the president.
White evangelical Protestants in Nebraska are among the most favorable groups toward Trump, with more than seven in ten (72%) reporting favorable views of the president. White mainline Protestants are divided in their attitudes toward Trump (46% favorable, 54% unfavorable), but are around three times as likely to view him very unfavorably (38%) as very favorably (12%). Catholics are also fairly evenly divided, with a slim majority (52%) favorable and 49% unfavorable. Unaffiliated Nebraskans are some of the least favorable toward Trump, with around two-thirds (65%) saying they have unfavorable views, compared to 35% who hold favorable views. These attitudes toward President Trump among religious groups are similar to patterns nationwide.
White Nebraskans hold mixed views about the president. A slim majority (52%) report favorable views, while 49% say their opinion of Trump is unfavorable. Notably, there are no significant educational divides among white Nebraskans. Nonwhite Nebraskans are much less favorable toward Trump, with two-thirds (68%) saying their views of Trump are unfavorable, and around one in three (32%) saying they are favorable toward Trump.
Achieving the American Dream in Nebraska
Nebraska residents overall express a mostly positive view of life in their state. Nearly six in ten (58%) say the state is going in the right direction, while 41% say it has gotten off on the wrong track. This general optimism, however, masks large divides along racial and ethnic lines: 61% of white Nebraskans say the state is going in the right direction, compared to only 41% of non-white Nebraskans.
There are also deep partisan divides over the direction of the state, with 79% of Republicans saying it is going in the right direction, compared to 56% of independents, and just 33% of Democrats. Older Nebraskans, particularly those 65 and over (63%), but also those 50-64 (59%) and 30-49 (58%), are more positive than Nebraskans ages 18-29 (52%) about the direction of the state. Nebraskans with a college degree (64%) are more likely than those without a degree (55%) to say the state is moving in the right direction.
Just over half of Nebraskans (54%) believe that the American Dream—the idea that if you work hard, you’ll get ahead—still holds true, while more than one in three (37%) say it once held true but no longer does, and 9% say it never held true. These attitudes place Nebraskans generally in line with the country as a whole, when 50% of Americans said the American Dream still holds true.[2]
Republicans are significantly more confident than independents or Democrats about the persistence of the American Dream. More than seven in ten (71%) Nebraska Republicans believe the American dream still holds true, compared to only 26% who say it once held true but no longer does and 7% who say it never held true. By contrast, Democrats (46%) and independents (45%) are much less likely to say the American Dream still holds true today. More than four in ten Democrats (43%) and independents (43%) say it once held true but no longer goes, and around one in ten say it never held true (10% and 12%, respectively). Again, older Nebraskans are more positive, with those ages 65 and over (65%) and 50-64 (65%) more likely than those ages 30-49 (49%) and 18-29 (52%) to say the American Dream still holds true.
Nebraskans are divided about whether the American Dream is easier to achieve in Nebraska than elsewhere. Half (50%) of Nebraskans say achieving the American Dream is about as easy to achieve in Nebraska as elsewhere in the country. The other half are divided, with 27% saying it is easier to achieve in Nebraska and 22% saying the American Dream is harder to achieve in Nebraska than in the rest of the country.
Notably, there are no substantial differences by party affiliation, but there are differences by race, educational attainment, and geographic mobility. Nonwhite Nebraskans (31%) are more likely than white Nebraskans (20%) to say achieving the American Dream is more difficult in Nebraska than elsewhere. Those without a college degree (25%) are more likely than those with a college degree (16%) to say the American Dream is more difficult to achieve in Nebraska. Those who live in the community in which they grew up (27%) are more likely than those who do not (18%) to say the American Dream is harder to achieve in Nebraska.
Nebraskans are divided over whether a college education is a smart investment in the future (42%) or a gamble that may not pay off (49%). With the exception of gender and educational attainment level, attitudes do not differ on this question across demographic groups. Men (48%) are significantly more likely than women (35%) to say college is a smart investment. And a slim majority (52%) of college graduates, compared to only 37% of Nebraskans without a college degree, say it is a smart investment in the future.
Geographic Mobility and Perceptions of Community Change
More than nine in ten (94%) Nebraskans were born in the U.S., while 5% were born in another country. More than four in ten non-white Nebraskans say at least one parent (43%) or grandparent (49%) was born outside of the U.S., significantly higher than the proportion of white Nebraskans who report that at least one parent (9%) or grandparent (27%) was born in another country.
A slim majority (52%) of Nebraskans say they have spent their entire lives in the state. Another one in four (25%) have lived in the state for more than 20 years, while the remaining 23% have been in the state for fewer than 20 years. Only 13% of Nebraskans have moved to the state in the last ten years.
Nebraskans are less geographically mobile compared to Americans overall. Nearly half (46%) of Nebraskans live in the communities where they grew up, compared to only one third (33%) of Americans overall.[3] Among the 54% of Nebraskans who do not live where they grew up, 43% live within a two-hour drive of where they grew up, 14% live two to four hours away, and another 43% live more than four hours away. Younger Nebraskans ages 18-29 are most likely to still be living in the community where they grew up (65%), while around one in three (31%) seniors ages 65 and older still live in their childhood community.
Nebraskans who still live in the community where they grew up are not particularly optimistic about their communities. Among the 46% of residents who live in their childhood community, 34% say quality of life has gotten worse since they were young, and 38% say quality of life is about the same. Just one in four (26%) say quality of life has improved. These perceptions among Nebraskans closely mirror perceptions among Americans overall who still live in the community where they grew up.
Despite the relatively small proportion of foreign-born Nebraskans, one in four (24%) say their community has many new immigrants, and an additional 37% say their community has some new immigrants. Fewer than four in ten say they live in a community with only a few new immigrants (24%) or almost no new immigrants (15%).
Nebraskans who have lived in the state for fewer than 10 years (41%) are more likely than those who have lived in the state 11 to 20 years (29%), more than 20 years (22%), or have lived their entire life in the state (21%) to say there are many new immigrants in their community. Non-white Nebraskans are more likely than white Nebraskans to say they live in a community with many new immigrants (38% vs. 21%).
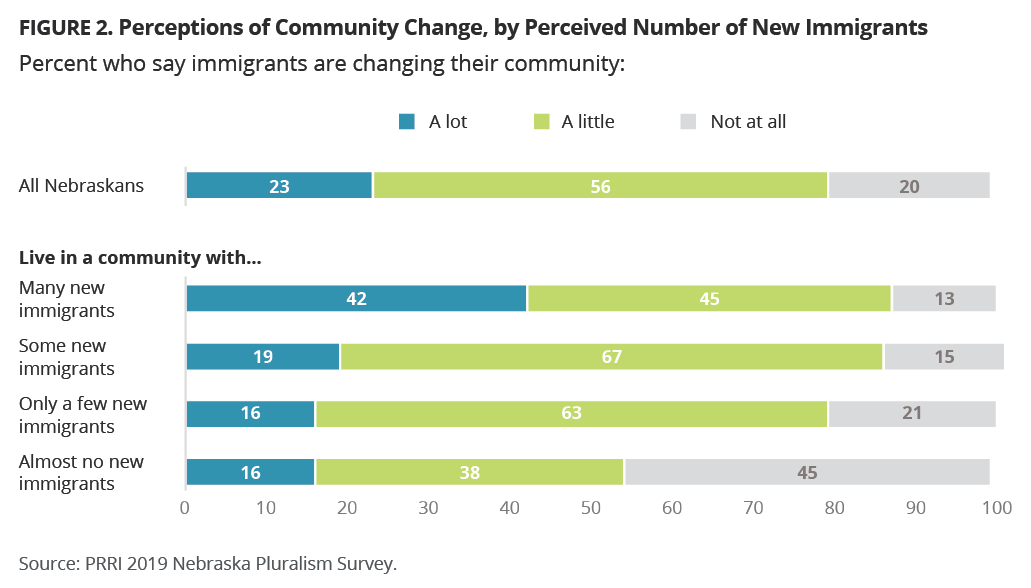
Nearly one in four (23%) Nebraskans say that immigrants are changing their communities a lot, compared to 56% who say immigrants are changing their communities a little, and 20% who say immigrants are not changing their communities at all. Nebraskans with no college degree (27%) are nearly twice as likely as those with a college degree (15%) to say immigrants are changing their community a lot. Somewhat surprisingly, there are no significant differences by partisanship on this question, with Republicans (22% a lot, 59% a little), independents (24% a lot, 57% a little), and Democrats (20% a lot, 55% a little) all expressing similar perceptions. However, partisans have very different perceptions of whether these changes are positive. Republicans (47%) and independents (42%) are more than twice as likely as Democrats (20%) to say these changes are a bad thing. Among religious groups, white evangelical Protestants stand out as the only group in which a majority (58%) say these changes to Nebraska communities are a bad thing. By contrast, majorities of white mainline Protestants (56%), Catholics (62%), and the religiously unaffiliated (76%) say these changes are mostly good.
Perceptions of how much their communities are changing are correlated with how many immigrants Nebraskans think live in their communities. More than four in ten (42%) Nebraskans who say there are many new immigrants in their community think immigrants are changing their community a lot. Less than one in five Nebraskans reporting some (19%), only a few (16%), or almost no (16%) new immigrants say immigrants are changing their community a lot. Those who say there are almost no new immigrants in their community are most likely to say immigrants are not changing their community at all (45%).
Attitudes about the impact of immigrants on local communities are also strongly correlated with the perceived magnitude of change. Among Nebraskans who say immigrants are changing their community “a lot,” 63% say the changes are a bad thing, while 37% say they are a good thing. Among those who say immigrants are changing their community “a little,” perceptions are much more positive: 73% say the changes are good, compared to only 27% who say the changes are a bad thing.
Nebraskans’ are slightly more likely to believe immigrants are changing the country than to believe they are changing their communities. Three in ten (30%) say immigrants are changing America a lot, 59% say a little, and 10% say immigrants are not changing the country at all. Among those who say immigrants are changing America a lot, 66% say the changes are a bad thing, while 34% say they are a good thing. Among those who say immigrants are only changing America a little, 72% say the changes are good, while 28% say they are bad. Notably, white evangelicals are even more concerned about how immigrants are changing America; nearly two-thirds (64%) of white evangelical Protestants say that the way immigrants are changing America is a bad thing.
Experiences with Diversity
Frequency of Interactions with Diversity
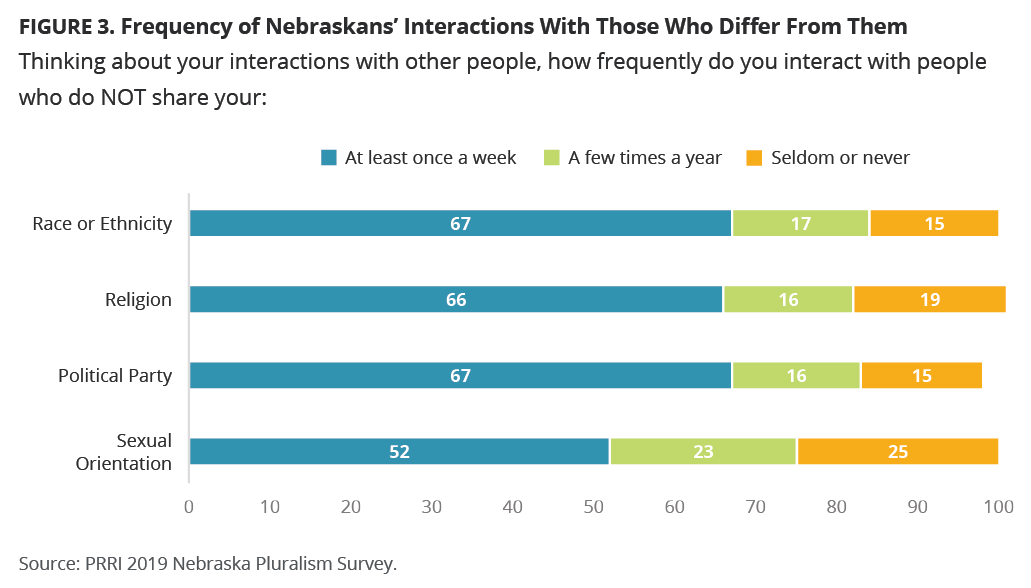
Majorities of Nebraskans say that they frequently interact with people who are of a different race or ethnicity, sexual orientation, political affiliation, or religion. Approximately two-thirds of Nebraskans say they interact at least once a week with someone who does not share their race or ethnicity (67%), political party (67%) or religion (66%). Nebraskans report less frequent interactions with someone who does not share their sexual orientation (52%). These levels of interaction are generally comparable to levels of interaction reported among all Americans.[4]
Notably, one in four or fewer Nebraskans say they seldom or never interact with someone who does not share their race or ethnicity (15%), political party (15%), religion (19%), or sexual orientation (25%).
Interactions Across Different Racial and Ethnic Backgrounds
There are notable differences between various demographic groups in the rate in which they interact with people of different racial and ethnic backgrounds. While more than two-thirds of both white (67%) and nonwhite (70%) Nebraskans say they interact with those of different racial and ethnic backgrounds on a weekly basis, nonwhite Nebraskans (12%) are more than twice as likely as white Nebraskans (5%) to say they never interact with people who do not share their racial or ethnic backgrounds.
Among white Nebraskans, whites with a college degree (76%) are more likely than whites without a college degree (62%) to say they interact with someone who does not share their race or ethnicity at least weekly. Only 8% of whites with a college degree say they seldom or never interact with someone who does not share their race or ethnicity, compared to almost one in five (18%) whites without a college degree.
Majorities across all age groups say they interact with someone who does not share their race or ethnicity at least once a week, but there is a significant break at age 50. Nearly three in four Nebraskans ages 18-29 (73%) and Nebraskans ages 30-49 (74%) say they interact with someone who does not share their race or ethnicity weekly, compared to 63% of Nebraskans ages 50-64 and 54% of Nebraskan seniors.
Nearly three in four (74%) Democrats say they interact with someone of a different race or ethnicity at least once a week, compared to 69% of independents and 64% of Republicans. Republicans (7%) and independents (8%) are more likely than Democrats (1%) to report that they never interact with someone who does not share their race or ethnicity.
Interactions Across Different Sexual Orientations
The difference in the frequency with which Nebraskans interact with people who do not share their sexual orientation is largest between young and senior Nebraskans. Young Nebraskans ages 18-29 (67%) are more likely than seniors ages 65 and older (40%) to say they interact at least once a week with someone who does not share their sexual orientation.
A little over one-third (35%) of white evangelical Protestants say they interact with people of different sexual orientations than their own at least once a week, compared to 51% of Catholics, 48% of white mainline Protestants, and 64% of religiously unaffiliated Nebraskans. Similar differences exist among Nebraskans of different political parties, Democrats (66%) are more likely than independents (53%) and Republicans (40%) to say they interact with people of different sexual orientations than their own at least once a week.
Interactions Across Party Lines
Partisan divides are narrower regarding interactions with those of different political parties. Close to eight in ten (78%) Democrats say they interact with others of different political parties at least once a week, compared to roughly two-thirds of Republicans (65%) and independents (62%). Nebraskans with college degrees (79%) are more likely than those without college degrees (62%) to say they interact with people of a different political persuasion at least once a week. The difference is wider between whites with college degrees (80%) and whites without college degrees (63%). Younger Nebraskans ages 18-29 (72%) are more likely than older Nebraskans ages 65 and over (57%) to say they interact with people of different political parties at least once a week.
Interactions Across Different Religious Identities
Those 65 and over (53%) are less likely than any other age group to say they interact with people from a different religious background more than once a week. Majorities of young Nebraskans ages 18-29 (73%), those 30-49 (70%), and those 50-64 (65%) report that they interact with people from other religious backgrounds at least weekly. Nebraskans with a college degree (77%) are more likely than those without a degree (62%) to say they interact with those of another religious background at least once a week. Differences in frequency of interactions with people of other religious backgrounds do not substantially differ by religious affiliation or party affiliation.
Location of Interactions with Diversity
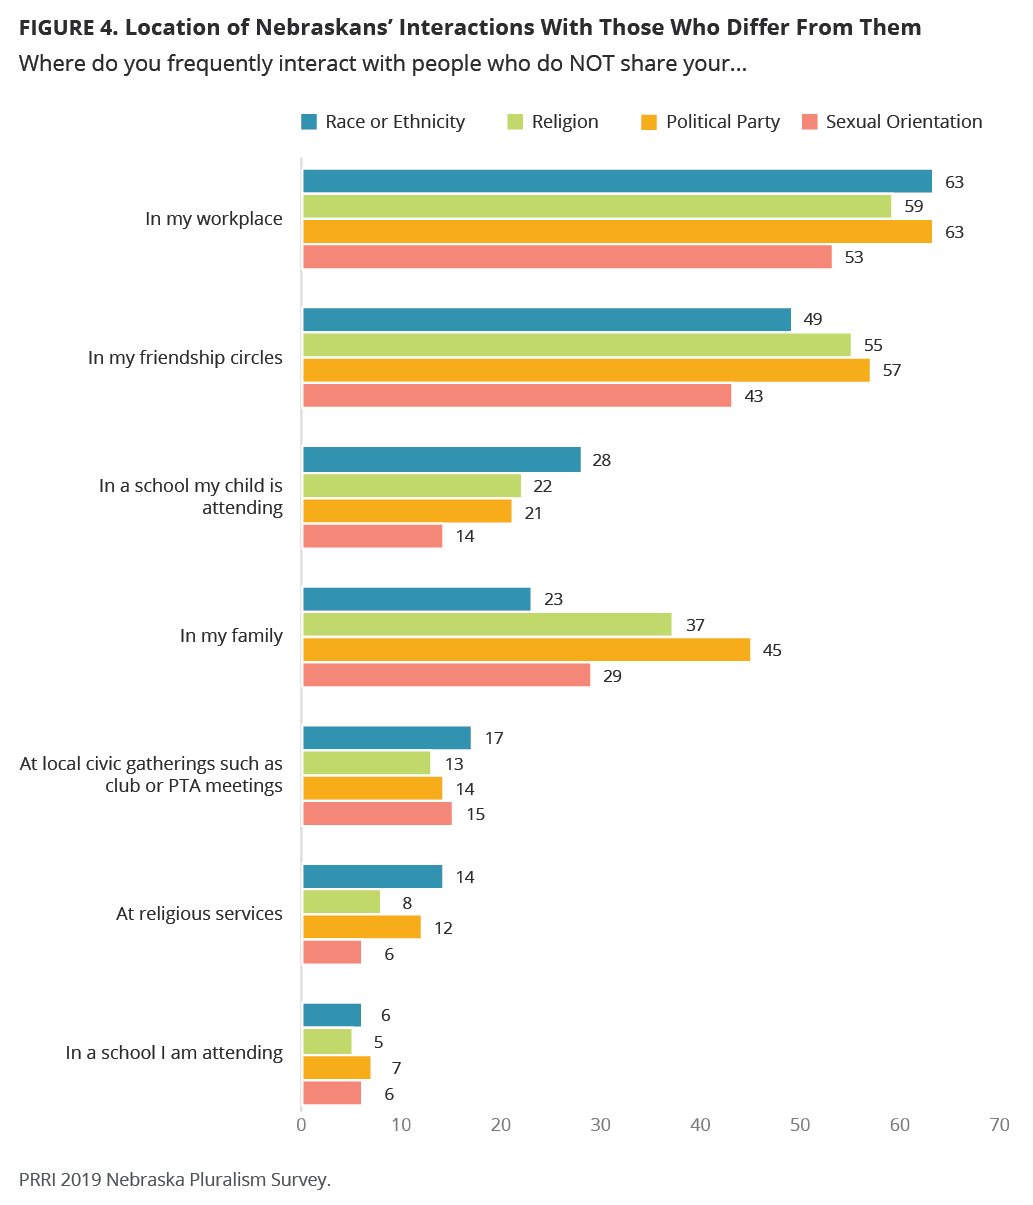
Among Nebraskans who say they have at least some interactions with people of different backgrounds, these interactions are generally more likely to occur in the workplace and in friendship circles, rather than within families, in school settings, at religious services, or in local civic gatherings.[5]
Location of Interactions across Racial or Ethnic Groups
Nearly two-thirds (63%) of Nebraskans who have at least some interactions with people of different racial and ethnic backgrounds say they have these interactions in the workplace,[6] and 49% say they have them in friendship circles. Fewer say they have these interactions at a school their child is attending (28%),[7] within their family (23%), at local civic gatherings such as a club or PTA meetings (17%), at religious services (14%), or at a school they are attending (6%).
The settings where Nebraskans say they interact with people of different racial and ethnic groups varies across several demographic groups, particularly when it comes to workplaces, friendship circles, and religious services. White and nonwhite Nebraskans report similar levels of interacting with those of different races in the workplace (63% and 65%, respectively) and friendship circles (49% each); whites (15%) are more likely than nonwhites (7%) to say they interact with others of different racial backgrounds at religious services, but these numbers are very low for both groups.
Democrats (51%) and independents (55%) are more likely than Republicans (42%) to say they interact with those of different races in their friendship circles. A majority (53%) of Democrats, compared to four in ten (41%) Republicans, also say they interact with Nebraskans of different racial backgrounds in their workplaces. Almost three in ten (27%) white evangelical Protestants and two in ten (20%) Catholics say they interact with people of different racial and ethnic backgrounds at religious services; more than white mainline Protestants (9%).
Location of Interactions Across Religious Identities
In a similar manner, Nebraskans who have at least some interactions with people of different religious backgrounds are most likely to say these interactions happen in the workplace (59%), in friendship circles (55%), or in their family (37%). Interactions with people of different religious backgrounds are less likely to happen at a school their child is attending (22%), in civic gatherings (13%), at religious services (8%), or at a school they are attending (5%).
Whites (39%) are more likely than nonwhites (29%) to report interacting with people of different religious backgrounds within their family. The religiously unaffiliated are more likely than other religious groups to report that they interact with people of different religious identities within their family (53%) and at work (71%).
Location of Interactions across Party Lines
Compared to other interactions with diversity, Nebraskans are more likely to report interacting with people of different political parties or religious backgrounds within their family (45%), although these interactions are still most common in the workplace (63%) or among friends (57%). They are less likely to report interacting with people who have different political affiliations at a school their child is attending (21%), civic gatherings (14%), religious services (12%), or a school they are attending (7%).
Republicans (53%) and Democrats (57%) say their interactions with others of different political parties occur within their friendships circles at similar rates, but independents (63%) are more likely than partisans to say they interact with others of different political parties within their friendships circles. Democrats (56%) are more likely than independents (47%) and Republicans (39%) to say these interactions happen in their workplaces.
White Nebraskans (60%) are more likely than nonwhite Nebraskans (42%) to report interacting with people of different political parties in their friendship circles. The religiously unaffiliated (77%) are also more likely than Catholics (63%), white evangelical Protestants (60%), and white mainline Protestants (55%) to say they interact with people of different political parties in their workplaces.
Location of Interactions across Different Sexual Orientations
Similarly, Nebraskans are most likely to say their interactions with those who do not share their sexual orientation occur in the workplace (53%) or in friendship circles (43%). Approximately three in ten (29%) say these interactions happen within their family, while significantly fewer say these interactions happen at local civic gatherings (15%), at a school their child is attending (14%), at religious services (6%), or at a school they are attending (6%).
No notable differences exist between white and nonwhite Nebraskans and the places where they interact with others of different sexual orientations. Among whites, those with college degrees (47%) are more likely than those without college degrees (37%) to say they interact with people who do not share their sexual orientation at work.
Democrats (48%) and independents (55%) report that they interact with people who do not share their sexual orientation within their friendship circles at higher rates than Republicans (28%). Democrats (64%) and independents (55%) are also more likely than Republicans (43%) to say these interactions occur in their workplaces.
Tenor of Interactions with Diversity
When asked about the tenor of their interactions with people from different backgrounds, most Nebraskans characterize these interactions as at least somewhat positive.
More than six in ten Nebraskans say their interactions with people who do not share their race (69%), religion (62%), or sexuality (61%) are somewhat or mostly positive. However, just under half of Nebraskans (49%) say their interactions with others who do not share their political affiliation are at least somewhat positive. About three in ten Nebraskans characterizing their interactions with people who do not share their religion (31%), sexual orientation (31%), or political party (32%) as neither positive nor negative; fewer (25%) Nebraskans say their interactions with people of different races and ethnicities are neither positive or negative.
Nebraskans are much less likely to report their interactions with others of different racial or ethnic backgrounds (5%), religions (5%), and sexualities (6%) are somewhat or mostly negative. However, nearly one in five Nebraskans (18%) say their interactions with people of different political affiliations are at least somewhat negative.
Republicans (58%) are more likely than Democrats (49%) and independents (50%) to say their experiences with people of different political parties are at least somewhat positive. Conversely, Democrats (22%) are more likely than Republicans (16%) and independents (15%) to say that their experiences with those of differing political parties are somewhat or mostly negative.
Majorities of white evangelical Protestants (61%), white mainline Protestants (63%), and Catholics (67%) say their interactions with people of a different religion is at least somewhat positive. By contrast, religiously unaffiliated Nebraskans (53%) are less likely to report positive interactions. Notably, both white evangelical Protestants (8%) and the religious unaffiliated (11%) are more likely than white mainline Protestants (2%) and Catholics (3%) to report that interactions with those of a different religion are at least somewhat negative.
Some demographic differences are consistent across assessments of interactions with those of different races or ethnicities, sexual orientations, political parties, or religions. Whites with a college degree are more likely than whites without a college degree to report positive interactions with people of different racial (80% vs. 64%), sexual (74% vs. 55%), political (60% vs. 44%), and religious (72% vs. 59%) backgrounds to be at least somewhat positive. Younger Nebraskans ages 18-29 are more likely than those ages 65 and over to report positive interactions with people of different races and ethnicities (76% vs. 64%) and sexualities (75% vs. 48%). Notably, whites and nonwhites do not have any notable differences in their assessments of interactions with people of different racial, sexual, political, and religious backgrounds.
Nebraskans who have interactions with people of a different religion in the workplace (72% at least somewhat positive) are more likely than those who have not had such interactions in their workplace (67%) to say those interactions are at least somewhat positive. Workplace interactions do not significantly impact the tenor of interactions with people of different races, sexual orientations, or political parties.
Diversity and Social Interactions
One in four Nebraskans say they are somewhat or very likely to consider a person’s sexual orientation (26%) or political affiliation (25%) when deciding whether or not to spend time socially with other people. Fewer Nebraskans say they are at least somewhat likely to consider religion (18%) or race and ethnicity (15%) when deciding whether or not to spend time with someone. There are few demographic differences on this question.
Nonwhite Nebraskans (30%) are more likely than white Nebraskans (12%) to say race is something that they take into consideration before deciding whether to spend time with another person. Young Nebraskans ages 18-29 (25%) are also more likely than seniors ages 65 and over (14%) to say they are somewhat likely to consider race in spending time with another person.
Almost four in ten (38%) white evangelical Protestants say they are at least somewhat likely to consider sexual orientation when deciding whether or not to spend time with someone. Only 20% of the religiously unaffiliated and 20% of white mainline Protestants say the same, with Catholics (27%) in between. White Nebraskans (24%) are less likely than nonwhite Nebraskans (37%) to say they are somewhat or very likely to consider someone’s sexual orientation before deciding whether or not to spend time with them.
When thinking about whether to spend social time with someone, political party is an attribute likely to be considered across a range of demographic groups. Among political parties, Democrats (30%) are more likely than Republicans (24%) to say that they are at least somewhat likely to consider a person’s political party before deciding whether or not to spend time with that person. Only 18% of independents say they are somewhat or very likely to consider partisanship in deciding whether to spend time with a person.
Nonwhite Nebraskans are more than twice as likely as white Nebraskans to consider a person’s political affiliation before making plans with them (43% vs. 20%). Among whites, those with college degrees (26%) are more likely than those without college degrees (17%) to say they consider someone’s political affiliation before deciding to spend time with them. Nearly three in ten (28%) religiously unaffiliated Nebraskans and one in four white evangelical Protestants (25%) report that they are at least somewhat likely to consider political affiliation, compared to 20% of Catholics and 17% of white mainline Protestants. Younger Nebraskans (31%) are also significantly more likely than seniors (21%) to say they consider political affiliation in choosing their company.
White evangelical Protestants (25%) and the religiously unaffiliated (22%) are more likely than Catholics (16%) and white mainline Protestants (10%) to say they are somewhat or very likely to consider someone’s religion before deciding to spend time with that person. Again, younger Nebraskans ages 18-29 (28%) are more likely than seniors ages 65 and over (13%) to say they are somewhat or very likely to consider religion in decisions to spend time with someone.
Concerns About a Son or Daughter Marrying Someone from a Different Background
Few Nebraskans overall report that they would be somewhat or very unhappy if their child married someone of a different racial (10%) or religious (13%) background from their own. Similarly, few Nebraskans report they would be at least somewhat unhappy if their child married a Democrat (15%) or a Republican (11%). However, Nebraskans report higher levels of concerns about their son or daughter marrying someone of the same gender (31%) or someone who is transgender (43%).
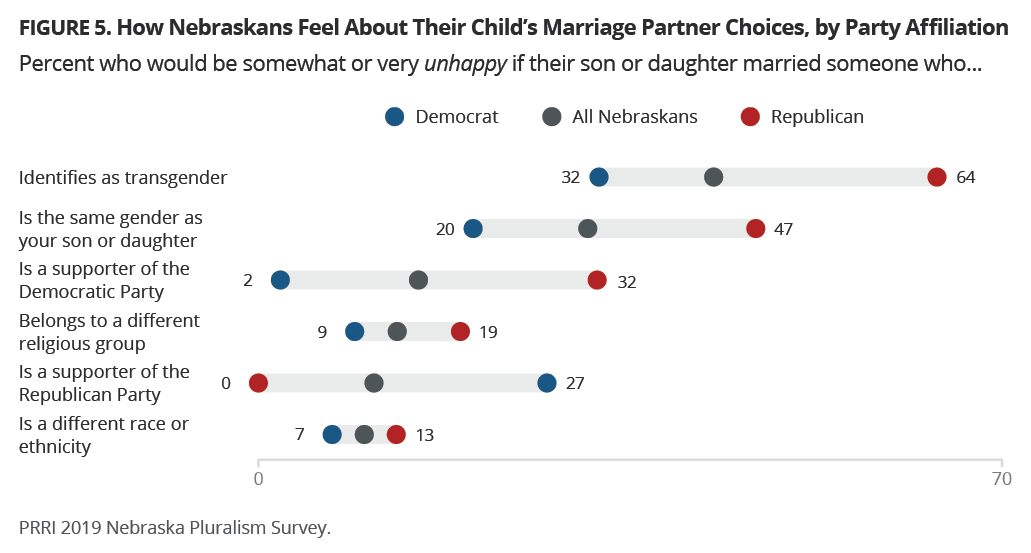
Almost half (47%) of nonwhite Nebraskans, compared to 37% of white Nebraskans, say they would be somewhat or very happy if their child married someone of another race. There is no difference between these two groups on being somewhat or very unhappy about such a situation (10% and 8%, respectively). There is also a substantial generational divide between Nebraska seniors and younger Nebraskans. Almost half (49%) of Nebraskans ages 18-29, and about four in ten of those ages 30-49 (41%) and 50-64 (38%) say they would be happy if their child married someone of a different race. Only 25% of seniors ages 65 and over agree. Nebraskans 65 and older are more likely to say they would be at least somewhat unhappy (25%) if their son or daughter were to marry someone of a different race than are 18-29-year-olds (2%), those ages 30-49 (8%), and those ages 50-64 (8%).
About one-third of Nebraskans ages 18-29 (35%) and ages 30-49 (33%) say they would be happy if their child married someone of the same gender, compared to less than one in four of those ages 50-64 (26%) and seniors ages 65 and over (18%). Among religious groups, white evangelical Protestants (62%) are at least twice as likely as other groups—the religiously unaffiliated (17%), white mainline Protestants (27%), and Catholics (30%)—to say they would be somewhat or very unhappy if their child married someone who is the same gender. A plurality of white evangelical Protestants (42%) say they would be very unhappy if their son or daughter married someone who is their same gender. Nearly half (47%) of Republicans, compared to only about one in five independents (21%) and Democrats (20%) say they would be at least somewhat unhappy if their child married someone of the same gender.
Nearly two-thirds (65%) of Nebraska seniors ages 65 and older and a majority (54%) of those ages 50-64 say they would be at least somewhat unhappy if their child married someone transgender, compared to only one-third (33%) of those ages 30-49 and only about one in four (26%) of those under the age of 30. Seven in ten (70%) white evangelical Protestants say they would be somewhat or very unhappy if their child married someone who is transgender, compared to pluralities of white mainline Protestants (45%) and Catholics (42%), and only 28% of religiously unaffiliated Nebraskans.
About one-third (32%) of Nebraska Republicans say they would be at least somewhat unhappy if their son or daughter married a supporter of the Democratic Party, a view shared by Republicans nationwide (35%). Notably, Nebraska Democrats are significantly less likely than Democrats nationwide to say they would be at least somewhat unhappy about their child marrying a Republican (27% vs. 45%). Among religious groups, white evangelical Protestants stand out—nearly four in ten (38%) say they would be at least somewhat unhappy about their son or daughter marrying a Democrat. No other religious group expresses opinions this strongly about their child marrying either a Democrat or a Republican.
Younger Nebraskans stand out in reporting high levels of happiness when asked how they would feel if their son or daughter married someone of a different religion, but similarly small proportions of Nebraskans ages 18 to 19 or 30 to 49 say they would be unhappy if their son or daughter married someone of a different religion (16% and 12%, respectively). Among religious groups, white evangelical Protestants (40%) are more likely than the religiously unaffiliated (8%), white mainline Protestants (8%), and Catholics (9%) to say they would be somewhat or very unhappy if their child married someone of a different religion. Republicans (19%) are more than twice as likely as independents (9%) and Democrats (9%) to say they would be unhappy if their child married someone of a different religious background.
How Family Interactions Impact Concerns about Children Marrying Someone from a Different Background
Nebraskans who report interacting with people of different backgrounds within their families are generally more likely to report being happy about their child marrying someone of a different background.
Those who interact with someone of a different race or ethnicity in their family are more likely than those who do not to say they would be somewhat or very happy if their child married someone of a different race or ethnicity (55% vs. 35%). Just 4% of Nebraskans who do have these interactions would be somewhat or very unhappy, compared to 11% among those who do not have interactions.
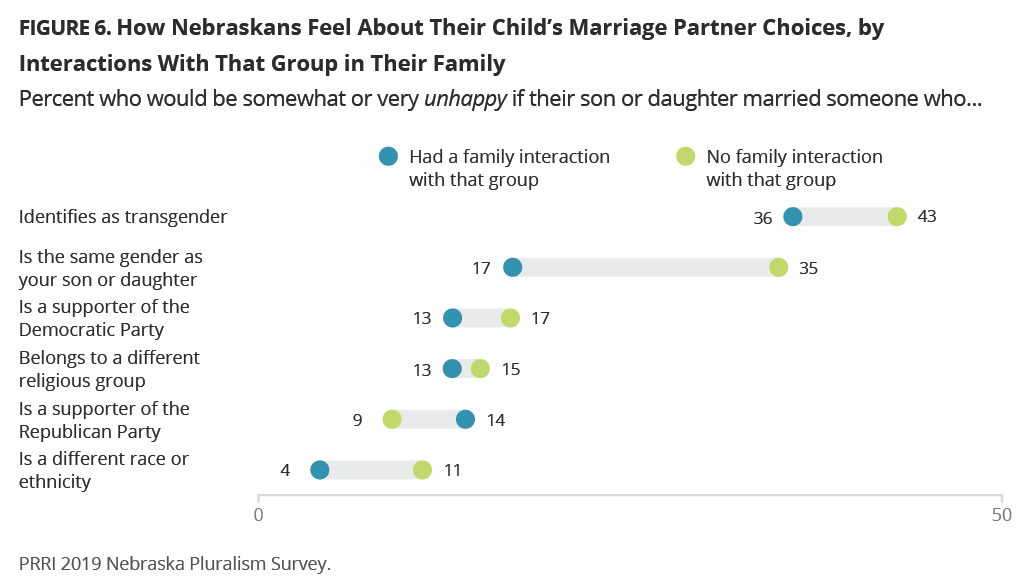
The same holds true of Nebraskans who interact with people of different sexual orientations in their family, with 40% saying they would be happy if their child married someone of the same gender, compared to 26% of those who do not experience these interactions in their family. The gap is narrower regarding their child marrying someone who is transgender, but those who interact with someone who is transgender in their family are more likely than those who do not to say they would be happy if their child married someone who is transgender (31% vs. 21%). Nebraskans are more than twice as likely to report that they would be unhappy about their child marrying someone of the same sex if they have not had a family interaction with someone of a different sexual orientation (35% vs. 17%). The same holds true to a lesser degree for their child marrying someone who is transgender; among Nebraskans who have not had a family interaction with someone of a different sexual orientation, 43% say they would be unhappy if their son or daughter married someone transgender, compared to 36% of those who have had such family interactions.
Partisan interactions within families, however, do not impact views about marriages across party lines. Around one-third of Nebraskans say they would be unhappy if their child married a Democrat regardless of whether they interact with people from other political parties in their family (13%) or not (17%). This also holds true for children marrying a Republican: 14% of Nebraskans who interact with people from a different party in their family would be unhappy for their child to marry a Republican, compared to 9% of those who do not interact with someone from a different party.
Family interactions with someone of a different religion are not as closely tied to increased happiness cross-religious marriages. More than one-third (36%) of Nebraskans who interact with someone of a different religion in their family say they would be happy if their child married someone of a different religion, compared to 30% who do not have the same interactions. Almost equal proportions of Nebraskans say they would be unhappy, regardless of whether they have had a family interaction (13%) or not (15%).
Support for Pluralism as a Desired Goal
Preferences for Religious Diversity
When asked to place themselves on a scale between two statements about religious pluralism, a plurality (43%) of Nebraskans choose or lean toward the pro-religious diversity statement: “I would prefer the U.S. to be made up of people belonging to a wide variety of religions.” Less than one in five (18%) choose or lean toward “I would prefer the U.S. to be a nation primarily made up of people who follow the Christian faith,” and 39% are in the middle.[8] There is no difference between those who report at least weekly interactions with people of other religions and those who do not have such interactions.
Sharp divisions exist between religious groups on this question. More than two-thirds (68%) of religiously unaffiliated Nebraskans prefer the U.S. to be religiously diverse, compared to about four in ten Catholics (41%) and white mainline Protestants (38%) and only 13% of white evangelical Protestants. At the opposite end of the spectrum, more than four in ten (43%) of white evangelical Protestants say they prefer the U.S. to be a majority Christian nation. Only 3% of the religiously unaffiliated, 16% of Catholics, and 19% of white mainline Protestants say the same. More than four in ten white evangelical Protestants (44%), white mainline Protestants (42%), and Catholics (42%) fall in the middle, compared to three in ten of the religiously unaffiliated (30%).
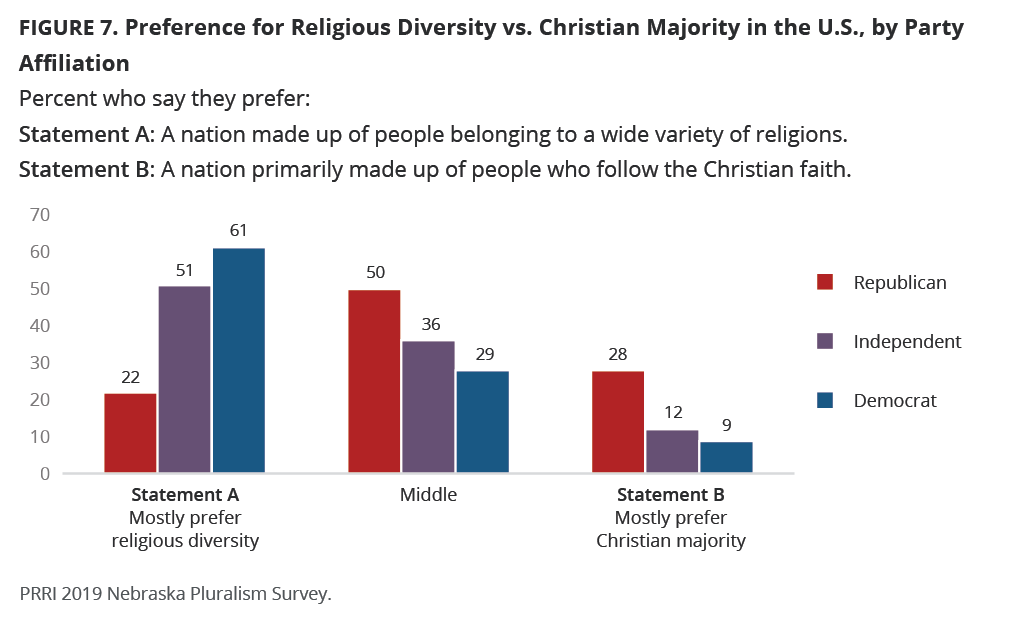
Democrats (61%) are almost three times as likely as Republicans (22%) to say they mostly prefer a religiously diverse country. A slim majority (51%) of independents also prefer a religiously diverse America. Close to three in ten (28%) Republicans say they would prefer to live in a nation with a Christian majority, compared to just 9% of Democrats and 12% of independents. Half (50%) of Republicans fall in the middle, preferring a U.S. that is neither mostly religiously diverse nor exclusively made up of Christians, as do nearly three in ten (29%) Democrats and more than one-third (36%) of independents.
Nonwhite Nebraskans (51%) are more likely than white Nebraskans (40%) to prefer a religiously diverse country. A majority (57%) of 18-29-year-olds say they would prefer the U.S. to be religiously diverse, compared to around four in ten of those ages 30-49 (42%) and 50-64 (39%), and only a third (32%) of those 65 and older. Nearly one-third (31%) of seniors say they would prefer they U.S. to be mostly made up of Christians, compared to just 15% of those ages 18-29.
Preferences for Racial and Ethnic Diversity
Using the same scale setup, almost half (48%) of Nebraskans report that they would prefer the U.S. to be a nation made up of people from around the world, compared to just 7% who believe the U.S. should be mostly made up of people from western Europe. Four in ten (44%) Nebraskans place themselves in the middle of these two options.[9] Again, there is no difference between those who report at least weekly interactions with people of other races or ethnicities and those who do not have such interactions.
Majorities of Democrats (61%) and independents (56%) prefer the U.S. to be a nation made up of people from around the world, compared to 32% of Republicans. A majority (57%) of Republicans fall in the middle of the scale.
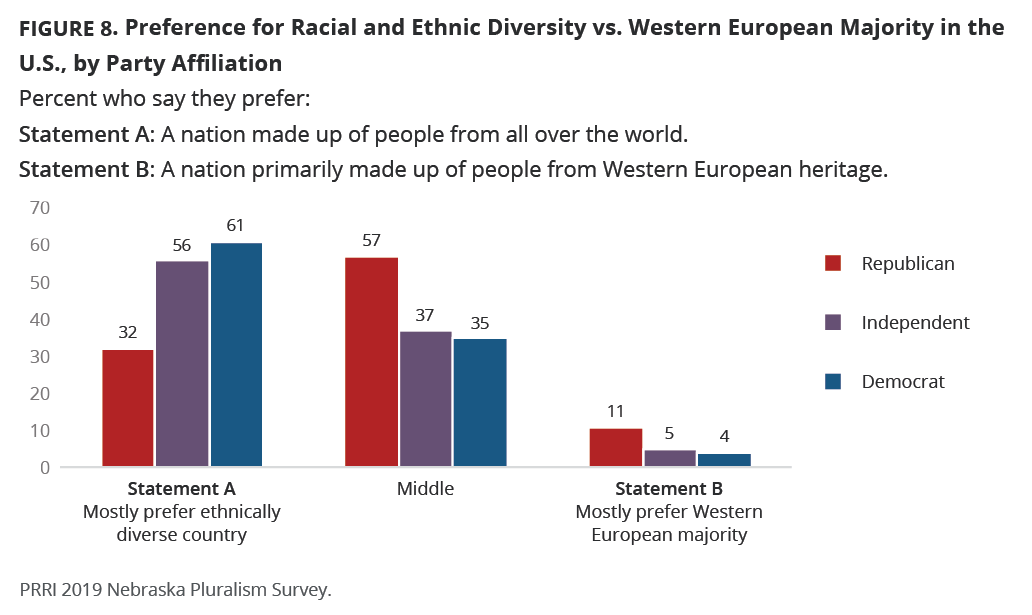
A majority (57%) of nonwhite Nebraskans believe the U.S. should be made up of people of a variety different racial and ethnic groups, compared to a plurality (46%) of white Nebraskans. Fewer white (47%) and nonwhite Nebraskans (33%) fall in the middle of the scale.
Young Nebraskans (56%) are more likely than those ages 30-49 (45%), 50-64 (49%), and 65 and over (43%) to say they prefer the U.S. to be a nation of people from all around the world. However, few Nebraskans across any age group say they prefer the country to be mostly made up of people of Western European heritage.
Perceptions of Diversity as a Strength for the Country
Seven in ten (70%) Nebraskans agree that the country’s diverse population, with people of many different races, ethnicities, religions, and backgrounds, makes the country stronger. One-quarter (25%) say this diversity makes the country neither stronger nor weaker, and only 6% say it makes the country weaker.
While majorities of all partisan groups say the country’s diverse population is a strength, Democrats (90%) are more likely than independents (70%) and Republicans (63%) to express this view. Independents (25%) and Republicans (28%) are more likely than Democrats (8%) to view diversity in the U.S. as neither a strength or a weakness.
When asked about whether diversity in Nebraska is a strength or a weakness, results are mostly the same. Nearly two-thirds (64%) of Nebraskans say that diversity makes their state stronger, while 28% say diversity does not make Nebraska stronger or weaker, and 8% say it makes Nebraska weaker.
What it Means to be “Truly American”
When asked how important certain characteristics or beliefs are to being “truly American,” large majorities of Nebraskans agree that several characteristics are fundamental to being American, but are divided on others. Overwhelming majorities of Nebraskans say that believing in individual freedoms, such as freedom of speech (94%), respecting American political institutions and laws (92%), accepting people of diverse racial and religious backgrounds (91%), and being able to speak English (82%) are traits necessary to make one “truly American.”
Across political parties Nebraskans agree that three traits are necessary to being truly American. Substantial majorities of Republicans (97%), independents (90%), and Democrats (89%) agree that respecting American political institutions and laws is somewhat or very important. There is also partisan agreement on believing in individual freedoms such as freedom of speech (95% of Republicans and independents, and 94% of Democrats), and accepting people of diverse racial and religious backgrounds (91% of Republicans, 94% of independents, and 92% of Democrats) are somewhat or very important for being truly American. There is more partisan division regarding being able to speak English, but majorities of Republicans (90%), independents (85%), and Democrats (72%) agree that is somewhat or very important to American identity.
After the traits identified above, Republicans are most likely to say that believing capitalism is the best economic system (79%), believing in God (76%), being a Christian (69%), and being born in America (64%) are somewhat or very important to being truly American. In comparison, less than half of Democrats say that believing capitalism is the best economic system (49%), believing in God (43%), being a Christian (33%), and being born in America (41%) are somewhat or very important to being truly American. There are no other traits that a majority of Democrats deem important to being truly American beyond those listed above.
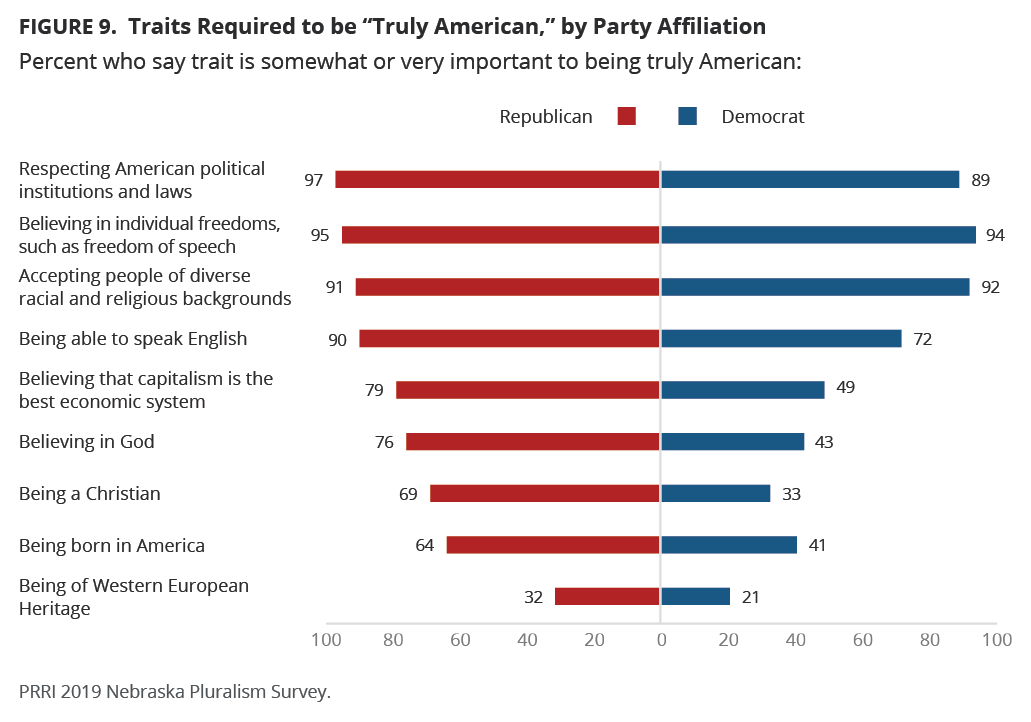
Nebraskans are more divided on other characteristics. Six in ten (61%) Nebraskans agree that believing that capitalism is the best economic system is somewhat or very important for being truly American, while 38% say this is not too important or not at all important. A majority (57%) of Nebraskans say that believing in God is somewhat or very important for being American. A slim majority (52%) of Nebraskans agree that being born in America is somewhat or very important for being truly American, while 48% say this is not too important or not at all important.
Just under half (48%) say that being a Christian is somewhat or very important for being truly American, while a slim majority (52%) say it is not too important or not at all important. Only one in four (25%) Nebraskans say that being of Western Heritage is somewhat or very important to being an American, compared to a large majority (75%) who say it is not very or not at all important.
Perceptions of So-called “Reverse Discrimination” Against Whites
A plurality (46%) of Nebraskans agree that discrimination against whites has become as big a problem as discrimination against black people and other minorities, compared to almost as many (44%) who disagree. A majority (58%) of Republicans agree that so-called “reverse discrimination” is happening to whites, compared to a third (33%) who disagree. On the opposite end, only three in ten (29%) Democrats agree that white people are experiencing discrimination at rates similar to nonwhites, and two-thirds (66%) disagree. Independents are more divided, as 46% agree and 43% disagree that discrimination against whites is as big a problem as discrimination against nonwhites.
A plurality of white Nebraskans (47%) believe that they are discriminated against at rates comparable to nonwhites, while 43% disagree. Only 37% of nonwhite Nebraskans agree, compared to a majority (56%) who do not think whites are facing as much discrimination as blacks and other minorities. Among religious groups, nearly six in ten (59%) white evangelical Protestants and pluralities of white mainline Protestants (49%) and Catholics (47%) say that reverse racism is real, compared to only 31% of the religiously unaffiliated who say the same.
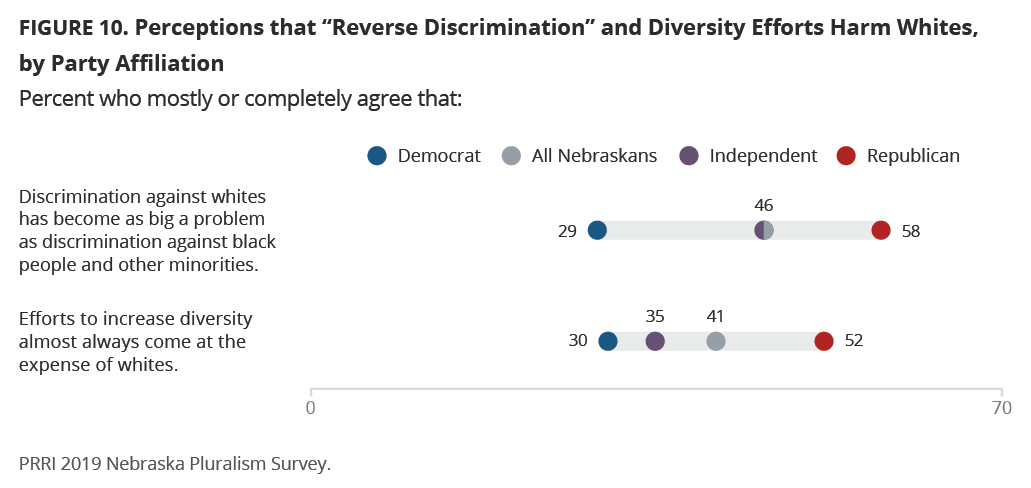
Four in ten (41%) Nebraskans mostly or completely agree that efforts to increase diversity almost always come at the expense of whites, but a majority (59%) disagree. A slim majority (52%) of Republicans agree that whites are harmed by efforts to increase diversity, but only 35% of independents and three in ten (30%) Democrats agree. Seven in ten (70%) Democrats and nearly two-thirds (64%) of independents mostly or completely disagree that whites are negatively impacted by diversity, compared to under half (48%) of Republicans.
Nonwhite Nebraskans are less likely than white Nebraskans to agree that diversity negatively impacts whites (28% vs. 43%). Nearly three in four nonwhites (73%) reject the idea that efforts to increase diversity come at the expense of whites, compared to a smaller majority (56%) of white Nebraskans. Not surprisingly, white evangelical Protestants are the most likely to agree with the claim (55%), compared to less than half of Catholics (46%) and white mainline Protestants (40%). The religiously unaffiliated (28%) are least likely to agree.
Fears about Foreign Influence, Perceptions of Islam, and Cultural Alienation
Majorities of Nebraskans believe that the American way of life needs to be protected from foreign influence (57%) and that the values of Islam are at odds with American values and way of life (57%). Just under half (48%) of Nebraskans say that social change has caused them to feel like a stranger in the U.S.
All three items show similar partisan divides. Seven in ten (70%) Republicans say that the U.S. needs to be protected from foreign influence, compared to just over half (52%) of independents and 42% of Democrats. Three in four (75%) Republicans think that Islam is at odds with American values, compared to a slim majority (52%) of independents and 42% of Democrats. A majority (55%) of Republicans say they feel like a stranger in the U.S., as do 48% of independents and 37% of Democrats.
A majority of white Nebraskans (59%) think the U.S. needs to be protected from foreign influence, compared to just over four in ten (42%) nonwhite Nebraskans. Similarly, 59% of white Nebraskans, compared to 48% of nonwhites, say Islam is in conflict with American values. While there are no substantial gaps between white (49%) and nonwhite (44%) Nebraskans on whether they feel like a stranger in the U.S., there are significant differences among whites by education level. A majority (53%) of white Nebraskans without a college degree, compared to only 40% of those with a college degree, agree that they often feel like a stranger in their own country.
Division and Solidarity in the Country
Race, Politics, and Religion: How Divided are Americans?
Most Nebraskans say that Americans are somewhat or very divided by race and ethnicity (79%). Large majorities of both white (79%) and nonwhite (81%) Nebraskans agree, but the intensity with which they agree differs. Nonwhites (37%) are significantly more likely than whites (29%) to say that Americans are very divided over race and ethnicity. White Nebraskans differ by education, however: whites with college degrees (83%) are more likely than whites without college degrees (77%) to say that Americans are somewhat or very divided by race.
Nearly all (95%) Nebraskans say the country is somewhat or very divided over politics, and three in four (75%) say the country is very divided. Partisanship does not matter here: super-majorities of Democrats (98%), Republicans (96%), and independents (94%) all agree. Democrats (79%) are more likely than independents (69%) to say that Americans are very divided. Republicans are in between, with 75% saying the country is very divided by politics.
More than three in four (77%) Nebraskans think Americans are somewhat or very divided over religion. White evangelical Protestants (84%) are the most likely to agree that Americans are divided by religion, while white mainline Protestants are the least likely to agree (66%). Catholics (79%) and the religiously unaffiliated (76%) fall in between.
Can Americans Come Together to Address Problems?
Most Nebraskans believe that Americans can come together across racial lines to solve the country’s problems. About three in four (74%) Nebraskans are optimistic that Americans can do this, compared to just one in four (26%) who are pessimistic. Majorities of whites (75%), nonwhites (69%) and whites with and without college degrees (76% and 74%) say that race is a surmountable divide.
A substantial majority (72%) of Nebraskans are also optimistic that Americans of different religious groups can come together to solve the country’s problems, while a smaller percentage of Nebraskans are pessimistic (28%). There are no large differences by religious affiliation. White evangelical Protestants (76%), white mainline Protestants (74%), Catholics (74%), and the religiously unaffiliated (67%) are roughly equally likely to say Americans can overcome religious differences.
Nebraskans are much less likely to think that Americans can get past political differences. A majority are pessimistic (57%) that Americans with different political views can come together to solve the country’s problems, and just four in ten (43%) Nebraskans think it is possible to bridge partisan divides. Majorities of Republicans (61%), Democrats (60%), and independents (55%) say they are pessimistic about American coming together across political divides.
Are Institutions Pushing Us Apart or Bringing Us Together?
When asked whether each type of institution is bringing the country together or pulling it apart, more Nebraskans say community organizations and nonprofits (64%), public schools (50%), colleges and universities (49%), workplaces (49%), religious organizations (43%), and the military (41%) are doing more to bring people together than say they are pushing people apart. However, large majorities of Nebraskans believe that political parties (83%) and the media (72%) are doing more to push people apart than bring them together.
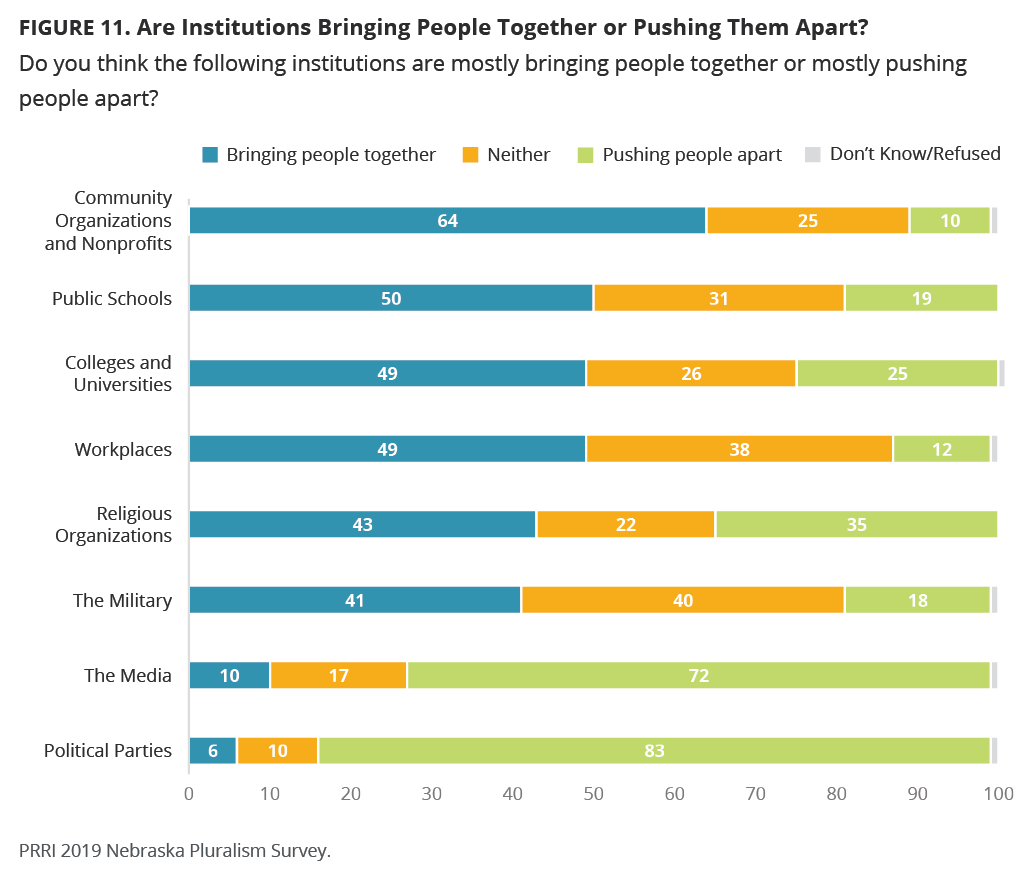
Republicans (45%) are less likely than Democrats (60%) to say that public schools are bringing Americans together. Fewer Republicans (39%) than Democrats (60%) say the same about colleges and universities. Neary four in ten (37%) Republicans believe colleges and universities are pushing people apart.
Republicans are more likely than Democrats to say religious organizations and the military are doing more to bring the country together. A majority (55%) of Republicans believe that religious organizations are doing more to bring people together, and 50% say the same about the military. By comparison, 32% of Democrats believe that religious organizations are bringing people together, and 37% of Democrats say the same about the military.
The largest differences of opinion by age concern the impact of religious organizations and colleges and universities. Half (50%) of Nebraskans ages 65 and over say that religious organizations are bringing people together, compared to just over one in three (36%) young Nebraskans ages 18-29. Nebraskans ages 30-49 and 50-64 are in between, with 43% of each saying religious organizations bring people together. Seniors 65 and older (36%) are less likely than any other age group to say colleges and universities are doing more to bring people together than push people apart. A majority (56%) of those ages 18-29, and about half of those 30-49 (49%) and 50-64 (50%), think colleges and universities are bringing people together.
White Nebraskans (51%) are more likely than nonwhites (38%) to say workplaces are bringing people together, and the same is true of their assessments of whether the military is bringing people together (45% of whites and 23% of nonwhites). Nonwhite Nebraskans (57%) also take a slightly less positive view than whites (65%) of whether community organizations and nonprofits bring people together.
Civic Engagement Among Nebraskans
Less than half (45%) of Nebraskans have taken action on a civic or political issue. The most common forms of action include signing a petition (22%), sharing an opinion about a town or community issue (18%), commenting about politics online (13%), contacting a government official (12%), or serving on a committee for a community organization (7%). Fewer than one in ten have attended a protest or rally (4%), written a letter to a newspaper (3%), volunteered for a presidential campaign (2%) or another campaign (1%), or held elected office (1%).
How Divided are Nebraskans on Specific Issues?
While Nebraskans are divided on many policy issues, there is common ground in the areas of health care and criminal justice reform.
Areas of Agreement: Health Care and Drug Treatment
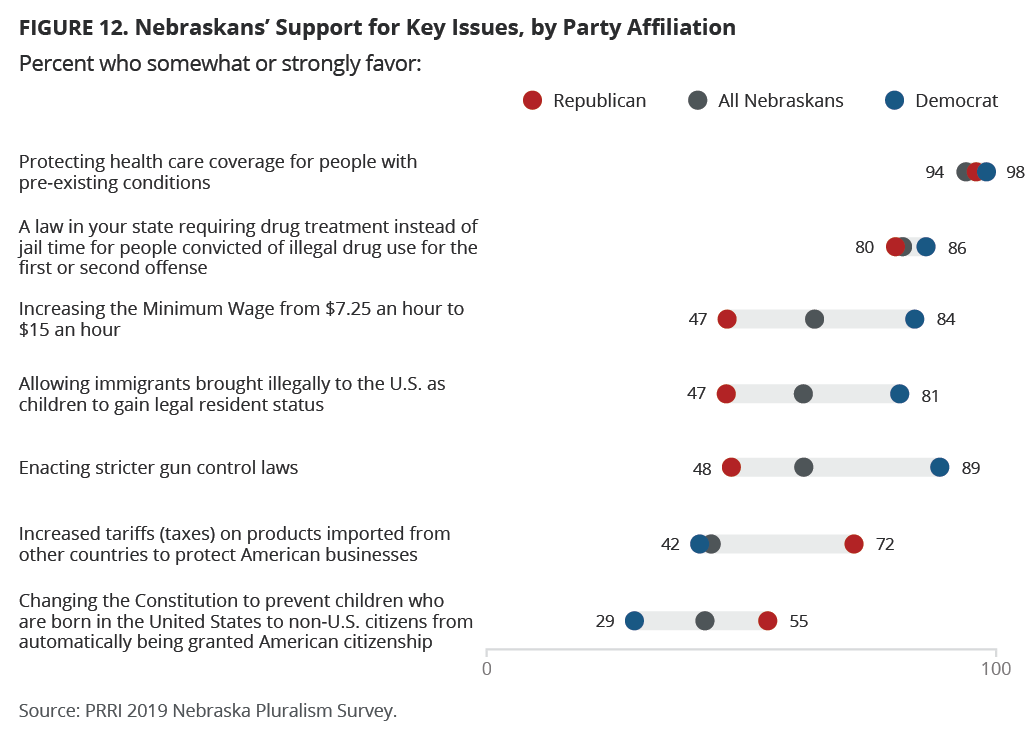
Nebraskans nearly universally favor a policy that protects health care coverage for people with pre-existing conditions – 94% favor such a policy, including 94% of Republicans and 98% of Democrats. Support among independents is only slightly lower at 89%.
More than eight in ten (81%) Nebraskans favor requiring drug treatment instead of jail time for people convicted for drug offenses. About eight in ten Republicans (80%), independents (78%), and Democrats (86%) support this policy. However, favorability is less intense among Republicans (24% strongly favor) and independents (36% strongly favor) than among Democrats (48% strongly favor).
Areas of Disagreement: Immigration, Minimum Wage, Gun Control, and Tariffs
Nebraskans, however, remain divided along partisan lines on issues related to immigration, minimum wage, gun control, and tariffs.
Around six in ten (62%) Nebraskans support allowing immigrants brought illegally to the U.S. as children to gain legal residency, but there are differences in support between Democrats (81%), independents (63%) and Republicans (47%). Nebraskans who live in communities with a lot of immigrants (61%) or some immigrants (68%) are more likely to favor this policy than those who live in communities with only a few (57%) or almost no immigrants (59%). White evangelical Protestants stand alone among religious groups in their low support for allowing immigrant children brought to the U.S. to gain residency (43%), with unaffiliated Nebraskans (76%), Catholics (63%), and white mainline Protestants (60%) all expressing majority support for the policy.
Nebraskans are particularly divided on changing the constitution to prevent children born in the U.S. to non-citizens from automatically being granted citizenship, with 43% in favor and a majority (56%) opposed. A majority of Republicans (55%), compared to 41% of independents and only 29% of Democrats, support this proposal. A slim majority (52%) of white evangelical Protestants also favor ending birthright citizenship, while 44% of white mainline Protestants, 42% of Catholics, and 39% of religiously unaffiliated Nebraskans agree.
Around two-thirds (64%) of Nebraskans favor or strongly favor increasing the minimum wage to $15 per hour. Opposition to this policy comes primarily from Republicans (52%) and white evangelical Protestants (61%). Nonwhite Nebraskans (82%) overwhelmingly favor raising the minimum wage, including 55% who strongly favor the policy, while about six in ten (61%) white Nebraskans favor or strongly favor an increase to $15 per hour.
More than six in ten (62%) Nebraskans support enacting stricter gun control laws, including 89% of Democrats. Fewer independents (49%) and Republicans (48%) favor strengthening gun laws.
Majorities of all religious affiliations, except white evangelical Protestants (36%), support stricter gun laws, including 69% of white mainline Protestants, 65% of Catholics, and 63% of religiously unaffiliated Nebraskans.
Less than half (44%) of Nebraskans support increased tariffs on imported goods, compared to a majority (56%) who oppose them. Around seven in ten (72%) Republicans favor increased tariffs, compared to 42% of Democrats, and 52% of independents. Support for increased tariffs is likely also a reflection of support for Trump, with 76% of Nebraskans who approve of Trump saying they favor tariffs, compared to only 37% support among those who disapprove of Trump.
Survey Methodology
The survey was designed by PRRI and conducted among a random sample of adults (age 18 and over) living in Nebraska. The survey included 1,321 total Nebraskans, including 203 who are part of Ipsos’s KnowledgePanel and 1,118 who were recruited by Ipsos using opt-in survey panels. As many cases as possible came from Ipsos’s probability-based KnowledgePanel, which were then weighted and used as the benchmark for the opt-in, nonprobability portion of the survey. Interviews were conducted online in both English and Spanish between August 23 and October 7, 2019. The survey was made possible by a generous grant from the Sherwood Foundation.
Respondents are recruited to the KnowledgePanel using an addressed-based sampling methodology from the Delivery Sequence File of the USPS – a database with full coverage of all delivery addresses in the U.S. As such, it covers all households regardless of their phone status, providing a representative online sample. Unlike opt-in panels, households are not permitted to “self-select” into the panel; and are generally limited to how many surveys they can take within a given time period.
The initial sample drawn from the KnowledgePanel was adjusted using pre-stratification weights so that it approximates the adult U.S. population defined by the latest March supplement of the Current Population Survey. Next, a probability proportional to size (PPS) sampling scheme was used to select a representative sample.
To reduce the effects of any non-response bias, a post-stratification adjustment was applied based on demographic distributions from the most recent American Community Survey (ACS). The post-stratification weight rebalanced the sample based on the following benchmarks: age, race and ethnicity, gender, Census division, metro area, education, and income. The sample weighting was accomplished using an iterative proportional fitting (IFP) process that simultaneously balances the distributions of all variables. Weights were trimmed to prevent individual interviews from having too much influence on the final results. In addition to an overall national weight, separate weights were computed for each state to ensure that the demographic characteristics of the sample closely approximate the demographic characteristics of the target populations. The state-level post-stratification weights rebalanced the sample based on the following benchmarks: age, race and ethnicity, gender, education, and income.
These weights from the KnowledgePanel cases were then used as the benchmarks for the opt-in sample in a process called “calibration.” This calibration process is used to correct for inherent biases associated with nonprobability opt-in panels. The calibration methodology aims to realign respondents from nonprobability samples with respect to a multidimensional set of measures to improve their representation. As compared to surveys that exclusively rely on non-probability samples without any calibration, these calibrated weights enable the resulting blended samples to represent the target population more effectively and offer more robust inferential possibilities. This improved representation is not only with respect to geodemographic distributions, but also with respect to an important set of attitudinal and behavioral measures.
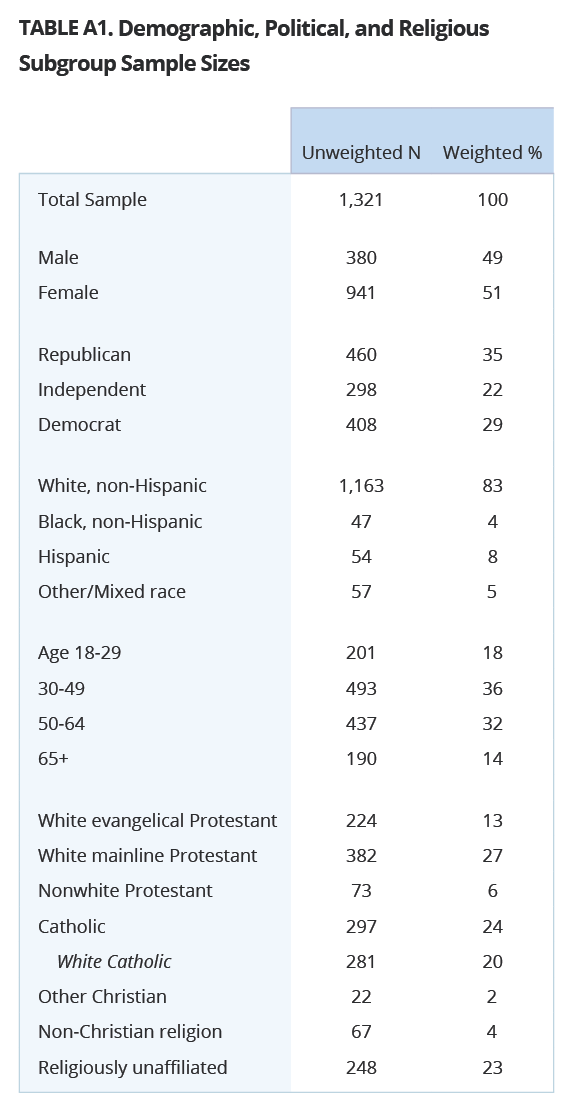
Margins of error cannot be precisely calculated for this type of study, since only part of the sample was collected using probability methods. However, a margin of error can be reported to approximate the error associated with the sample size of the survey. The estimated margin of error for the Nebraska survey is +/- 3.9 percentage points at the 95% level of confidence, which includes a design effect of 2.1. Table 1 reports unweighted sample sizes for demographic subgroups. In addition to sampling error, surveys may also be subject to error or bias due to question wording, context, and order effects.
Endnotes
[1] PRRI, American Values Survey, 2016.
[2] PRRI, 2016 American Values Survey,
[3] PRRI 2016 American Values Atlas
[4] PRRI/The Atlantic 2019 Pluralism Survey
[5] Throughout this section, responses are screened on those who report having at least some interactions with people of different backgrounds. Multiple responses were accepted for locations of interactions with diversity, so totals can sum to more than 100.
[6] “In my workplace” results are among a subset of Nebraskans who are actively working or self-employed.
[7] “In a school my child is attending” results are among a subset of Nebraskans who have a child under the age of 18 living at home.
[8] For the purposes of analysis, positions 1-3 on the scale are categorized as “mostly agree with the first statement,” positions 8-10 on the scale are characterized as “mostly agree with the second statement,” and positions 4-7 on the scale are categorized as in the middle.
Recommended citation:
“In Middle America, Nebraskans Struggle with a Changing Cultural Landscape” PRRI (November 13, 2019). [https://www.prri.org/research/in-middle-america-nebraskans-struggle-with-a-changing-cultural-landscape]


