Executive Summary
The American Values Survey (AVS) is a large, nationally representative public opinion survey of American attitudes on religion, values, and politics. The 2010 survey is the third biennial AVS, which is conducted by PRRI every two years as the national election season is getting underway. Results of the 2010 American Values Survey are based on telephone interviews conducted among a national random sample of 3,013 adults (age 18 and over) between September 1 and September 14, 2010.
Among the top findings:
The survey confirmed several attributes of the Tea Party movement.Compared to the general population, they are more likely to be non-Hispanic white, are more supportive of small government, are overwhelmingly supportive of Sarah Palin, and report that Fox News is their most trusted source of news about politics and current events.
But the survey challenged much of the other conventional wisdom about Americans who consider themselves part of the Tea Party movement:
- Nearly half (47%) also say they are part of the religious right or conservative Christian movement. Among the more than 8-in-10 (81%) who identify as Christian within the Tea Party movement, 57% also consider themselves part of the Christian conservative movement.
- They make up just 11% of the adult population—half the size of the conservative Christian movement (22%).
- They are mostly social conservatives, not libertarians on social issues. Nearly two-thirds (63%) say abortion should be illegal in all or most cases, and less than 1-in-5 (18%) support allowing gay and lesbian couples to marry.
- They are largely Republican partisans. More than three-quarters say they identify with (48%) or lean towards (28%) the Republican Party. More than 8-in-10 (83%) say they are voting for or leaning towards Republican candidates in their districts, and nearly three-quarters (74%) of this group report usually supporting Republican candidates.
A majority (54%) of voters say they would be more likely to vote for a candidate who supported health care reform, including 51% of independent voters and 79% of Democratic voters. Nearly 6-in-10 (59%) Republican voters say they would be less likely to vote for a candidate who supported health care reform.
Nearly 6-in-10 (58%) Americans favor a policy that provides a future path to citizenship for undocumented immigrants who have been in the U.S. for several years. Two-thirds (67%) of Americans also say immigration reform policies should be decided at the national level.
Public support for same-sex marriage increased by 8 points from 2008 to 2010 (29% to 37%). Half of Democrats, 4-in-10 independents, and less than 1-in-5 (17%) Republicans support allowing gay and lesbian people to marry.
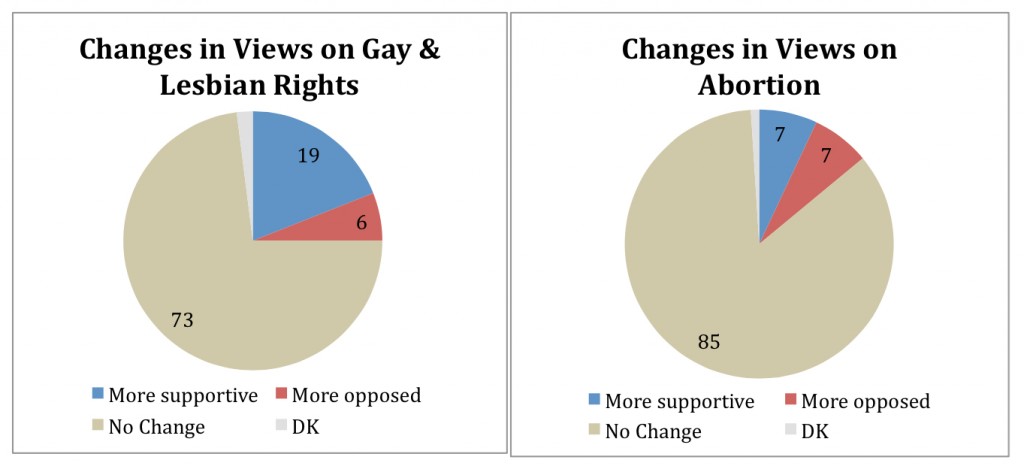
Over the past five years, significantly more Americans report their views have shifted on the issue of rights for gay and lesbian people than on the issue of abortion (25% to 14% respectively).
I. Understanding the Tea Party Movement
Since the 2008 election, the Tea Party has emerged, especially in media accounts, as the most dynamic movement in conservative politics. Its place in the GOP base, and particularly the issue of whether it constitutes a distinctly new group in relation to the Christian Right, has become a point of considerable debate. The American Values Survey casts new light on these questions, along with other important issues at the intersection of religion, values, and the 2010 elections.
Challenging Conventional Wisdom about the Tea Party Movement
The survey confirmed several common assumptions about the Tea Party movement. For example, those who consider themselves part of the Tea Party movement are significantly more non-Hispanic white than the general population (80% vs. 69% of Americans overall). They are also decidedly more supportive of small government than the general population. More than 8-in-10 (83%) Americans who identify with the Tea Party movement say that the government has gotten bigger because it is involved with things people should be doing for themselves, compared to 56% of the general population. Unsurprisingly, Sarah Palin enjoys enormous popularity among Americans who identify with the Tea Party movement (80% favorable), while President Barack Obama is viewed negatively by overwhelming numbers (75% unfavorable). Finally, Americans who identify with the Tea Party movement are highly influenced by Fox News. Nearly 6-in-10 (57%) say Fox News is their most trusted source for news about politics and current events, a rate significantly higher than other conservative groups such as Republicans or Christian conservatives.
But the survey findings challenge, more than confirm, the conventional wisdom about the Tea Party movement. The survey challenges four widespread assumptions:
- Conventional Wisdom: The Tea Party movement is distinct from previous conservative movements like the Christian Right.
- Findings: Nearly half (47%) of Americans who consider themselves part of the Tea Party movement also consider themselves part of the Christian conservative movement. Among the more than 8-in-10 (81%) who identify as Christian within the Tea Party movement, nearly 6-in-10 (57%) also consider themselves part of the Christian conservative movement.
- Conventional Wisdom: The Tea Party movement represents a large portion of the U.S. population, rivaling the size of previous conservative movements like the Christian Right.
- Findings: Americans who identify with the Tea Party movement make up just 11% of the adult population—half the size of the conservative Christian movement (22%).
- Conventional Wisdom: The Tea Party movement is an independent political force, whose members are not beholden to either political party.
- Findings: Americans who identify with the Tea Party movement are largely Republican partisans. More than three-quarters say they identify with (48%) or lean towards (28%) the Republican Party. More than 8-in-10 (83%) say they are voting for or leaning towards Republican candidates in their districts, and nearly three-quarters (74%) of this group report usually supporting Republican candidates.
- Conventional Wisdom: The Tea Party movement is largely a political libertarian group that believes in maximum freedom for individuals.
- Findings: Americans who identify with the Tea Party movement are mostly social conservatives, not libertarians on social issues. Nearly two-thirds (63%) say abortion should be illegal in all or most cases, and less than 1-in-5 (18%) support allowing gay and lesbian couples to marry.
The Tea Party Movement and Christian Conservatives
Demographic Profiles
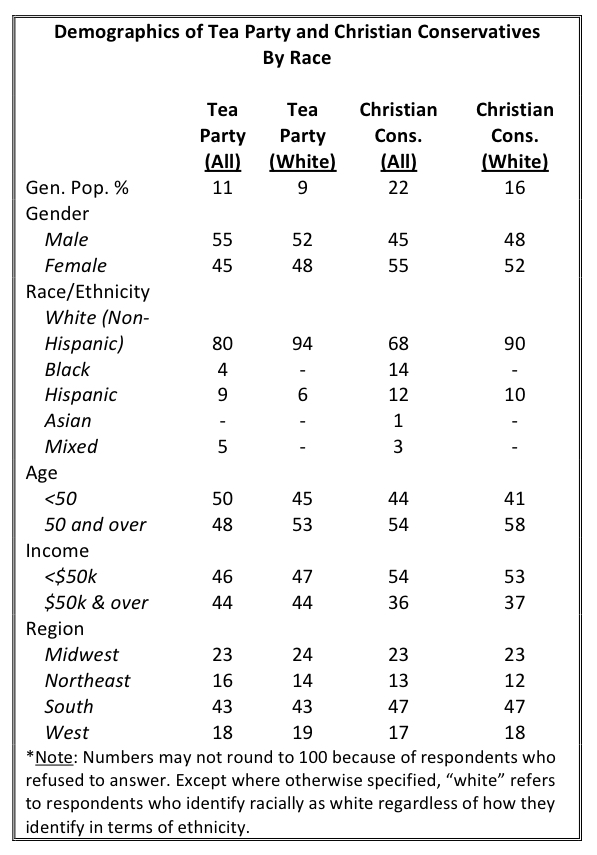 There is striking similarity between the demographic characteristics of Americans who consider themselves part of the Tea Party movement and Americans who consider themselves part of the Christian conservative movement. The similarities are particularly strong between the white members, who make up the overwhelming majority of each group.
On nearly all basic demographic characteristics, there are no significant differences between Americans who identify with the Tea Party movement and those who identify with the Christian conservative movement. The only difference rising to the level of statistical significance is gender composition, with those who identify with the Tea Party movement more likely than Christian conservatives to be male.
As the table above demonstrates, both Americans who identify with the Tea Party movement and Americans who identify with the Christian conservative movement are overwhelmingly white (8-in-10 for the Tea Party movement, nearly 7-in-10 (68%) for the Christian conservative movement). Because white Americans dominate both groups, there are few differences between the white subset of these groups and the larger group of which they are a part (see Appendix A).
Political Profiles
Americans who identify with the Tea Party movement and Christian conservatives have similar ideological profiles but show some differences in their partisan profiles. For example, among those who consider themselves a part of the Tea Party movement, 71% identify as conservative, 20% as moderate, and 8% as liberal. Similarly, among Christian conservatives, 64% identify as conservative, 20% as moderate, and 13% as liberal.
More significant differences appear in the party affiliation of Americans identifying with the Tea Party and the Christian conservative movements. Among Americans who consider themselves a part of the Tea Party movement, approximately three-quarters identify with (48%) or lean towards (28%) the Republican Party; 6% identify as independent; and approximately 1-in-5 identify with (10%) or lean towards (8%) the Democratic Party. Among Christian conservatives, approximately 6-in-10 identify with (39%) or lean towards (20%) the Republican Party; 5% identify as independent; and approximately one-third identify with (24%) or lean towards (10%) the Democratic Party.
The differences in partisan profiles between these groups are due almost entirely to the significant presence in the Christian conservative movement of minorities who strongly identify with the Democratic Party. For example, among Christian conservatives as a whole, 34% identify with or lean towards the Democratic Party, a level significantly higher than the white Christian conservatives (20% identify with or lean Democrat). Among white members of the Christian conservative movement, the partisan profile looks nearly indistinguishable from the partisan profile of the Tea Party movement: more than 7-in-10 white Christian conservatives identify with (47%) or lean towards (25%) the Republican Party.
Trusted News Sources
Roughly equal numbers of Americans say they most trust cable news networks Fox News (23%) and CNN (20%) to provide accurate information about politics and current events. Similar numbers (23%) also say they most trust broadcast network news (NBC, ABC and CBS). Approximately 1-in-10 (12%) say they most trust public television, 6% say MSNBC, and 4% say the Daily Show with Jon Stewart.
Americans who identify with the Tea Party movement stand out for their high levels of trust in Fox News. Nearly 6-in-10 (57%) say Fox News is their most trusted source for news about politics and current events. Trust in Fox News among those who identify with the Tea Party movement is significantly higher than among Republicans (48%) or those who identify with the Christian conservative movement (39%).
Overlap between the Tea Party, Christian Conservatives, and the Republican Party
There are striking similarities between the demographic and political profiles of Americans who identify with the Tea Party and the Christian conservative movements. Much of this similarity can be attributed to one illuminating finding—the significant overlap between these two groups, and the overlap between these two groups and the Republican Party.
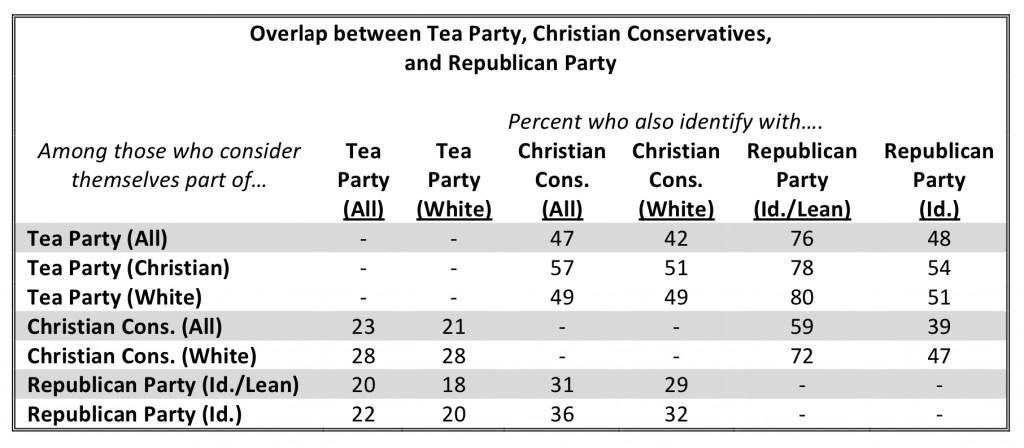
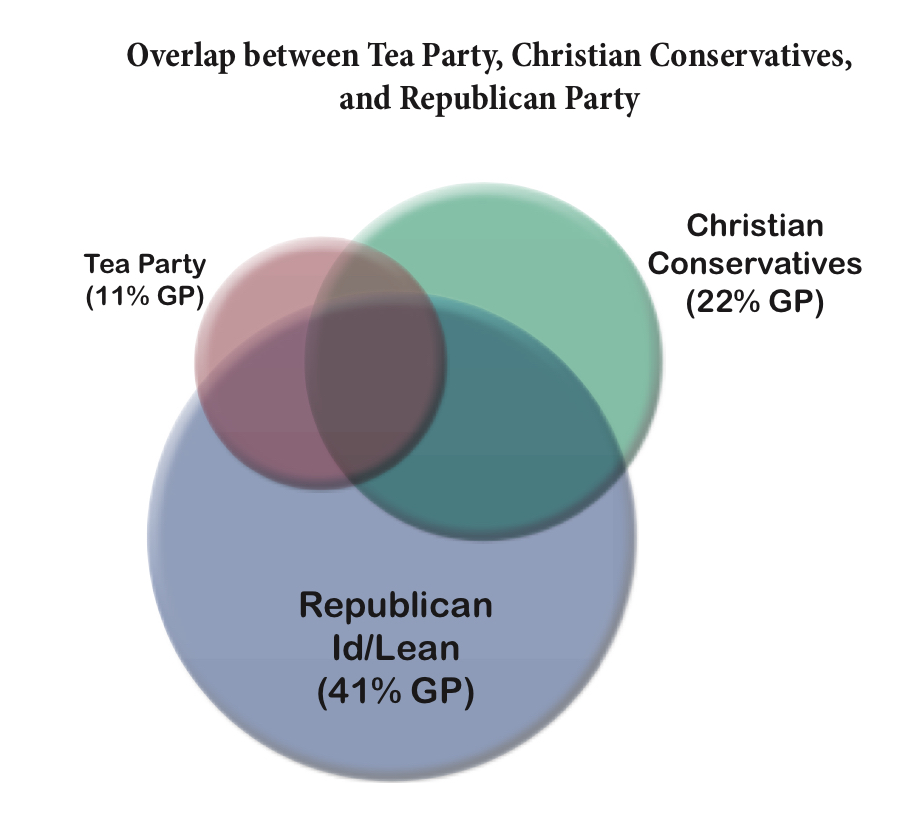
The following table and Venn diagram demonstrate the overlap between the Tea Party, Christian conservatives, and the Republican Party. The table includes breakdowns by race and also breakdowns by Republican Party identification with and without independents who lean towards the Republican Party. In the Venn diagram on the following page, each of the circles is scaled to represent the relative size of each group in the general population. The overlap has been visually approximated to represent the percentage of each group also identifying with the other group.
Nearly half (47%) of Americans who consider themselves part of the Tea Party movement also consider themselves part of the Christian conservative movement. Among the more than 8-in-10 (81%) who identify as Christian within the Tea Party movement, nearly 6-in-10 (57%) also consider themselves part of the Christian conservative movement. Conversely, nearly 1-in-4 Christian conservatives (23%) also consider themselves a part of the Tea Party movement.
Despite the recent attention garnered by the Tea Party movement, Christian conservatives continue to constitute nearly twice the proportion of the GOP base. One-in-five (20%) Americans who identify with or lean toward the Republican Party consider themselves a part of the Tea Party movement, compared to 31% who identify as Christian conservatives.
A Religious Profile of the Tea Party Movement
Religious Affiliation and Engagement
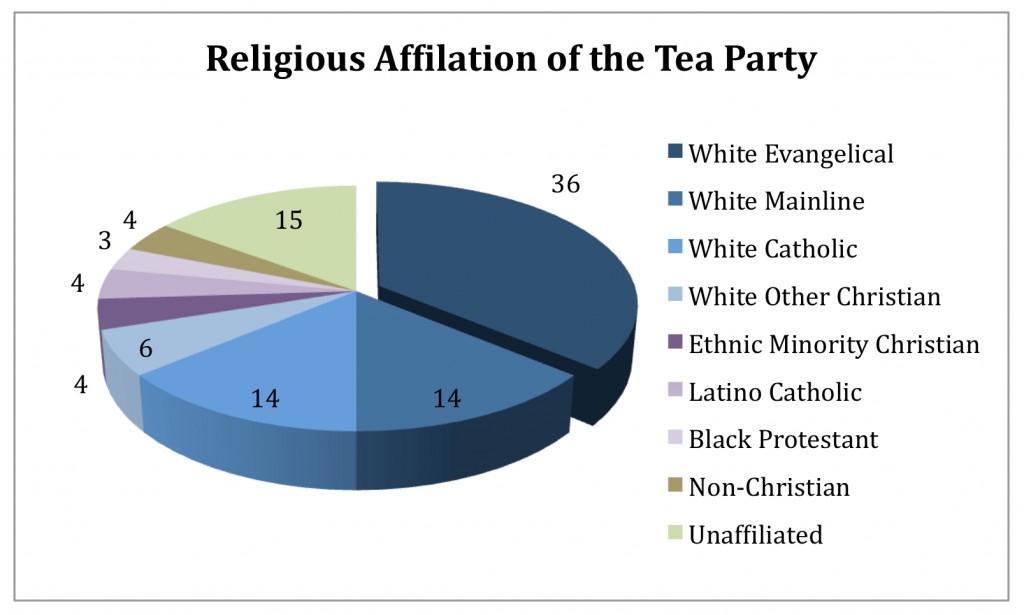
The religious profile of Americans who identify with the Tea Party movement looks significantly different than the general population. Those who identify with the Tea Party movement are more likely than the general population to be white Christians (70% vs. 57% respectively) and less likely to be unaffiliated (15% vs. 19% respectively). This larger white Christian affiliation is almost entirely due to the outsized presence of white evangelical Protestants in the Tea Party movement. Americans who consider themselves a part of the Tea Party movement are more likely to identify as white evangelical Protestants than the general population (36% vs. 21% overall). The religious profile of those who identify with the Tea Party movement differs only modestly from the religious profile of the Republican Party. The Republican Party is also dominated by white Christians (82%) and contains the same proportion of white evangelical Christians (36%).
Americans who identify with the Tea Party movement exhibit relatively high levels of religious engagement. Forty-six percent report attending religious services at least once per week—a rate significantly higher than in the general population (36%), but lower than the high attendance levels of white evangelicals (63%).
Religious Outlook
The religious beliefs of Americans who consider themselves a part of the Tea Party movement are significantly more traditional than the general population, but not as traditional as the beliefs of white evangelical Protestants. For example, nearly half (47%) of those identifying with the Tea Party movement believe that the Bible is the literal word of God, compared to one-third of the general population and nearly two-thirds of white evangelicals (64%). Similarly, 71% of those identifying with the Tea Party movement believe God is a person with whom one can have a relationship, compared to 64% of the general population and 88% of white evangelicals.
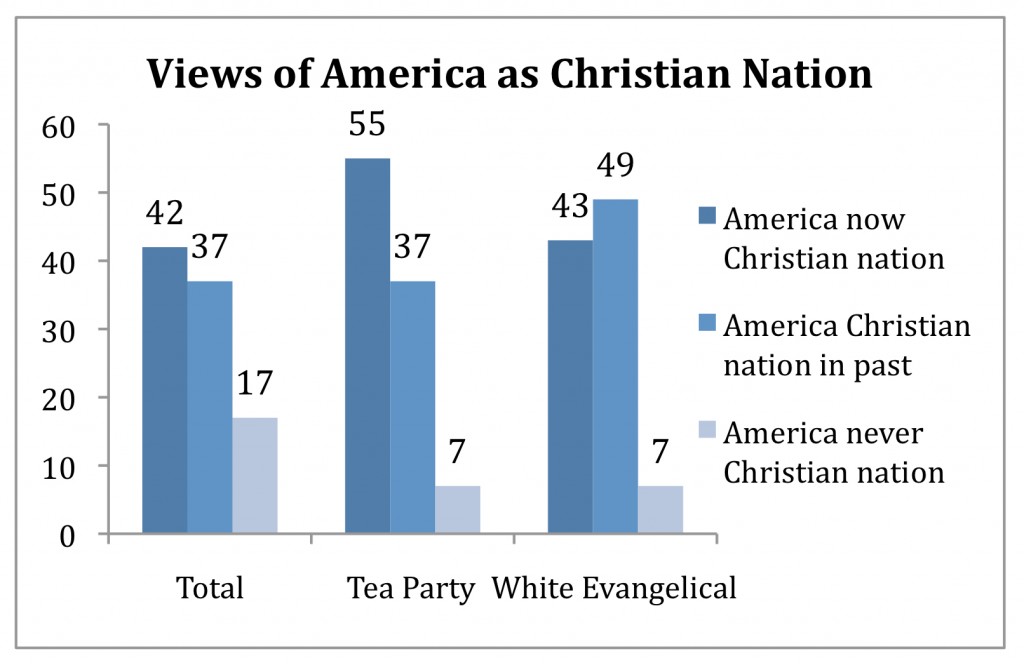 With regard to the role of religion in public life, Americans who consider themselves part of the Tea Party movement are significantly more likely than the general population to say they believe America is a Christian nation. A majority (55%) of Americans who identify with the Tea Party believe that America has always been and is currently a Christian nation, compared to 42% of the general public and 43% of white evangelical Protestants.
Americans who consider themselves a part of the Tea Party movement are also significantly more likely than the general public to say that they are concerned about public officials who do not pay enough attention to religion. Only about one-third (34%) of Americans report worrying more about public officials who do not pay enough attention to religion than about public officials who are too close to religious leaders; a plurality (48%) of those identifying with the Tea Party worry more about public officials who do not pay enough attention to religion, as do 60% of white evangelicals.
Political Values
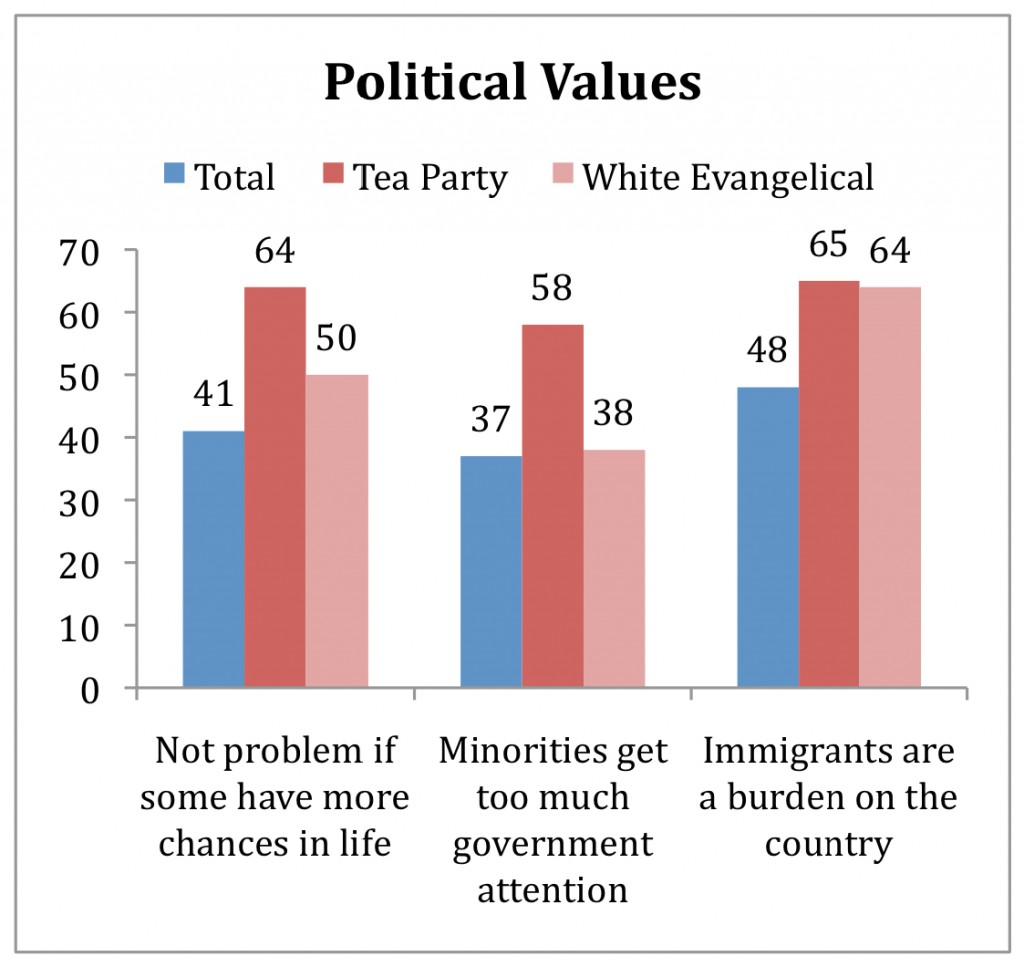 On a number of political values, Americans who identify with the Tea Party movement differ not only from the general public but from white evangelicals as well. Nearly two-thirds (64%) of those identifying with the Tea Party agree that “it is not really that big a problem if some people have more of a chance in life than others,” compared to half of white evangelicals and only 41% of the general population. Among the general population, a majority (53%) agree with the opposite statement, that “one of the big problems in this country is that we don’t give everyone an equal chance in life.”
Americans who identify with the Tea Party hold significantly different views than the general population about the amount of attention ethnic minorities have received from the government. Nearly 6-in-10 (58%) of those who consider themselves a part of the Tea Party movement agree that over the past couple of decades, the government “has paid too much attention to the problems of blacks and other minorities.” In contrast, less than 4-in-10 of both the general population (37%) and white evangelical Protestants (38%) share these views.
Americans overall are generally divided over the impact of immigrants on the country today, with a plurality (48%) saying immigrants are a burden on the country “because they take jobs, housing, and health care,” compared to 44% who say immigrants strengthen the country “because of their hard work and talents.” Nearly two-thirds (65%) of Americans who identify with the Tea Party say that immigrants are a burden on the country, a number on par with white evangelicals (64%).
II. Voters and the 2010 Election
The 2010 Vote
Two months before the election, Democrats have a slight edge over Republicans among registered voters. Forty-seven percent of registered voters report that they are planning to vote for or are learning towards the Democratic candidate, and 44% say they are voting for or leaning towards the Republican candidate in their election district.
There are significant differences in voter preferences among the American electorate by gender, age, political affiliation, race and religion. A slight majority (52%) of women currently favor the Democratic candidate, compared to roughly 4-in-10 (42%) men. Young voters (age 18 to 29) heavily favor Democratic candidates, preferring them to GOP candidates 55% to 33%. In contrast, older voters (age 65 and over) favor Republican candidates by a 10-point margin (50% to 40%). Democratic voters and Republican voters support their respective parties at roughly equal rates (92% and 94% respectively). Independent voters prefer Republican candidates over Democratic candidates by a significant margin (48% to 35%). Roughly 1-in-5 (17%) independent voters remain undecided at this point in time. Both African American voters and Hispanic voters strongly support the Democratic candidates (86% and 69% respectively), while the GOP candidates have a substantial edge among whites (53% to 38%).
Among religious groups, the Republican Party maintains a sizable advantage among white Christian voters, while Democrats perform better among ethnic minority Christian voters and the unaffiliated. More than 7-in-10 (71%) white evangelical voters, a majority (55%) of white mainline Protestant voters, and half of white Catholic voters report favoring the GOP candidate in their election district. No more than 4-in-10 of any white Christian group say they will vote for or are leaning towards the Democratic candidate. Among African American Protestant voters and Hispanic Catholic voters, Democrats retain an overwhelming advantage (89% and 72% respectively). Among religiously unaffiliated voters, nearly two-thirds (64%) say they will vote for or are leaning towards the Democratic candidate.
The Economy and the 2010 Election
By far, the most important issue to voters in this election season is the economy. A plurality (46%) of voters say the economy is the most important issue to their vote this year. One-in-five voters report that health care is most important. Approximately 1-in-10 say the federal budget deficit (10%) and the wars in Afghanistan and Iraq (9%) are most important. Only about 1-in-20 say immigration (6%) or same-sex marriage and abortion (6%) are the most important issues.
Nearly half (49%) of voters think the economy has gotten worse over the last two years; three-in-ten say it is about the same, and 1-in-5 say it has gotten better. However, perceptions of the economy are heavily conditioned by political affiliation. Nearly three-quarters (73%) of Republican voters say that the economy has worsened over the past two years, compared to about one-quarter (27%) of Democratic voters. Among independent voters, a majority (51%) believe the economy has gotten worse. Not surprisingly, voters who believe the economy has gotten worse since Obama took office are supporting Republicans by a 40-point margin (65% to 25%). Voters who believe the economy is improving or has stayed the same are supporting Democratic candidates by an equally wide margin (68% to 23%).
Most voters report that they are not personally doing well financially. A majority of voters report that they are in only fair (36%) or poor shape (18%) financially. Less than 1-in-10 (8%) voters say they are in excellent shape financially and one-third (36%) report that they are in good shape. Voters who report their financial situation is only fair or poor prefer Democratic candidates to Republican candidates 49% to 41%. Americans who say they are in good or excellent shape are divided, but lean slightly towards the GOP candidate (47% to 45%).
Candidate Characteristics, Issues and the 2010 Vote
Support for Health care Reform
A majority (54%) of voters say that they would be more likely to vote for a candidate who supported health care reform. About 1-in-4 (26%) voters say they would be less likely to vote for a candidate who supported health care reform, and less than 1-in-5 (18%) say that the issue would not make a difference to their vote either way. Among voters for whom health care is the most important issue, more than 6-in-10 (62%) say that if a candidate supported health care they would be more likely to vote for them.
Among Democratic voters, nearly 8-in-10 (79%) say they would be more likely to vote for a candidate who supported health care reform. Only 3% say they would be less likely. Among independent voters, twice as many say they would be more likely to support a candidate who voted for health care reform than say they would be less likely (51% to 25%). Although nearly 6-in-10 (59%) Republican voters say they would be less likely to vote for candidates who supported health care reform, 1-in-4 report that they would be more likely to vote for such candidates.
Support for Abortion Rights
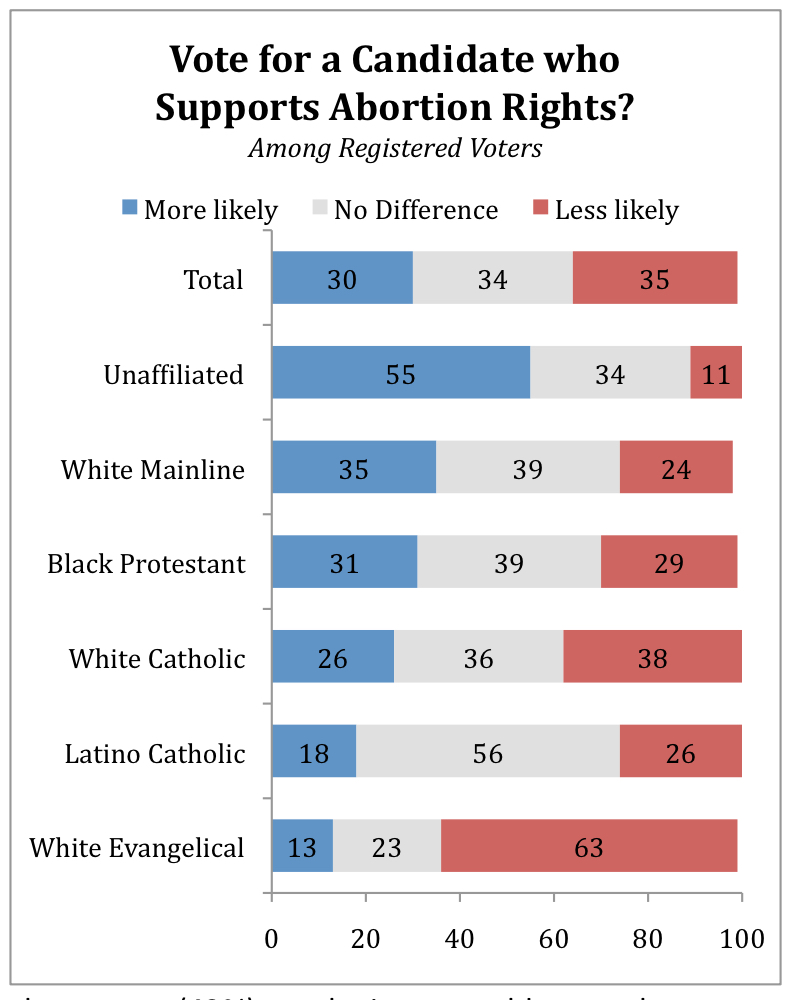 Slightly more voters say they would be less likely to support a candidate who supports abortion rights. Three-in-ten voters report that they would be more likely to vote for a candidate who supports abortion rights, 35% say that they would be less likely, and 34% say it would not make a difference.
This issue is much more important among voters who oppose abortion rights than among those who support abortion rights. Among supporters of legalized abortion— those who say it should be legal in all or most cases—nearly half (47%) say they would be more likely to vote for a candidate who supports abortion rights, but nearly as many (42%) say the issue would not make a difference in their voting decision. Nearly 7-in-10 (69%) opponents of legalized abortion say they would be less likely to vote for a candidate who supports abortion rights. Only about 1-in-5 (21%) abortion opponents say the issue would not make a difference.
The political role of the abortion issue varies significantly across religious groups, but most groups are divided over how it would affect their vote. A majority (55%) of unaffiliated voters say they would be more likely to vote for a candidate who supports abortion rights. At the other end of the spectrum, nearly two-thirds (63%) of white evangelical voters say they would be less likely to vote for a candidate who affirms abortion rights. More than one-third (35%) of white mainline Protestant voters say they would be more likely to vote for a candidate who supports abortion rights, while about 1-in-4 (24%) say they would be less likely. Black Protestant voters are divided, with nearly even numbers reporting they would be more (31%) and less (29%) likely to vote for a candidate who supports abortion rights. About 4-in-10 (39%) black Protestant voters say it would not make a difference. Nearly 4-in-10 (38%) white Catholic voters say they would be less likely to vote for a candidate supporting abortion rights; but nearly an equal number say it would make no difference (36%), and more than one-quarter (26%) say they would be more likely to support a candidate who supports abortion rights. A majority (56%) of Latino Catholic voters say the issue of abortion would not have any affect on their vote – the only major religious group for whom this is true.
Support for the Tea Party Movement
Voters are modestly less likely to favor candidates who support the Tea Party movement. Thirty-one percent of voters say they would be less likely to support a candidate who supports the Tea Party, compared to 24% who say they would be more likely to support the candidate. A plurality (37%) of American voters say a candidate’s support for the Tea Party would not make a difference.
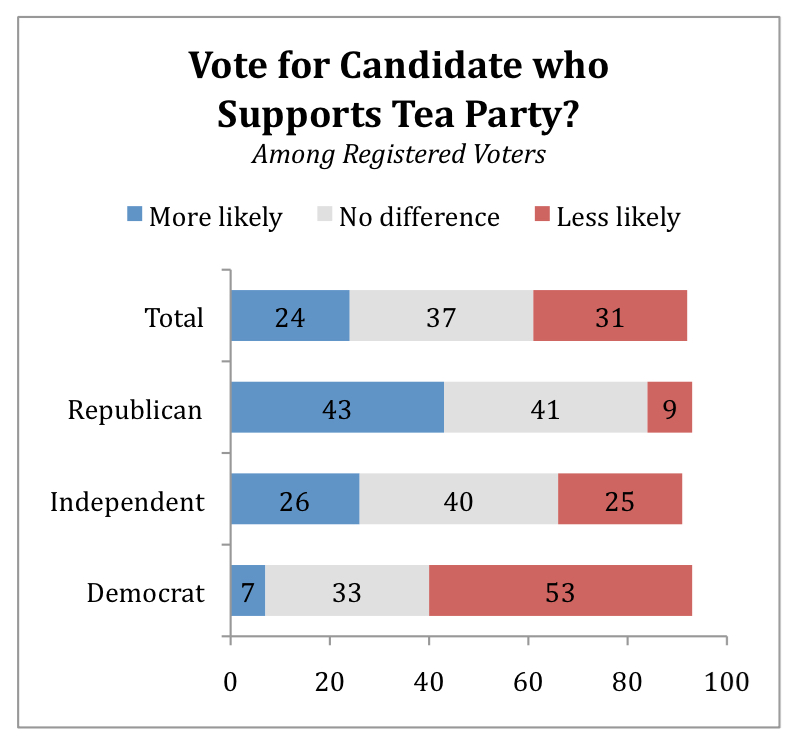 There are significant differences by party affiliation. A majority (53%) of Democratic voters say a candidate’s support for the Tea Party would make them less likely to vote for that candidate. Only 7% say the opposite. Independent voters are divided, with 26% saying they would be more likely to vote for a candidate who backs the Tea Party, and 25% reporting the opposite. More than 4-in-10 (43%) Republican voters say they would be more likely to support a candidate who embraced the Tea Party, although nearly as many (41%) say it would make no difference to them.
Among voters who consider themselves a part of the Tea Party, more than 8-in-10 (81%) say a candidate’s support of the Tea Party would increase their support for the candidate. Four-in-ten white evangelicals say that they would be more likely to get behind a candidate who supported the Tea Party, while 36% say it would make no difference, and 15% say it would make them less likely to support a candidate.
Among women, young adult (age 18-29), black and Hispanic voters, supporting the Tea Party is a significant disadvantage for candidates. Nearly half of blacks (46%), nearly one-third of women and Hispanic voters (32% and 31% respectively), and more than 1-in-4 (27%) young adults say a candidate’s support of the Tea Party would make them less likely to vote for the candidate. No more than 1-in-5 among black, women, Hispanic and young adult voters say a candidate’s support for the Tea Party would make them more likely to support the candidate (8%, 20%, 10%, 17%, respectively).
Support for Comprehensive Immigration Reform
A plurality (46%) of voters report they would be more likely to vote for a candidate who supports comprehensive immigration reform. Less than 1-in-5 (17%) say that this position would make them less likely to vote for a candidate, and about one-third (31%) say the issue would not make any difference. A majority (52%) of voters who support allowing undocumented immigrants to earn legal working status and an opportunity for citizenship say they would be more inclined to vote for a candidate who supports immigration reform. One-third of immigration reform supporters say the issue would not make a difference to their vote.
There is much more agreement on the issue of immigration reform than on other issues between members of the political parties. Pluralities of Democratic voters (49%) Republican voters (44%), and independent voters (47%) say they would be more likely to vote for a candidate who supports comprehensive immigration reform.
Candidate Religious Beliefs
The vast majority of voters say that a candidate’s religious beliefs would not have any bearing on whether or not they would vote for them. Three-quarters of voters say that it would not make any difference to their vote if a candidate holds religious beliefs different than their own. About 1-in-6 (16%) say that it would make them less likely to vote for the candidate, and less than 1-in-10 (7%) say it would make them more likely to vote for the candidate.
The religious beliefs of a candidate matter most to white evangelical Protestant voters. Among this group, nearly 3-in-10 (29%) say they would be less inclined to vote for a candidate who holds different religious beliefs. However, 6-in-10 white evangelical voters say it would not make a difference. More than 8-in-10 white mainline Protestant voters (84%), white Catholics voters (81%) and religiously unaffiliated voters (86%) report that a candidate’s religious beliefs would not affect their vote one way or the other.
Views of Political Figures
Presidential Popularity
Despite mixed reviews of the President’s job performance, Barack Obama’s personal favorability among the American voters is still relatively high. A majority of voters say they have a very favorable (25%) or mostly favorable (30%) view of Obama. About 4-in-10 (43%) say they have an unfavorable opinion of the President.
Obama’s favorability rating is significantly higher than the current favorability rating of his immediate predecessor, but not as high as the last Democratic President’s. Two years after he left office, a majority (55%) of voters have an unfavorable opinion of George W. Bush, compared to 43% who have a favorable opinion. Ten years after he left office, the last Democratic President, Bill Clinton, has a favorability rating surpassing both Obama and Bush. Nearly 7-in-10 (68%) voters have a favorable impression of Clinton, compared to 3-in-10 who have an unfavorable view.
The Republican 2012 Primary
Likely candidates for the 2012 GOP nomination Sarah Palin, Mitt Romney and Mike Huckabee have roughly equal favorability ratings among voters. About 4-in-10 voters are favorably disposed towards Romney (41%), Palin (41%) and Huckabee (44%). However, Palin inspires more negative views than either other candidate. A majority (53%) of voters express an unfavorable opinion of Palin, while about one-third of voters have an unfavorable view of either Romney (34%) or Huckabee (31%). One-in-four voters have no opinion of either Romney or Huckabee.
Among groups poised to play an important role in the Republican nominating contest, Palin and Huckabee appear to have an edge over Romney. Roughly 7-in-10 (72%) Republican voters have a favorable opinion of Palin, while 68% have a favorable opinion of Huckabee and 61% have a favorable opinion of Romney. However, among white evangelical voters Huckabee is viewed slightly more positively than Palin (66% to 61% respectively). More than 8-in-10 (84%) voters who identify with the Tea Party say they have a favorable view of Palin, compared to 74% who have a favorable opinion of Huckabee, and 61% who have a favorable opinion of Romney. Significantly fewer white evangelical voters report having a favorable view of Romney (48%).
Although Palin is viewed more positively than other leading candidates among Republican voters, she also registers higher unfavorable opinions among Democratic and independent voters than either Romney or Huckabee. Nearly 8-in-10 (78%) Democratic voters have an unfavorable view of Palin, of which 52% have a very unfavorable view. In contrast, less than half of Democrats have an unfavorable view of Romney (47%) or Huckabee (45%). A majority (52%) of independent voters have an unfavorable view of Palin, compared to 43% who favor her. Fewer than 4-in-10 Independent voters have an unfavorable view of Romney (34%) or Huckabee (30%).
III. Issues
Taxation and Role of Government
Taxation Rate
A majority (56%) of Americans believe that people who have incomes of more than $1 million per year pay too little in taxes. About 1-in-4 (24%) believe they pay the right amount, and less than 1-in-10 (9%) say they pay too much. A majority (53%) of Americans also believe that people who make less than $30,000 a year pay too much in taxes. One-third say this group pays the right amount in taxes, and only 6% say they pay too little.
Americans who consider themselves part of the Tea Party movement are much less likely to say that those with incomes over $1 million pay too little in taxes than the general public (35% vs. 56%). Nearly 1-in-5 (18%) say they pay too much, and 37% say they pay about the right amount. Americans who identify with the Tea Party movement are also twice as likely as Americans overall to believe that people making less than $30,000 per year pay too little in taxes (12% vs. 6%).
There are significant partisan gaps on the issue of taxation. Seven-in-ten Democrats and 53% of independents believe that people making more than $1 million per year do not pay enough in taxes, compared to about 4-in-10 (41%) Republicans. A majority of Democrats (58%) and independents (54%) also believe that people making less than $30,000 a year are paying too much, a view held by significantly fewer (43%) Republicans.
The Role of Government
A majority (56%) of Americans believe that government has gotten bigger because it has gotten involved in things that people should do for themselves, compared to about 4-in-10 (41%) who say government has gotten bigger because the problems we face have become bigger. Among Americans who identify with the Tea Party, 83% believe that government growth has been the result of getting involved in things people should be doing for themselves. Seven-in-ten white evangelicals and three-quarters of Republicans also agree with this statement. Six-in-ten independents also agree. Among Democrats, only 36% say that government has grown as a result of getting involved in things better left to individuals. Nearly 6-in-10 (59%) Democrats say that government has grown in response to larger problems facing the nation.
Social & Cultural Issues
Same-sex Marriage
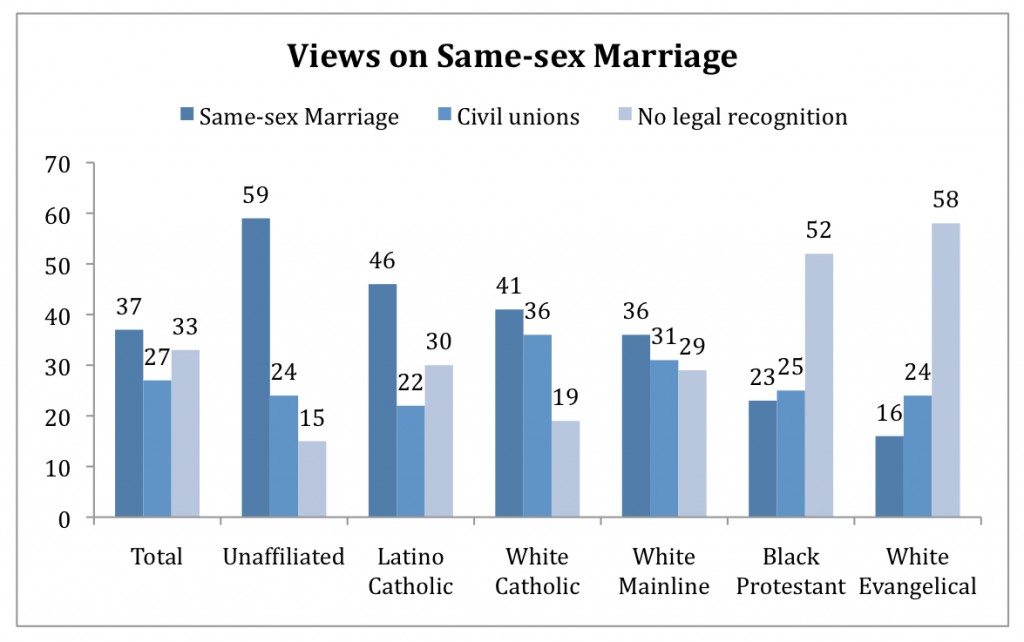
A plurality (37%) of Americans now support same-sex marriage, more than one-quarter (27%) support civil unions, and one-third believe there should be no legal recognition of same-sex relationships. There are major differences between religious groups, political parties, age cohorts, and races on this issue.
The religious differences are stark on the issue of same-sex marriage. Nearly 6-in-10 (59%) religiously unaffiliated Americans favor allowing gay and lesbian people to marry. More than 4-in-10 Latino Catholics (46%) and white Catholics (41%) also favor same-sex marriage. However, Latino Catholics are more likely than white Catholics to say there should be no legal recognition for same-sex couples (30% to 19%) and are less likely to support civil unions. White mainline Protestants support same-sex marriage at roughly the same level as the general public (36% and 37% respectively). Less than 1-in-4 white evangelicals (16%) and black Protestants (23%) believe that gay and lesbian people should be allowed to marry. A majority of both black Protestants (52%) and white evangelicals (58%) say gay and lesbian relationships should not be legally recognized.
Currently, half of all Democrats support same-sex marriage, compared to 40% of independents and just 17% of Republicans. Less than 3-in-10 Democrats and independents say there should be no legal recognition for gay and lesbian couples (26% to 29% respectively), compared to 46% of Republicans. Among those who identify with the Tea Party movement, 18% support same-sex marriage and 45% say there should be no legal recognition.
Women, Hispanics and young adults are more likely to support same-sex marriage than men, older Americans, whites or African Americans. The majority of young adults (52%), and more than 4-in-10 Hispanics (44%) and women (41%) say that gay and lesbian people should be allowed to marry. In contrast, only 38% of whites, one-third of men, 27% of African Americans, and 1-in-5 (22%) adults age 65 and older support same-sex marriage.
Abortion
A majority of Americans say that abortion should be legal in all (18%) or some cases (37%), compared to about 4-in-10 who say abortion should be illegal in all (15%) or most cases (27%). There are few differences across basic demographic groups such as age, gender and race, but large differences exist between religious and political groups.
Majorities in most religious groups say abortion should be legal in all or most cases. Nearly two-thirds (65%) of white mainline Protestants say abortion should be mostly or always legal. A majority of black Protestants (57%), white Catholics (53%) and Latino Catholics (51%) also support legal abortion in all or most cases. Among the religiously unaffiliated three-quarters say abortion should be legal. In contrast, seven-in-ten white evangelicals say that abortion should be illegal in most or all cases. Only 28% believe abortion should be legal in all or most cases.
There are also significant divisions by political affiliation. Democrats are twice as likely as Republicans to favor keeping abortion legal in all or most cases (70% to 35%). A majority (54%) of independents also say abortion should be legal in all or most cases. Among Americans who consider themselves to be part of the Tea Party movement, 36% say abortion should be legal in all or most cases.
Shifting Views Over Time
Over the past five years, significantly more Americans report their views have shifted on the issue of rights for gay and lesbian people than on the issue of abortion (25% to 14% respectively). On the issue of gay and lesbian rights, three times as many Americans report their views becoming more supportive (19%) than report their views becoming more opposed (6%). Nearly three-quarters (73%) of Americans say their views have not changed.
On the issue of abortion, more than 8-in-10 (85%) Americans say their views have not changed over the last 5 years. Equal numbers of Americans say their current views are more supportive (7%) as say their views are more opposed (7%) to the legality of abortion.
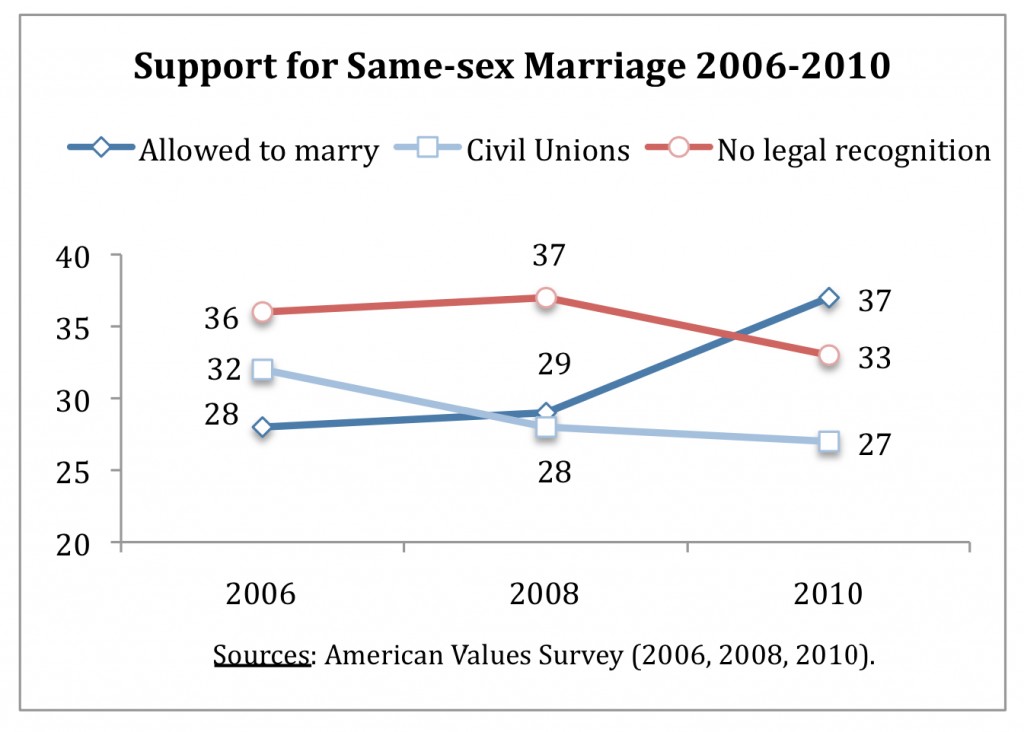 Americans’ self-reports of how their views are changing are consistent with the increase in support for same-sex marriage over the last four years. In 2006, a plurality (36%) of Americans said there should be no legal recognition for same-sex couples, about one-third (32%) favored allowing gay and lesbian couples to form civil unions, and less than 3-in-10 (28%) supported same-sex marriage. Four years later, a plurality (37%) now favor allowing gay and lesbian people to marry, roughly 1-in-4 (27%) favor civil unions, and one-third says there should be no legal recognition. Support for same-sex marriage was relatively stable between 2006 and 2008, but jumped 8 points between 2008 and 2010.
Immigration, the Environment, and the Minimum Wage
Immigration Reform
Nearly 6-in-10 (58%) Americans favor allowing undocumented immigrants who have been in the U.S. for several years to earn legal working status and an opportunity for citizenship in the future. Four-in-ten oppose this proposal.
Immigration reform with a provision for citizenship for undocumented immigrants has majority support across religious groups with the exception of white evangelical Protestants, who are divided on the issue (48% favor, 50% oppose). A majority of white mainline Protestants (52%) and white Catholics (52%) support immigration reform that provides a path to citizenship for undocumented immigrants, as do nearly two-thirds of black Protestants (63%) and the unaffiliated (65%). Nearly 9-in-10 (87%) Latino Catholics favor immigration reform.
There is more variation by political affiliation. Seven-in-ten Democrats are supportive of comprehensive immigration reform that provides undocumented immigrants a chance to become citizens, and nearly 6-in-10 (58%) independents also favor this idea. Only 44% of Republicans favor this type of immigration reform; a majority (54%) are opposed. Americans who identify with the Tea Party movement are more opposed to immigration reform than any other group. About 6-in-10 (61%) say they oppose allowing undocumented immigrants an opportunity for citizenship in the future.
Environmental Protection
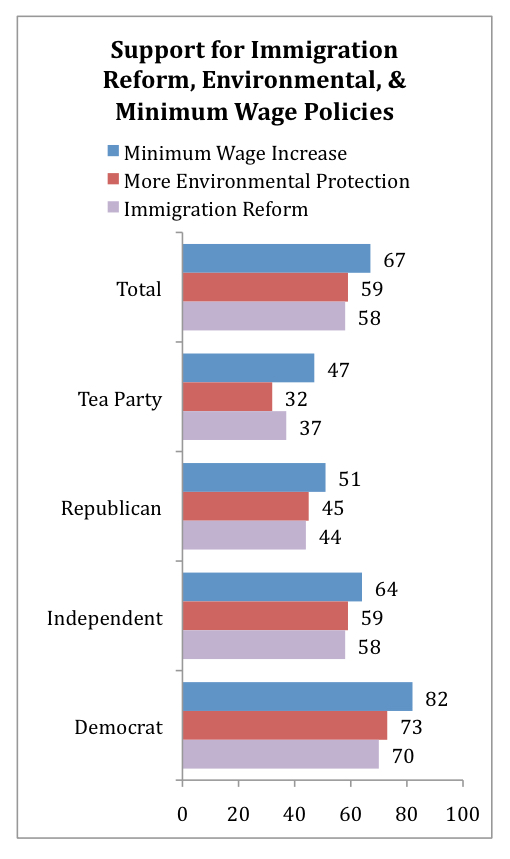 Despite the current economic woes facing the nation, nearly 6-in-10 (59%) Americans agree that more environmental protection is needed, even if it raises prices or costs jobs. Even among Americans who report being in poor financial shape, a majority (58%) support greater environmental protections even if it raises prices and costs jobs.
Strong majorities of Democrats (73%) and political independents (59%) are in favor of more environmental protections. Less than half (45%) of Republicans are in favor of increasing environmental protections (54% oppose). Americans who consider themselves part of the Tea Party movement have significantly different views than the general public. Less than one-third (32%) favor increased environmental protection if it costs jobs or raises prices.
With the exception of white evangelicals, who are closely divided on the issue (46% favor, 52% oppose), strong majorities of every religious group support increasing environmental protection even if it increases prices and costs jobs.
Increasing the Minimum Wage
More than two-thirds (67%) of the American public support increasing the minimum wage from $7.25 an hour to $10.00 an hour. More than one-third (35%) is strongly in favor.
Support remains strong across partisan divides, with the notable exception of those who identify with the Tea Party movement. Strong majorities of Democrats (82%) and independents (64%) are in favor of increasing the minimum wage. Republicans are less supportive, although a slim majority (51%) support an increase. Americans who identify with the Tea Party movement are most opposed and are split over the issue (47% in favor and 50% opposed).
A proposal to increase the minimum wage has solid support across every religious group.
Federalism versus the States
There is considerable diversity of opinion about whether several prominent issues should be decided at the national or state level. Public opinion depends significantly on the issue, and on support or opposition to the issue.
Two-thirds (67%) of Americans believe that immigration policy should be decided at the national level; only 30% believe the issue should be left up to the states to decide. On the issue of same-sex marriage, a slight majority (51%) of the general public favors having the federal government handle the issue, and 45% favor leaving it up to the states. On the issue of health care policy, a majority (55%) believe the issue should be decided at the national level, and about 4-in-10 say that the state government should handle it.
On the issues of same-sex marriage, there are differences in opinion between supporters and opponents of these issues. Six-in-ten same-sex marriage supporters say the issue should be decided at the national level; opponents of any legal recognition of gay couples’ relationships are divided, with 47% in favor of the federal government making the decision and 48% in favor of leaving it up to the states. A majority (54%) of Americans who support civil unions for same-sex couples but not marriage believe the issue should be decided at the state level.
Strong majorities of both opponents and supporters of immigration reform that allows undocumented immigrants the opportunity to attain citizenship say the issue should be decided by the federal government (61% and 72% respectively).
Recommended citation:
Jones, Robert P., and Daniel Cox. “Religion and the Tea Party in the 2010 Election: An Analysis of the Third Biennial American Values Survey.” PRRI. 2010. http://www.prri.org/research/religion-tea-party-2010/.
