The American Religious Landscape in 2023
Two-thirds of Americans (66%) identify as Christian, including 41% who identify as white Christians and 25% who identify as Christians of color. Over one-quarter of Americans (27%) are religiously unaffiliated, and 6% belong to a non-Christian religion.[1]
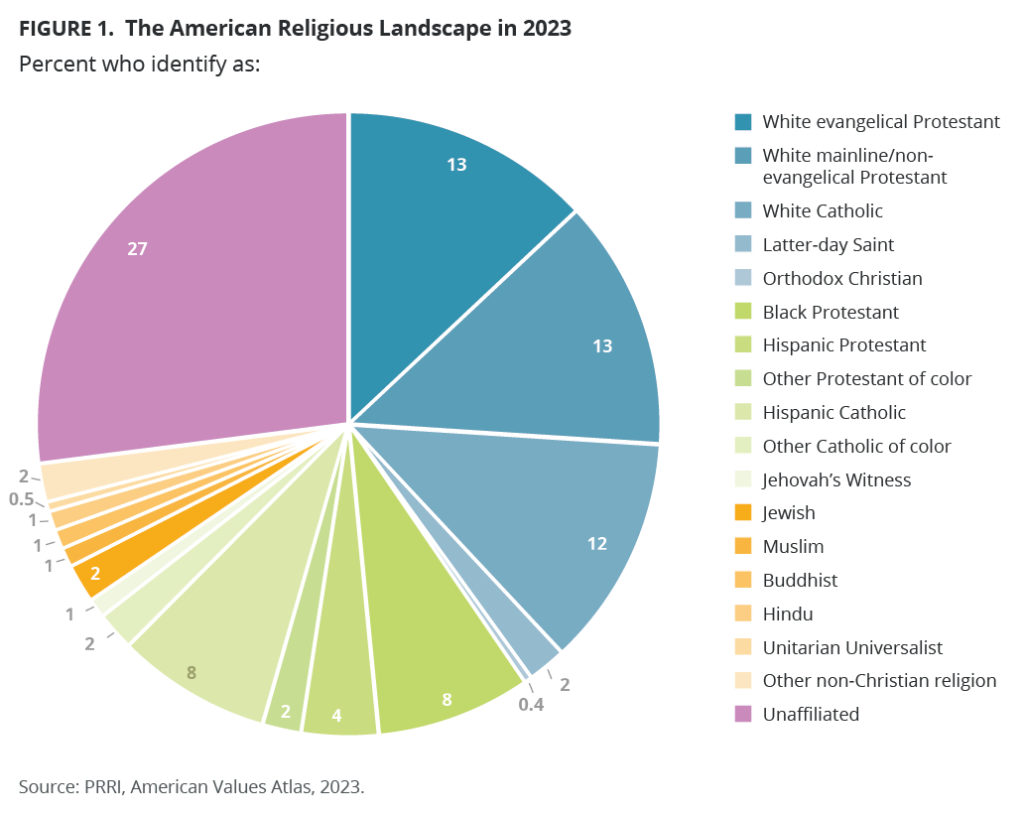
Among the 41% of Americans who identify as white Christians, 13% are white evangelical Protestants, 13% are white mainline/non-evangelical Protestants, 12% are white Catholics, and small percentages identify as Latter-day Saints (1%), Jehovah’s Witnesses (<0.5%), or Orthodox Christians (<0.5%).[2] Among the one-quarter of Americans who identify as Christians of color (25%), one in ten are Black Protestants (8%) and Hispanic Catholics (8%), 4% are Hispanic Protestants, 2% are other Protestants of color, 2% are other Catholics of color, and just 1% are Jehovah’s Witnesses, Latter-day Saints, or Orthodox Christians.[3] Just 6% of Americans are non-Christians, including Jewish Americans (2%), Muslims (1%), Buddhists (1%), Hindus (1%), and Unitarian Universalists (0.5%). More than one in four Americans (27%) are religiously unaffiliated; 5% of Americans identify as atheists, 5% identify as agnostic, and 17% claim they are “nothing in particular.”
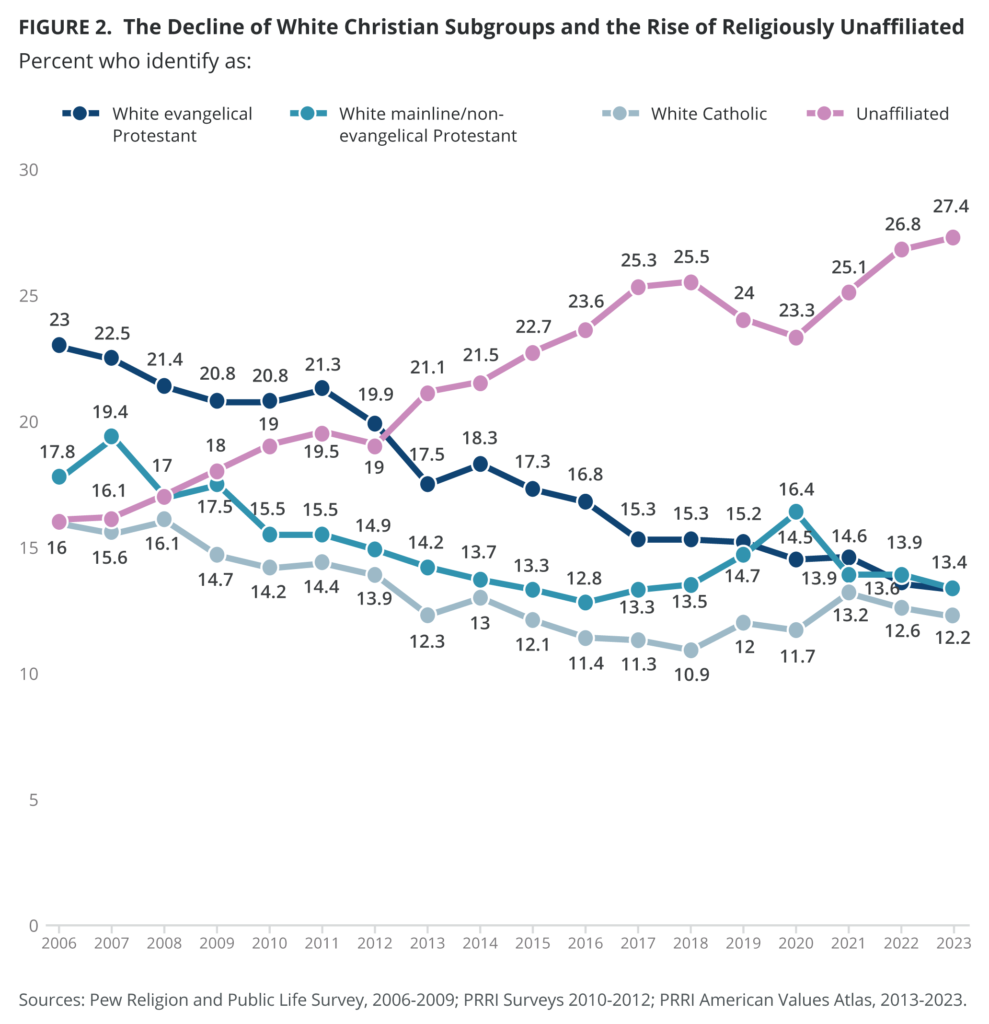
The Decline of White Christians
Over the past few decades, the percentage of Americans who identify as white Christians has decreased, while the percentage of those who are religiously unaffiliated has increased. In 2023, white Christians made up 41% of the American population, notably down from 57% in 2006.
Among white evangelical Protestants, we see a general downward trend over the last decade, while the percentages for both white mainline/non-evangelical Protestants and white Catholics have remained roughly the same. Specifically, since 2007, white mainline/non-evangelical Protestants have declined from 19% of the population to a low of 13% in 2023. White Catholics have also declined from 16% of the population in 2008 to a low of 12% in 2023. White evangelical Protestants have experienced the most significant drop in affiliation, from 23% of the population in 2006 to 13% in 2023.
Unaffiliated Americans, on the other hand, have consistently grown since 2006, from 16% to 27% in 2023.
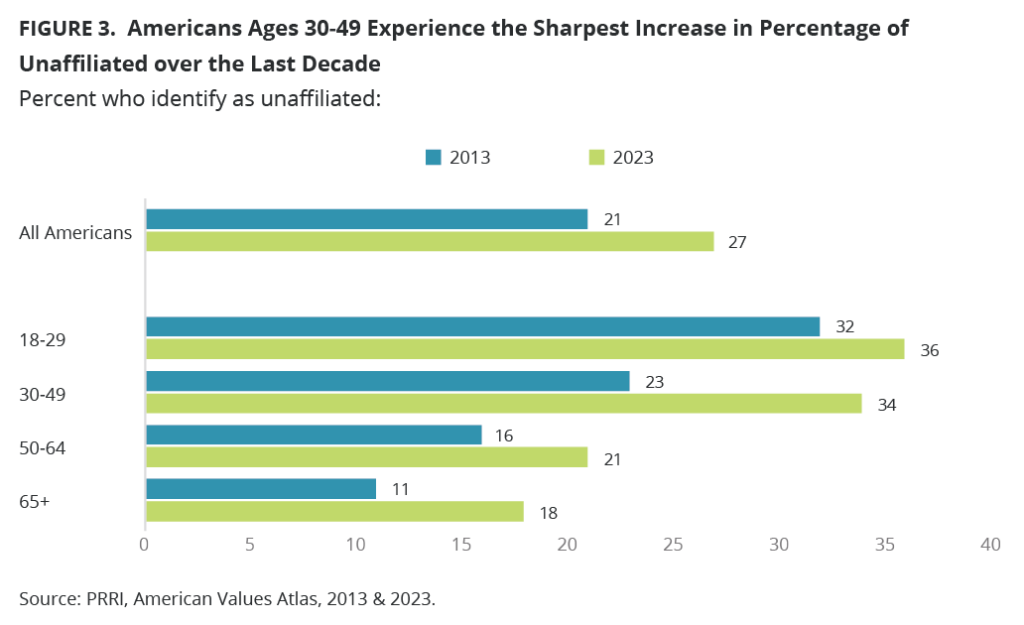
Rise of the Religiously Unaffiliated or “Nones”
Over the last decade, religiously unaffiliated Americans have grown consistently, from 21% in 2013 to 27% in 2023, with an initial peak of 25% in 2017 and 2018. That percentage decreased over the next two years but began to rise again in 2021 and eventually hit a new peak of 27% in both 2022 and 2023.
There have been significant increases in the proportion of religiously unaffiliated Americans within all age groups over the last decade. The most pronounced difference emerges among Americans ages 30-49, with an increase of 11 percentage points, from 23% in 2013 to 34% in 2023. The smallest increase of only 4 percentage points occurs among Americans ages 18-29, who in 2013 had much higher rates of religious disaffiliation than other age cohorts (32%). In 2023, 36% of younger Americans identify as religiously unaffiliated.
Christians of Color and Non-Christian Religious Groups
In 2023, one-quarter of Americans identify as Christians of color (25%). This number has remained consistent over the past decade. Individual groups of Christians of color, including Black Protestants, Hispanic Catholics, Hispanic Protestants, other Protestants of color, other Catholics of color, and Christians of color who identify as Jehovah’s Witnesses, Latter-day Saints, or Orthodox Christians have shifted by a single percentage point or less between 2013 and 2023.
The share of non-Christian religious groups has also remained steady between 2013-2023 (roughly 6%), including Jewish Americans, Muslims, Buddhists, Hindus, Unitarian Universalists, and other non-Christian religions.
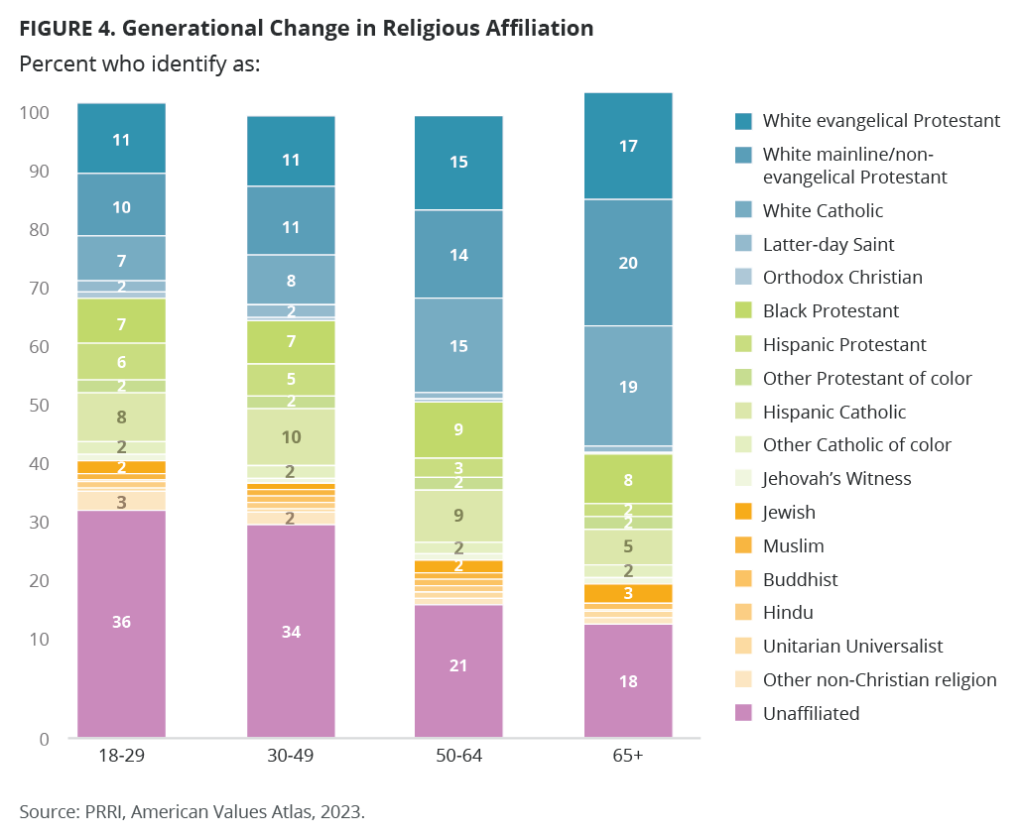
Demographics and Diversity Among Religious Groups
Younger Americans are More Religiously Diverse
Senior Americans (58%) are about twice as likely as young Americans ages 18-29 (30%) and ages 30-49 (32%) and 11 percentage points more likely than Americans ages 50-64 (46%) to identify as white Christians. By contrast, senior Americans (18%) are about 10 percentage points less likely than younger age groups to identify as Christians of color (26%, 27%, 27%, respectively).
Similar shares across all age groups identify as non-Christians, including 8% of Americans ages 18-29, 7% of Americans ages 30-49, 6% of Americans ages 50-64, and 6% of senior Americans.
Americans ages 18-29 (36%) and ages 30-49 (34%) are about twice as likely as Americans ages 50-64 (21%) and senior Americans (18%) to identify as religiously unaffiliated.
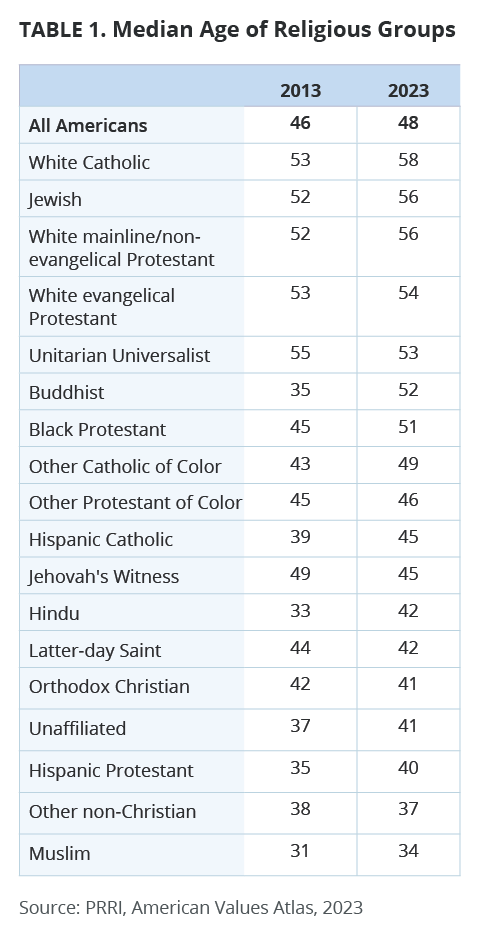
White Christian Groups and Jewish Americans Are the Oldest Religious Groups
White Christian groups are the oldest in the U.S., with higher median ages than the national median age of 48 for white Catholics (58), white mainline/non-evangelical Protestants (56), and white evangelical Protestants (54). Jewish Americans (56), Unitarian Universalists (53), Buddhists (52), and Black Protestants (51) also have median ages above the national median age. All other religious groups have median ages below 50: Hispanic Catholics (45), Jehovah’s Witnesses (45), Hindu Americans (42), Latter-day Saints (42), Orthodox Christians (41), religiously unaffiliated Americans (41), Hispanic Protestants (40), and Muslim Americans (34).
The median age of most religious groups has increased slightly over the past decade. Black Protestants (from 45 to 51) and Hispanic Catholics (from 39 to 45) have seen the largest increases since 2013. Other groups with large increases include Hispanic Protestants (from 35 to 40), white Catholics (from 53 to 58), white mainline/non-evangelical Protestants (from 52 to 56), and religiously unaffiliated Americans (from 37 to 41).
By contrast, the median age of Jehovah’s Witnesses (from 49 to 45) has decreased slightly over the same timeframe, while the median age of Latter-day Saints has remained steady since 2013.
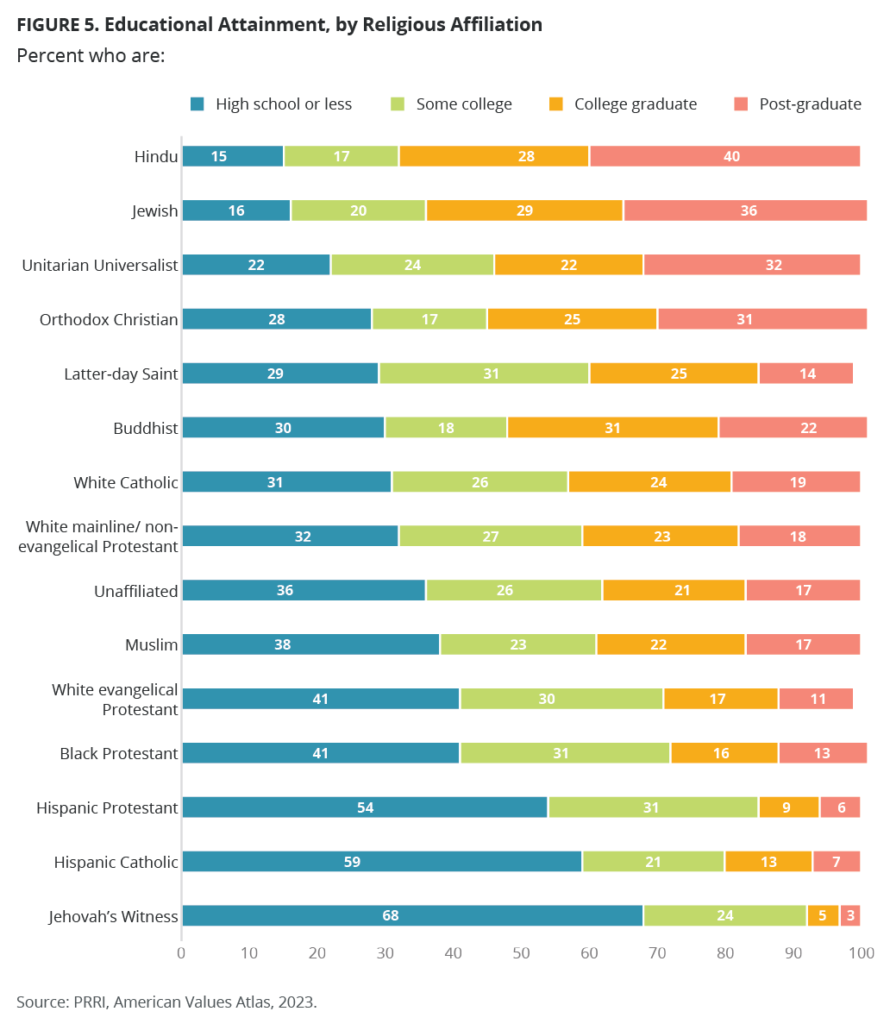
Hindus and Jewish Americans Most Likely to Have College and Postgraduate Degrees
Educational attainment varies considerably across religious traditions. Majorities of Hindus (68%), Jewish Americans (65%), Orthodox Christians (55%), Unitarian Universalists (54%), and Buddhists (53%) have four-year college degrees or higher. A plurality of white Catholics (43%), white mainline/non-evangelical Protestants (41%), Latter-day Saints (39%), Muslims (39%), and religiously unaffiliated Americans (38%) also hold at least a four-year degree, compared with nearly three in ten white evangelical Protestants (29%) and Black Protestants (29%), two in ten Hispanic Catholics (20%), 15% of Hispanic Protestants, and only 9% of Jehovah’s Witnesses. Between 2013 and 2023, there has been a notable increase in the shares of those Americans who hold a four-year degree across all religious groups, except for Unitarian Universalists, Hispanic Protestants, and Jehovah’s Witnesses, which decreased or remained the same.
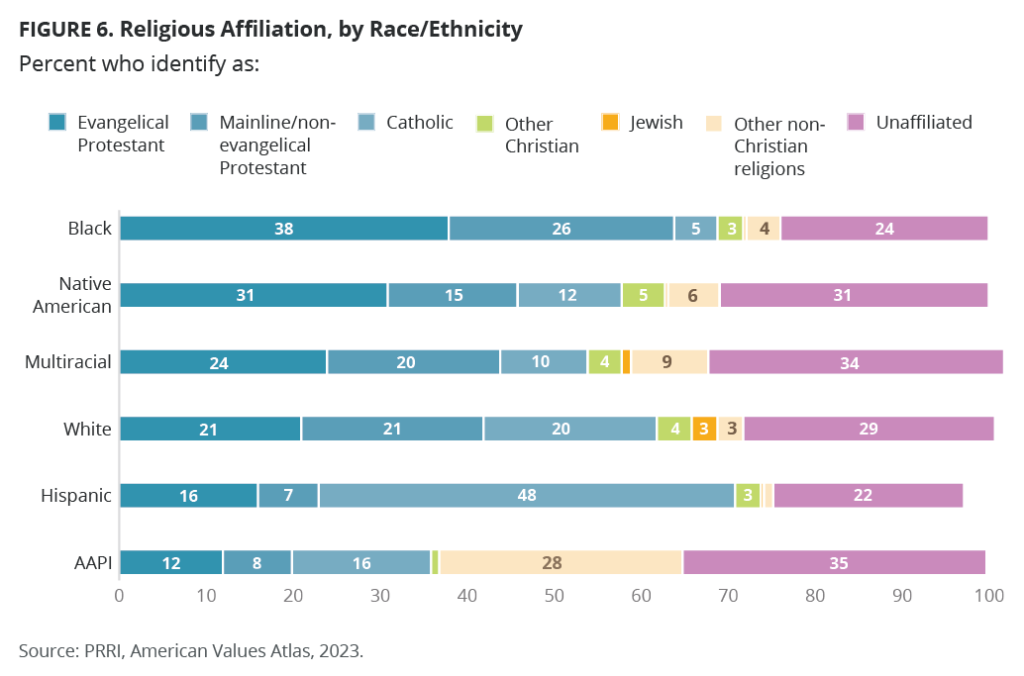
Black Americans and Hispanic Americans Identify as Christian at Higher Rates than Others
Around two-thirds of white Americans identify as Christian (66%). Over four in ten are Protestant (42%), including 21% who identify as evangelical and 21% who are mainline/non-evangelical. Nearly two in ten are Catholic (20%), 2% are Latter-day Saints, and 1% each are Jehovah’s Witnesses or Orthodox Christians. Most non-Christian white Americans are religiously unaffiliated (29%), compared with just 3% of Jewish Americans, 1% of Unitarian Universalists, and 2% of other non-Christian religions, including Muslim (<1%), Buddhist (<1%), and Hindu (<1%). Compared with 2013, white Americans have become less Christian overall (71% in 2013) and more likely to be unaffiliated (22% in 2013).
More than seven in ten Black Americans (72%) are Christian. Around two-thirds identify as Protestant (64%), including 38% who identify as evangelical and 26% as mainline/non-evangelical. Only 5% identify as Catholic, 2% as Jehovah’s Witness, 1% as Latter-day Saint, and less than 1% as Orthodox Christian. Only 4% of Black Americans identify as non-Christian, including 2% as Muslim, 2% as other non-Christian religion, and less than 1% as Jewish, Buddhist, Hindu, or Unitarian Universalist. Around one-quarter of Black Americans are religiously unaffiliated (24%). In 2013, Black Americans were more likely to identify as Christian (79%) and less likely to identify as unaffiliated (16%).
Three-fourths of Hispanic Americans (75%) identify as Christian, with around half (48%) identifying as Catholic. About one-quarter of Hispanic Americans (23%) identify as Protestants, including 16% who identify as evangelical and 7% as mainline/non-evangelical. Under one in ten identify with another Christian religion, including 3% of Jehovah’s Witnesses, 1% of Latter-day Saints, and less than 1% of Orthodox Christians. Only 2% of Hispanic Americans are non-Christian, including 1% of other non-Christians and less than 1% who identify as Jewish, Muslim, Buddhist, Hindu, or Unitarian Universalist. More than two in ten Hispanic Americans (22%) are religiously unaffiliated. Compared with 2013, more Hispanic Americans identify as Christian (79%) and slightly less identify as unaffiliated (18%).
Nearly four in ten Asian American and Pacific Islanders (AAPI) (37%) are Christian, the lowest of any racial group. Two in ten are Protestant (20%), including 12% who identify as evangelical and 8% as mainline/non-evangelical. Under two in ten are Catholic (16%), and less than 1% each identify as Jehovah’s Witness or Latter-day Saint. AAPIs are also the racial group with the highest percentage of non-Christians at 28%. Among non-Christian AAPIs, 14% identify as Hindu, 7% as Buddhist, 4% as Muslim, 2% as other non-Christian, and less than 1% as Unitarian Universalist. AAPIs are also the racial group most likely to be religiously unaffiliated, at 35%. These religious groups among AAPIs have changed little from 2013.
The majority of multiracial Americans (58%) identify as Christian. Among multiracial Christians, over four in ten are Protestant (44%), including 24% who identify as evangelical and 20% as mainline/non-evangelical. One in ten identify as Catholic (10%), 2% as Jehovah’s Witness, 2% as Latter-day Saint, and less than 1% as Orthodox Christian. Under one in ten are non-Christian (8%), including 5% who identify with other non-Christian religions, 1% each who identify as Jewish, Muslim, Buddhist, and Unitarian Universalist, and <1% who identify as Hindu. Around one-third of multiracial Americans (34%) are religiously unaffiliated. The share of multiracial Americans who identify as Christian has increased slightly since 2013 (54%), but there is little change in those who are religiously unaffiliated.
More than six in ten Native Americans (63%) are Christian. Under half identify as Protestants (46%), including 31% who identify as evangelical and 15% as mainline/non-evangelical. Over one in ten (12%) identify as Catholics, 2% each as Jehovah’s Witnesses and Orthodox Christians, and 1% as Latter-day Saints. Under one in ten Native Americans (7%) are non-Christian, with 5% who identify as other non-Christian religion, 1% who identify as Buddhist and Unitarian Universalist, and less than 1% who are Jewish. Over three in ten Native Americans (31%) identify as religiously unaffiliated. There have been no substantial changes in religious affiliation among Native Americans since 2013.
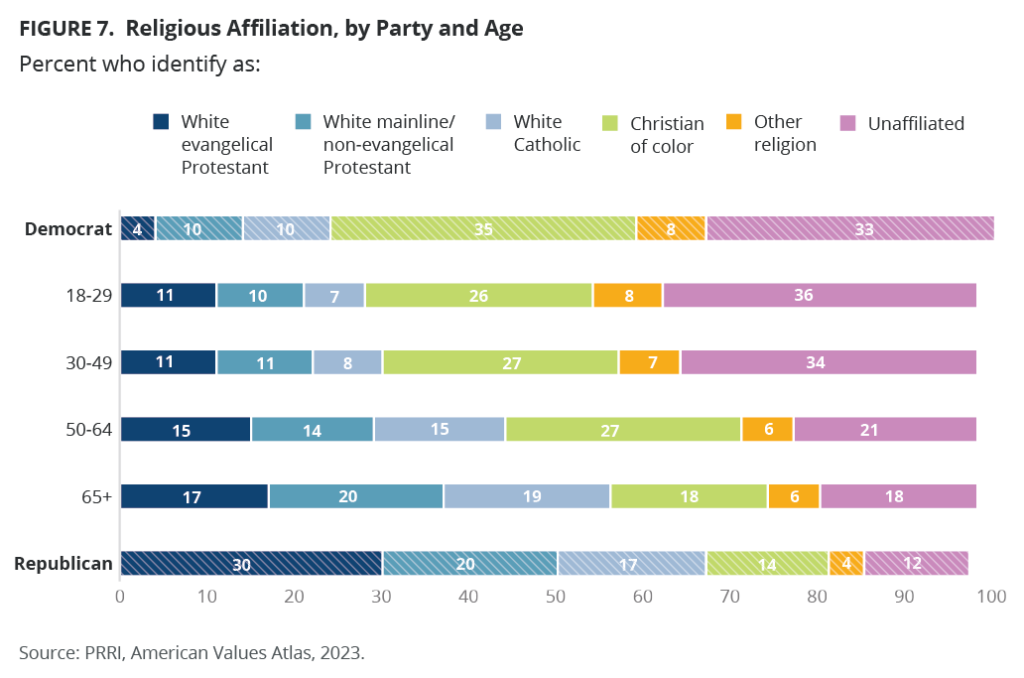
Democrats are More Religiously Diverse, While Republicans are More White and Christian
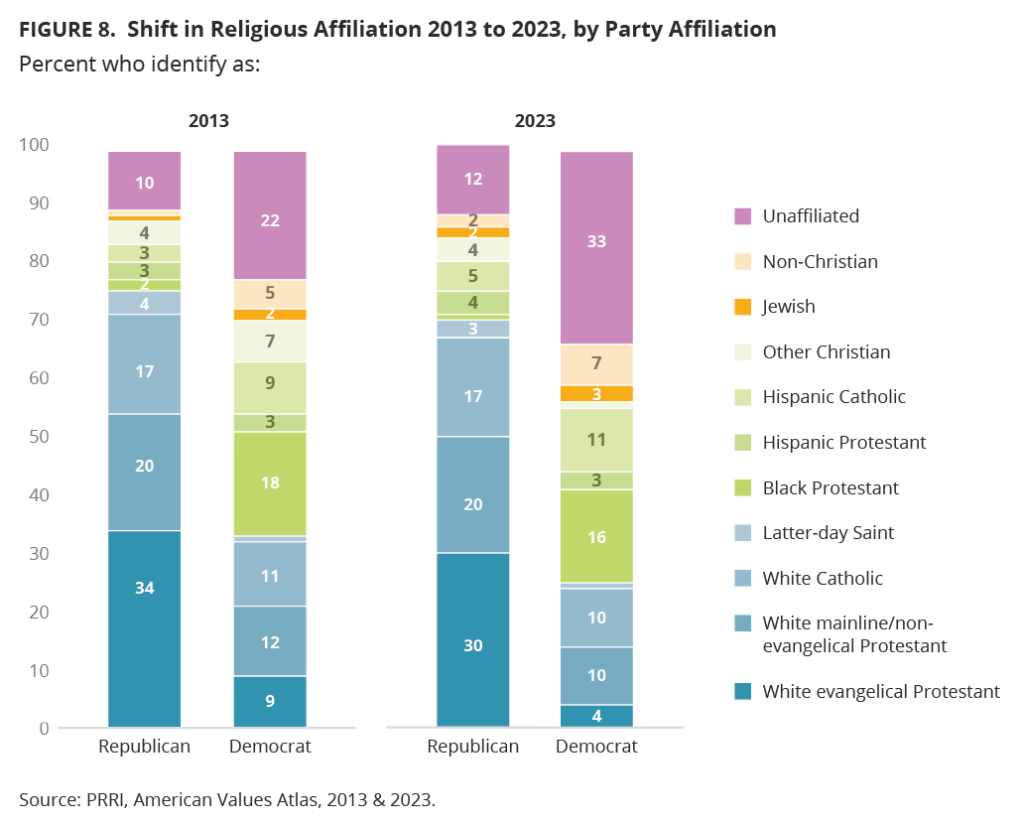
The majority of both major political parties identify as Christian. However, Republicans (84%) are 25 percentage points more likely than Democrats (59%) to do so. The biggest difference in the religious makeup of self-identified Republicans and Democrats is the proportion of white Christians, compared with Christians of color and the religiously unaffiliated. Seven in ten Republicans (70%) identify as white and Christian, compared with just 24% of Democrats. Among Republicans, 30% are white evangelical Protestants, 20% are white mainline/non-evangelical Protestants, and 17% are white Catholics. Among Democrats, those numbers fall to 4%, 10%, and 10%, respectively.
By contrast, 16% of Democrats are Black Protestants and 11% are Hispanic Catholics, compared with just 1% and 5%, respectively, among Republicans. Similar shares of Republicans (4%) and Democrats (3%) identify as Hispanic Protestant. Democrats (33%) are nearly three times as likely as Republicans (12%) to identify as religiously unaffiliated.
The religious makeup of Democrats generally resembles that of younger Americans ages 18–29. Three in ten young Americans ages 18-29 identify as white Christian (30%), 26% as Christians of color, 8% as another religion, and 36% as religiously unaffiliated. Similar shares of Americans ages 30–49 also identify as white Christian (32%), Christian of color (27%), another religion (7%), and unaffiliated (34%). About half of Americans ages 50-64 identify as white Christian (46%), 27% as Christian of color, 6% as another religion, and 21% as religiously unaffiliated. The Republican religious breakdown is more akin to the religious makeup of senior Americans over 65, whose majority identify as white Christian (58%), 18% as Christian of color, 6% as another religion, and 18% as unaffiliated. Notably, no age group is as white and Christian as Republicans.
Democrats have seen a more dramatic decrease in the share of Christians and an increase in unaffiliated since 2013, though Republicans have also seen this shift. Among both Democrats and Republicans, most of their decline in Christian affiliation is among white evangelical Protestants, who have declined by 4 percentage points among Republicans (from 34% in 2013 to 30% in 2023) and by 5 percentage points among Democrats (from 9% in 2013 to 4% in 2023). The share of the religiously unaffiliated has increased by 11 percentage points among Democrats (from 22% in 2013 to 33% in 2023) and remained relatively steady among Republicans.
American Religious Identity at the County Level
PRRI collected and aggregated data on religious diversity in America from 2014-2023, which contains 417,000 cases of Americans across all 50 states. The full data set was merged with county-level from the U.S. Census Bureau and the MIT Election Lab on 3,142 counties across all 50 states to produce a rigorous estimate of the religious demographics of every county in the U.S. County-level estimates of the proportion of the population fall into 18 religious/ racial categories and also used as inputs county-level gender, racial, age, income, education, and income distributions, the urbanicity of the county, and the percentage of the county who voted for Donald Trump in the 2020 US Presidential Election.[4] As counties with populations over 10,000 cover about 98% of the total U.S. population, we report the top 10 counties for each religious group that had at least 10,000 residents.
Because there is no measure of religious affiliation on any U.S. Census Bureau product, this PRRI Census of American Religion is the most comprehensive resource available on religious diversity in America.
Index of Religious Diversity
To measure religious diversity in the United States, this report uses an index developed to measure variations in the concentration of global religious populations. The index is calculated so that a score of 1 signifies complete diversity — every religious group is of equal size — and a score of 0 indicates a complete lack of diversity and one religious group comprises the entire population of a given county.[5]
- The average religious diversity score by county in the U.S. is 0.615.
- Religious diversity is highest in major urban centers. The 10 counties with the highest religious diversity scores with populations greater than 10,000 residents are:
- Montgomery County, Maryland (0.886)
-
- Kings County, New York (0.883)
-
- Nassau County, New York (0.876)
-
- Montgomery County, Pennsylvania (0.873)
-
- Contra Costa County, California (0.873)
-
- Suffolk County, Massachusetts (0.869)
-
- San Francisco County, California (0.868)
-
- San Mateo County, California (0.865)
-
- Rockland County, New York (0.865)
-
- Queens County, New York (0.862)
- Religious diversity scores are lowest in the deep South and in rural areas. The 10 counties with the lowest religious diversity scores with populations greater than 10,000 residents are:
-
- Holmes County, Mississippi (0.122)
-
- Chickasaw County, Mississippi (0.127)
-
- Simpson County, Mississippi (0.145)
-
- Macon County, Alabama (0.150)
-
- Appling County, Georgia (0.175)
-
- Hale County, Alabama (0.184)
-
- Calhoun County, South Carolina (0.189)
-
- Clay County, Mississippi (0.200)
-
- Coahoma County, Mississippi (0.210)
-
- Leflore County, Mississippi (0.217)
White Evangelical Protestant
- White evangelical Protestants make up 13% of the American population, a decline of 4 percentage points from 17% in 2013.
- Large shares of white evangelical Protestants are spread across the country but are particularly concentrated in counties in the South and Midwest. The 10 counties with populations greater than 10,000 with the largest concentrations of white evangelical Protestants are: [6]
-
- Marion County, Alabama (72%)
-
- Johnson County, Tennessee (71%)
-
- Fayette County, Alabama (69%)
-
- Prentiss County, Mississippi (68%)
-
- Campbell County, Tennessee (67%)
-
- Cocke County, Tennessee (66%)
-
- Tippah County, Mississippi (65%)
-
- McCreary County, Kentucky (65%)
-
- Madison County, Arkansas (65%)
-
- Cullman County, Alabama (64%)
- The median age of white evangelical Protestants is 54, up from 53 in 2013, and substantially older than the median age of all Americans (48).
- White evangelical Protestants are less likely than all Americans to hold at least a four-year college degree (29% vs. 35%). About four in ten white evangelical Protestants have a high school degree or less formal education (41%), three in ten have some college experience but no four-year degree (30%), 17% hold a four-year college degree, and 11% hold a postgraduate degree.
- White evangelical Protestants are predominantly concentrated in suburban (42%) and rural areas (35%), with 22% who live in urban areas.
- White evangelical Protestants overwhelmingly identify as Republicans (61%), with fewer than one-quarter who identify as independents (23%) and one in ten who identify as Democrats (9%).
White Mainline/Non-evangelical Protestant
- White mainline/non-evangelical Protestants make up 13% of the population, roughly similar to 2013 (14%).
- White mainline/non-evangelical Protestants are spread across the country but are particularly concentrated in counties in the upper Midwest. The 10 counties with populations greater than 10,000 with the largest concentrations of white mainline/non-evangelical Protestants are:
-
- Stutsman County, North Dakota (47%)
-
- Clayton County, Iowa (46%)
-
- Dunn County, Wisconsin (45%)
-
- Filmore County, Minnesota (45%)
-
- Mille Lacs County, Minnesota (44%)
-
- Washburn County, Wisconsin (43%)
-
- Sibley County, Minnesota (43%)
-
- Caroll County, Illinois (42%)
-
- Otter Tail County, Minnesota (41%)
-
- Freeborn County, Minnesota (41%)
- The median age of white mainline/non-evangelical Protestants is 56, up from 52 in 2013, and substantially older than the median age of all Americans (48).
- White mainline/non-evangelical Protestants are more likely to have a four-year college degree than Americans as a whole (41% vs. 35%). One-third of white mainline/non-evangelical Protestants (32%) have a high school degree or less formal education, 27% have some college experience but no degree, 23% hold a four-year degree, and 18% hold a postgraduate degree.
- Just under half of white mainline/non-evangelical Protestants (46%) live in suburban areas, while the remainder are evenly divided between rural (27%) and urban (26%) areas.
- A plurality of white mainline/non-evangelical Protestants identifies as Republicans (40%), while 31% identify as independents, and 23% identify as Democrats.
White Catholic
- White Catholics make up 12% of Americans, the same as in 2013.
- White Catholics are predominantly concentrated in the Northeast, the Midwest, and southern Louisiana. The 10 counties with populations greater than 10,000 with the largest concentrations of white Catholics are:
-
- Avoyelles Parish, Louisiana (60%)
-
- Dubuque County, Iowa (57%)
-
- Calumet County, Wisconsin (56%)
-
- Le Sueur County, Minnesota (52%)
-
- Lackawanna County, Pennsylvania (52%)
-
- Dubois County, Indiana (51%)
-
- Lafourche Parish, Louisiana (49%)
-
- Benton County, Minnesota (48%)
-
- Dukes County, Massachusetts (48%)
-
- Vermilion Parish, Louisiana (47%)
- The median age of white Catholics is 58, up from 53 in 2013, and much older than the median age of Americans as a whole (48). White Catholics have the highest median age of any Christian group.
- More than four in ten white Catholics hold at least a four-year college degree (43%), much higher than the share of all Americans (35%). About three in ten white Catholics (31%) have a high school degree or less traditional education, while 26% have some college experience, 24% hold a four-year college degree, and 19% hold a postgraduate degree.
- A broad majority of white Catholics live in suburban areas (59%), while 24% live in urban areas and 17% live in rural areas.
- White Catholics are divided politically, but lean Republican: 38% identify as Republicans, 31% identify as independents, and 25% identify as Democrats.
Latter-day Saint (Mormon)
- Latter-day Saints make up 2% of Americans, unchanged from 2013.
- Latter-day Saints primarily live in Utah, Idaho, and areas surrounding those states. The 10 counties with populations greater than 10,000 with the largest concentrations of Latter-day Saints are:
-
- Madison County, Idaho (89%)
-
- Utah County, Utah (81%)
-
- Cache County, Utah (70%)
-
- Franklin County, Utah (63%)
-
- Box Elder County, Utah (61%)
-
- Sanpete County, Utah (61%)
-
- Jefferson County, Idaho (61%)
-
- Sevier County, Utah (61%)
-
- Davis County, Utah (58%)
-
- Washington County, Utah (58%)
- The median age of Latter-day Saints 42, down from 44 in 2013; this is much younger than the median age of Americans as a whole (48). Latter-day Saints are the only Christian group where the median age has decreased slightly over the past decade.
- Around eight in ten Latter-day Saints are white (80%), while 12% are Hispanic, 4% are Black, 2% are AAPI, 1% are multiracial, and less than 1% are Native American.
- About four in ten Latter-day Saints hold at least a four-year college degree (39%), somewhat larger than the share of all Americans (35%). About three in ten Latter-day Saints have a high school degree or less formal education (29%) or some college experience (31%), while 25% hold a four-year degree and 14% hold a postgraduate degree.
- A majority of Latter-day Saints live in suburban areas (54%), while 35% live in urban areas, and 11% live in rural areas.
- A plurality of Latter-day Saints identifies as Republican (46%), while 34% identify as independents and 10% identify as Democrats.
Orthodox Christian
- Less than 1% of Americans identify as Orthodox Christian in 2023, which remains unchanged from 2013.
- Orthodox Christians are primarily concentrated in the Northeast. The ten 10 counties with populations larger than 10,000 with the largest concentrations of Orthodox Christians are:
-
- Nassau County, New York (3%)
-
- Montgomery County, Maryland (2%)
-
- Westchester County, New York (2%)
-
- Bergen County, New Jersey (2%)
-
- Montgomery County, Pennsylvania (2%)
-
- Middlesex County, New Jersey (2%)
-
- Fairfield County, Connecticut (2%)
-
- Rockland County, New York (2%)
-
- St. Louis County, Missouri (2%)
-
- Contra Costa County, California (2%)
- The median age for Orthodox Christians remained largely unchanged over the last decade (41 in 2023 vs. 42 in 2013) and is younger than the median age of all Americans (48).
- Almost all Orthodox Christians are white (87%), with just 6% identifying as Hispanic, 5% identifying as American Indian or Alaska Native, and 1% identifying as Black or AAPI.
- Three in ten Orthodox Christians have either a postgraduate degree (31%) or high school or less education (28%). One-quarter have a college degree (25%) and 17% have some college education.
- Six in ten Orthodox Christians (62%) live in suburban areas, while one-third live in urban areas (34%). Only 3% of Orthodox Christians live in rural areas.
- Just under four in ten Orthodox Christians identify as Republican (36%) or independent (37%) and 15% identify as Democrat.
Jehovah’s Witness
- The percentage of the population who identify as Jehovah’s Witnesses in 2023 (1%) remains unchanged from 2013.
- Small shares of Jehovah’s Witnesses are spread across the country with slightly higher concentrations in California and Florida. The 10 counties with populations larger than 10,000 with the largest concentrations of Jehovah’s Witnesses are:
-
- Orange County, Florida (2%)
-
- Fresno County, California (2%)
-
- Milwaukee County, Wisconsin (2%)
-
- Marion County, Indiana (2%)
-
- Pinellas County, Florida (2%)
-
- Kern County, California (2%)
-
- Oakland County, Michigan (2%)
-
- Wayne County, Michigan (2%)
-
- Ventura County, California (2%)
-
- St. Louis County, Missouri (2%)
- The median age of Jehovah’s Witnesses is 45, down from 49 in 2013, and slightly lower than the median age of all Americans (48).
- Approximately four in ten Jehovah’s Witnesses are Hispanic (38%), one-third are white (32%), and just under one-quarter are Black (23%). Very small shares of Jehovah’s Witnesses identify as multiracial (3%), American Indian/Alaska Native, and AAPI (both 2%).
- Seven in ten Jehovah’s Witnesses (68%) have a high school diploma or less education and one-quarter have some college education (24%). Only 5% of Jehovah’s Witnesses have a college degree and 3% have a postgraduate degree.
- Nearly half of all Jehovah’s Witnesses (49%) live in suburban areas, four in ten (38%) live in urban areas, and 13% live in rural areas.
- A large majority of Jehovah’s Witnesses do not identify with a specific political party, with 69% identifying as other/don’t know and 17% identifying as independent. Only 9% of Jehovah’s Witnesses identify as Democrat and 4% identify as Republican.
Black Protestant
- Black Protestants make up 8% of Americans, the same as in 2013.
- Black Protestants are predominantly concentrated in Southern states and metropolitan areas in the Midwest and Northeast. The Black Belt of Mississippi has particularly high concentrations of Black Protestants. The 10 counties with populations greater than 10,000 with the largest concentrations of Black Protestants are:
-
- Holmes County, Mississippi (83%)
-
- Macon County, Alabama (79%)
-
- Calhoun County, South Carolina (78%)
-
- Coahoma County, Mississippi (77%)
-
- Leflore County, Mississippi (71%)
-
- Hale County, Alabama (69%)
-
- Clay County, Mississippi (68%)
-
- Chickasaw County, Mississippi (65%)
-
- Williamsburg County, South Carolina (64%)
-
- Claibourne Parish County, Louisiana (61%)
- The median age of Black Protestants is 51, up from 45 in 2013, and somewhat older than the median age of all Americans (48).
- Black Protestants are less likely to have a four-year college degree than Americans as a whole (29% vs. 35%). Four in ten Black Protestants (41%) have a high school degree or less formal education, 31% have some college experience but no degree, 16% hold a four-year degree, and 13% hold a postgraduate degree.
- Half of Black Protestants (49%) live in urban areas, 42% live in suburban areas, and 9% live in rural areas.
- Black Protestants overwhelmingly identify as Democrats (65%), while 22% identify as independents, and just 5% identify as Republicans.
Hispanic Protestant
- Hispanic Protestants make up 4% of Americans, roughly similar to 2013 (3%).
- Hispanic Protestants are predominantly concentrated in the Southwest and West, particularly in states that share a border with Mexico. The 10 counties with populations greater than 10,000 with the largest concentrations of Hispanic Protestants are:
-
- Deaf Smith County, Texas (33%)
-
- Atascosa County, Texas (30%)
-
- Adams County, Washington (28%)
-
- Kames County, Texas (28%)
-
- Bee County, Texas (26%)
-
- Hidalgo County, Texas (26%)
-
- Rio Arriba County, New Mexico (21%)
-
- El Paso County, Texas (20%)
-
- Cameron County, Texas (19%)
-
- Moore County, Texas (19%)
- The median age of Hispanic Protestants is 40, up from 35 in 2013, and much younger than the median age of Americans as a whole (48). Hispanic Protestants have the lowest median age of any Christian group.
- Just 15% of Hispanic Protestants hold a four-year college degree, much lower than the share of all Americans (35%). A majority of Hispanic Protestants have a high school degree or less traditional education (54%), while 31% have some college experience, 9% hold a four-year college degree, and 6% hold a postgraduate degree.
- A majority of Hispanic Protestants live in suburban areas (52%), while 41% live in urban areas, and 7% live in rural areas.
- Hispanic Protestants are divided politically with 30% identifying as independents, 27% identifying as Republicans, and 25% identifying as Democrats.
Other Protestants of Color
- The percentage of other Protestants of color has remained largely unchanged since 2013 (3% vs. 2% in 2023).
- Other Protestants of color are primarily concentrated in Alaska, Oklahoma, and South Dakota. The 10 counties with populations larger than 10,000 with the largest concentrations of other Protestants of color are:
-
- Bethel Census Area, Alaska (60%)
-
- Adair County, Oklahoma (50%)
-
- Pontotoc County, Oklahoma (33%)
-
- Robeson County, North Carolina (33%)
-
- Big Horn County, Montana (30%)
-
- Grant Parish, Louisiana (22%)
-
- Muskogee County, Oklahoma (21%)
-
- Honolulu County, Hawaii (20%)
-
- Wagoner County, Oklahoma (20%)
-
- Rogers County, Oklahoma (20%)
- The median age for other Protestants of color is 46 in 2023, about the same as the median age for Americans as a whole (48).
- Americans who identify as AAPI make up 52% of other Protestants of color. Three in ten other Protestants of color identify as multiracial (27%) and 20% identify as American Indian or Alaska Native.
- Slightly more than one-third of other Protestants of color have a high school or less education (35%), while around one-quarter have some college education (23%) or a college degree (24%). Two in ten other Protestants of color (19%) have a postgraduate degree.
- Approximately four in ten other Protestants of color live in either urban (40%) or suburban (43%) areas. Just under one-fifth of other Protestants of color live in rural areas (17%).
- The majority of other Protestants of color identify as either Republican (32%) or independent (31%) and 23% identify as Democrat.
Hispanic Catholic
- Hispanic Catholics make up 8% of Americans, the same as in 2013.
- Hispanic Catholics are predominantly concentrated in the West and Southwest, particularly in counties near the border with Mexico. The 10 counties with populations greater than 10,000 with the largest concentrations of Hispanic Catholics are:
-
- Willacy County, Texas (71%)
-
- Maverick County, Texas (69%)
-
- Starr County, Texas (68%)
-
- Santa Cruz County, Arizona (57%)
-
- Webb County, Texas (57%)
-
- Frio County, Texas (57%)
-
- Reeves County, Texas (51%)
-
- Imperial County, California (49%)
-
- San Miguel County, New Mexico (48%)
-
- Val Verde County, Texas (48%)
- The median age of Hispanic Catholics is 45, up from 39 in 2013, and roughly similar to the median age of Americans as a whole (48).
- Two in ten Hispanic Catholics hold at least a four-year college degree (20%), much lower than the share of all Americans (35%). A majority of Hispanic Catholics (59%) have a high school degree or less traditional education, while 21% have some college experience, 13% hold a four-year college degree, and 7% hold a postgraduate degree.
- Hispanic Catholics are about equally divided between suburban areas (47%) and urban areas (46%), while 7% live in rural areas.
- A plurality of Hispanic Catholics identifies as Democrats (43%), while 30% identify as independents and 15% identify as Republicans.
Other Catholics of Color
- The percentage of other Catholics of color has remained the same over the last decade (2% in 2013 and 2023).
- Other Catholics of color are primarily concentrated in Alaska, Hawaii and the Dakotas. The 10 counties with populations larger than 10,000 with the largest concentrations of other Catholics of color are:
-
- Honolulu County, Hawaii (22%)
-
- Bethel Census Area, Alaska (13%)
-
- Apache County, Arizona (11%)
-
- Glacier County, Montana (11%)
-
- Maui County, Hawaii (10%)
-
- McKinley County, New Mexico (8%)
-
- Hawaii County, Hawaii (7%)
-
- Kauai County, Hawaii (7%)
-
- Orleans Parish, Louisiana (6%)
-
- Anchorage Municipality, Alaska (6%)
- The median age for other Catholics of color has increased since 2013, from 43 to 49 in 2023, and is now on par with the median age for all Americans (48).
- Over half of Catholics of color are AAPI (52%) and one-third are Black (34%). Multiracial and Native Americans each make up 7% of other Catholics of color.
- Three in ten other Catholics of color have a high school or less education (29%) or a college degree (28%), while a quarter have some college education (24%) and around one-fifth have a postgraduate degree (19%).
- A majority of other Catholics of color live in suburban areas (56%) and four in ten live in urban areas (38%). Only 7% of other Catholics of color live in rural areas.
- Nearly half of other Catholics of color identify as Democrats (47%), one-quarter identify as independent (26%), and 17% identify as Republican.
Jewish
- Jewish Americans make up 2% of Americans, unchanged from 2013.
- Jewish Americans primarily live in and around major metropolitan areas in the Northeast, particularly New York City. The 10 counties with populations greater than 10,000 with the largest concentrations of Jewish Americans are:
-
- Kings County, New York (12%)
-
- Rockland County, New York (12%)
-
- Nassau County, New York (12%)
-
- Montgomery County, Maryland (9%)
-
- Palm Beach County, Florida (9%)
-
- Bergen County, New Jersey (8%)
-
- Westchester County, New York (7%)
-
- New York County, New York (7%)
-
- Middlesex County, Massachusetts (7%)
-
- Montgomery County, Pennsylvania (6%)
- The median age of Jewish Americans is 56, up from 52 in 2013, and is much older than the median age of Americans as a whole (48).
- Nearly all Jewish Americans are white (95%), while 3% are Hispanic, 2% are Black. Less than 1% are AAPI, multiracial, or Native American.
- Around two-thirds of Jewish Americans hold at least a four-year college degree (65%), nearly double the share of all Americans (35%). Around two in ten Jewish Americans have a high school degree or less formal education (16%) or some college experience (20%), while 29% hold a four-year degree and 36% hold a postgraduate degree.
- A majority of Jewish Americans live in suburban areas (54%), while 39% live in urban areas, and 7% live in rural areas.
- Just under half of Jewish Americans identify as Democrats (47%), while 26% identify as independents, and 22% identify as Republicans.
Muslim
- Muslim Americans make up 1% of Americans, unchanged from 2013.
- Muslim Americans primarily live in and around major metropolitan areas across the country. The 10 counties with populations greater than 10,000 with the largest concentrations of Muslim Americans are:
-
- Queens County, New York (6%)
-
- Philadelphia County, Pennsylvania (5%)
-
- Kings County, New York (4%)
-
- Montgomery County, Maryland (3%)
-
- Fairfax County, Virginia (3%)
-
- Middlesex County, New Jersey (3%)
-
- Washington, District of Columbia (3%)
-
- Hudson County, New Jersey (3%)
-
- Essex County, New Jersey (3%)
-
- Nassau County, New York (2%)
- The median age of Muslim Americans is 34, up from 31 in 2013, and is much younger than the median age of Americans as a whole (48). Muslim Americans have the lowest median age of any major religious group.
- Muslim Americans are racially diverse: 37% are AAPI, 35% are white, 25% are Black, 2% are Hispanic, 2% are multiracial, and less than 1% are Native American.
- Around four in ten Muslim Americans hold at least a four-year college degree (39%), slightly higher than the share of all Americans (35%). Around four in ten Muslim Americans have a high school degree or less formal education (38%), compared with 23% who have some college experience, 22% who hold a four-year college degree, and 17% who hold a postgraduate degree.
- Half of Muslim Americans live in urban areas (50%), while 47% live in suburban areas, and just 3% live in rural areas.
- Around one-third of Muslims identify as either independents (35%) or Democrats (32%), while just 10% identify as Republicans.
Buddhist
- One percent of Americans identify as Buddhists, the same as in 2013.
- The majority of Buddhists live in California, New York, or other major metropolitan areas on the East and West Coasts. Although Buddhists do not make up more than 3% of any county, the 10 counties with populations larger than 10,000 with the largest concentrations of Buddhists:
-
- San Francisco County, California (3%)
-
- San Mateo County, California (3%)
-
- Contra Costa County, California (3%)
-
- Multnomah County, Oregon (3%)
-
- Montgomery County, Maryland (3%)
-
- Suffolk County, Massachusetts (3%)
-
- Washington, District of Columbia (3%)
-
- Denver County, Colorado (2%)
-
- Fairfax County, Virginia (2%)
-
- Travis County, Texas (2%)
- Over the last decade, the median age of Buddhist Americans has increased significantly, from 35 in 2013 to 52 in 2023, and is greater than the median age of all Americans (48).
- Most Buddhists are AAPI (62%), followed by one-quarter who are white (24%), 6% who are Black, 5% who are Hispanic, 2% who are multiracial, and 1% who are American Indian/Alaska Native.
- Three in ten Buddhists are either college graduates (31%) or have a high school degree or less education (30%). Around one-fifth have either a postgraduate degree (22%) or some college education (18%).
- Ninety percent of Buddhists live in urban (46%) or suburban (44%) areas. Only 10% of Buddhists live in rural areas.
- Around four in ten Buddhists identify as either politically independent (41%) or as Democrats (39%), with just 11% who identify as Republican.
Hindu
- One percent of Americans identify as Hindu, similar to 2013.
- Hindus are primarily concentrated near major metropolitan areas. The 10 counties with populations larger than 10,000 with the largest concentrations of Hindus are:
-
- Middlesex County, Massachusetts (3%)
-
- Santa Clara County, California (3%)
-
- Montgomery County, Maryland (3%)
-
- Middlesex County, New Jersey (2%)
-
- Nassau County, New York (2%)
-
- San Francisco County, California (2%)
-
- Collin County, Texas (2%)
-
- Bergen County, New Jersey (2%)
-
- Montgomery County, Pennsylvania (2%)
-
- Fairfax County, Virginia (2%)
- While the median age of Hindus (42) is less than the median of all Americans (48), it has increased significantly, from 33 in 2013.
- Nearly all Hindus are AAPI (94%), with only 2% being Black or white and 1% being Hispanic.
- Forty percent of Hindus have a postgraduate degree, which is greater than any other religious tradition. Three in ten Hindus have a college degree (28%) and fewer than one-fifth have some college education (17%) or a high school diploma or less education (15%).
- Just under two-thirds of Hindus live in suburban areas (63%) and one-third live in urban areas (34%). Only 3% of Hindus live in rural areas.
- Around four in ten Hindus identify as independent (43%), 36% identify as Democrats, and 11% as Republicans.
Unitarian Universalist
- Although the percentage of Unitarian Universalists has doubled over the last decade, they still make up less than 1% of the population.
- Unitarian Universalists are primarily concentrated near major metropolitan areas in the Northeast, Midwest, and West. The 10 counties with populations larger than 10,000 with the largest concentrations of Unitarian Universalists:
-
- Contra Costa County, California (1%)
-
- Fulton County, Georgia (1%)
-
- Multnomah County, Oregon (1%)
-
- St. Louis County, Missouri (1%)
-
- Montgomery County, Maryland (1%)
-
- Milwaukee County, Wisconsin (1%)
-
- Montgomery County, Pennsylvania (1%)
-
- Fairfield County, Connecticut (1%)
-
- Denver County, Colorado (1%)
-
- Suffolk County, Massachusetts (1%)
- The median age of Unitarian Universalists has decreased slightly since 2013, from 55 to 53 in 2023, and is lower than the median age of all Americans (48).
- Eight in ten Unitarian Universalists are white (79%) and 10% are Hispanic. Only 5% are Black, 3% are multiracial, and 2% are either AAPI or American Indian/Alaska Native.
- Unitarian Universalists are among the most highly educated religious groups, with 32% holding postgraduate degrees, and over two in ten having a college degree (22%), some college education (24%), and a high school degree or less education (22%).
- Nearly half of Unitarian Universalists live in suburban areas (47%), four in ten live in urban areas (39%), and 15% live in rural areas.
- Four in ten or more Unitarian Universalists identify as Democrats (46%) or independent (40%). Only 7% identify as Republican.
Other Non-Christian Religion
- Members of other non-Christian religions have nearly doubled, from 1% in 2013 to 2% in 2023.
- Practitioners of other non-Christian religions are primarily concentrated around major metropolitan areas. The 10 counties with populations larger than 10,000 with the largest concentrations of other non-Christians are:
-
- Multnomah County, Oregon (4%)
-
- Pierce County, Washington (4%)
-
- Anchorage Municipality, Alaska (4%)
-
- Honolulu County, Hawaii (4%)
-
- Contra Costa County, California (3%)
-
- Milwaukee County, Wisconsin (3%)
-
- Snohomish County, Washington (3%)
-
- Erie County, New York (3%)
-
- Monroe County, New York (3%)
-
- Washington County, Oregon (3%)
- The median age of members of other non-Christian religions has remained stable since 2013 (38 vs. 37 in 2023) and is nearly a decade younger the median age of all Americans.
- Nearly six in ten members of other non-Christian religions are white (57%), with fewer than one-fifth identifying as Black (14%), Hispanic (12%), AAPI (9%), multiracial (4%), or American Indian/Alaska Native (3%).
- More than four in ten members of other non-Christian religions have a high school diploma or less education (44%) and one-third have some college education (34%). Only 15% of other non-Christian Americans have a college degree and 8% have a postgraduate degree.
- Between four in ten and half of Americans who belong to other non-Christian religions live in urban (40%) or suburban areas (46%), with only 14% residing in rural areas.
- Three in ten members of other non-Christian religions identify as independent (29%) or Democrat (28%) and 18% identify as Republican. One-quarter report that they either do not know their political affiliation or affiliate with another party (25%).
Religiously Unaffiliated
- Over the last decade, the percentage of Americans who do not identify with any religious tradition has increased by 6 percentage points, from 21% in 2013 to 27% in 2023.
- Religiously unaffiliated Americans are primarily concentrated in the Western region of the United States. The 10 counties with populations larger than 10,000 with the largest concentrations of the religious unaffiliated are:
-
- San Juan County, Washington (62%)
-
- Gunnison County, Colorado (61%)
-
- Falls Church County, Virginia (59%)
-
- Glacier County, Montana (54%)
-
- Humboldt County, Nevada (54%)
-
- Los Alamos County, New Mexico (53%)
-
- Jefferson County, Washington (51%)
-
- Caledonia County, Vermont (51%)
-
- Addison County, Vermont (51%)
-
- Windham County, Vermont (51%)
- While still lower than the median age for all Americans (48), the median age for religiously unaffiliated Americans has increased since 2013, from 37 to 41 in 2023.
- Two-thirds of religiously unaffiliated Americans are white (65%), 14% are Hispanic, and 10% are Black. Fewer than one in ten religiously unaffiliated Americans are AAPI (8%), multiracial (2%), or Native American (1%).
- More than one-third of religiously unaffiliated Americans have a high school diploma or less education (36%) and one-quarter have some college education (26%). Around one-fifth of unaffiliated Americans have either a college (21%) or postgraduate degree (17%).
- Four in ten or more unaffiliated Americans live in urban (40%) or suburban areas (45%), while 15% live in rural areas.
- Nearly three-quarters of unaffiliated Americans identify as Democrat (38%) or independent (34%). Fewer religiously unaffiliated Americans identify as Republican (12%) than those who say they do not know their political affiliation or affiliate with another party (17%).
Survey Methodology
American Values Atlas 2023
This portion of the 2023 American Values Atlas consists of demographic information drawn from a random sample of 40,000 adults (age 18 and up) living in all 50 states, plus the District of Columbia, in the United States who are part of Ipsos’s KnowledgePanel. The survey research completed alongside this random sample was made possible through the generous support of the Arcus Foundation, the Evelyn and Walter Haas, Jr. Fund, the Gill Foundation, and Unitarian Universalist Veatch Program at Shelter Rock.
The KnowledgePanel’s recruitment process uses an addressed-based sampling methodology to select households from the Delivery Sequence File of the USPS – a database with full coverage of all delivery addresses in the U.S. As such, it covers all households regardless of their phone status, providing a representative sample. Unlike opt-in panels, households are not permitted to “self-select” into the panel, and participants are generally limited to how many surveys they can take within a given time period.
This sample of 40,000 adults was selected based on the panelists who provided their religious affiliation to the KnowledgePanel between January 1, 2023 and December 31, 2023. The sample was weighted to be representative of the adult U.S. population based on these dimensions with additional nesting of dimensions as well: age, gender, race and ethnicity, education, household income, language dominance, Census region, metropolitan status and states using an iterative proportional fitting (IPF) process that simultaneously balances the distributions of all variables. The needed benchmarks were from the 2022 March Supplement of the Current Population Survey (CPS), except language dominance, which is not available from CPS, was obtained from the 2021 American Community Survey (ACS). Weights were trimmed to prevent individual interviews from having too much influence on the final results.
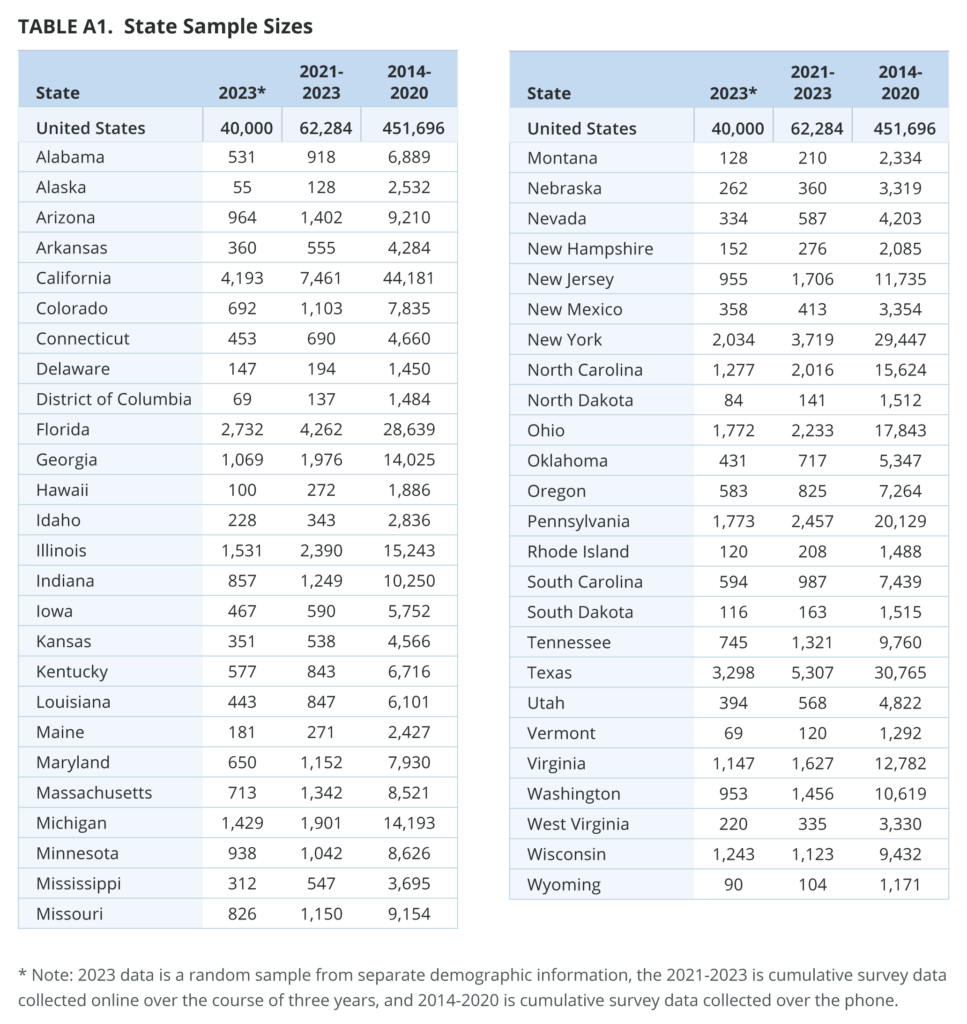
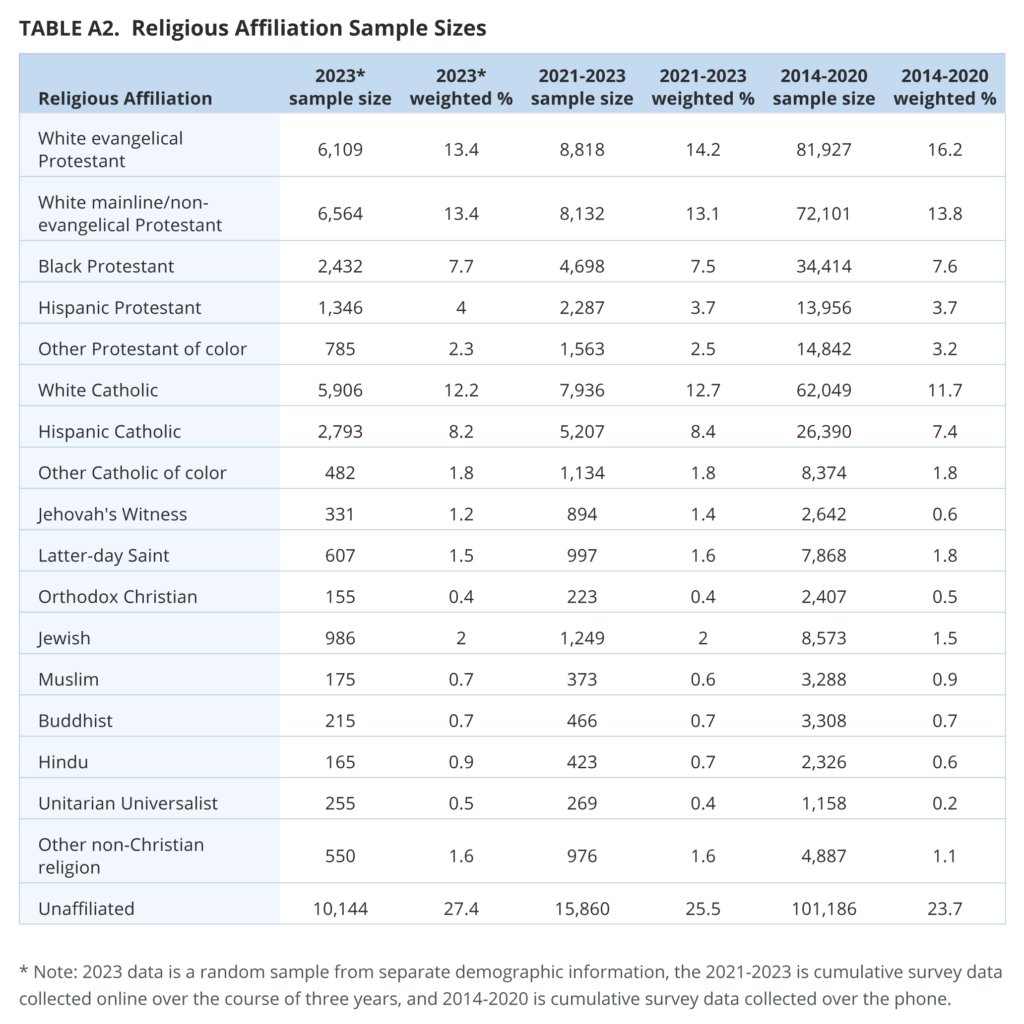
Table A1 shows the sample sizes for all 50 states plus the District of Columbia for the sample. Table A2 shows sample sizes for religious affiliations in the report. The margin of error for the American Values Atlas 2023 national sample estimates is +/- 0.7 percentage points at the 95% level of confidence, including the design effect of 1.9. In addition to sampling error, surveys may also be subject to error or bias due to question wording, context, and order effects. Additional details about the KnowledgePanel can be found on the Ipsos website: https://www.ipsos.com/en-us/solution/knowledgepanel
American Values Atlas 2014-2023
The 2014-2023 American Values Atlas (AVA) is a project of PRRI and was used to generate the county level estimates in the 2023 PRRI Census of Religion. The 2014-2023 dataset contains roughly 500,000 cases. The full data set was created by examining ten years’ worth of American Values Atlas surveys, from 2014-2023, which are random samples of adults (age 18 and up) living in all 50 states, plus the District of Columbia, in the United States. The survey research completed over the past ten years was made possible through the generous support of the Arcus Foundation, the Evelyn and Walter Haas, Jr. Fund, the Gill Foundation, and Unitarian Universalist Veatch Program at Shelter Rock.
From 2021-2023, data was collected via the KnowledgePanel’s recruitment process described above for the 2023 data. The sample of 62,284 adults was selected based on a random sample of U.S. adults who took AVA surveys between January 1, 2021 and December 31, 2023. Each year’s sample was weighted separately. Weighting processes were identical to that described above for the 2023 data using the 2019 American Community survey; in 2022, from the 2021 March Supplement of the Current Population Survey (CPS); and in 2023, from the 2022 March Supplement of the Current Population Survey (CPS). In all three years, language dominance, which is not available from CPS, was obtained from the American Community Survey (ACS). Party affiliation benchmarks were obtained from Pew’s annual National Public Opinion Reference Survey (NPORS). Weights were trimmed to prevent individual interviews from having too much influence on the final results.
From 2014-2020, each year, at least 1,000 interviews were completed each week, with percentages of cell phone interviews increasing over the years to 70% in 2020. Each week, interviewing occurred over a five- or six-day period, starting Tuesdays or Wednesdays and going through Sunday or Monday. The selection of respondents within households was accomplished by randomly requesting to speak with the youngest adult male or female currently living in the household. Data collection was based on stratified, single-stage, random-digit-dialing (RDD) of landline telephone households and randomly generated cell phone numbers. The sample was designed to represent the total U.S. adult population from all 50 states, including Hawaii and Alaska, and the District of Columbia. The landline and cell phone samples were provided by Marketing Systems Group.
The weighting for 2014-2020 was accomplished in two separate stages. The first stage of weighting corrects for different probabilities of selection associated with the number of adults in each household and each respondent’s telephone usage patterns. In the second stage, sample demographics were balanced to match target population parameters for gender, age, education, race and Hispanic ethnicity, region (U.S. Census definitions), population density, and telephone usage. The population density parameter was derived from 2010 Census data. The telephone usage parameter came from an analysis of the January-June 2018 National Health Interview Survey. All other weighting parameters were derived from an analysis of the U.S. Census Bureau’s March 2018 Current Population Survey. The sample weighting was accomplished using iterative proportional fitting (IFP), a process that simultaneously balances the distributions of all variables. Weights are trimmed so that they do not exceed 4.0 or fall below 0.25 to prevent individual interviews from having too much influence on the final results. The use of these weights in statistical analysis ensures that the demographic characteristics of the sample closely approximate the demographic characteristics of the target populations.
Table A1 shows the sample sizes for all 50 states for the overall 2014-2023 dataset. Table A2 shows sample sizes for religious affiliations in the report.[7] The margin of error for the total sample in both 2021 and 2022 is +/- 0.9 percentage points at the 95% level of confidence. The margin of error for the total sample in 2023 is +/- 0.8 percentage points at the 95% level of confidence. The design effects for each year’s surveys range from 1.52-1.67. For the total 2014-2020 sample, the margin of error is +/- 0.2 percentage points at the 95% level of confidence. The design effect of 1.4 is included in the margins of error. In addition to sampling error, surveys may also be subject to error or bias due to question wording, context, and order effects. Additional details about the KnowledgePanel can be found on the Ipsos website: https://www.ipsos.com/en-us/solution/knowledgepanel
County-Level Model Methodology
PRRI worked with Ipsos to use the American Values Atlas data from 2014-2023. The full data set included a total number of 417,000 cases of Americans (ages 18 and over) who provided valid answers for religious affiliation and other characteristics (i.e., age, income, education, metro area, race, and geographic information) to produce county-level estimates. Survey respondents with valid answers were pooled from the two different sources described above (62,246 KnowledgePanel respondents, 2021-2023; 351,531 phone respondents, 2014-2020). To generate county-level estimates for each religious affiliation in 3,142 counties in all 50 states, plus the District of Columbia, a technique called Bayesian Dirichlet small area estimation (SAE) was employed. The SAE estimates have varying measurement error based on the size of the county and the number of surveys completed in each county. Smaller counties have larger measurement errors.
The SAE model was an area-level model (generated for all counties with 20 or more survey respondents) and used as inputs county-level estimates of the proportion of the population falling into 18 religious / racial categories, in conjunction with county-level racial, age, income, education, and income distributions, the urbanicity of the county, and the percentage of the county who voted for Donald Trump in the 2020 US Presidential Election. The model featured random effects for State and Census Region. The SAE model was then used to predict the percentage of persons falling into each of the 18 religious / racial categories for all 3,142 counties in the US as of 2023. Where a county had a sample size of 500 or more in the pooled sample, its survey estimate was used in place of its SAE model estimate.
[1] Throughout this report, the term “white” signifies respondents who identify as white or Caucasian and do not identify as Hispanic or Latino. “Christian of color” includes Christians who identify as Black, Hispanic, Asian or Pacific Islander American, Native American, multiracial, or any other nonwhite race or ethnicity. “Religiously unaffiliated” includes those who claim no religion in particular, atheists, and agnostics. “Non-Christians” includes Jewish Americans, Muslims, Hindus, Buddhists, Unitarian Universalists, and adherents of any other world religion.
[2] Christian respondents were asked: “Would you describe yourself as a ‘born again’ or ‘evangelical Christian,’ or not?” Respondents who self-identify as white, non-Hispanic, or Protestant and identify as born-again or evangelical are categorized as white evangelical Protestants. Respondents who self-identify as white, non-Hispanic, or Protestant and do not identify as born-again or evangelical are categorized as white mainline/non-evangelical Protestants.
[3] Other Protestants of color include Protestants who are Asian or Pacific Islander American, Native American, multiracial, or any other race or ethnicity. Other Catholics of color include Catholics who are Black, Asian or Pacific Islander American, Native American, multiracial, or any other race or ethnicity. These groups are combined due to small sample sizes.
[4] For the first time, PRRI produced county level estimates in 2020 for 14 religious groups, including all white Christians, white evangelical Protestants, white mainline/ non-evangelical Protestants, Black Protestants, Hispanic Protestants, white Catholics, Hispanic Catholics, Latter-day Saints, other Christians, Jewish Americans, Muslims, Buddhists, Hindus, and unaffiliated. In 2023, we expanded the “other Christians” category to include separate county level estimates for four additional Christian groups: Jehovah’s Witnesses, other Black Catholics, other Protestants of color, and Orthodox Christians. In addition, we added separate county level estimates for members of other religions and Unitarian Universalists. However, in 2023, we did not estimate county-level data for all white Christians as one group. Due to natural changes in internal migration patterns and the effects of the 2020 pandemic, as well as changes in the method used to calculate these estimates in 2023, direct comparisons between 2020 and 2023 results should be made with caution. For details on the 2020 Census of American Religion, see: https://www.prri.org/research/2020-census-of-american-religion/
[5]The religious diversity for each state was calculated using the Religious Diversity Index, a variant of the Herfindahl-Hirschman Index, a widely used measure of diversity among human and biological populations. See “The Herfindahl-Hirschman Index: A Concentration Measure Taking the Consumer’s Point of View,” Charles R. Laine, The Antitrust Bulletin, June 22, 1995. For this report, the Religious Diversity index is based on 9 overall religious categories: Protestants, Catholics, Orthodox, Jewish, Muslims, Buddhists, Hindu, unaffiliated, and other religions.
[6] Throughout this report, we round down any percentages lower than X.499.
[7] Tables A1 and A2 show number of cases for valid answers to religious affiliation.