In the 2020 presidential election, President Joe Biden won a slim majority of the votes in Michigan (50.6%), while former President Donald Trump won 47.8% of the state’s vote. Using data from PRRI’s 2023 American Values Atlas, this Spotlight Analysis presents a demographic and religious profile of Michiganders and the issues that are important to them and their voting choices ahead of the 2024 presidential election.
- The median age of adults in Michigan is 48, the same as the median age of all American adults (48).
- Less than four in ten Michiganders (36%) have a high school education or less, followed by 29% who have some college education, 20% who have a four-year degree, and 15% who have a postgraduate degree.
- Nearly eight in ten Michiganders identify as white (79%), a higher rate than the national average of 62%. More than one in ten Michigan residents identify as Black (12%) and only 4% identify as Hispanic, which is significantly lower than the national average (17%). Less than one in ten Michiganders identify as either multiracial (3%), AAPI (2%), or Native American (<1%).
- Around one-third (34%) of Michiganders identify as a Democrat, followed by 28% as independent and 26% as Republican.
- Michiganders are almost evenly split on ideological identity, with 34% identifying as moderate, 33% as liberal, and 31% as conservative. Michigan residents are more likely to identify as liberal than all Americans nationwide (33% vs. 28%, respectively).
- Using PRRI’s Christian nationalism scale, the majority of Michiganders qualify as Christian nationalism Rejecters(30%) or Skeptics (39%). Around two in ten qualify as Christian nationalism Sympathizers (18%) and only 8% of Michiganders qualify as Christian nationalism Adherents, lower than the national average of 10%.
Michigan’s Religious Landscape
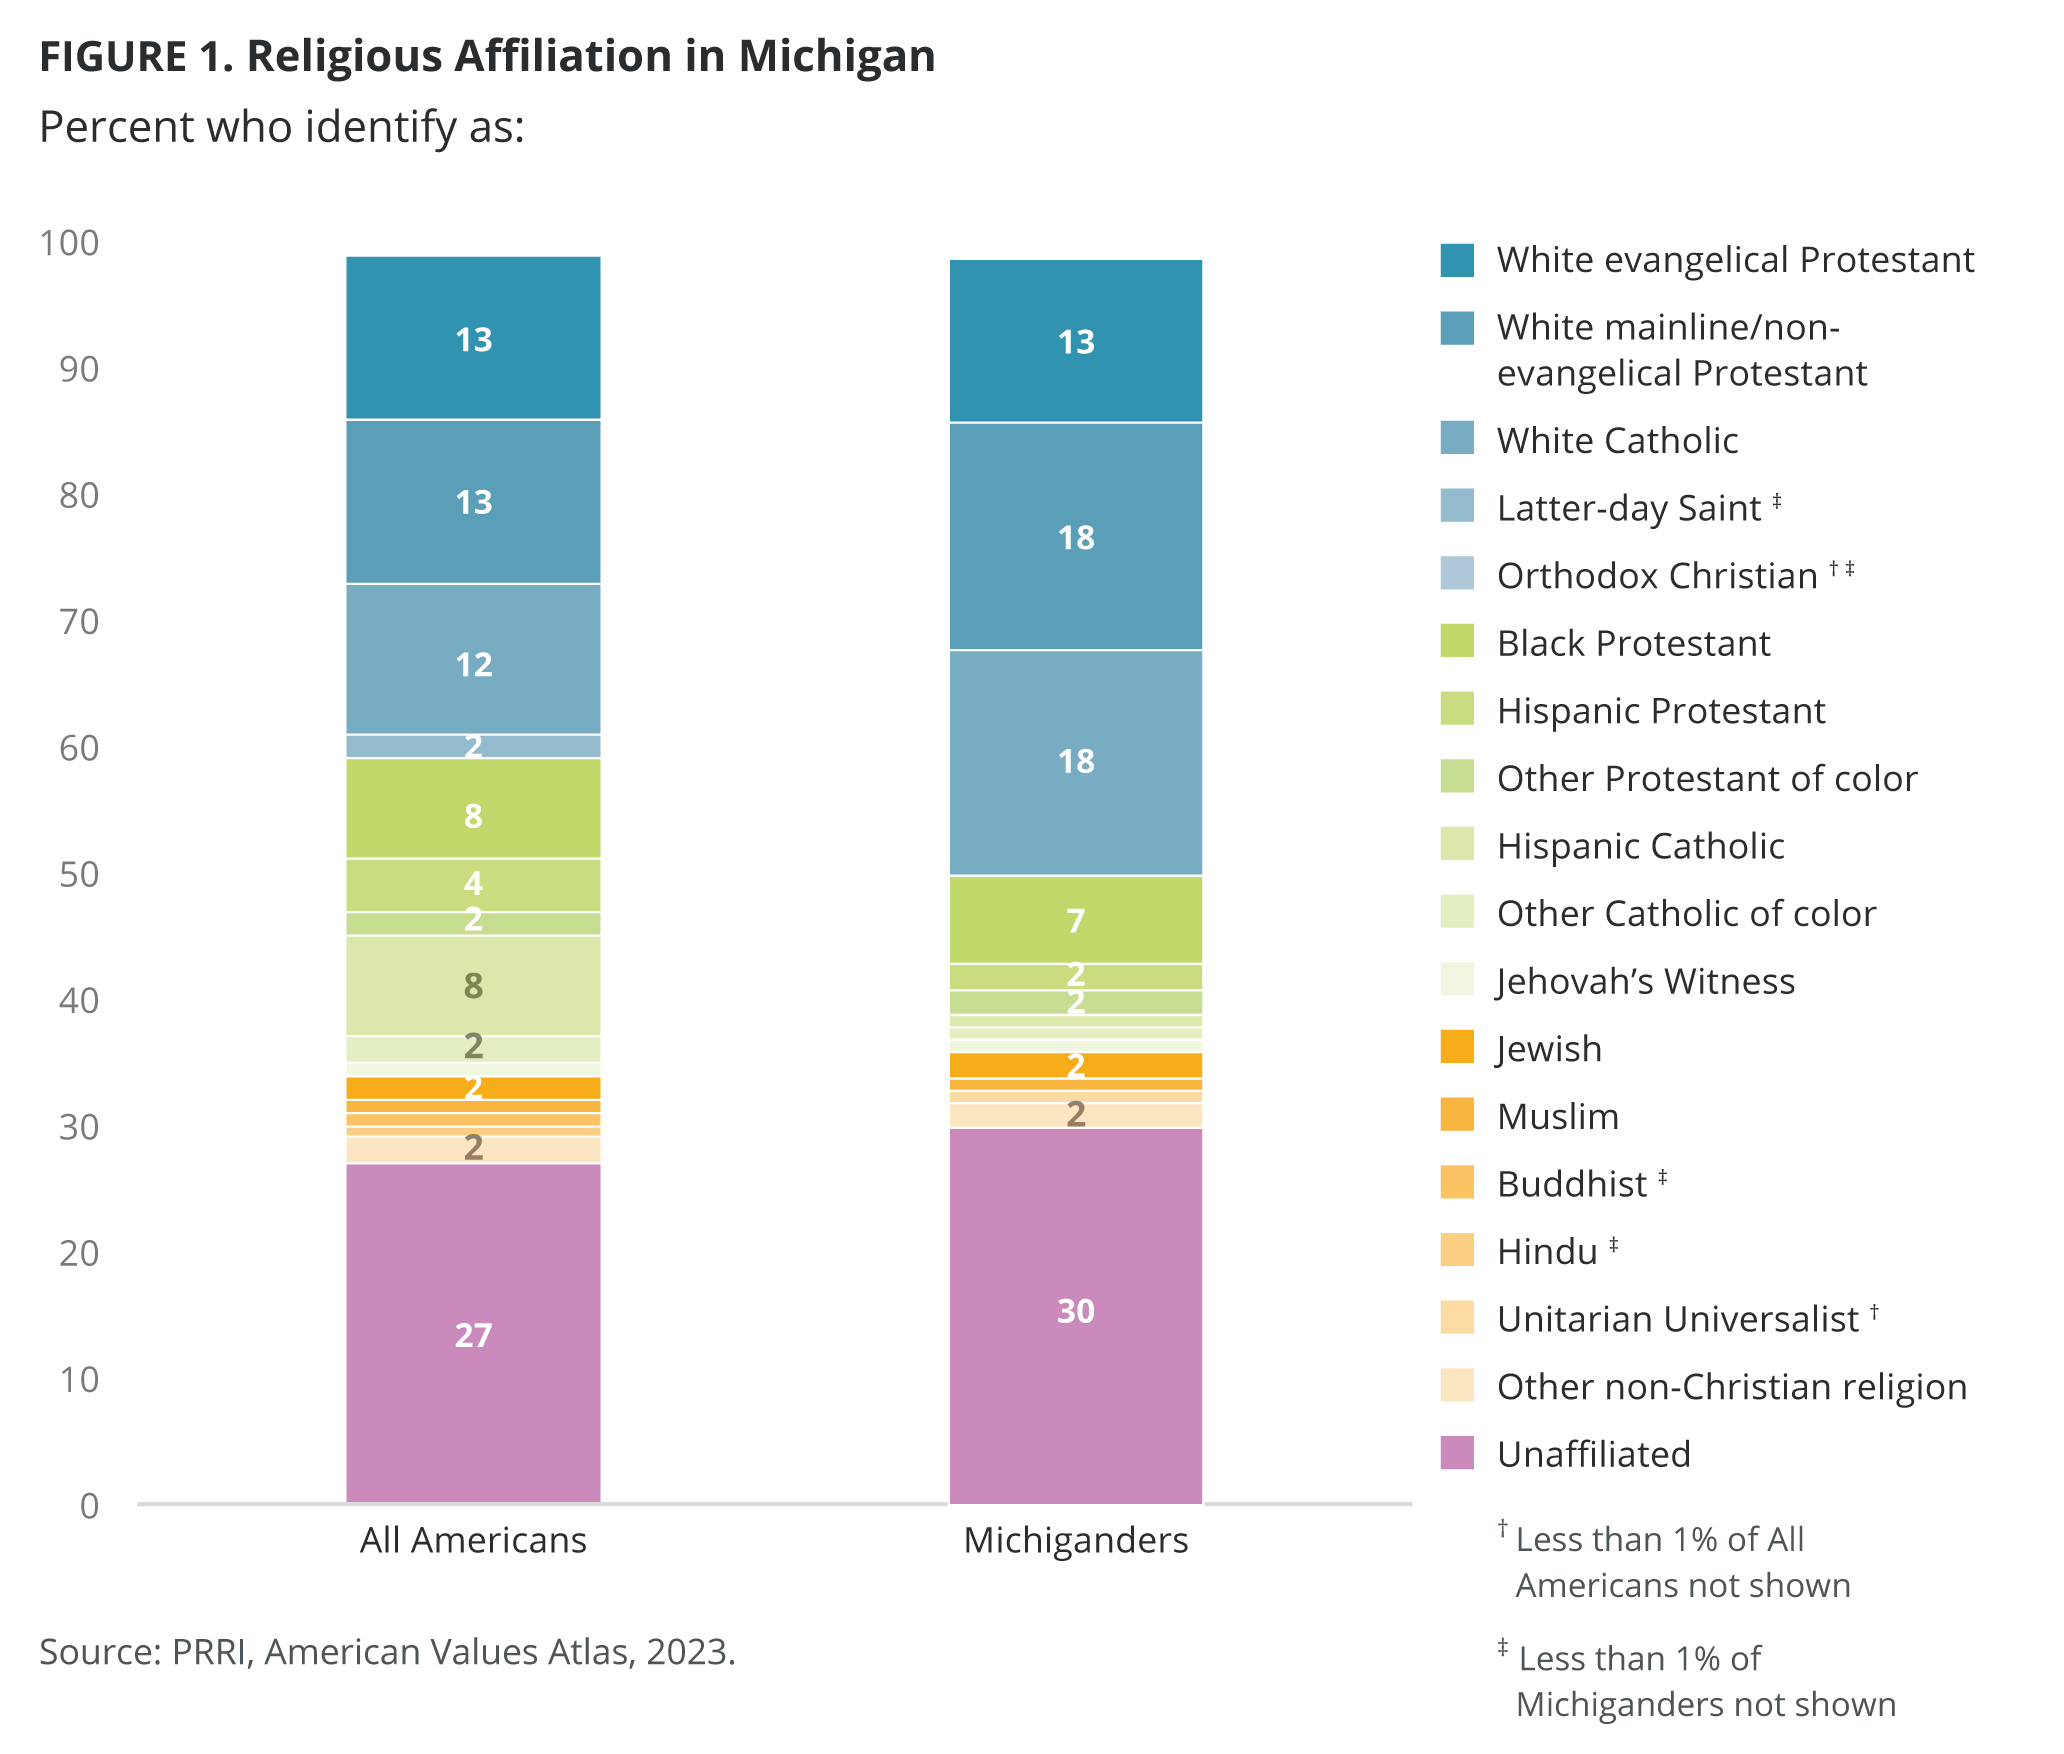
Three in ten Michiganders (30%) are religiously unaffiliated, representing the largest religious category in the state. Nearly two in ten Michiganders identify as either white mainline/non-evangelical Protestant (18%) or white Catholic (18%), which are higher rates than nationally for those groups (13% and 12%, respectively). Only 1% of Michiganders identify as Hispanic Catholic, compared with 8% of all Americans; the percentages of other religious groups in Michigan are similar to those of all Americans at large.
Michiganders’ Litmus Test Issues by Party Affiliation
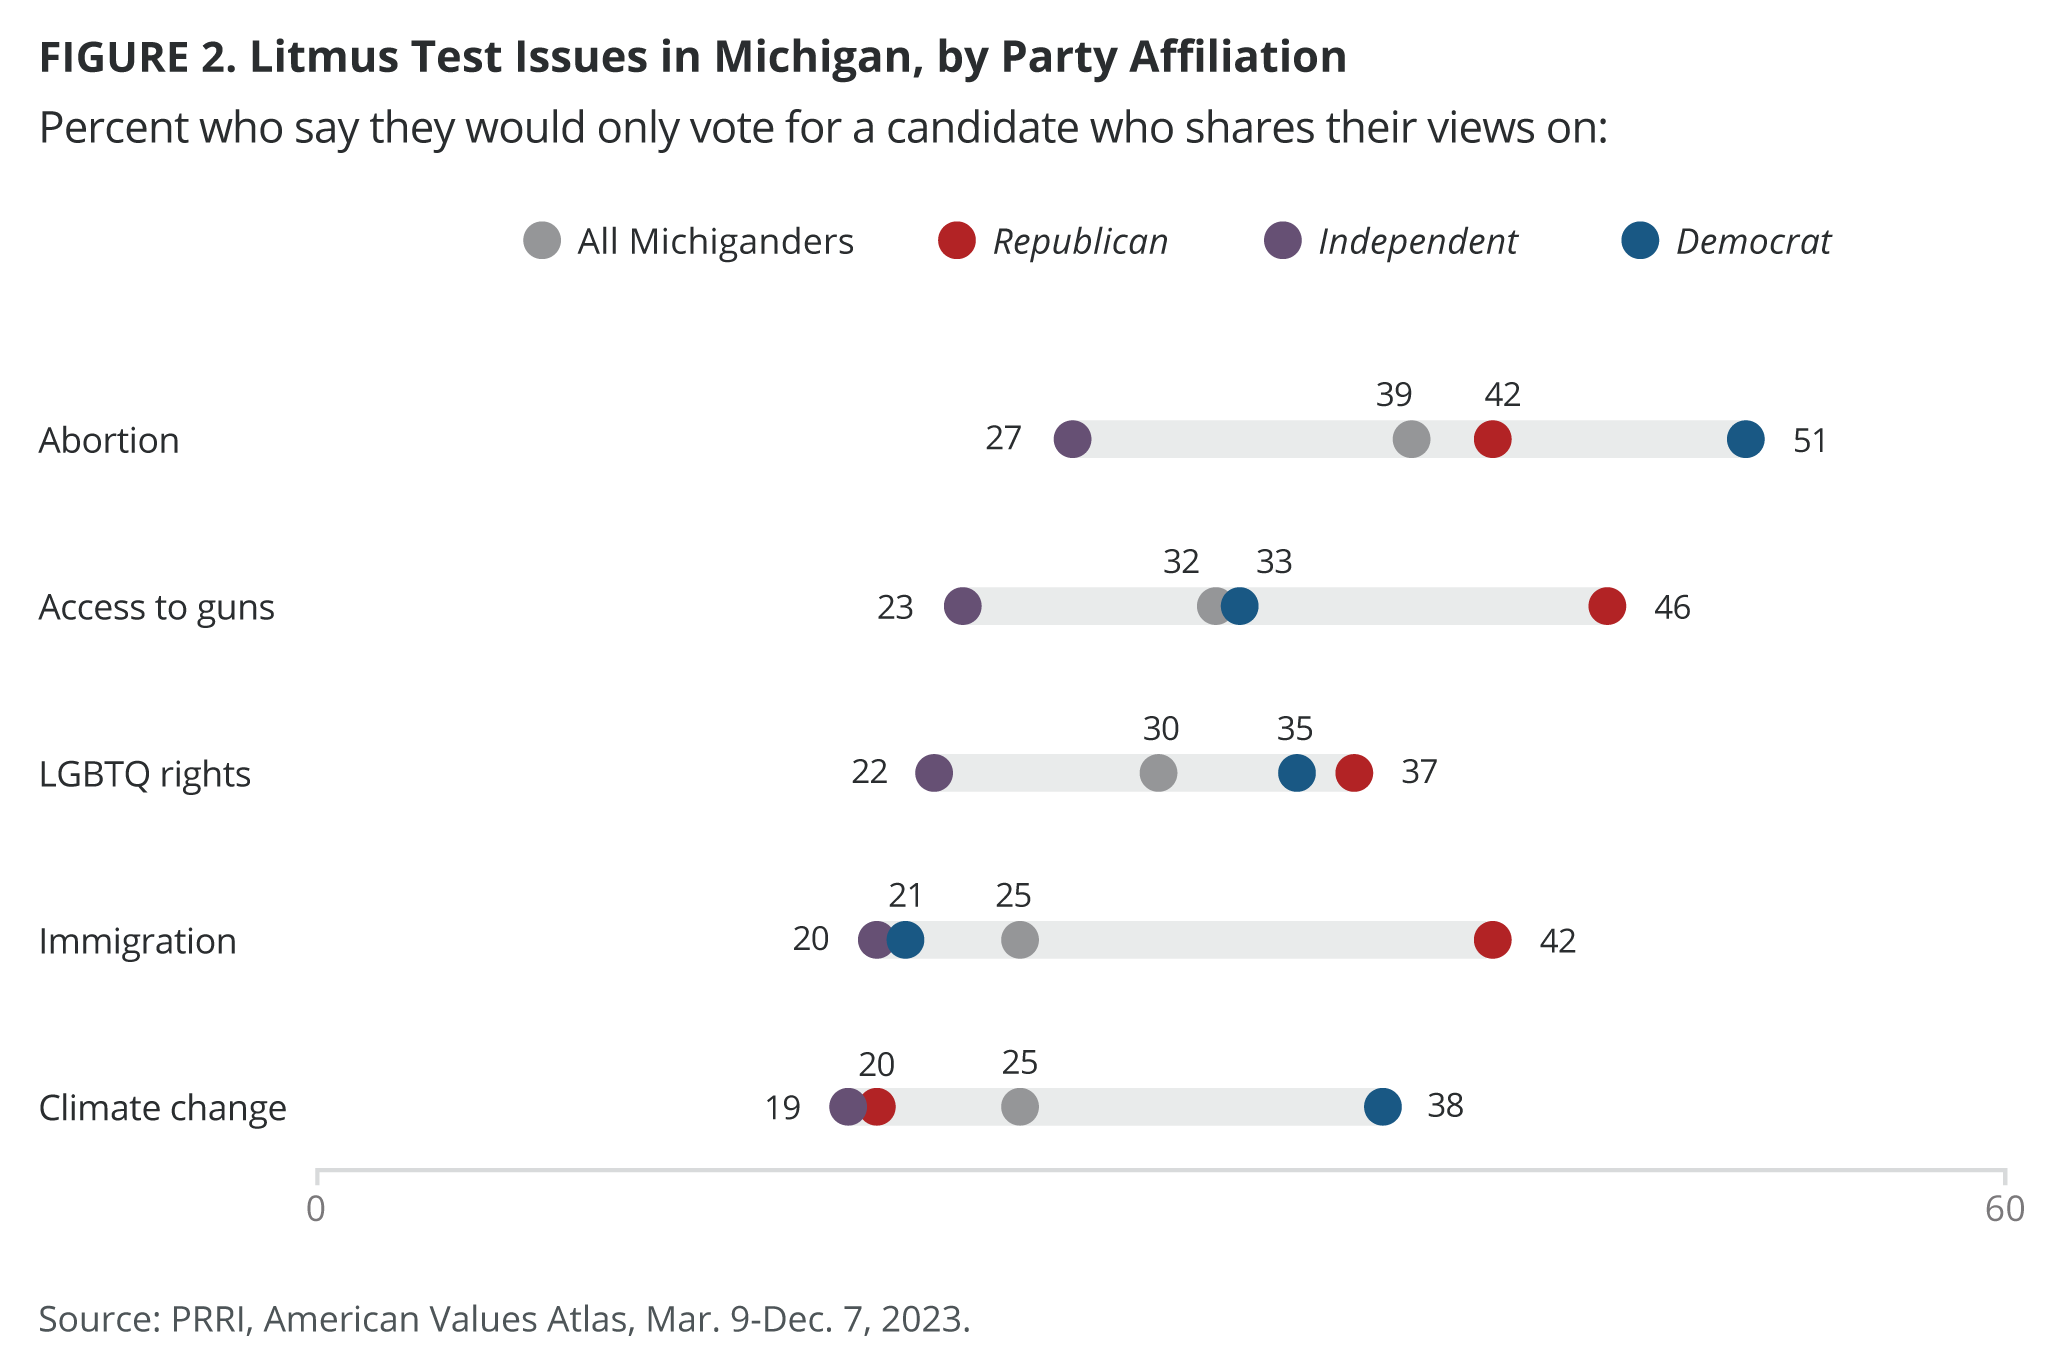
Nearly four in ten Michiganders (39%) say they would only vote for a candidate who shares their views on abortion. Michigan Democrats (51%) and Republicans (42%) are more likely than independents (27%) to say they would only vote for a candidate who shares their stance on abortion.
One-third of Michiganders (32%) will only vote for a candidate who shares their views on access to guns. Nearly half of the state’s Republicans (46%), one-third of Democrats (33%), and nearly one in four independents (23%) say access to guns is a litmus test issue.
Three in ten Michigan residents (30%) would only vote for a candidate who shares their views on LGBTQ rights. Both Republicans (37%) and Democrats (35%) in the state are more likely than independents (22%) to base their vote on a candidate’s stance on LGBTQ rights.
One in four Michiganders (25%) consider immigration a litmus test issue when voting for a candidate. More than four in ten Michigan Republicans (42%) would only vote for a candidate who shares their views on immigration, compared with around two in ten Democrats (21%) and independents (20%).
Finally, one in four Michigan residents (25%) would only vote for a candidate who shares their views on climate change. Democrats in Michigan (38%) are more likely than Republicans (20%) and independents (19%) to only vote for a candidate based on their stance on climate change.
Attitudes Toward LGBTQ Rights in Michigan
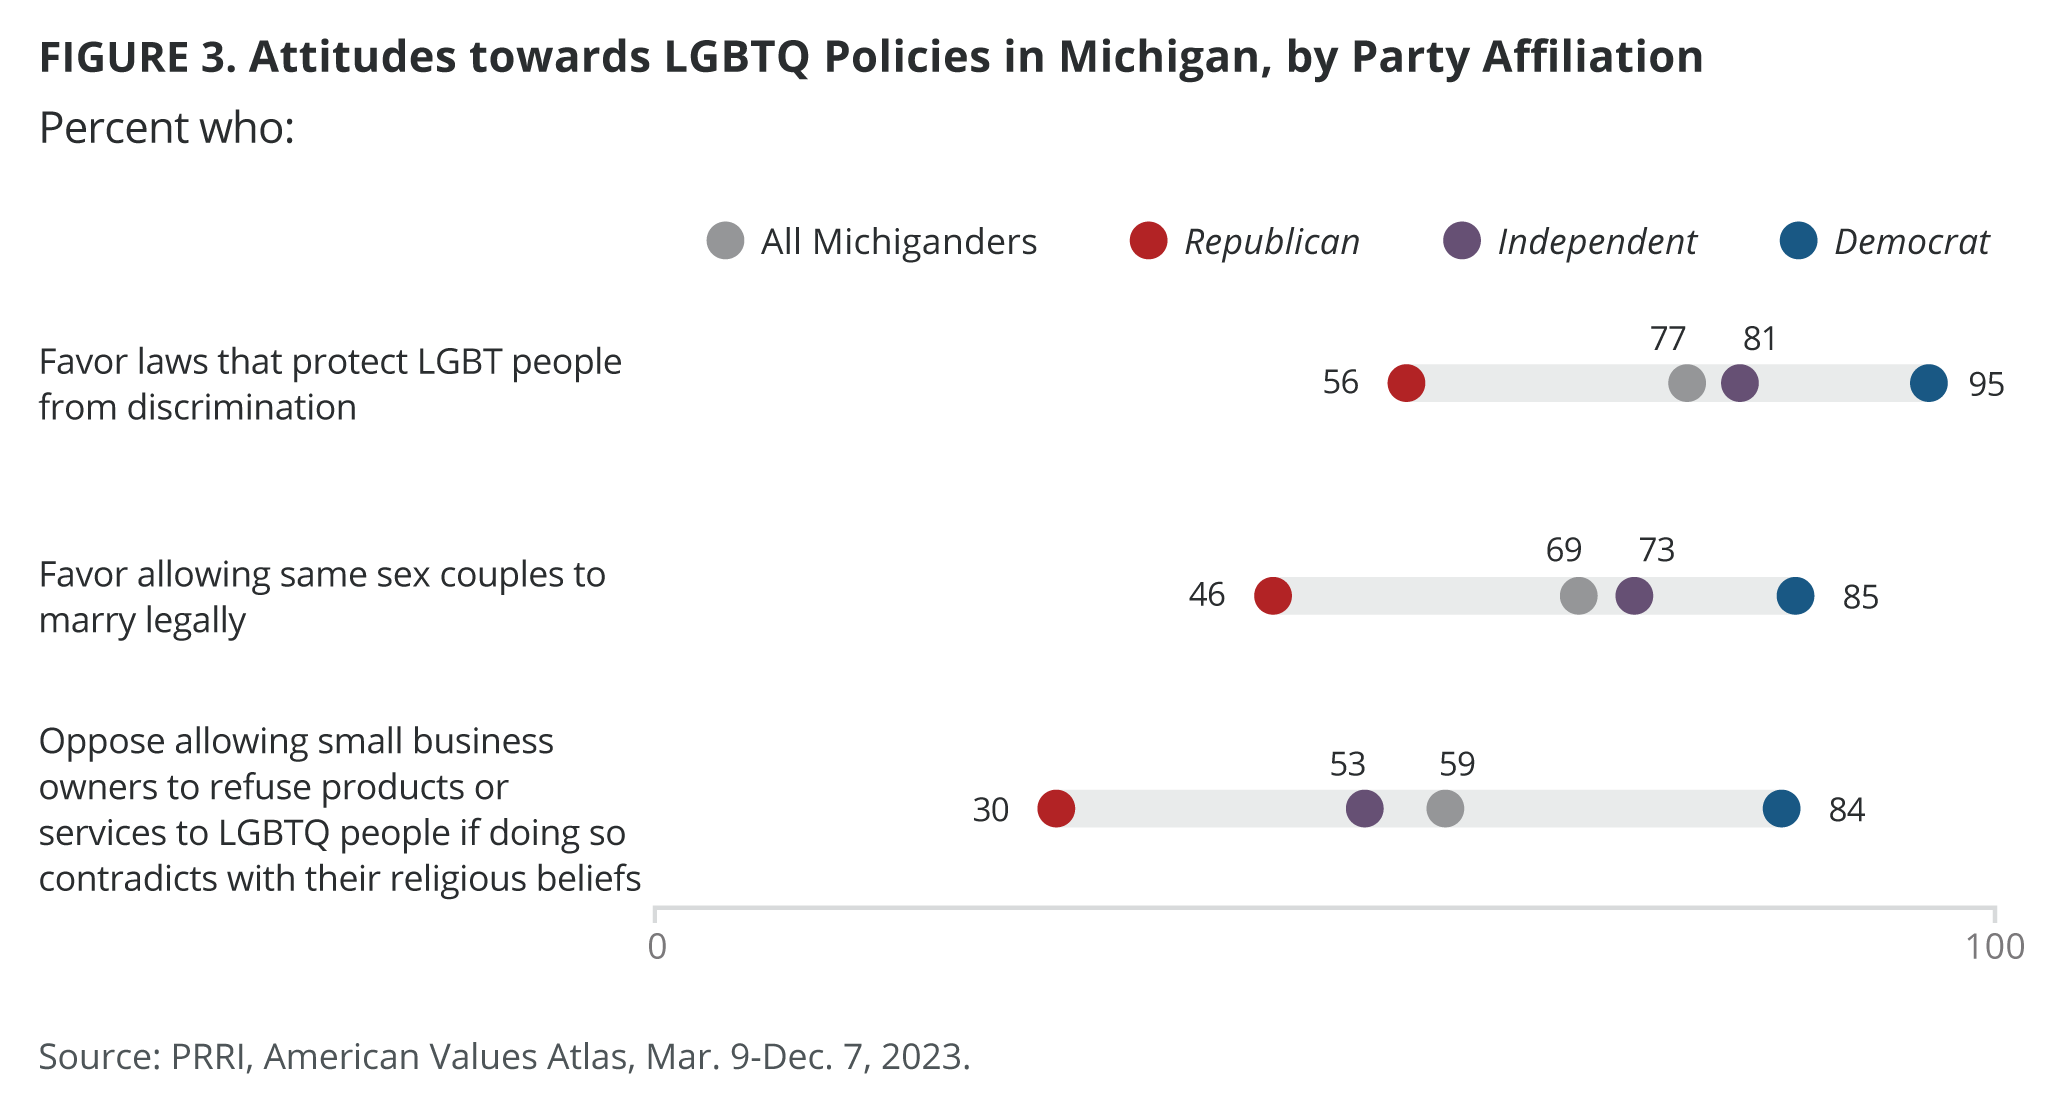
Around three in four Michiganders (77%) favor laws that protect LGBTQ people against discrimination in jobs, public accommodations, and housing, while two in ten (19%) oppose these laws. The vast majority of both Democrats (95%) and independents (81%) in Michigan favor nondiscrimination laws, compared with 56% of Republicans.
The majority of Michigan residents (59%) oppose allowing a small business owner to refuse products or services to LGBTQ people, if doing so violates their religious beliefs, while 38% favor this. Michigan Republicans (30%) are less likely than Democrats (84%) and independents (53%) to oppose religiously based refusals.
Nearly seven in ten Michiganders (69%) favor allowing same-sex couples to marry legally, while 27% oppose. The vast majority of Democrats (85%) and around three in four independents (73%) favor same-sex marriage, compared with less than half of Michigan Republicans (46%).
Attitudes Toward Abortion in Michigan
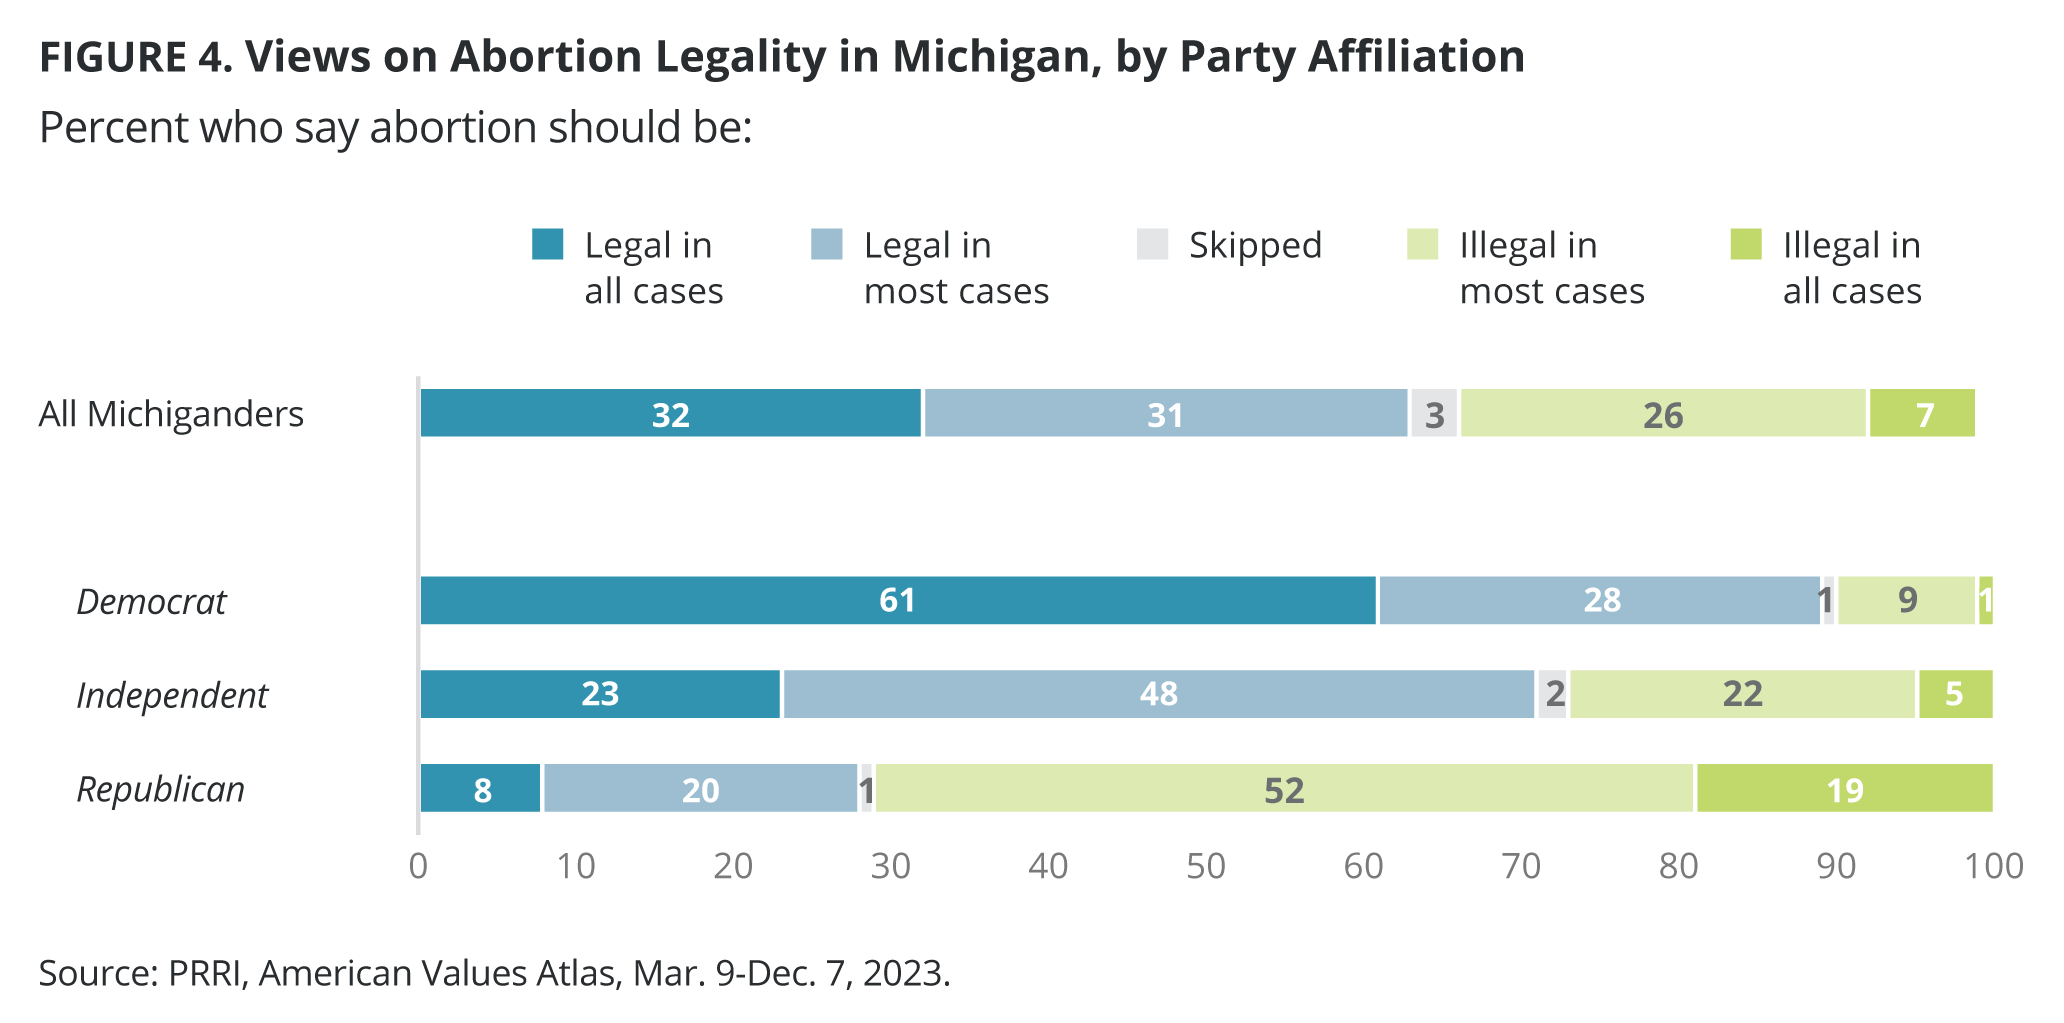
Among the 2024 battleground states, Michigan has the least restrictive abortion laws, reflecting the overall opinions of the state’s residents. The majority of Michiganders (63%) say abortion should be legal in all or most cases, including around one-third of each who say abortion should be legal in all cases (32%) and legal in most cases (31%). One-third of Michigan residents (33%) say abortion should be illegal, including 26% who say it should be illegal in most cases and 7% who say it should be illegal in all cases.
Nearly nine in ten Michigan Democrats (89%) and around seven in ten independents (71%) say abortion should be legal in all or most cases, compared with only 28% of Republicans in the state.
Explore the 2024 battleground states in additional PRRI Spotlight Analyses:
Learn more about each battleground state’s demographics and litmus test issues: