Religiously Based Refusals to Serve LGBT People
Gays and Lesbians
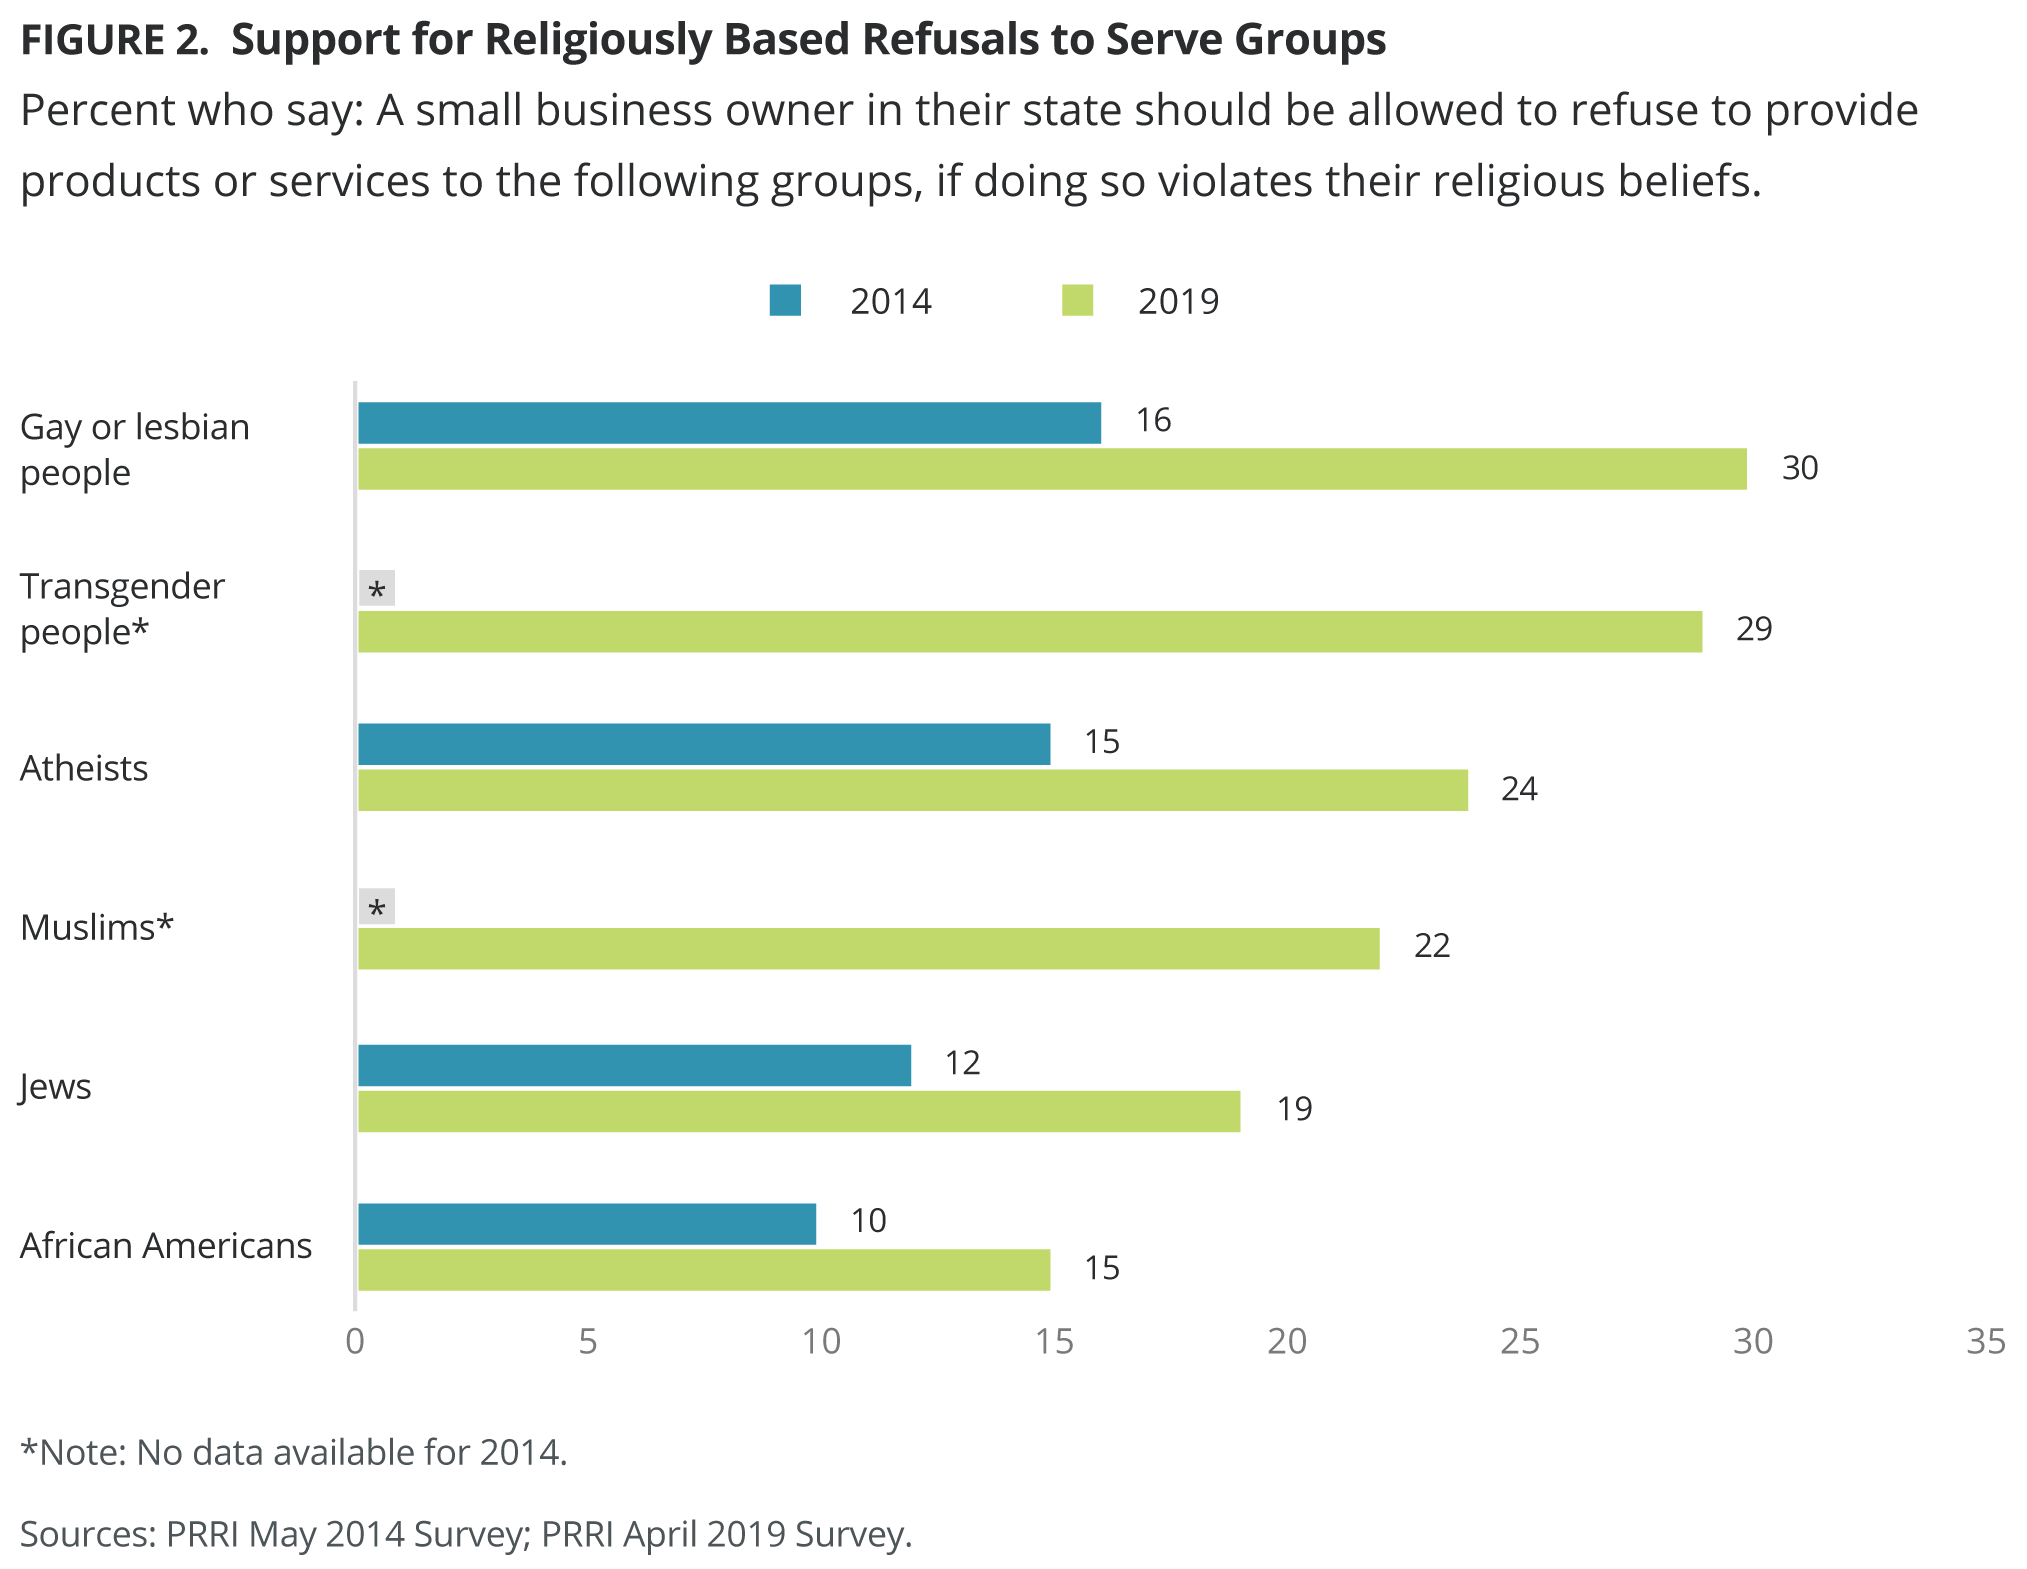
Three in ten (30%) Americans say they think it should be permissible for a small business owner in their state to refuse to provide services to gay or lesbian people if doing so violates their religious beliefs, while two-thirds (67%) say they should not be allowed to do so.
Support for religiously based service refusals have increased across virtually every demographic group since 2014, when only 16% of Americans said small businesses should be allowed to refuse service to gay or lesbian customers because of religious beliefs, and 80% said they should not.[1]
Opinions on this issue, however, differ by gender, age, and race. More than one-third (34%) of men, compared to 26% of women, say businesses should be allowed to refuse services to gay or lesbian people. This is an increase from 2014, when only 19% of men and 14% of women agreed that businesses should be permitted to refuse to serve gays and lesbians on the basis of their religious beliefs.
Seniors ages 65 and older (39%) are more likely than young Americans ages 18-29 (26%) to favor religiously based service refusals targeting gays and lesbians. Every age group has increased support since 2014, when only 17% of seniors and only 12% of young Americans supported allowing businesses to refuse to serve gay or lesbian people on religious grounds. One-third (33%) of white Americans, compared to nearly one-fourth (24%) of nonwhite Americans, agreed. White Americans have nearly doubled their support since 2014 (16%).
While there are no differences on this issue by educational attainment, similar increases in support for refusing service to gays and lesbians on religious grounds occurred across the board during the last two years, from those with a high school diploma or less (17% to 28%), some college (15% to 29%), and college graduates (17% to 32%).
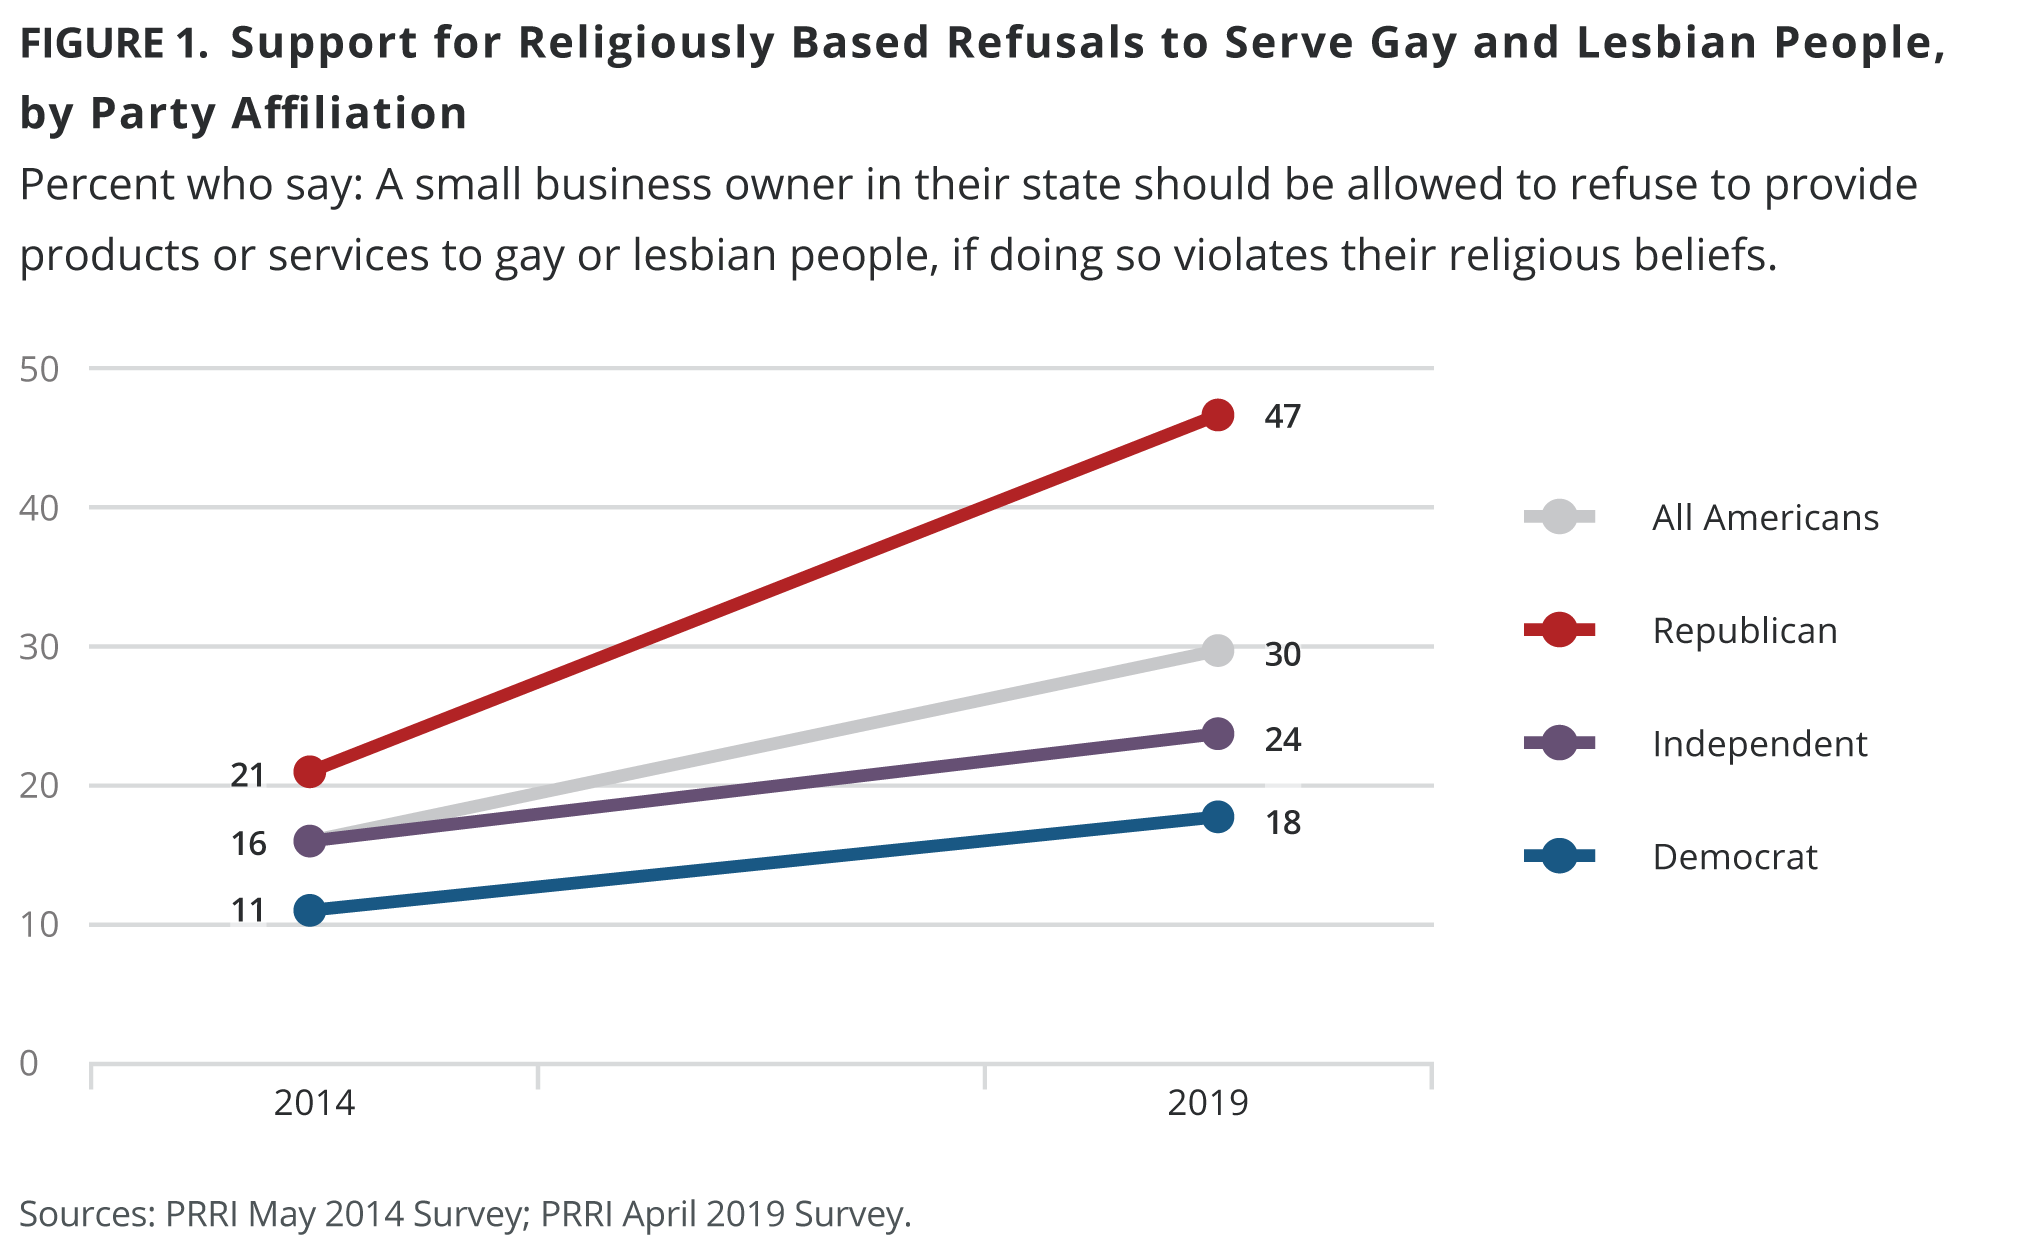
Republicans are divided on whether small businesses should be allowed to refuse gay or lesbian people (47% favor, 48% oppose). This number has more than doubled from 2014, when only 21% of Republicans said these types of religiously based service refusals should be allowed.
By contrast, only 18% of Democrats and 24% of independents currently support these kinds of religiously based service refusals. These numbers are also up from 2014, when only 11% of Democrats and 16% of independents agreed that service refusals based on religion should be allowed.
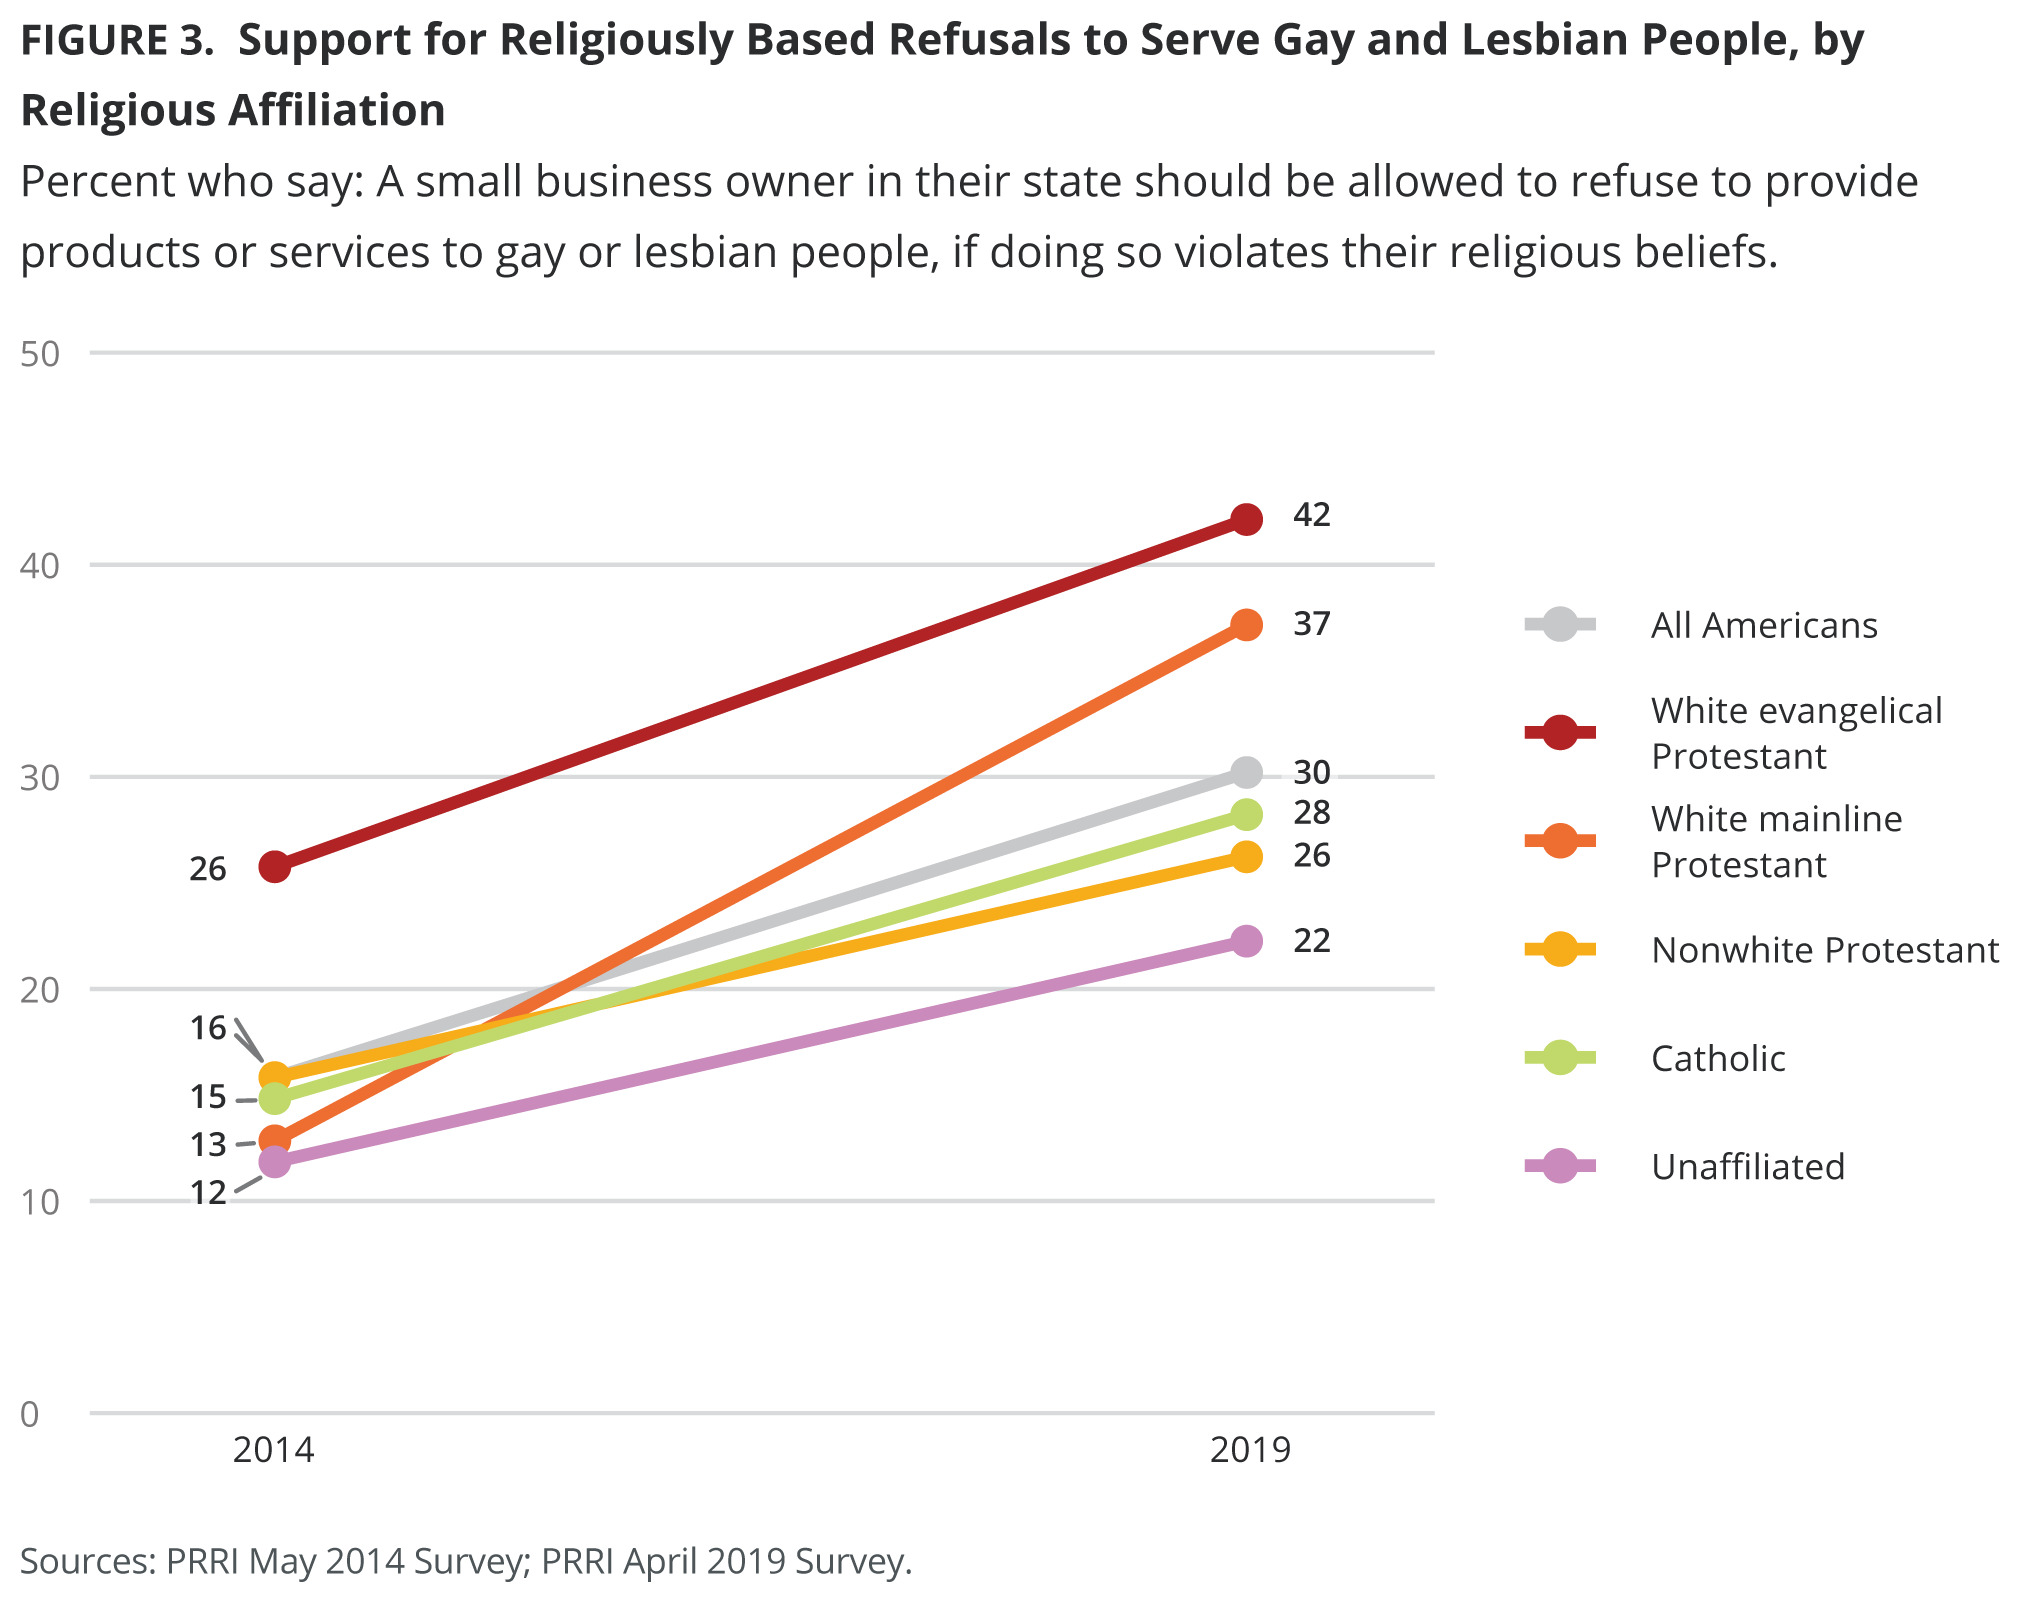
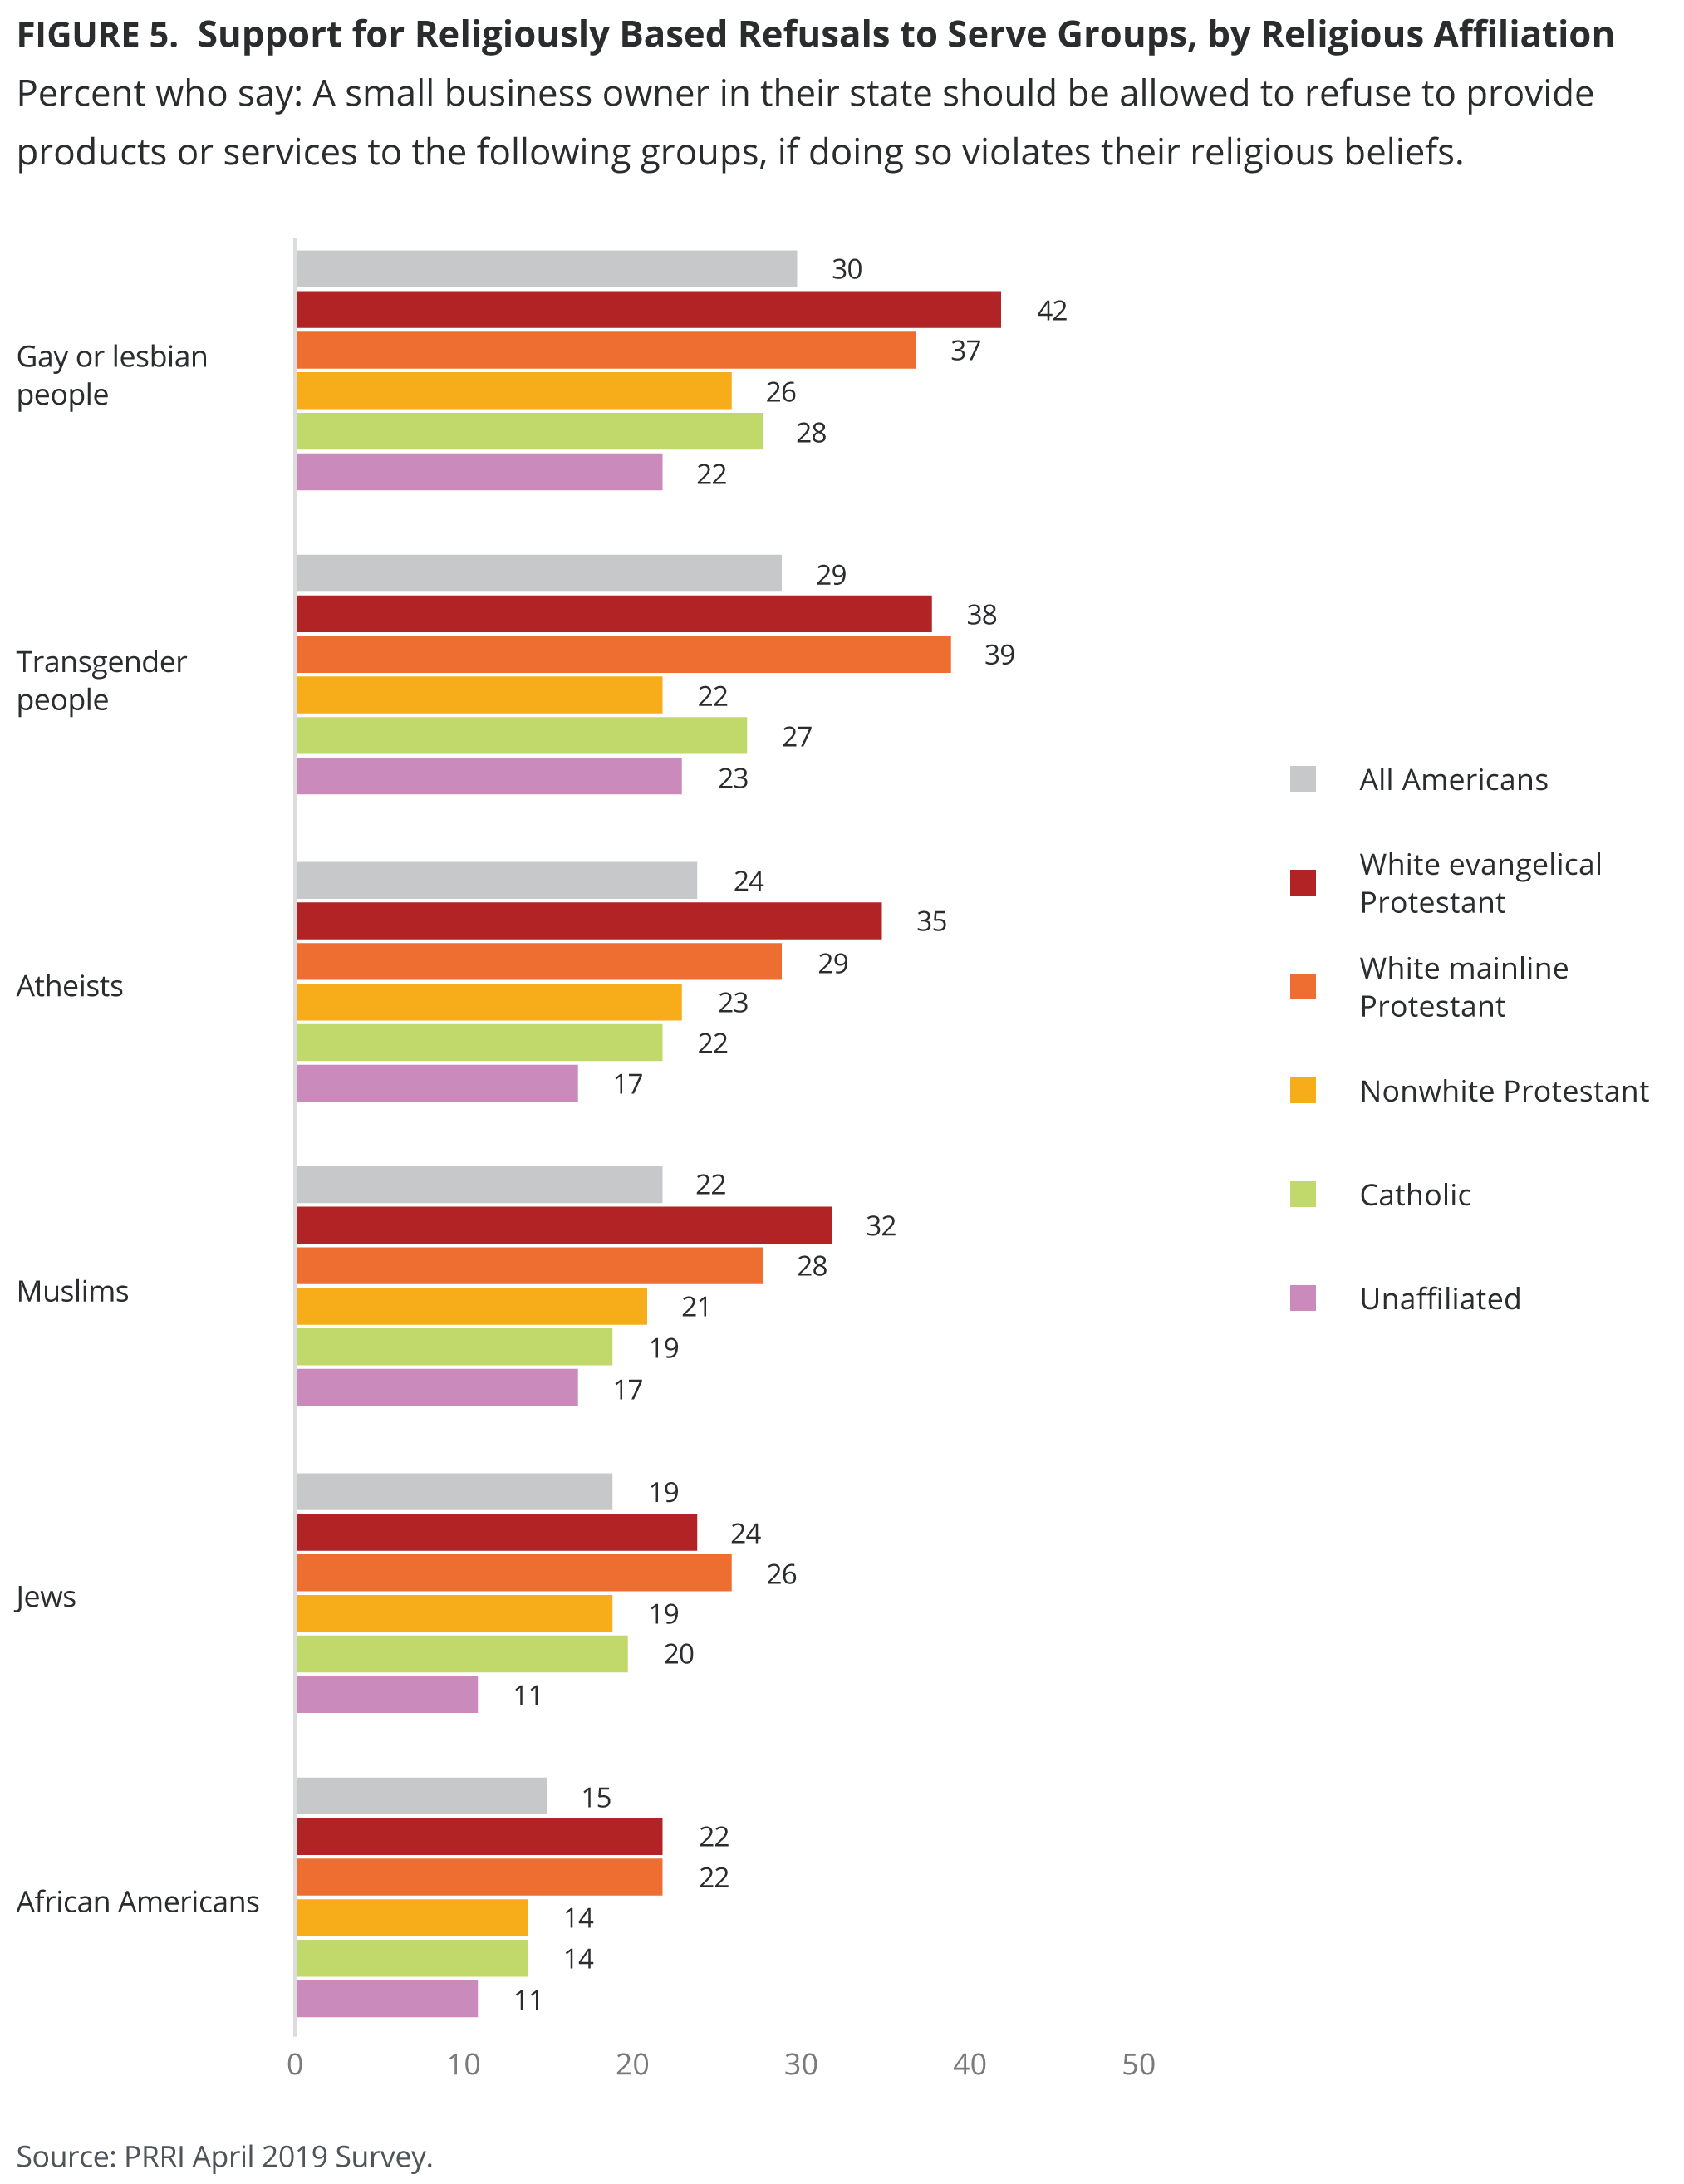
When it comes to religious affiliation, white Protestants are substantially more likely to support religiously based service refusals. Around four in ten white evangelical Protestants (42%) and slightly fewer white mainline Protestants (37%) say that small businesses should be allowed to refuse products or services to gay or lesbian people if doing so would violate their religious beliefs. Support is lower among Catholics (28%), nonwhite Protestants (26%), and the religiously unaffiliated (22%).
Support for these service refusals is up across every religious group compared to 2014, when substantially fewer white evangelical Protestants (26%), white mainline Protestants (13%), Catholics (15%), nonwhite Protestants (16%), and the religiously unaffiliated (12%) agreed that religious faith could exempt businesses from serving gays and lesbians.
Transgender People
Notably, there are few differences between beliefs about small business owners refusing service to transgender people and refusing service to gays and lesbians. Three in ten (29%) Americans say they think small business owners in their state should be allowed to refuse to provide products or services to transgender people, if doing so violates their religious beliefs, compared to 68% who say they should not be allowed to do this.
Compared to religiously based refusals to serve gays and lesbians, support for allowing small businesses to opt out of serving transgender people is roughly the same across every demographic group: men (34%), women (24%), Republicans (44%), independents (25%), Democrats (19%), white evangelical Protestants (38%), white mainline Protestants (39%), Catholics (27%), nonwhite Protestants (22%), and religiously unaffiliated Americans (23%).
One exception is among different age groups. While younger Americans show similar levels of support for refusing to serve gays and lesbians and refusing to serve transgender people, seniors (ages 65 and older) are more likely to support allowing businesses to reject gays or lesbians on religious grounds (39%) than allowing businesses to reject transgender people (30%).
Religiously Based Refusals to Serve Other Groups
By contrast, there is generally less support for allowing small business owners to refuse to serve African Americans, Jews, Muslims, and atheists, if serving these groups would violate the owner’s religious beliefs. However, the number of Americans who support religiously based refusals to serve each of these groups has increased in the last five years.
Atheists
Nearly one-quarter (24%) of Americans say small businesses should be allowed to refuse to serve atheists if doing so is against their religious beliefs, compared to 72% who disagree – support that has climbed nearly 10 percentage points since 2014 (15%).
Men are more likely than women to say small business owners should be allowed to refuse service to atheists on religious grounds (29% vs. 21%), but there are no substantial differences by age.
Republicans (37%) are more likely than independents (21%) and Democrats (17%) to say small businesses should be allowed to refuse service to atheists. Though support levels are mostly stable for independents and Democrats, Republicans have nearly doubled their support level compared to 2014 (19%).
Support for these religiously based service refusals targeting atheists has also increased among most major religious groups since 2014, including white evangelical Protestants (up to 35% from 21%, white mainline Protestants (up to 29% from 9%), nonwhite Protestants (up to 23% from 14%), and Catholics (up to 22% from 13%). The religiously unaffiliated have largely remained consistent in their attitudes on this issue (17% vs. 14%).
Muslims
Support for religiously based service refusals aimed at Muslims is similar to opinions about service refusals aimed at atheists. Just over one in five (22%) Americans say small businesses should be able to refuse to serve Muslims on religious grounds.[2] Men are more likely than women to agree (25% vs. 20%).
There are no substantial differences by age in support for such policies. Republicans (32%) are more likely than independents (20%) and Democrats (14%) to say small businesses should be allowed to refuse service to Muslims.
Attitudes differ by race and religious affiliation as well. Around three in ten white evangelical Protestants (32%) and white mainline Protestants (28%) say small businesses should be allowed to refuse to serve Muslims for religious reasons, compared to around one in five nonwhite Protestants (21%), Catholics (19%), and the religiously unaffiliated (17%) who say the same.
Jews
The proportion of Americans who say small businesses should be able to refuse to serve Jews on religious grounds is up seven percentage points (19% in 2019 vs. 12% in 2014). Republicans (24%) are more likely than independents (16%) and Democrats (17%) to say small businesses should be allowed to refuse service to Jews. Support is up from 2014, when only 16% of Republicans and 9% of Democrats supported this sort of service refusal.
Men are also more likely than women to say small business owners should be allowed to refuse service to Jews (22% vs. 16%). Support for all of these refusals is up for both men and women, with only around one in ten each for men and women endorsing these types of religiously based service refusals in 2014. Though there are no substantial differences by age in support for religiously based service refusals that target Jews, support has increased across all age groups since 2014.
Support for these religiously based service refusals has also increased among most major religious groups since 2014. Support for denying service to Jews has roughly doubled among white evangelical Protestants (up to 24% from 12% in 2014), white mainline Protestants (up to 26% from 11%), and Catholics (up to 20% from 10%), while the religiously unaffiliated (11% vs. 11%) and nonwhite Protestants (19% vs. 14%) have remained mostly stable in their attitudes on these issues.
African Americans
Fifteen percent of Americans say small businesses should be allowed to refuse to serve African Americans if doing so violates their religious beliefs, a five-percentage-point increase from 2014 (10%).
Men are more likely than women to agree (18% vs. 13%), with support up to six percentage points for men (12% in 2014). Attitudes among women have largely remained stable. There are few differences by party affiliation or age in support for allowing small businesses to deny service to African Americans based on their religious beliefs.
Support for religiously based service refusals targeting African Americans has more than doubled among white evangelical Protestants (up to 22% now from 8% in 2014) and white mainline Protestants (up to 22% from 5%), while the religiously unaffiliated (11% vs. 10%), Catholics (14% vs. 12%), and nonwhite Protestants (14% vs. 10%) have remained mostly stable in their attitudes on these issues.
Support for Religiously Based Service Refusals by Party
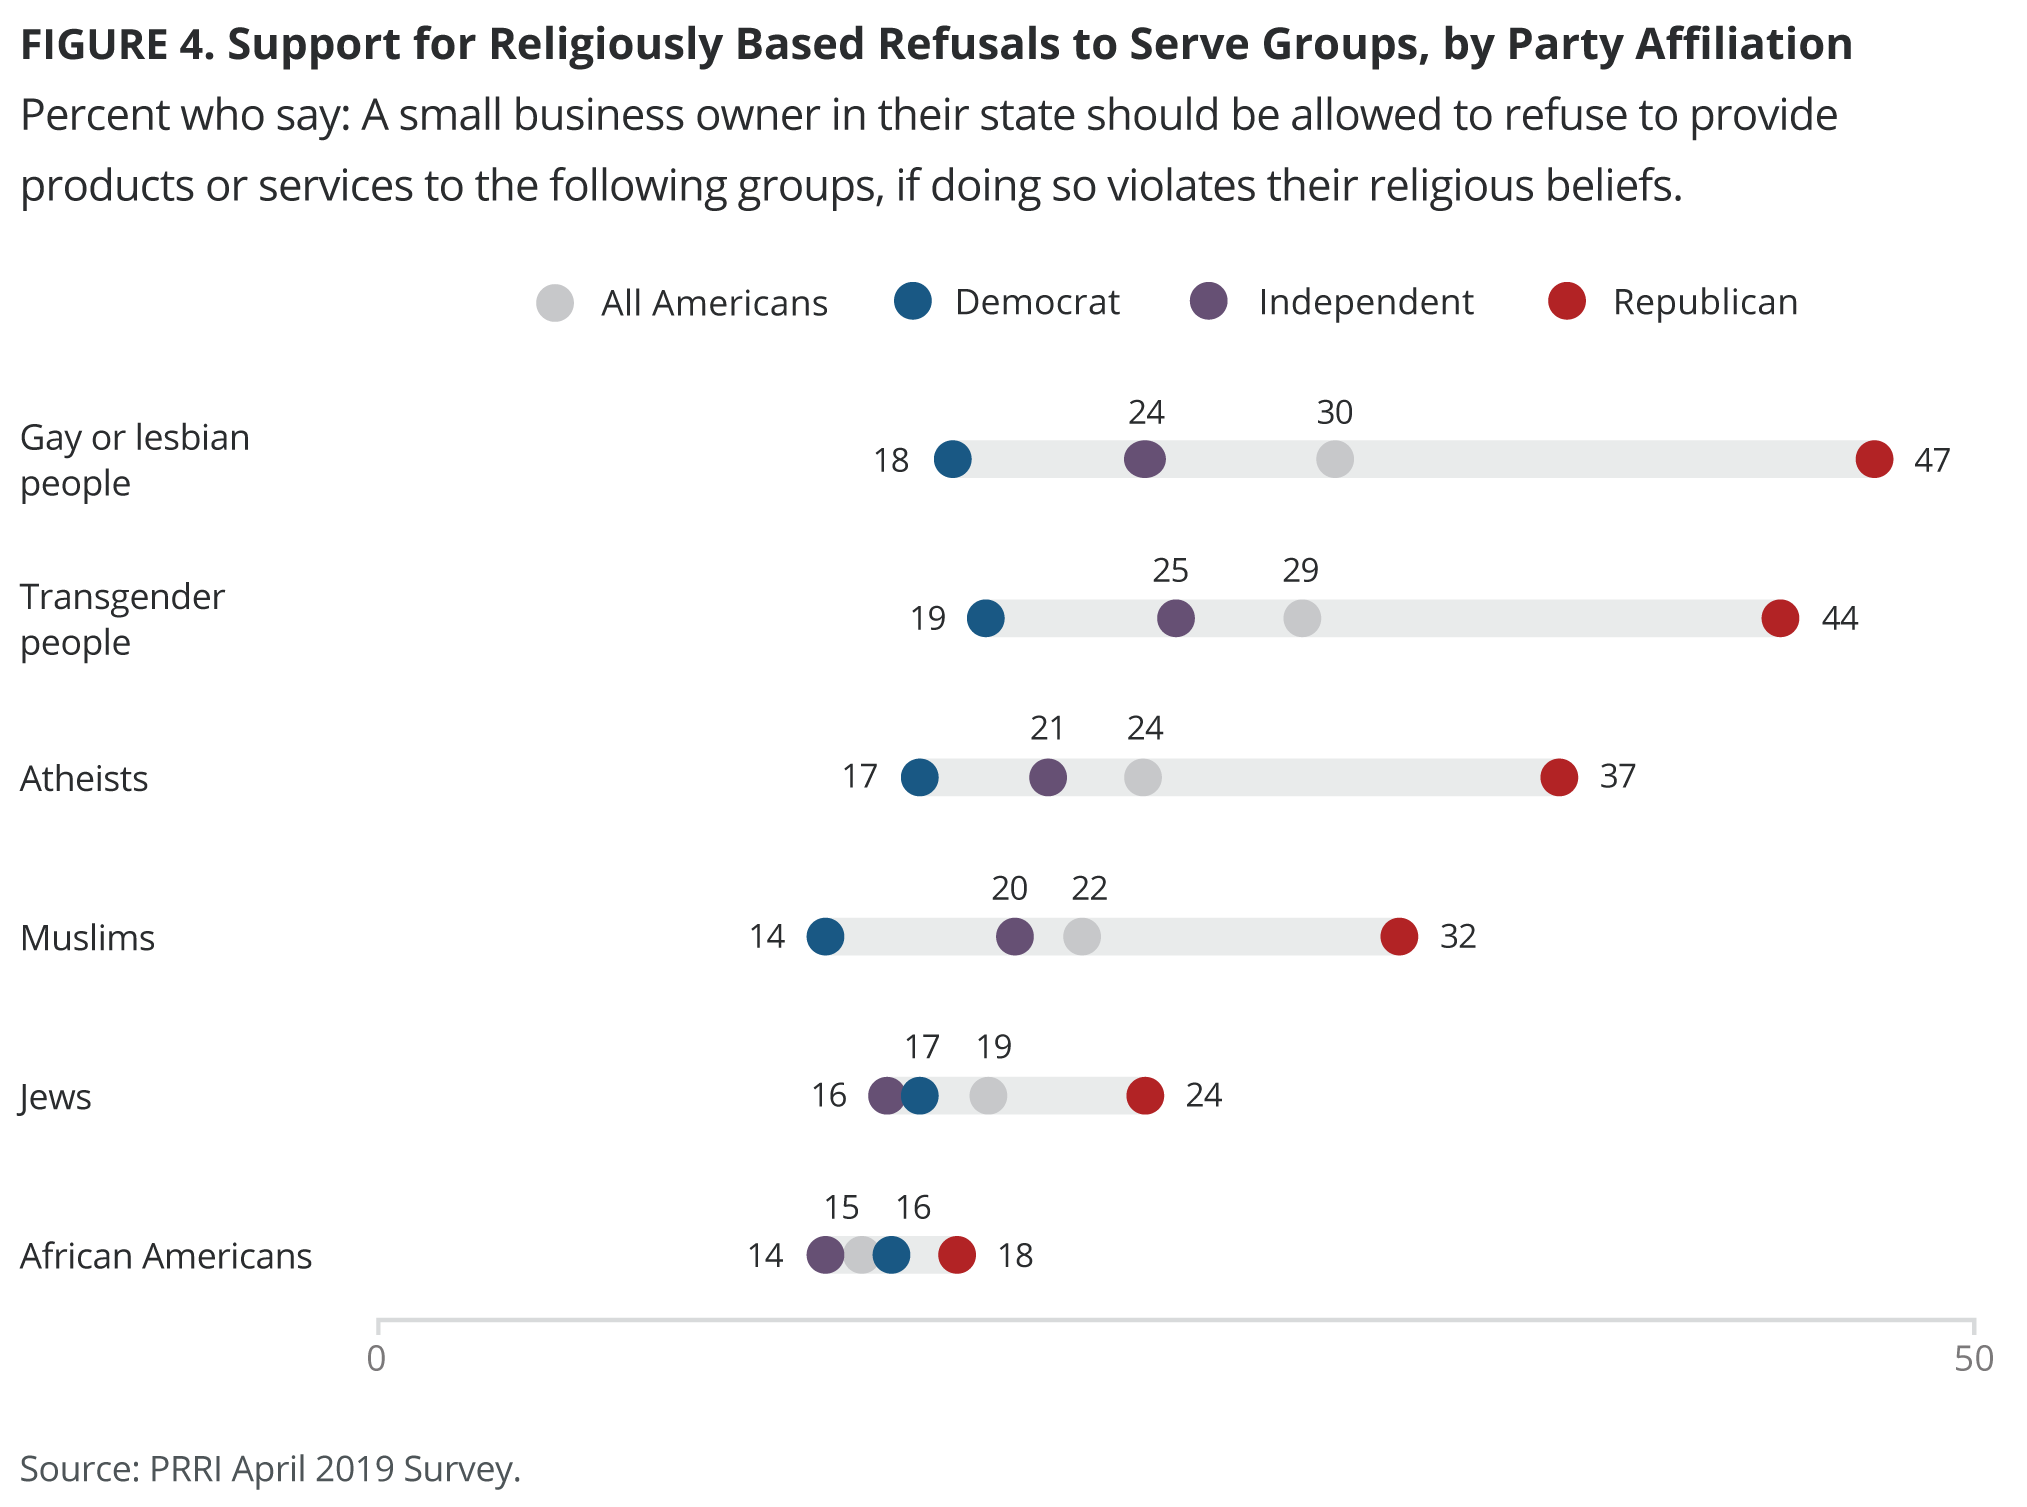
Looking across these six groups, a distinct pattern emerges across lines of political party affiliation. Republicans are more than twice as likely as Democrats to support religiously based refusals to serve gay or lesbian people (47% vs. 18%), transgender people (44% vs. 19%), atheists (37% vs. 17%), and Muslims (32% vs. 14%). While the partisan disparity is not as large, Republicans are also seven percentage points more likely than Democrats to favor religiously based refusals to serve Jews. The only group where this is no significant partisan difference is support for allowing businesses to refuse to serve African Americans.
Support for Religiously Based Service Refusals by Religious Affiliation
There is also a distinct pattern across religious traditions.
White Protestants are the most likely to support religiously based service refusals in every case, with white evangelical Protestants and white mainline Protestants showing similar numbers in most cases. Both white evangelical Protestants (24%) and white mainline Protestants (26%) are more than twice as likely to support religiously based refusals to serve Jews than the religiously unaffiliated (11%).
The same is true of support for religiously based refusals to serve African Americans when comparing the white Protestant groups (22% each) to the religiously unaffiliated (11%). Catholics and nonwhite Protestants tend to be more aligned with the religiously unaffiliated than the white Protestant groups, with the exception of religiously based refusals to serve Jewish people, where Catholic support (20%) and nonwhite Protestant support (19%) are close to the white evangelical Protestant (24%) and white mainline Protestant (26%) numbers.
Survey Methodology
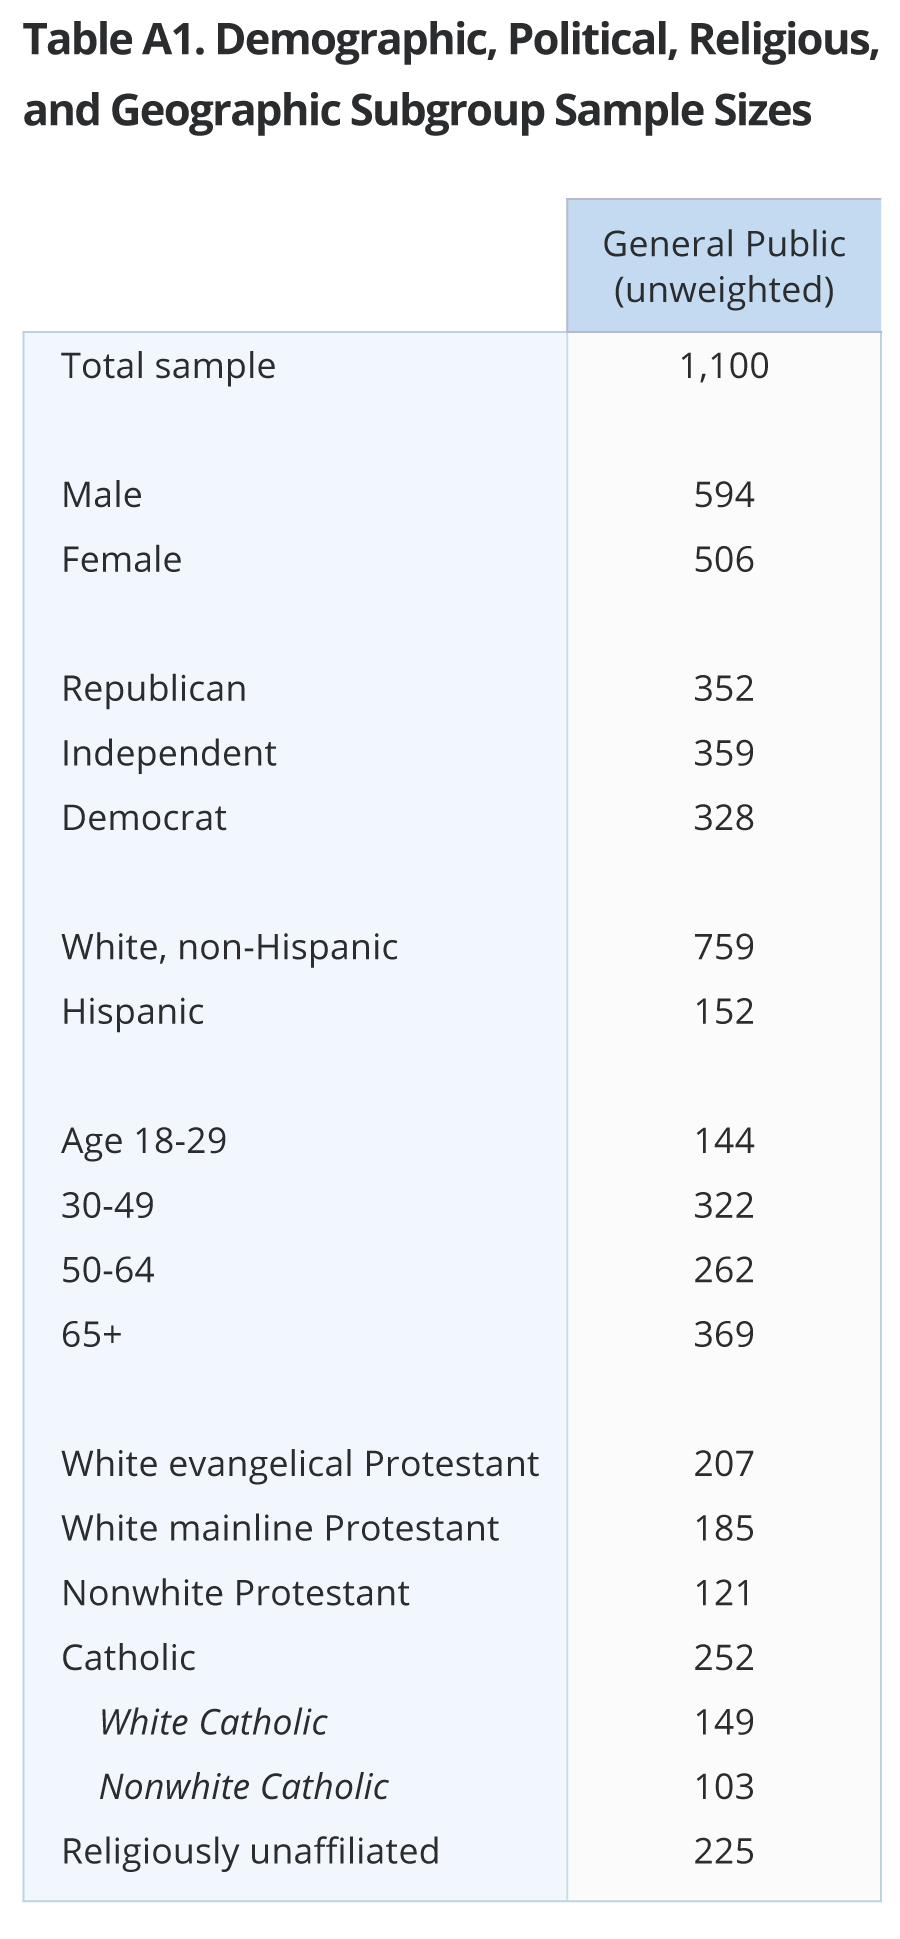 The survey was designed and conducted by PRRI. The survey was made possible by generous grants from the Arcus Foundation and the E. Rhodes and Leona B. Carpenter Foundation. Results of the survey were based on bilingual (Spanish and English) RDD telephone interviews conducted between April 9 and April 20, 2019, by professional interviewers under the direction of SSRS. Interviews were conducted among a random sample of 1,100 adults 18 years of age or older living in the United States (668 respondents were interviewed on a cell phone). The survey also over-sampled those living in Texas (150). The selection of respondents within households was accomplished by randomly requesting to speak with the youngest adult male or female currently living in the household.
Data collection is based on stratified, single-stage, random-digit-dialing (RDD) sample of landline telephone households and randomly generated cell phone numbers. The sample is designed to represent the total U.S. adult population and includes respondents from all 50 states, including Hawaii and Alaska. The landline and cell phone samples are provided by Marketing Systems Group.
This SSRS Omnibus insert was weighted to provide nationally representative and projectable estimates of the adult population 18 years of age and older as well as the adult population in Texas. The weighting process took into account the disproportionate probabilities of household and respondent selection due to the number of separate telephone landlines and cellphones answered by respondents and their households, as well as the probability associated with the random selection of an individual household member. Following the application of the above weights, the sample was post-stratified and balanced by key demographics such as age, race, sex, region, and education. The sample was also weighted to reflect the distribution of phone usage in the general population, meaning the proportion of those who are cell phone only, landline only, and mixed users.
With the base-weight applied, the sample underwent the process of iterative proportional fitting (IPF), in which the sample was balanced to match known adult-population parameters based on the most recent March Supplement of the U.S. Census Bureau’s Current Population Survey (CPS)[3]. This process of weighting was repeated until the root mean square error for the differences between the sample and the population parameters was 0 or near-zero. Two raking groups were used to account for the National and the oversample of Texas.
The National population parameters used for post-stratification are: Age (18-29; 30-49; 50-64; 65+) by Gender, Census region (Northeast, North-Central, South, West) by Gender, Education (less than high school, high school graduate, some college, four-year college or more), Race/ethnicity (white non-Hispanic; Black non-Hispanic; Hispanic and born in the U.S.; Hispanic and born outside of the U.S.[4]; Other non-Hispanic), Marital status (married/not married), Population density (divided into quintiles) and Phone-usage (cell phone only, landline only, both).
The Texas parameters used for post-stratification are: Age (TX 18-29; TX 30-49; TX 50-64; TX 65+), Gender (TX Male; TX Female), Education (TX less than high school, TX high school graduate, TX some college, TX four-year college or more), Race/Ethnicity (TX white non-Hispanic; TX Black non-Hispanic; TX Hispanic and born in the U.S.; TX Hispanic and born outside of the U.S.; TX Other non-Hispanic), and Phone-usage (TX cell phone only; TX landline only; TX both).
The sample weighting is accomplished using an iterative proportional fitting (IFP) process that simultaneously balances the distributions of all variables. Weights were trimmed to prevent individual interviews from having too much influence on the final results. The use of these weights in statistical analysis ensures that the demographic characteristics of the sample closely approximate the demographic characteristics of the target populations.
The margin of error for the survey is +/- 3.5 percentage points at the 95% level of confidence. The design effect for the survey is 1.39. In addition to sampling error, surveys may also be subject to error or bias due to question-wording, context and order effects.
Endnotes
[1] Source: PRRI May 2014 Survey. All references to 2014 in this report refer to these data.
[2] No trend data are available here as this group was not included in the 2014 survey.
[3] Sarah Flood, Miriam King, Renae Rodgers, Steven Ruggles, and J. Robert Warren. Integrated Public Use Microdata Series, Current Population Survey: Version 6.0 [dataset]. Minneapolis, MN: IPUMS, 2018. https://doi.org/10.18128/D030.V6.0
[4] Since this is meant to address the percent of Spanish speakers in the weighted sample, respondents born in Puerto Rico are included with those born outside of the U.S.
Recommended citation:
Robert P. Jones, Natalie Jackson, Maxine Najle, Oyindamola Bola, and Daniel Greenberg. “Increasing Support for Religiously Based Service Refusals.” PRRI (June 10, 2019). https://www.prri.org/research/increasing-support-for-religiously-based-service-refusals/.