Executive Summary
 Two-thirds of voters say that it is very important (39%) or somewhat important (28%) for a presidential candidate to have strong religious beliefs. However, roughly 1-in-5 (19%) voters say they would be less likely to vote for a candidate who had strong religious beliefs if those beliefs were very different from their own.
A majority of voters (53%) report that they would be somewhat or very comfortable with a Mormon serving as President, although more than 4-in-10 (42%) say that a Mormon president would make them somewhat or very uncomfortable.
- Significantly more Democratic voters (50%) report feeling at least somewhat uncomfortable with a Mormon serving as president than Republican voters (36%) or Independent voters (38%).
- Millennial voters (age 18-29) are less comfortable than senior voters (age 65 and over) with a Mormon serving as president. A majority (54%) of Millennial voters say they would be at least somewhat uncomfortable with a Mormon serving as president, compared to less than 4-in-10 (39%) of senior voters.
- A List Experiment included in the survey confirms that, with the exception of white mainline Protestants, voters reliably report their feelings of discomfort with a Mormon candidate.
A significant number of Americans see the Mormon faith as different from their own. Thirty-six percent of registered voters do not believe the Mormon faith is a Christian religion, compared to half of registered voters who say that the Mormon faith is a Christian religion; 14% say they are not sure. Nearly half (49%) of white evangelical Protestant voters do not believe that the Mormon faith is a Christian religion. Approximately two-thirds (66%) of voters say that the religious beliefs of Mormons are somewhat or very different from their own.
Because few Americans currently know Romney is Mormon attitudes about Romney’s faith may not have fully impacted his candidacy. Only about 4-in-10 (42%) Americans can correctly identify Mitt Romney’s religion as Mormon. Among voters who believe that Mormons have religious beliefs that are somewhat or very similar to their own and are familiar with Romney, nearly two-thirds (66%) have a favorable view of him. In contrast, among voters who believe that Mormons have religious beliefs that are somewhat or very different from their own, less than half (47%) report having a favorable opinion of Romney.
Currently, among Republican voters who know enough about the candidate to register an opinion, Cain leads Romney in favorability (73% and 66% respectively), with Perry trailing at 53%.
- Between late September and late October, Romney’s favorability dropped 10 points among Republican voters, while Perry’s favorability dropped 18 points.
- Among white evangelical Protestant voters, Romney’s favorability dropped 14 points, while Perry’s favorability remained steady. Cain currently has the highest favorability rating (70%) among white evangelical Protestant voters.
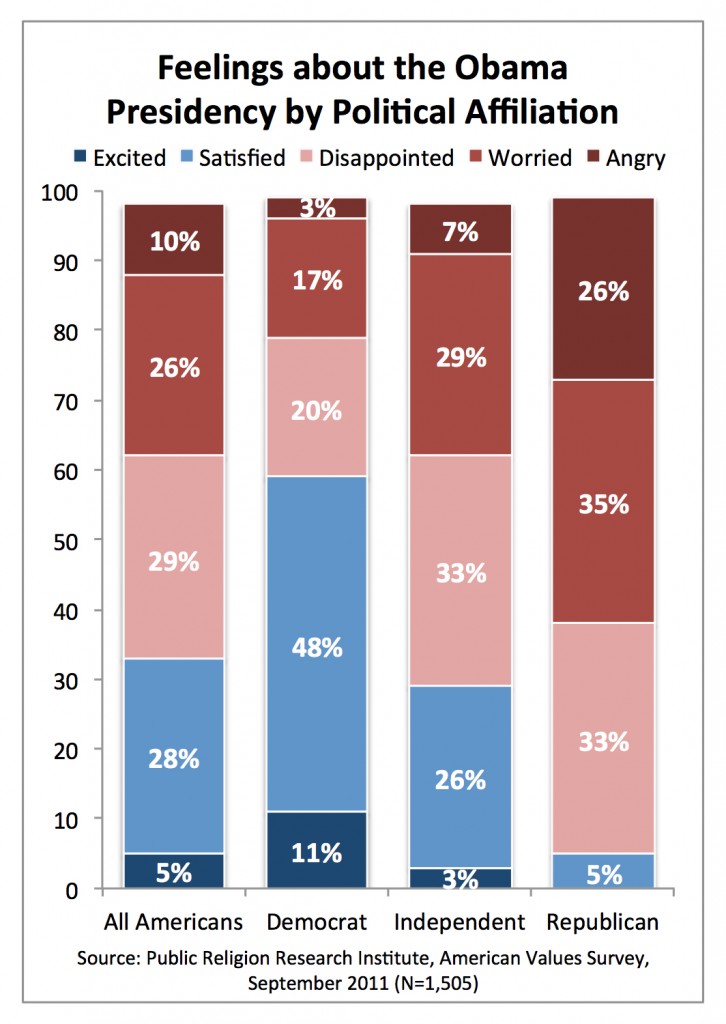 Americans’ feelings about the Obama presidency are decidedly mixed.
- Overall, approximately equal numbers of Americans report that they are excited (5%) or satisfied (28%) as report feeling worried (26%), or angry (10%). Nearly 3-in-10 (29%), however, report feeling disappointed.
- Americans are almost equally divided in their views about how Obama is doing as President: 45% approve and 44% disapprove.
- A majority (54%) of white Americans disapprove of how Obama is handling his job as president. In contrast, 55% of Hispanic Americans and fully 88% of African Americans approve of how Obama is handling his job as president.
- Although Americans are divided over his job as president, a majority (53%) of Americans say they have a favorable view of Obama personally.
When asked to voice the reasons for their disapproval of Obama’s job performance in their own words, Americans most frequently cite leadership qualities (41%) and his handling of economic issues (37%). Only about 1-in-10 (11%) mention personal qualities of the President or some other reason (9%), a category that includes foreign policy and immigration.
More Americans believe that President Obama, rather than Republican leaders in Congress, has a better idea about how to create jobs (44% and 35% respectively).
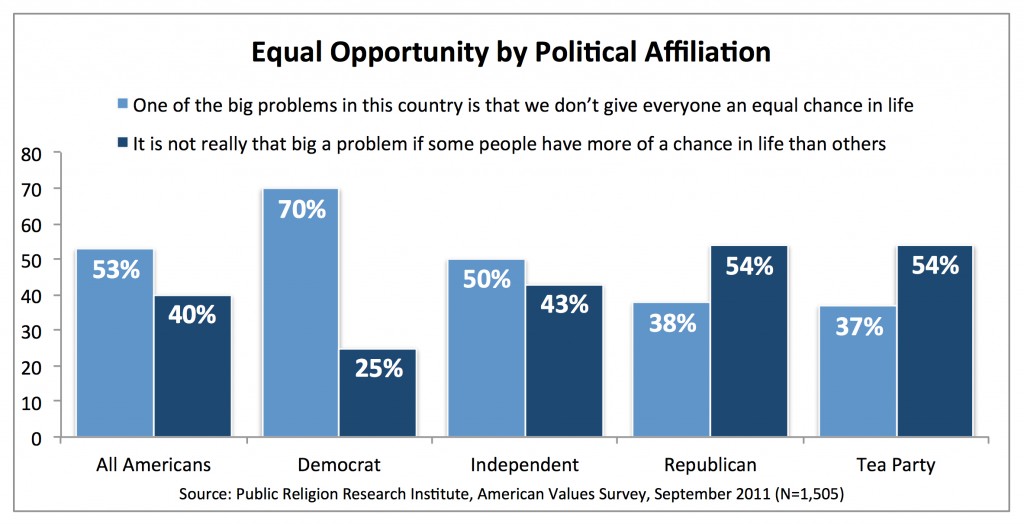 There are large divisions in American society on the issue of equal opportunity. A majority (53%) of Americans believe that one of the biggest problems in the country is that everyone does not have an equal chance in life. Four-in-ten Americans say that it is not really that big a problem if some people have more of a chance than others.
- Seven-in-ten Democrats believe that one of the biggest problems in the country is that everyone does not have an equal chance in life, while less than 4-in-10 Republicans (38%) and Tea Party members (37%) agree. The views of Independents closely track with the general public.
- White evangelical Protestants and white mainline Protestants are evenly divided, but a majority of Catholics (54%), the religiously unaffiliated (52%), and non-Christian affiliated Americans (54%), and fully 82% of black Protestants believe that one of the biggest problems in the country is that not everyone has an equal chance in life.
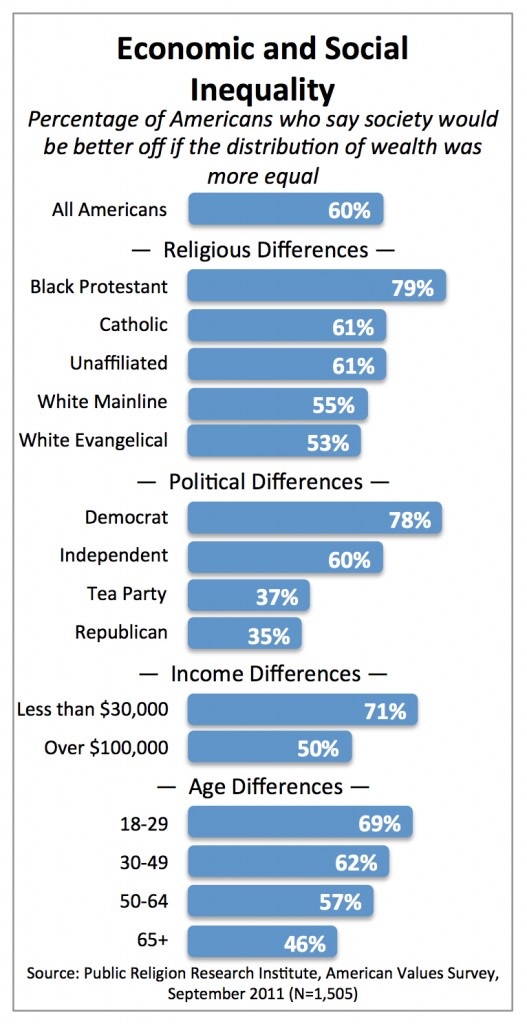
A strong majority (60%) of Americans agree that the country would be better off if the distribution of wealth was more equal, while 39% disagree.
- Strong majorities of Democrats (78%) and Independents (60%) agree that the country would be better off if the wealth was more evenly divided. In stark contrast, more than 6-in-10 (63%) Republicans and Americans who identify with the Tea Party movement (62%) disagree.
- Majorities of every major religious group and religiously unaffiliated Americans agree that the country would be better off if the distribution of wealth was more equal.
- Nearly 7-in-10 (69%) Millennials agree that the U.S. would be better off if there was a more equal distribution of wealth. Among seniors, less than half (46%) agree.
Seven-in-ten (70%) Americans favor “the Buffett rule,” a proposal to increase the tax rate on Americans earning more than $1 million per year, compared to only 27% who oppose it.
- While solid majorities of Democrats (85%) and Independents (70%) support increasing the tax rate on Americans earning more than $1 million a year, just over half of Republicans (52%) and only 4-in-10 Tea Party members favor it.
- Less than half (43%) of Americans who most trust Fox News favor increasing the tax rate for Americans making more than $1 million a year (55% oppose it). In contrast, approximately 8-in-10 Americans who most trust any other media outlet favor such an increase (82% for broadcast news, 76% for CNN, 81% for MSNBC, and 84% for public television).
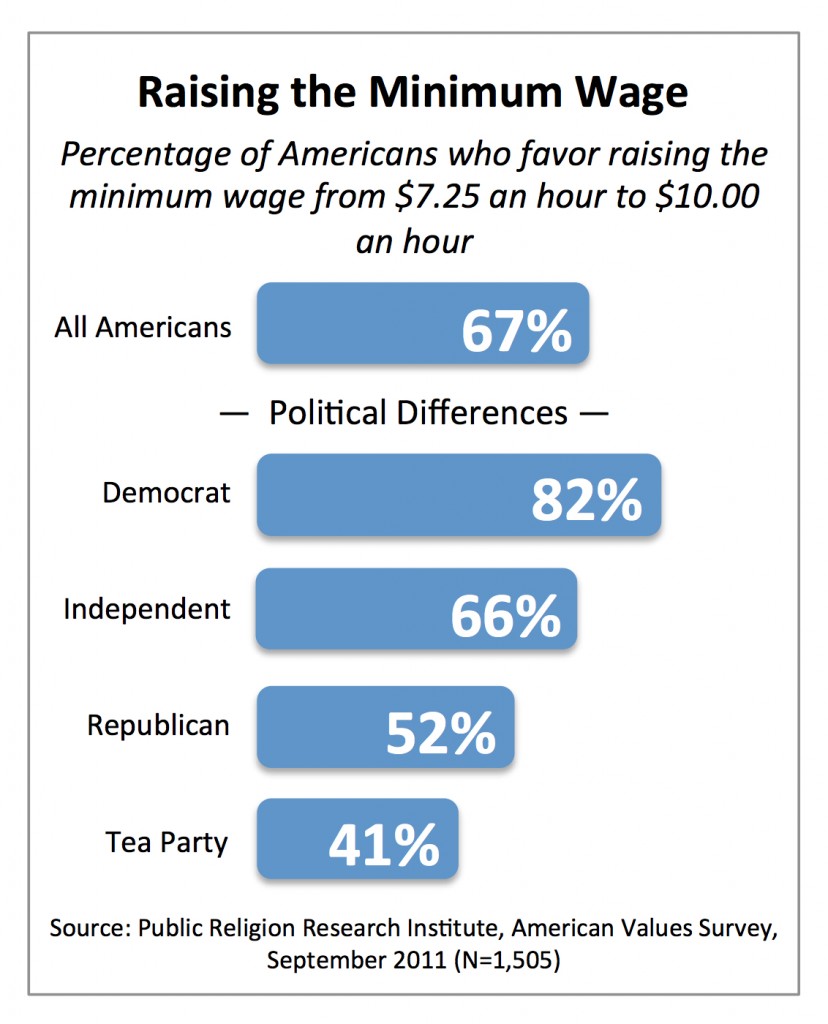 Overall, two-thirds (67%) of Americans favor increasing the minimum wage from $7.25 an hour to $10.00 an hour. Majorities of nearly every demographic group—with the exception of the Tea Party members (41%) and those who most trust Fox News (43%)—support an increase in the minimum wage. Support for raising the minimum wage has remained stable since 2010.
The general public has mixed views about what effect the health care reform law passed last year will have on most Americans. Significantly more Americans believe that it will result in more people having health insurance (37%) than believe that it will result in fewer people having coverage (24%). Roughly one-third (34%) say it will have no impact on the number of people covered by health insurance. However, Americans are also more likely to believe that it will make health insurance less affordable (39%) than more affordable (25%). Three-in-ten say the law will not have any effect on the cost of health care.
I. Religion, Values and the 2012 Election
Religion and Presidential Candidates
Importance of Presidential Candidates’ Religious Beliefs
Two-thirds of voters say that it is very important (39%) or somewhat important (28%) for a presidential candidate to have strong religious beliefs. While Republican voters (78%) are more likely than others to say it is somewhat or very important that a presidential candidate have strong religious beliefs, majorities of Democrats (66%) and Independents (58%) also agree.
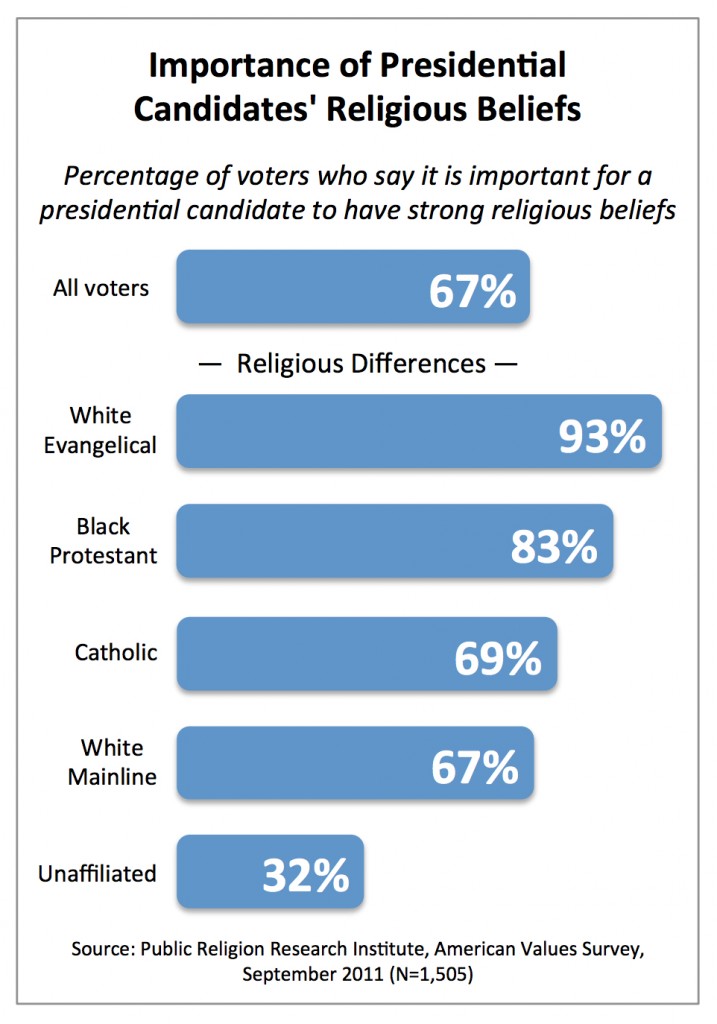 There are significant differences between religious groups. More than 9-in-10 (93%) white evangelical Protestant voters say that it is very or somewhat important that a candidate for president have strong religious beliefs. More than 8-in-10 (83%) black Protestant voters also report that it is important for a presidential candidate to have strong religious beliefs. Similar numbers of white mainline Protestant voters (67%) and Catholic voters (69%) say it is important that a candidate for president have strong religious beliefs. Among voters with no formal religious affiliation, less than one-third (32%) say that strong religious beliefs are important.
Among those who say it is important for a presidential candidate to have strong religious beliefs, most say that what matters is simply holding strong religious beliefs, rather than holding particular religious beliefs. However, for a significant number of voters, it is not enough just to have strong religious beliefs. Roughly 1-in-5 (19%) voters say they would be less likely to vote for a candidate who had strong religious beliefs, if those beliefs were very different from their own.
Religious voters who are more likely to say that it is important for a presidential candidate to have strong religious beliefs are also more likely to care about whether those beliefs are similar to or different from their own. For example, more than one-third (36%) of white evangelical Protestant voters say they would be less likely to vote for a candidate who had strong religious beliefs, if those religious beliefs were very different from their own. No more than 1-in-5 voters of any other religious group say they would be less likely to vote for a candidate with religious beliefs if those beliefs were very different from their own, including black Protestants (20%), white mainline Protestants (18%), and Catholics (15%).
There are also significant political divisions. Among Republican voters, 27% report that they would be less likely to vote for a candidate with religious beliefs very different from their own. In contrast, only 14% of Democratic voters and 16% of Independent voters say they would be less likely to vote for a candidate with religious beliefs very different from their own.
Discomfort with a Mormon, Evangelical, Atheist or Muslim President
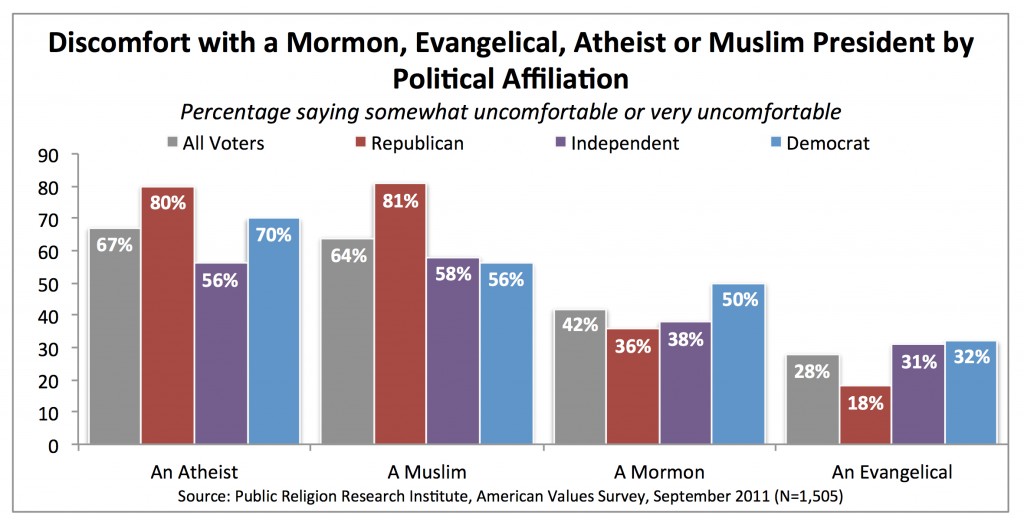
Although most voters want a president to have strong religious beliefs, comfort levels with different religious affiliations vary considerably. About 4-in-10 (42%) voters say they would be at least somewhat uncomfortable with a Mormon president, compared to a majority (53%) who report that they would be at least somewhat comfortable. Roughly 3-in-10 (28%) voters say they would be somewhat or very uncomfortable with an evangelical Christian serving as President. Approximately two-thirds of voters say they would feel at least somewhat uncomfortable with a Muslim (64%) or an atheist (67%) serving as President. Nearly half (48%) of voters say they would be very uncomfortable with an atheist serving as President. These findings suggest that when voters report that it is important that a candidate have strong religious beliefs, they have certain types of religious beliefs in mind, and hold significant reservations about the beliefs of some minority religious groups.
Voters vary significantly in their level of comfort with a Mormon, evangelical, atheist or Muslim president, according to their political affiliation. Significantly more Democratic voters (50%) than Republican voters (36%) or Independent voters (38%) report feeling at least somewhat uncomfortable with a Mormon serving as president. A majority of Republican voters (62%) and Independent voters (56%) say they would feel at least somewhat comfortable with a Mormon serving as president.
Overwhelming majorities of Republican and Democratic voters say they would be uncomfortable with an atheist serving as president (80% and 70% respectively). Fewer Independent voters (56%)—although still a majority—say they would be uncomfortable with an atheist as president. Republican voters are much more likely than Democratic voters or Independent voters to report feeling uncomfortable with a Muslim serving as president (81% vs. 56% and 58%, respectively). Finally, less than one-third of Republican voters (18%), Democratic voters (32%) and Independent voters (31%) say they would feel at least somewhat uncomfortable with an evangelical serving as president.
There are also significant and complex generational divisions on this question. Importantly, Millennial voters (age 18-29) express greater discomfort than senior voters (age 65 and older) with the idea of a Mormon serving as president. A majority (54%) of Millennial voters say they would be uncomfortable with a Mormon serving as president, compared to less than 4-in-10 (39%) of senior voters.
On the other hand, Millennial voters are less likely than senior voters to harbor discomfort with an atheist or Muslim serving as president. Among Millennial voters, a majority (56%) say they would feel at least somewhat uncomfortable with an atheist serving as president, while roughly 4-in-10 (41%) say they would feel at least somewhat comfortable. In contrast, more than three-quarters (77%) of senior voters say they would be at least somewhat uncomfortable with an atheist serving as president, including 60% who say they would feel very uncomfortable. Half (50%) of Millennial voters say they would feel at least somewhat uncomfortable with a Muslim serving as president while nearly as many (47%) say that they would be comfortable. Among senior voters nearly three-quarters (74%) say a Muslim serving as president would make them at least somewhat uncomfortable.
The Mormon Question in the 2012 Election
Identity & Difference: Views about Mormonism and the Religious Beliefs of Mormons
The presence of two Mormon presidential candidates in the Republican primary has raised the question of whether their religious affiliation will adversely affect their electoral prospects, particularly among the Republican primary electorate, which is dominated by Christian conservatives. There are two questions that figure prominently in the debate about Mormonism: first, whether the Mormon faith is viewed as a Christian religion; and second, whether Americans believe that the religious beliefs and practices of Mormons are very different from their own.
Perceptions of the Mormon Faith as a Christian Religion
Overall, half of registered voters believe that the Mormon faith is a Christian religion, compared to less than 36% who disagree; 14% say they are not sure. Views about Mormonism differ markedly by political affiliation and religion. A majority of Republican (53%), Independent (58%) and Tea Party (56%) voters believe that the Mormon faith is a Christian religion. In contrast, only about 4-in-10 (42%) Democratic voters believe that Mormonism is a Christian religion; approximately the same number of Democratic voters (41%) say it is not a Christian religion. Nearly 1-in-5 (16%) Democratic voters report that they do not know.
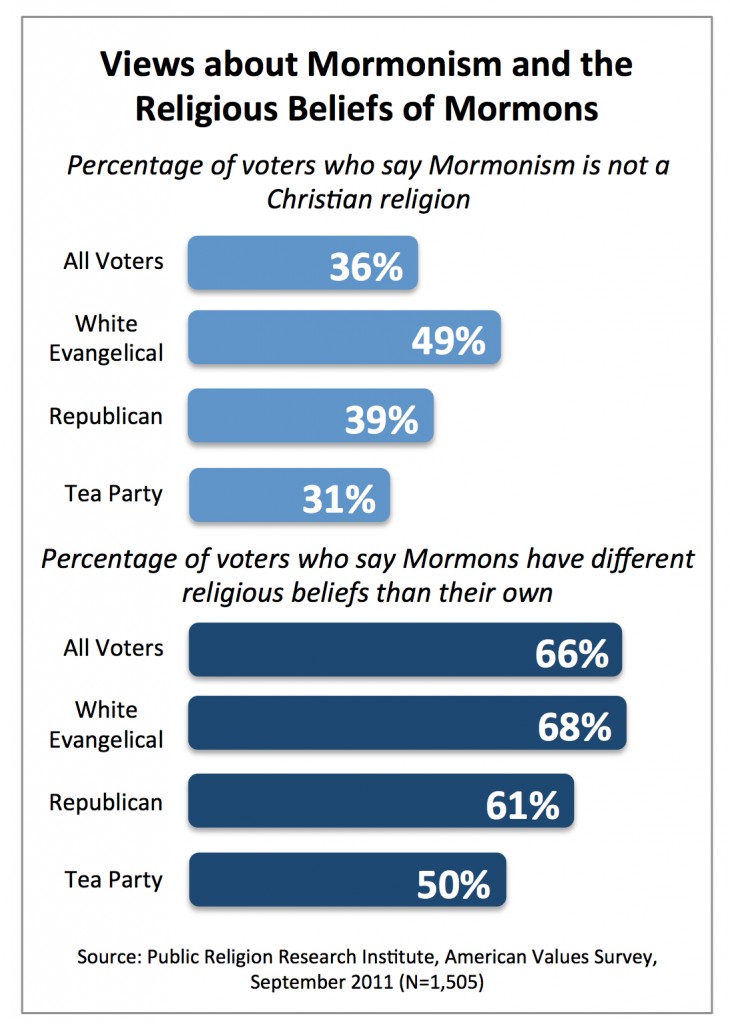 The differences between religious groups are even more pronounced. A majority of white mainline Protestant voters (59%), unaffiliated voters (57%), and Catholic voters (51%) report that the Mormon faith is a Christian religion. Less than 4-in-10 white evangelical Protestant voters (39%) and black Protestant voters (35%) agree that it is a Christian religion.
A majority or plurality of voters in every age group except Millennial voters believe that the Mormon faith is a Christian religion. Millennials are evenly divided over whether they believe Mormonism is a Christian religion (43%) or is not a Christian religion (43%).
Women are much less likely than men to say that Mormonism is a Christian religion (44% and 56% respectively), which may be the result of women’s higher levels of formal religious engagement.
Perceptions of Similarity of Mormonism to Respondents’ Own Religion
Voters are more likely than not to believe that the Mormon faith is a Christian religion, but relatively few claim that the religious beliefs of Mormons are similar to their own. Approximately two-thirds (66%) of voters say that the religious beliefs of Mormons are somewhat or very different from their own.
Survey Experiment: Identifying Hidden Concerns about a Mormon Becoming President
Previous research has shown that voters’ responses to questions in public opinion surveys about whether they would support a candidate who was black or a woman have not always reflected their behavior in the voting booth. In these instances, Americans tended to overstate their willingness to vote for a candidate with one of these characteristics. The current survey, in addition to asking respondents directly how comfortable they would be with a Mormon president, included a survey experiment designed to measure indirectly whether voters would be bothered or worried by a Mormon becoming president of the United States.
In order to allow respondents to express their discomfort or concern about a Mormon becoming president without having to directly state their views to the interviewer, we utilized a List Experiment. (1) In the List Experiment respondents were randomly divided into two demographically identical groups. Each group was read a list of statements and instructed to report how many statements—but not which specific statements—would worry or bother them. The first group was read a list of three statements (A-C below). The second group was given the identical set of three statements with an additional fourth statement (A-D below): “A Mormon becoming president of the United States.”
Voters who were unwilling to publicly voice concerns or misgivings about a Mormon becoming president were thus given a way to do so indirectly. Unless a respondent selected all four statements (only 4% chose all four), they could be assured that the interviewer would have no way of knowing which statement bothered or worried them. Given that the groups were randomly assigned, the only reason for the mean number of statements selected in each group to differ was the selection of the additional statement. Therefore, by subtracting the mean number of statements selected in each group, we were able to determine exactly how many voters are worried or bothered by the prospect of a Mormon becoming president.
The List Experiment reveals that a substantial number of voters express concern about a Mormon becoming president. Forty-two percent of voters (0.98 – 1.40) indirectly indicate that they would be worried or bothered by a Mormon becoming president. There are significant differences between religious and political groups.
Among white evangelical voters, nearly half (49%) would be worried or bothered by a Mormon becoming president. A majority (57%) of white mainline Protestant voters would also be worried or bothered by a Mormon becoming president. Roughly 4-in-10 Catholic voters (41%) and unaffiliated voters (43%) also report being worried or bothered.
The political differences are also significant. Republican and Independent voters (30% and 37% respectively) are much less likely to express concern about a Mormon becoming president than are Democratic voters (54%).
Few Hidden Concerns about a Mormon President
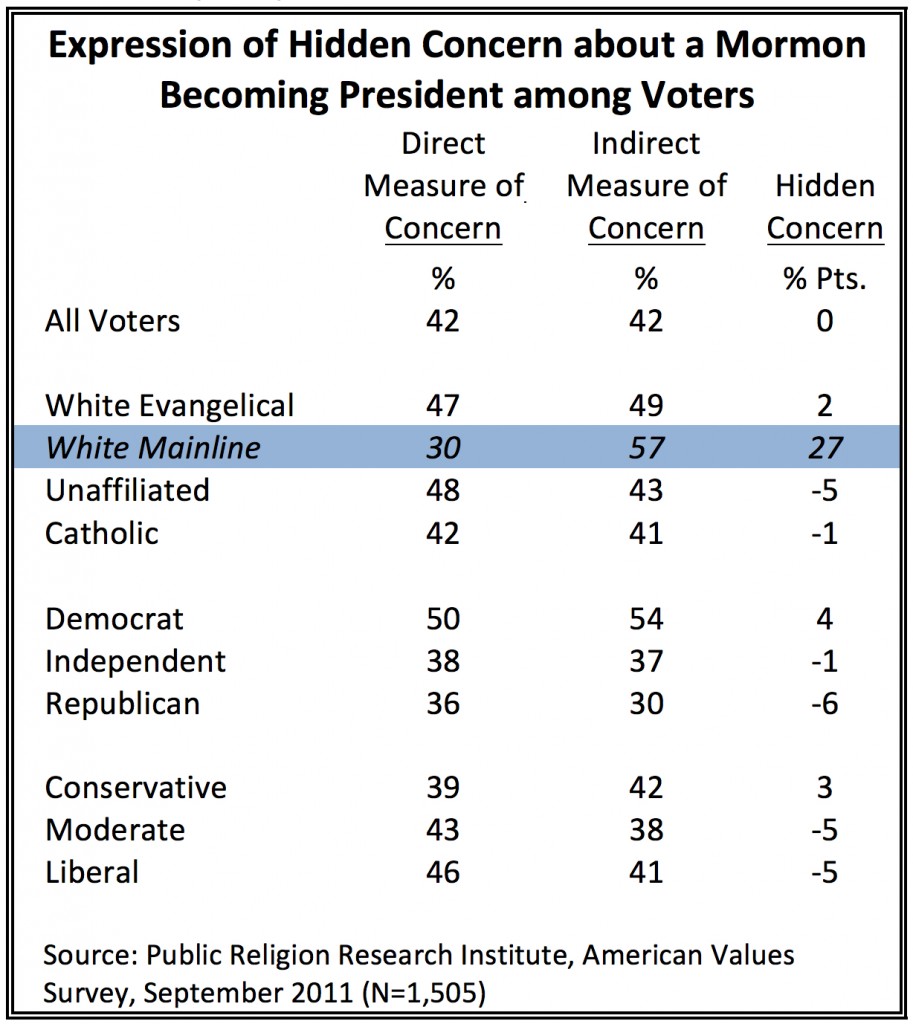 The results of the List Experiment demonstrate that most voters reliably report their concerns about the possibility of a Mormon president. Overall, 4-in-10 voters report both directly (42%) and indirectly (42%) that they have worries or discomfort about a Mormon becoming president. There are no significant differences across nearly all major religious and political groups, with the notable exception of white mainline Protestant voters. Among white mainline Protestant voters less than one-third (30%) directly say that they would be uncomfortable with a Mormon president, but nearly twice as many (57%) indirectly say that a Mormon becoming president would bother or worry them. This suggests that white mainline Protestant voters harbor feelings of discomfort about a Mormon becoming president that they may not express directly in a telephone survey.
Knowledge of Romney’s Religion
Despite steady media coverage and some prominent controversy over an evangelical leader who called the Mormon faith a cult, only 42% of Americans can correctly identify Mitt Romney’s religion as Mormon. This level of knowledge remains unchanged from July 2011, when 4-in-10 (40%) Americans correctly identified Mitt Romney’s religion as Mormon.
White evangelical Protestants are the only subgroup that demonstrates increased knowledge of Romney’s religion (53% today compared to 44% in July). College graduates and seniors are most likely to correctly identify Romney as a Mormon (66% and 62% respectively). Republicans (52%) and members of the Tea Party movement (52%) are significantly more likely to correctly identify Romney’s religion than Independents (41%) or Democrats (36%).
Registered voters are more likely than Americans overall to correctly identify Romney’s religion. Nearly half (49%) of voters are able to correctly identify Romney’s religion, compared to 42% of Americans overall.
Relationship between Views about Mormonism and Favorability of Romney
Views about Mormonism are highly correlated with opinions of Romney. Nearly two-thirds (66%) of voters who believe that Mormons have religious beliefs that are somewhat or very similar to their own and who are familiar with Romney, have a favorable view of him. In contrast, among voters who say Mormons’ religious beliefs are somewhat or very different, less than half (47%) report having a favorable opinion.
The 2012 Republican Party Primary
The dynamics of the Republican primary campaign shifted significantly between September and October as the candidates became increasingly better known to the voters; there were six debates over a course of seven weeks. Moreover, during this period the Republican field saw dramatic changes in the voters’ attitudes toward Herman Cain and Rick Perry. Because of these changes, PRRI conducted a follow-up survey in late October 2011 to get a more up-to-date look at the state of the Republican field. (2)
Electability of the Candidates
By a significant margin, Mitt Romney is viewed as the most electable candidate by GOP voters, with nearly half (46%) reporting that Romney has the best chance of defeating President Obama in 2012. About one-quarter (26%) report that Perry has the best chance of defeating President Obama. Less than 1-in-10 GOP voters believe that Michele Bachmann (7%), Ron Paul (4%) or Jon Huntsman (2%) are the most electable Republican candidates. (3)
Among Tea Party voters, Romney’s advantage over Perry is more muted. Roughly 4-in-10 (38%) voters who identify with the Tea Party movement say that Romney has the best chance of defeating Obama, compared to 31% who say Perry and 11% who say Bachmann has the best chance of defeating Obama.
Romney is also seen as more electable among white evangelical voters. Roughly 4-in-10 (38%) say that he has the best chance of winning against Obama in 2012, compared to 26% who believe Perry has the best shot. More than 1-in-5 (21%) white evangelical voters report that they do not know who is best able to defeat Obama.
Voters who most trust Fox News for their information about politics and current events are nearly twice as likely to say that Romney is the GOP’s best chance of defeating Obama as they are to say this about Perry (47% vs. 24% respectively).
Favorability of the Candidates
The State of the Republican Field (Late September 2011)
In late September, among voters who were familiar with Mitt Romney, a majority (52%) reported having a favorable view of him. Less than half of voters who were familiar with the candidates reported that they had a favorable view of Rick Perry (42%), Michele Bachmann (42%), Ron Paul (43%), or Jon Huntsman (42%).
Among Republican voters who were familiar with the candidates, Romney maintained a significant advantage over most of his rivals, with the exception of Rick Perry. More than three-quarters (76%) reported that they had a favorable view of Romney, compared to 71% who had a favorable view of Perry. Less than two-thirds (64%) said they had a favorable view of Bachmann, and less than half had a favorable view of Ron Paul. (4)
Among white evangelical voters who were familiar with the candidates, there was no clear favorite. Roughly 6-in-10 white evangelical voters said they had a favorable view of Romney (63%), Perry (57%), and Bachmann (59%). There were also no clear candidate preferences among Tea Party voters. Among Tea Party voters who were familiar with the candidates, overwhelming numbers reported having a favorable opinion of Romney (79%), Perry (78%), and Bachmann (78%).
The State of the Republican Field (Late October 2011)
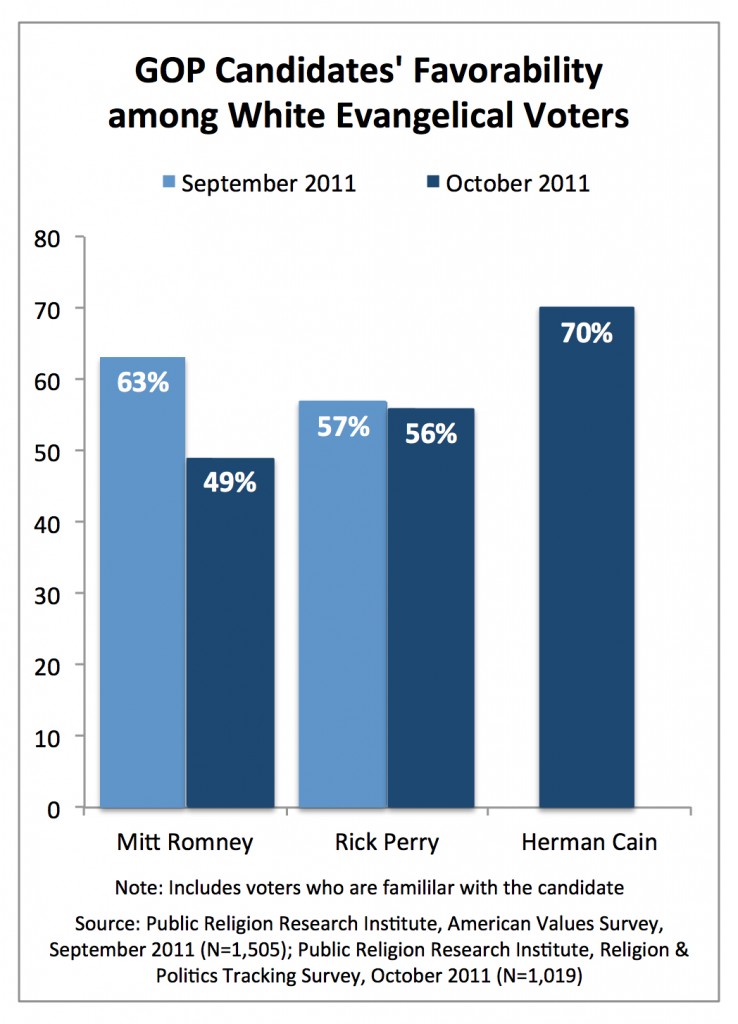 The ground has shifted significantly in the GOP primary since late September. Both Perry and Romney are viewed less favorably among Republican voters who are familiar enough with them to provide an opinion. Meanwhile, Herman Cain has moved from relative obscurity to contender, faring better than both Romney and Perry among Republican voters who are familiar with him.
Nearly two-thirds (66%) of Republican voters who are familiar with Romney currently say they have a favorable opinion of him, a 10-point drop since late September. For Perry, the drop in positive views is even more dramatic. A slim majority (53%) of Republican voters currently say they have a favorable view of Perry, compared to 71% who had a favorable view in late September (an 18-point drop). More than 7-in-10 (73%) Republican voters currently have favorable view of Cain.
Among white evangelical Protestant voters who have an opinion of him, Romney has also seen his personal favorability ratings slide. In late September, more than 6-in-10 (63%) white evangelical voters had a positive view of Romney, compared to less than half (49%) today. By contrast, despite Perry’s dramatic drop in favorability among Republican voters, a majority of white evangelical voters continue to hold favorable views of Perry (57% in late September vs. 56% currently). However, Herman Cain is by far viewed most positively by white evangelical voters. Seven-in-ten (70%) white evangelical voters who are familiar with Cain say that they have a favorable impression of him.
Identifying with the Republican Candidates: Political Views vs. Religious Beliefs
The three leading Republican Presidential candidates—Romney, Cain, and Perry—fare differently on measures of political and religious affinity among Republican voters overall as well as among white evangelical Protestant voters. These findings provide new insights into why Romney has had difficulty solidifying his lead, why Perry’s support has flagged, and why Cain has been able to make inroads.
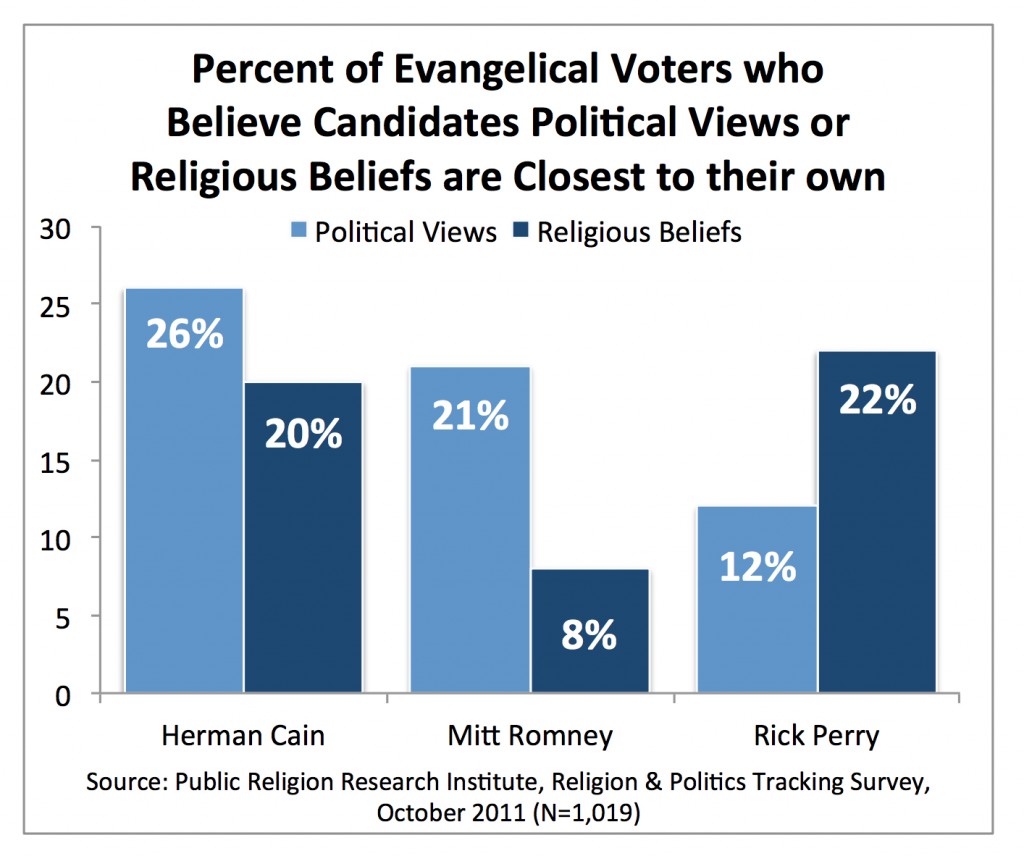 Republican and white evangelical Protestant voters are more than twice as likely to identify with Romney’s political views than with his religious views. More than one-quarter (26%) of Republican voters say that Romney is the Republican presidential candidate whose political views are closest to their own, but only 1-in-10 (10%) Republican voters report that Romney is the candidate whose religious beliefs are closest to their own. This same pattern is evident among white evangelical Protestant voters. Twenty-one percent say that Romney is the candidate whose political views are closest to their own, but less than 1-in-10 (8%) say that, compared to other GOP presidential candidates, Romney’s religious beliefs are closest to their own.
Significant numbers of Republican and white evangelical Protestant voters identify both with Cain’s political views and his religious views. One quarter (25%) of Republican voters say that Herman Cain is the Republican presidential candidate whose political views are closest to their own, compared to about 1-in-5 (19%) Republican voters who say his religious beliefs are closest to their own. The pattern is roughly similar among white evangelical Protestant voters. More than one-quarter (26%) of white evangelical voters say that, compared to the other candidates, Herman Cain’s political views are closest to their own, while about 1-in-5 (20%) say his religious beliefs are closest to their own.
Among Republican and white evangelical Protestant voters, Perry trails both Romney and Cain on measures of political affinity, and is roughly even with Cain on measures of religious affinity. Nearly equal numbers of Republican voters say that Rick Perry’s political views (15%) and religious beliefs (17%) are closest to their own. By contrast, white evangelical voters are nearly twice as likely to say that Perry’s religious beliefs are closest to their own (22%) than to say his political views are closest to their own (12%).
II. The Obama Presidency
Feelings about the Obama Presidency
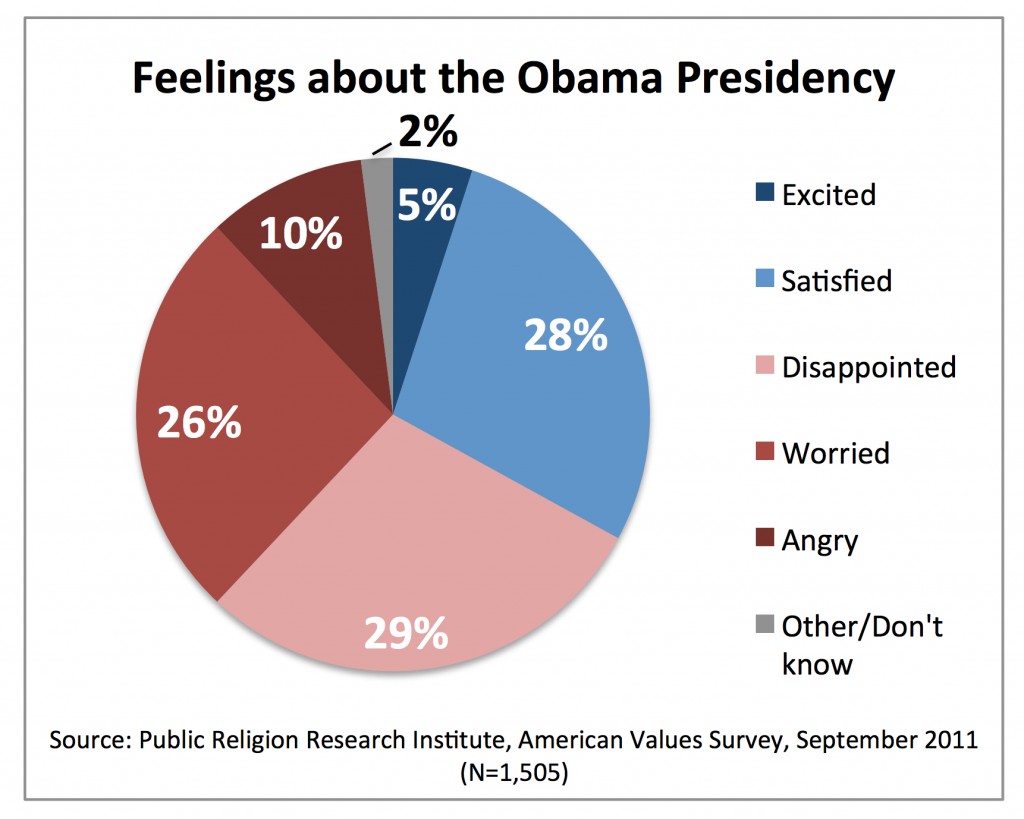 Americans’ feelings about the Obama presidency are decidedly mixed. Overall, more Americans report feeling disappointed (29%), worried (26%), or angry (10%) than report feeling satisfied (28%) or excited (5%). There are no differences between the views of voters and Americans overall about the Obama presidency. However, there are strong partisan, religious and racial divides in how Americans feel.
The racial and ethnic divides are the starkest. Nearly three-quarters of African Americans are either satisfied with (61%) or excited about (12%) Obama’s presidency, compared to only about 1-in-4 who say they are disappointed (8%), worried (16%) or angry (2%). More than 4-in-10 Latinos report feeling satisfied (34%) or excited (9%). A majority, however, report feeling disappointed (25%), worried (28%), or angry (2%). Whites are far less likely to feel satisfied (21%) or excited (3%) about the Obama presidency than blacks or Latinos. One-third of white Americans say they are disappointed, and nearly 3-in-10 (28%) say they are feeling worried. Notably, 14% of white Americans say they feel angry about the Obama presidency.
There are also significant political divides. While nearly 6-in-10 Democrats report being satisfied with (48%) or excited about (11%) the Obama presidency, only 5% of Republicans say they are satisfied or excited. Four-in-ten Democrats say they feel disappointed (20%), worried (17%) or angry (3%), compared to more than 9-in-10 Republicans who say they feel worried (35%), disappointed (33%) or angry (26%). Independents closely resemble the general public.
A slim majority of Americans who report having voted for Obama in 2008 are currently satisfied with (43%) or excited about (9%) his presidency. Notably, nearly as many Obama voters report feeling disappointed (25%) or worried (21%). Nearly all McCain voters feel either disappointed (36%), worried (35%), or angry (25%).
Millennials are much more likely than seniors to report feelings of satisfaction or excitement (43% and 30% respectively). Seniors are nearly three times as likely as Millennials to report feeling angry (13% vs. 5%).
Obama’s Job Approval
Americans are almost equally divided in their views about how Obama is doing as President: 45% approve and 44% disapprove. Views about Obama’s job performance are strongly correlated with partisan affiliation. Among Democrats, nearly 8-in-10 (78%) say they approve of his job as President, compared to nearly 9-in-10 (88%) Republicans who disapprove. Independents are about evenly divided (41% approve, 42% disapprove), but nearly 1-in-5 (17%) report having no opinion.
Nearly three-quarters (74%) of Americans who reported voting for Obama in 2008 currently approve of his performance as president. Among McCain voters, nearly 9-in-10 (88%) disapprove.
There are strong racial differences in perceptions of Obama’s job performance. A majority (54%) of white Americans disapprove of how Obama is handling his job as president. On the other hand, 55% of Hispanic Americans and fully 88% of African Americans approve of how Obama is handling his job as president.
Among religious groups, this racial divide is also evident. White evangelical Protestants and white mainline Protestants are most critical of Obama’s job performance: more than two-thirds (68%) of white evangelicals and a majority (53%) of white mainline Protestants disapprove. Nearly half of Catholics (48%) and the unaffiliated (49%) approve, while no more than 4-in-10 of each group disapprove (40% and 35% respectively). Among black Protestants, nearly 9-in-10 (89%) approve.
Among Americans who disapprove of Obama’s job as president, the majority (55%) identify as conservative, roughly one-third (32%) identify as moderate, and 1-in-10 are liberal.
In Their Own Words: Disapproval of Obama’s Job as President
We asked Americans who disapprove of Obama’s job as president to tell us—in their own words—the most important reason they disapprove. Although answers varied, most could be sorted into three basic categories: disapproval of Obama’s economic policies or the economy in general (i.e. health care, too much spending, high unemployment), dissatisfaction with his leadership (i.e. too inexperienced, broken promises), and criticism of his personal qualities (i.e. dishonest, socialist).
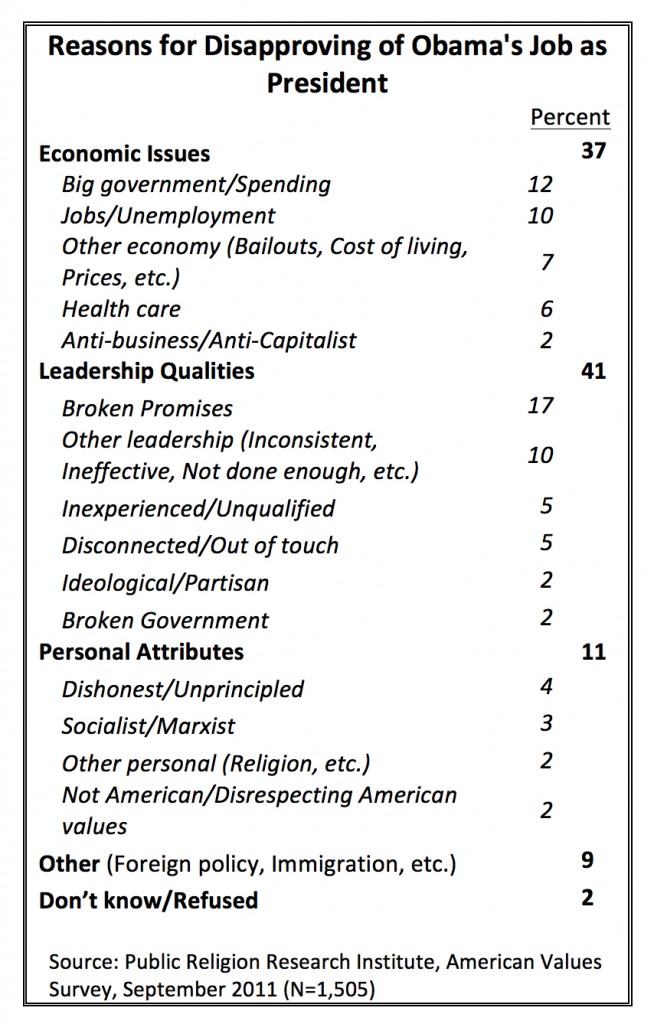 Overall, Americans who disapprove of Obama’s job as president are nearly equally as likely to cite economic issues (37%) as Obama’s leadership (41%). Only about 1-in-10 (11%) cite the President’s personal qualities as a reason they disapprove of his job as President, and less than 1-in-10 (9%) cite some other reason, a category that included foreign policy issues and immigration.
Americans who cite economic issues most often refer to the lack of jobs (10%) and government spending (12%). Only 6% say that their reason for disapproving of Obama is related to the health care law.
Americans who cite concerns about Obama’s leadership most frequently mentioned broken promises (17%) or general leadership failures such as inconsistency or ineffectiveness (10%). One-in-twenty Americans who disapprove of Obama’s job performance also cite Obama’s inexperience (5%) or say that the President is out of touch or disconnected from people (5%). Only 2% of those who disapprove of Obama say he is too partisan or ideological.
Among those who cite a personal characteristic, the most commonly mentioned criticism was Obama’s level of trustworthiness (4%). Although recent surveys have shown that a significant number of Americans believe incorrectly that Obama is Muslim, few mention the President’s religious beliefs or identity as the most important reason for their disapproval.
There are significant differences by political ideology and gender. Women who disapprove of Obama’s job as president are more than twice as likely as men to cite jobs or unemployment (13% vs. 6%). In contrast, men are more than twice as likely as women to say that big government or excessive spending is the reason they disapprove of Obama’s job as president (18% vs. 7%).
Americans who identify as politically moderate are much more likely to say that broken promises (21%) are the reason they disapprove of Obama’s job as president compared to 12% of political conservatives. Conservatives are also twice as likely as moderates to say that big government or too much spending is the reason they disapprove (15% to 7%). Conservatives are also more than twice as likely as moderates to mention personal qualities (14% to 6%).
Obama’s Personal Favorability
Although Americans are divided over his job as president, a majority (53%) of Americans say they have a favorable view of Obama personally. Less than half (44%) have an unfavorable view.
African Americans (92%), Democrats (87%), Latinos (65%), the religiously unaffiliated (63%), and Millennials (59%) view Obama most favorably. Americans who view Obama unfavorably include white evangelicals (67%), Republicans (85%), and Americans who identify with the Tea Party movement (83%). Nearly two-thirds (65%) of Americans who identify with the Tea Party movement have a very unfavorable view of Obama, more than any other group.
President Obama vs. Republican Congressional Leaders
More Americans believe that President Obama, rather than Republican leaders in Congress, has a better idea about how to create jobs (44% and 35% respectively). However, more than 1-in-10 (13%) Americans believe that neither the President nor Congressional leaders have better ideas about how to create jobs.
Partisanship is strongly correlated with views about who has better ideas about creating jobs. Nearly 8-in-10 (78%) Democrats believe that Obama has better ideas than the GOP, while nearly three-quarters (74%) of Republicans say that Republican leaders in Congress have better ideas. Independents are more likely to believe Obama has better ideas than the GOP (41% to 33%), although nearly 1-in-5 (17%) report that, when it comes to creating jobs, neither has better ideas than the other.
III. American Values and the Economy
Views about the State of the Economy
Most Americans are pessimistic about the recent direction of the American economy. A majority (53%) say they think the economy has gotten worse over the past two years, compared to only 1-in-10 who believe that it has gotten better. Roughly one-third (35%) believe there has not been any change in the economic conditions of the country over the past two years.
Views of the economy are closely tied to political affiliation. Democrats have the most optimistic view of the economy’s performance. Nearly half (47%) of Democrats say the economy has stayed the same over the last two years. About 1-in-5 (19%) say that it has improved and one-third say it has gotten worse. Among Republicans, about 1-in-5 (19%) say the economy has stayed the same. Only 2% say it has gotten better and roughly 8-in-10 (79%) say the economy has gotten worse. The views of Independents closely resemble the general public.
Younger Americans are significantly less pessimistic about recent economic performance than older Americans. Less than half (42%) of Millennials report that the economy has gotten worse over the last two years, compared to roughly two-thirds (66%) of seniors.
Americans who most trust Fox News for information about politics and current events are far more likely to have negative views about the economy than Americans who most trust other television news sources. Nearly 8-in-10 (78%) Americans who most trust Fox News say that the economy has gotten worse over the past two years, compared to less than half of those who most trust broadcast news (46%), CNN (45%), MSNBC (41%) or public television (43%).
Salience of Economic Issues
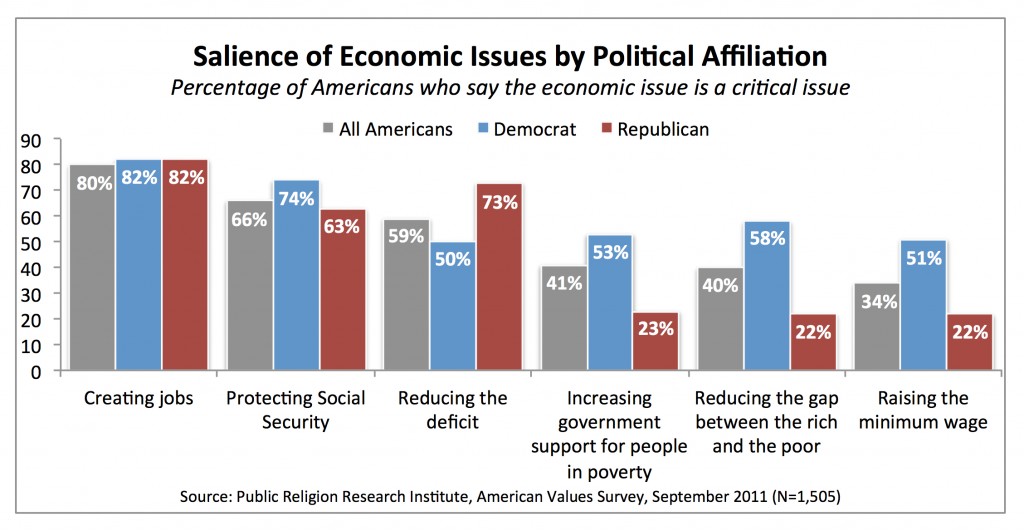
Americans are significantly more likely to say that creating jobs, protecting Social Security, and reducing the deficit are critical issues, than they are to cite measures to reduce income inequality, increase government support for people in poverty, or raise the minimum wage. Job creation emerges as the most important priority for Americans, with 8-in-10 Americans agreeing that it is a critical issue facing the country. Roughly two-thirds (66%) say that protecting Social Security is a critical issue, and nearly 6-in-10 (59%) say that reducing the deficit is a critical issue. Less than half of Americans say that reducing the gap between the rich and the poor (40%) and increasing government support for people in poverty (41%) are critical issues. Only about one-third (34%) of Americans agree that raising the minimum wage is a critical issue.
The issue of job creation is viewed as a critical issue among overwhelming majorities of Democrats (82%), Republicans (82%) and Independents (79%). There is greater partisan disagreement over the importance of reducing the deficit, raising the minimum wage, and reducing the gap between the rich and the poor. About three-quarters of Republicans (73%) and Americans who identify with the Tea Party movement (75%) agree that reducing the deficit is a critical issue, compared to only half of Democrats. Democrats, on the other hand, are more than twice as likely as Republicans and members of the Tea Party to report that raising the minimum wage is a critical issue (51% vs. 22% and 18%, respectively). And Democrats are roughly three times as likely as Republicans and members of the Tea Party to say that reducing the gap between rich and poor is a critical issue (58% to 22% and 20%, respectively). Democrats are more than twice as likely as Republicans to say that increasing government support for people in poverty is a critical issue (53% and 23% respectively).
Perceptions of the relative urgency of these economic issues also vary significantly according to race. African Americans are much more likely to prioritize reducing the gap between the rich and the poor (57% say it is a critical issue) than are white Americans (38%) or Hispanic Americans (34%).
There are also considerable differences in views between Americans with household incomes of less than $30,000 a year and those with incomes of $100,000 or more. Nearly half (47%) of Americans making less than $30,000 a year say that reducing the gap between rich and poor is a critical issue, compared to less than 3-in-10 (29%) of Americans making $100,000 or more. A majority (56%) of Americans making less than $30,000 a year say that increasing government support for people in poverty is a critical issue, compared to less than one-third (32%) of American households with incomes of $100,000 or more.
Economic & Social Values
The survey included a number of questions designed to measure attitudes about key issues at the heart of the recent “Occupy Wall Street” protests, including attitudes towards equal opportunity, wealth inequality, and social inequality.
Equal Opportunity
A majority (53%) of Americans believe that one of the big problems in this country is that we do not give everyone an equal chance in life. Four-in-ten Americans say that it is not really that big a problem if some people have more of a chance than others. There are major differences on this question by race, age, partisan affiliation and religion.
Seven-in-ten Democrats believe that one of the big problems in the country is that we don’t give everyone an equal chance, while less than 4-in-10 Republicans (38%) and Tea Party members (37%) agree. A majority of Republicans (54%) and Tea Party members (54%) say that it is not that big a problem if some people have more of a chance in life than others. The views of Independents closely track with the general public.
More than 8-in-10 (78%) African Americans and roughly two-thirds (64%) of Hispanics say that one of the country’s biggest problems is that not everyone has an equal chance in life. Whites are evenly divided, with 45% saying this is not really that big a problem and 48% saying that it is.
There are also significant religious divisions. White evangelical Protestants and white mainline Protestants are evenly divided, but a majority of Catholics (54%), the religiously unaffiliated (52%), and non-Christian affiliated Americans (54%) report that not giving everyone an equal chance in life is a major problem. Among black Protestants, 82% say the lack of equal opportunity is one of the big problems facing the country.
Americans are also divided according to their annual household income: among those whose total household income is less than $30,000 a year, 65% say that one of the big problems in this country is that we don’t give everyone an equal chance in life, compared to more than 4-in-10 (42%) Americans whose household income is $100,000 or more. The number of Americans who agree that the lack of equal opportunity is a major problem in the country steadily decreases as total annual household income rises.
Economic and Social Inequality
A strong majority (60%) of Americans agree that society would be better off if the distribution of wealth was more equal, while 39% disagree. There are strong divisions on this question by age, gender, party identification, race, and religious background.
Nearly 7-in-10 Millennials (69%) support the idea that the U.S. would be better off if there was a more equal distribution of wealth. Among seniors, less than half (46%) agree that society would be better off if distribution of wealth was more equal. Women are also significantly more likely than men to believe society would benefit if the distribution of wealth was more equal (65% to 54%).
Strong majorities of Democrats (78%) and Independents (60%) agree that society would be better off if the wealth was more evenly divided. In stark contrast, more than 6-in-10 (63%) Republicans and Americans who identify with the Tea Party movement (62%) disagree. In fact, nearly half (46%) of Tea Party identifiers completely disagree with the idea that society would be better off if the distribution of wealth was more equal.
Nearly 8-in-10 black Americans (78%) and Hispanic Americans (78%) agree that society would benefit from more even wealth distribution, compared to 54% of white Americans. A similar pattern emerges among religious groups: roughly 8-in-10 (79%) black Protestants agree that society would be better off if the distribution of wealth was more equal, compared to 53% of white evangelical Protestants and 55% of white mainline Protestants. More than 6-in-10 Catholics (61%) and the unaffiliated (61%) also agree that greater parity in wealth among Americans would benefit society overall.
 There is similarly strong agreement among Americans about the importance of reducing economic and social inequality. More than 6-in-10 (63%) of the general public agree we should dramatically reduce inequalities between rich and poor, whites and people of color, and men and women. One-third of the public disagrees.
There are stark divisions by political affiliation. Nearly three-quarters (74%) of Democrats and nearly two-thirds (64%) of Independents believe that a dramatic reduction in these inequalities is necessary, compared to less than half (47%) of Republicans. Only about 4-in-10 (41%) Americans who identify with the Tea Party agree that we must dramatically reduce social and economic inequality.
Racial divides on the need to reduce inequality across the board track with the findings on the question on inequality between the rich and the poor. Solid majorities of African Americans (75%) and Hispanic Americans (69%) agree with the need to dramatically reduce inequalities, compared to 60% of white Americans. Religious affiliation results also follow this pattern: black Protestants are most strongly in support (77%), followed by the unaffiliated (70%), Catholics (62%), white evangelical Protestants (58%) and white mainline Protestants (55%).
Discrimination and Equal Rights
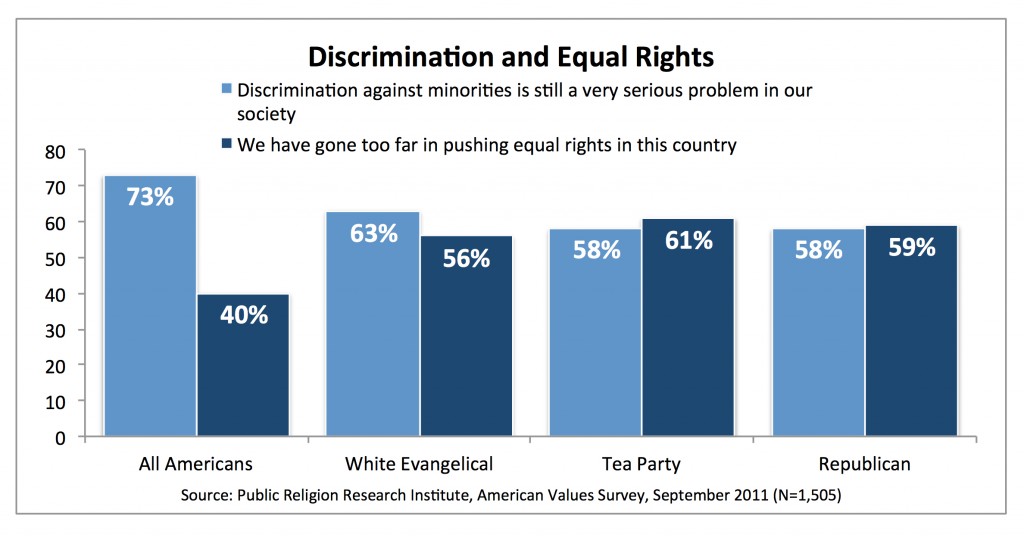
Most Americans acknowledge that discrimination against minorities is still a serious problem in society. Nearly three-quarters (73%) of Americans believe that discrimination against minorities is “still a very serious problem in our society,” while slightly more than 1-in-4 (27%) disagree. Majorities of Democrats, Independents, Republicans, and members of the Tea Party agree that discrimination is a serious problem, although with varying degrees of certainty (82%, 73%, 58% and 58%, respectively). Nine-in-ten (92%) black Americans, 8-in-10 Hispanic Americans, and two-thirds (67%) of white Americans also agree that discrimination against minorities is a very serious problem.
Most Americans also believe that the U.S. has not gone too far in trying to ensure equal rights in society. Roughly 6-in-10 (59%) Americans disagree that “we have gone too far in pushing equal rights in this country.” However, there is a greater level of ambivalence about the issue among some conservative groups. For instance, a majority of Republicans and members of the Tea Party movement agree that discrimination against minorities is a very serious problem (58%), yet also believe that we have gone too far in pushing equal rights in this country (59% and 61% respectively). Similarly, among white evangelicals, majorities simultaneously agree that discrimination against minorities is still a serious issue (63%), and that the U.S. has gone to far in pushing for equal rights (56%).
Role of Government in Society
American attitudes about government are complex and sometimes conflicting. On the one hand, two-thirds of Americans believe that the government should make laws to keep people from hurting themselves. On the other hand, an equal number (66%) agree that the government interferes far too much in our everyday lives. There are sharp divisions by partisan affiliation.
Majorities of every political group including Democrats (76%), Independents (63%), Republicans (58%) and Tea Party members (51%) agree that sometimes the government needs to make laws that keep people from hurting themselves. A majority of Democrats (54%), Independents (66%), Republicans (82%) and members of the Tea Party (88%) also agree that government interferes too much in our daily lives. Nearly two-thirds (66%) of the Tea Party movement completely agree and 48% of Republicans completely agree that the government interferes too much in our daily lives.
Economic Policy Issues
The “Buffett Rule”: Increasing the Tax Rate on Millionaires
Seven-in-ten (70%) Americans support increasing the tax rate on Americans earning more than $1 million a year, compared to more than 1-in-4 (27%) who are opposed. The greatest differences are based on party affiliation and most trusted media source.
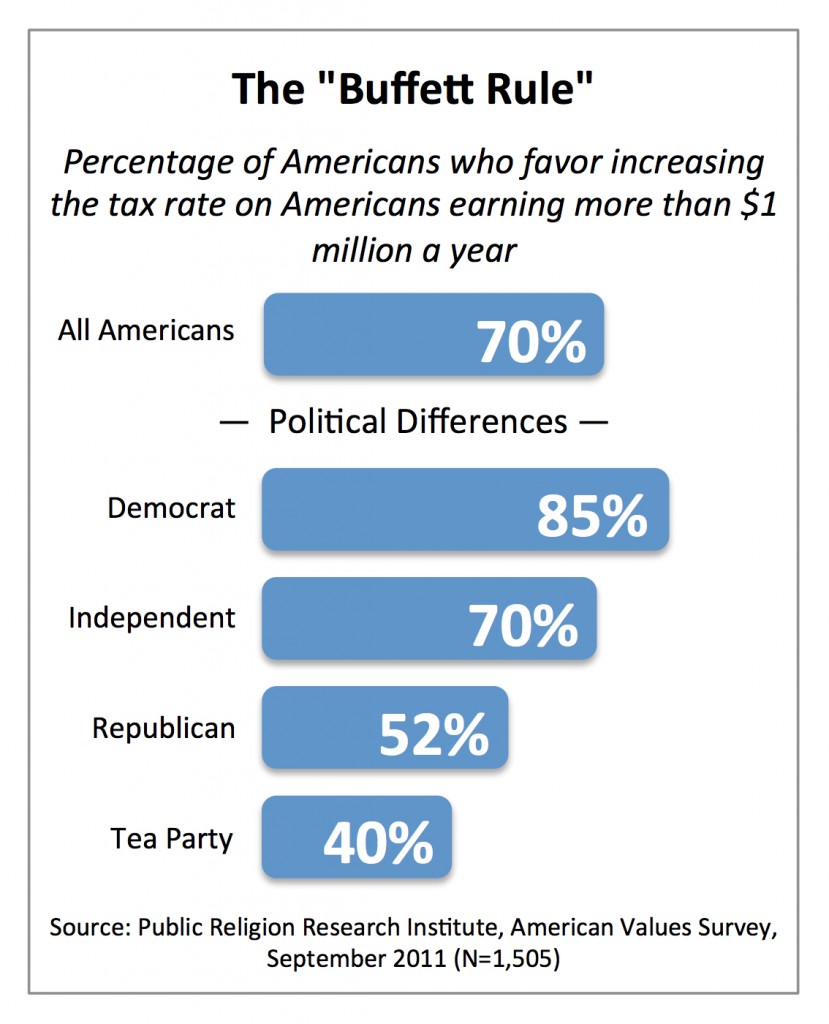 While solid majorities of Democrats (85%) and Independents (70%) support increasing the tax rate on Americans earning more than $1 million a year, just over half of Republicans (52%) and only 4-in-10 Tea Party members favor it. Among Americans who identify with the Tea Party movement, nearly 6-in-10 (59%) oppose raising the tax rate on millionaires.
Opinion on this issue also varies by most trusted media source. Less than half (43%) of Americans who most trust Fox News favor increasing the tax rate for Americans making more than $1 million a year (55% are opposed). In contrast, approximately 8-in-10 Americans who most trust any other media outlet favor such an increase (82% for broadcast news, 76% for CNN, 81% for MSNBC, and 84% for public television).
Raising the Minimum Wage
Overall, two-thirds (67%) of Americans favor increasing the minimum wage from $7.25 to $10.00 an hour, but opinion is highly variable based on age, gender, race, and political party. Majorities of nearly every demographic group—with the exception of the Tea Party members and those who most trust Fox News—support an increase in the minimum wage. Support for the minimum wage has remained stable since 2010.
While Millennials mirror the general population in terms of their support for increasing the minimum wage (73%), seniors are more closely divided, with 54% in favor and 41% opposed. Women are also significantly more likely than men to favor raising the minimum wage (74% vs. 59%).
Democrats overwhelmingly (82%) favor raising the minimum wage, as do two-thirds of Independents. A slim majority (52%) of Republicans also approve of an increase in the minimum wage. In contrast, only about 4-in-10 (41%) Americans who identify with the Tea Party favor raising the minimum wage; a majority (56%) of Tea Party members oppose it.
There is also a gap on this issue between Americans who most trust Fox News and Americans who most trust any other media outlet. Only slightly more than 4-in-10 (43%) Americans who most trust Fox News favor a minimum wage increase, compared to around 8-in-10 Americans who most trust CNN and MSNBC (80% and 82% respectively) and three out of four Americans who most trust broadcast news and public television (78% and 73% respectively).
Majorities of all races and major religious groups support increasing the minimum wage. More than 8-in-10 black and Hispanic Americans favor increasing the minimum wage (83% and 85%, respectively), compared to 62% of white Americans. Nearly 9-in-10 (87%) black Protestants support increasing the minimum wage, as do 73% of Catholics. White evangelical Protestants and white mainline Protestants are also supportive, but somewhat less so: just over 6-in-10 (61%) of both groups favor the increase.
Impact of the Health Care Reform Law
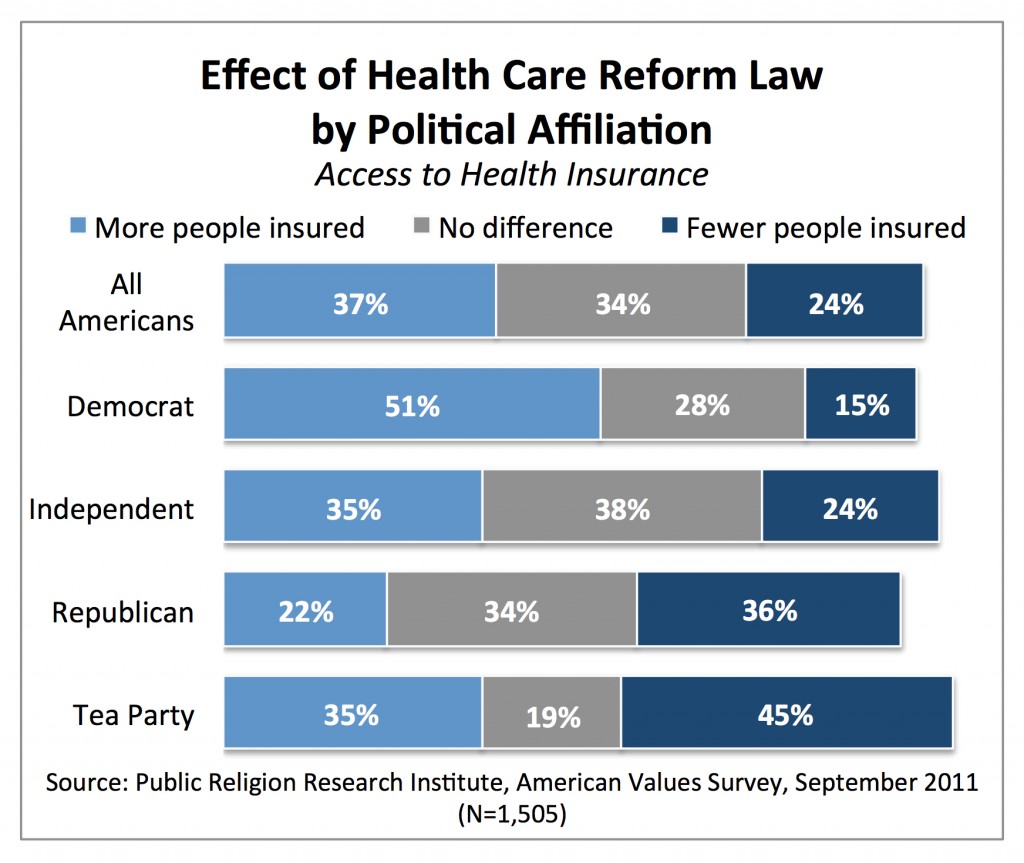 The general public has mixed views about what effect the health care reform law passed last year will have on most Americans. Significantly more Americans believe that it will result in more people having health insurance (37%) than believe that it will result in fewer people having coverage (24%). Roughly one-third (34%) say it will have no impact on the number of people covered by health insurance. However, Americans are also more likely to believe it will make health insurance less affordable (39%) than more affordable (25%). Three-in-ten say the law will not have any effect on the cost of health care.
Americans are strongly polarized. A majority (51%) of Democrats believe the law will result in more people being insured, compared to more than one-third (35%) of Independents and 22% of Republicans. Only 15% of Democrats believe that the law will lead to fewer people being insured, while about 1-in-4 (24%) Independents and 36% of Republicans believe the law will lead this to happen.
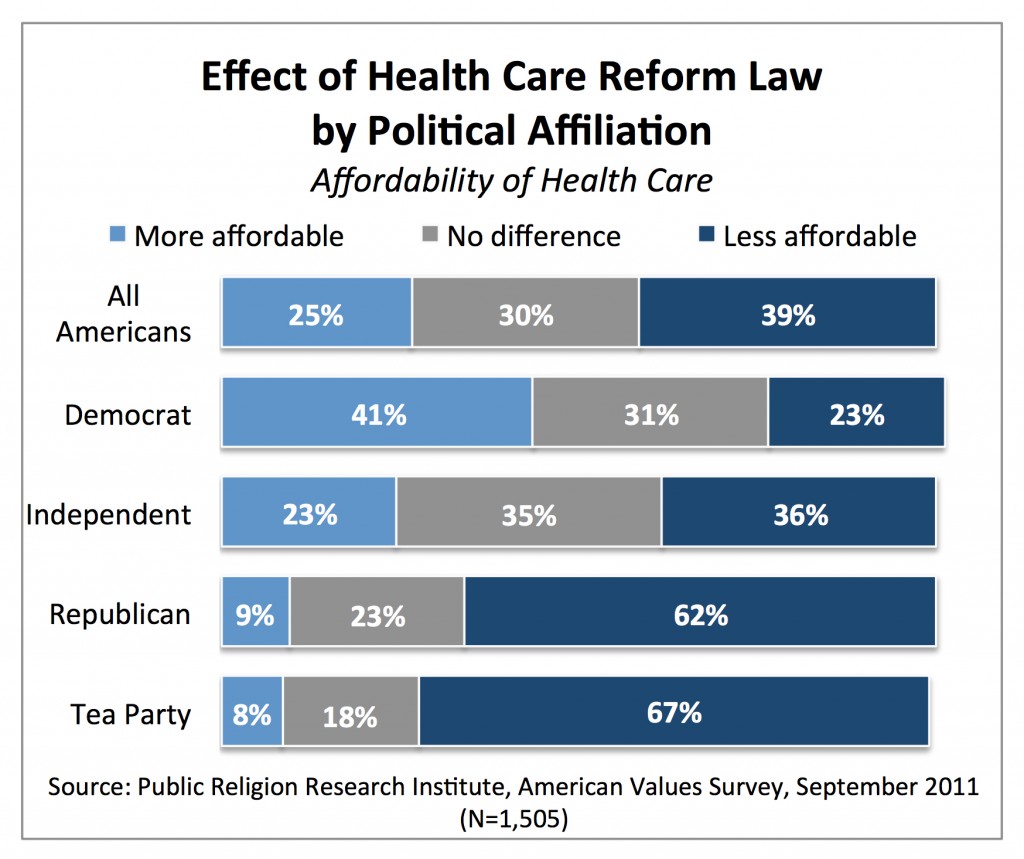 More than 4-in-10 (41%) Democrats say that the health care reform law will make health care generally more affordable compared to less than one-quarter (23%) of Independents and less than 1-in-10 (9%) Republicans. Roughly 1-in-4 (23%) Democrats believe that the law will make health care less affordable, compared to 36% of Independents and 62% of Republicans.
There are noticeable generational divides on this issue as well. Nearly half (45%) of Millennials believe that the law will result in more people being insured, 4-in-10 (38%) say it will make no difference, and only 13% say it will result in fewer people being insured. Seniors are evenly divided, with only 28% saying the law will increase health care coverage among the public, 30% saying the law will make no difference, and 31% saying it will result in fewer people being covered.
Endnotes
1 The List Experiment was originally devised by Paul Sniderman and Edward Carmines in Reaching Beyond Race (Cambridge, MA: Harvard University Press, 1997) to test whether American support for affirmative action policies was overstated.
2 The original survey did not include a measure for Herman Cain, who at the time was polling nationally in the low single digits. The follow-up survey included measures of Cain, Perry and Romney, who at the time were polling significantly better than the rest of the field in national surveys.
3 This question included only Romney, Perry, Bachmann, Paul, and Huntsman.
4 Jon Huntsman was excluded from this analysis because fewer than 100 Republican voters reported being familiar with him.
5 Telephone usage refers to whether respondents have only a landline telephone, only a cell phone or both types and the frequency with which they use each type.
Recommended citation:
Jones, Robert P., and Daniel Cox. “The 2011 American Values Survey: The Mormon Question, Economic Inequality, and the 2012 Presidential Campaign.” PRRI. 2011. http://www.prri.org/research/2011-american-values-survey/.
