Executive Summary
In partnership with E Pluribus Unum, PRRI released a major national survey in 2022 examining American attitudes about the legacy of Confederate monuments and memorialization in public spaces. In 2024, PRRI interviewed more than 5,500 adults across the United States to revisit Americans’ attitudes on these topics two years later.
Americans are divided over support for preserving the legacy of the Confederacy and the issue is highly polarized by party and race, particularly in the South.
- A slim majority of Americans (52%) support efforts to preserve the legacy and the history of the Confederacy, while 44% oppose such efforts.
- Eight in ten Republicans (81%), compared with 30% of Democrats, support efforts to preserve the legacy of the “Lost Cause.”
- Independents have become slightly more likely to support efforts to preserve the legacy of the Confederacy now (52%), compared with 2022 (46%).
- Black Americans (25%) are the only racial group without majority support for efforts to preserve the legacy and history of the Confederacy, compared with 58% of white Americans, 55% of multiracial Americans, and 54% of Hispanic Americans.
- Americans from Southern states (58%) are more likely than Americans elsewhere (50%) to support efforts to preserve the legacy of the Confederacy.
- Gen Z (41%) is the only generation without majority support for preserving the legacy of the Confederacy, compared with two-thirds of the Silent Generation (62%), 58% of Gen X, 56% of baby boomers, and 51% of millennials.
Similar to the results of our 2022 survey, Americans remain divided over what to do with ‘Lost Cause’ memorials.
- One-quarter of Americans (26%) say that Confederate monuments should be left in place as-is while a plurality (35%) say they should remain in place but with added information on the history of slavery and racism. Around three in ten Americans (28%) say that monuments should be removed from public spaces and put in museums, and 9% say they should be destroyed.
- Republicans (40%) and independents (38%) are about 10 percentage points more likely than Democrats (28%) to support leaving memorials and statues in place with added historical context.
- Under half of Democrats (46%) support moving the monuments to museums, compared with 28% of independents and one in ten Republicans (10%). Just 1% of Republicans say monuments should be removed and destroyed, compared with 7% of independents and 17% of Democrats.
- Nearly half of Republicans (47%) support leaving the monuments as they are, compared with one-quarter of independents (25%) and 8% of Democrats.
- Black Americans remain most supportive of removing Confederate memorials: 25% say they should be removed and destroyed and around four in ten (39%) say they should be placed in a museum. One-quarter of Black Americans say Confederate memorials should remain in place with added context (23%), and less than one in ten (9%) say they should remain in place as they are.
- Few white Americans (6%) say Confederate memorials should be removed and destroyed, though roughly one in four say they should be removed and placed in a museum (24%). White Americans are far more likely to say they should remain in place with added context (38%) or remain in place as they are (30%).
Americans are more likely to support various efforts to better understand and repair the damage of past discrimination, but specific policy actions are less popular.
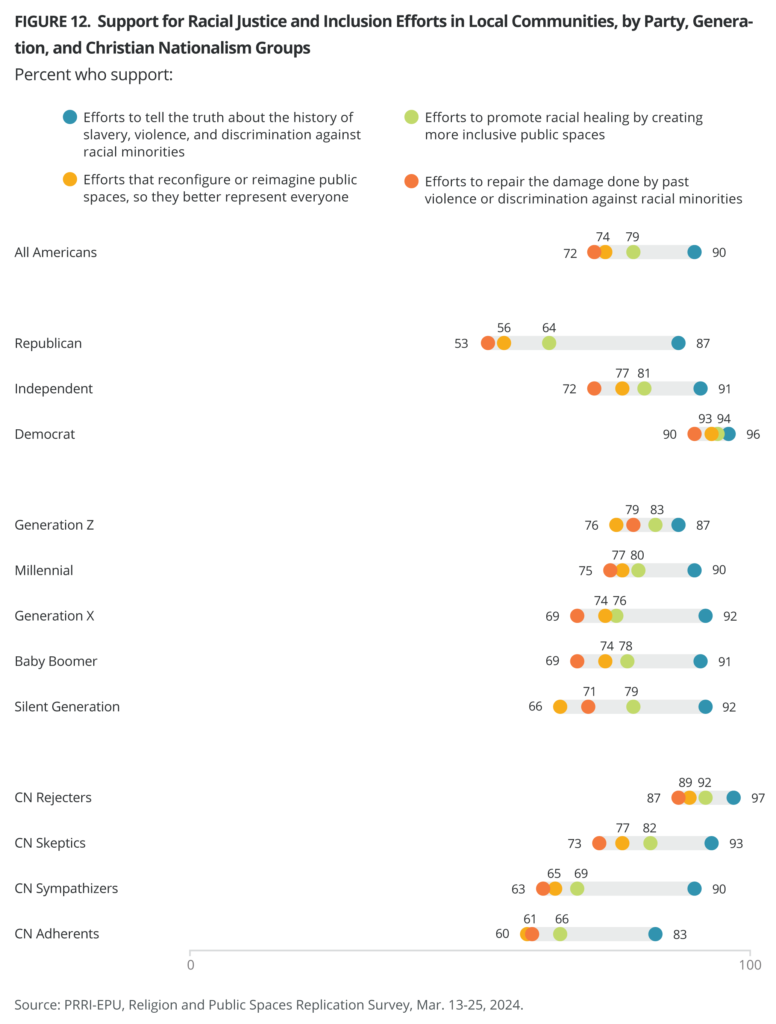
- More than seven in ten Americans support various efforts to tell the truth about slavery and discrimination (90%), create more inclusive public spaces (79%), recreate or reimagine public spaces to better represent everyone (74%), or repair past damage done by violence or discrimination (72%).
- Americans are less likely to support renaming public schools named after historical figures who support slavery and discrimination (50%) or changing school mascots that use Native American names or images without permission (49%).
- Gen Zers (58% and 54%) and millennials (54% and 56%) are the only generations with majority support for efforts to rename public schools or change mascots with racist connotations.
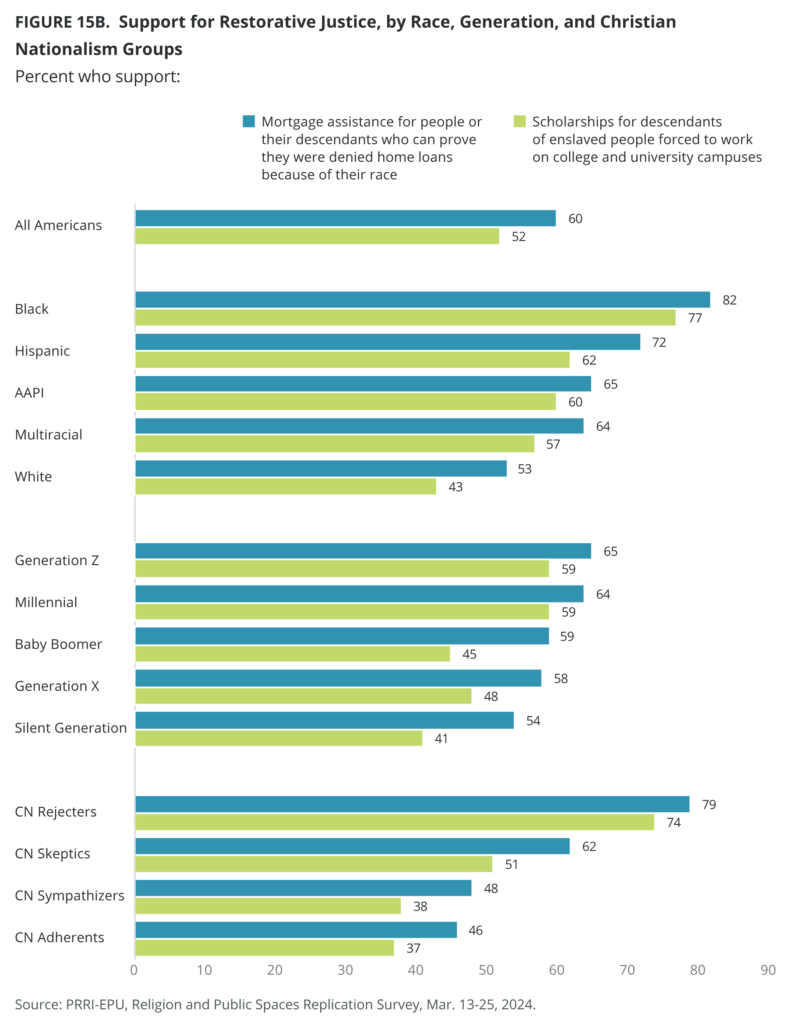
- Six in ten Americans (60%) favor the idea of local governments providing mortgage assistance for people or descendants of people who can prove they were denied home loans because of their race, while a slim majority of Americans (52%) favor colleges and universities providing scholarships for descendants of enslaved people who were forced to construct buildings and work on their campuses.
Americans are divided over what they want to see in future memorials.
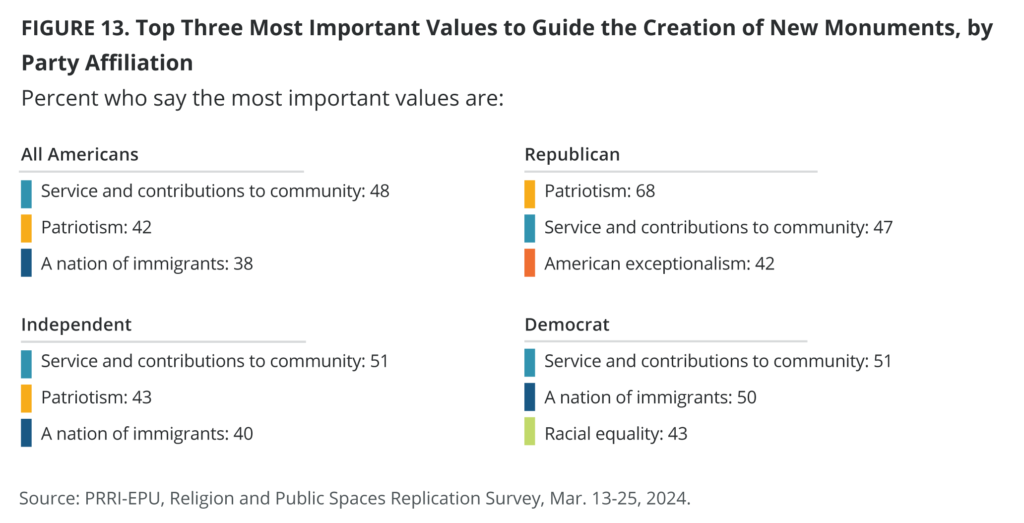
- When asked to pick their top three of 12 potential values that they believe would be the most important in guiding the creation of new monuments and art in public spaces, Americans are most likely to choose service and contributions to the community (48%), patriotism (42%), and the idea of a nation of immigrants (38%).
- Among Republicans, 68% selected patriotism as a top value and 47% selected service and contributions to the community. Among Democrats, the most popular value selected was service and contributions to the community (51%), followed by the idea of a nation of immigrants (50%), racial equality (43%) and racial diversity (41%). Among independents, 51% selected service and contributions to the community, followed by 43% who selected patriotism and 40% who selected the idea of a nation of immigrants.
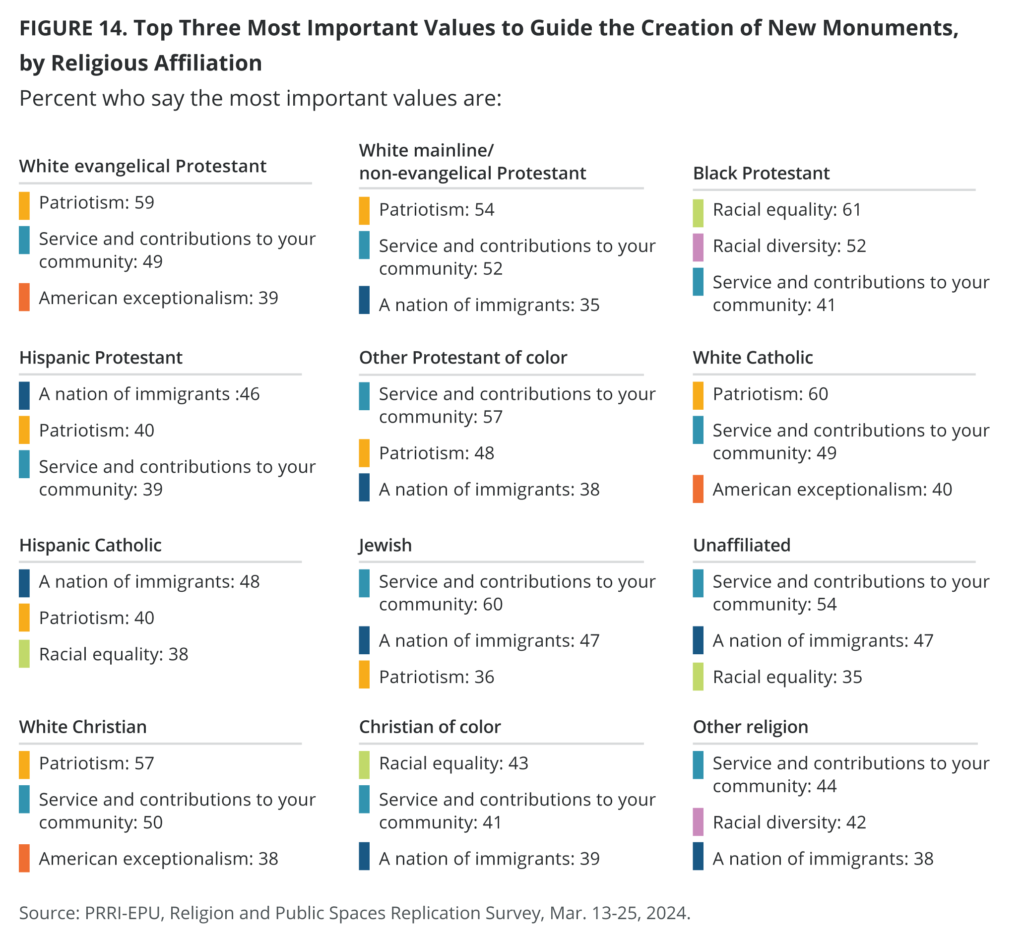
- Overall, white Christians more often selected patriotism as a top value, compared with other groups; Black Protestants most often selected racial equality (61%) and racial diversity (52%) as top values.
Attitudes toward structural racism and support for Christian nationalism are inextricably linked to views on Confederate memorials.
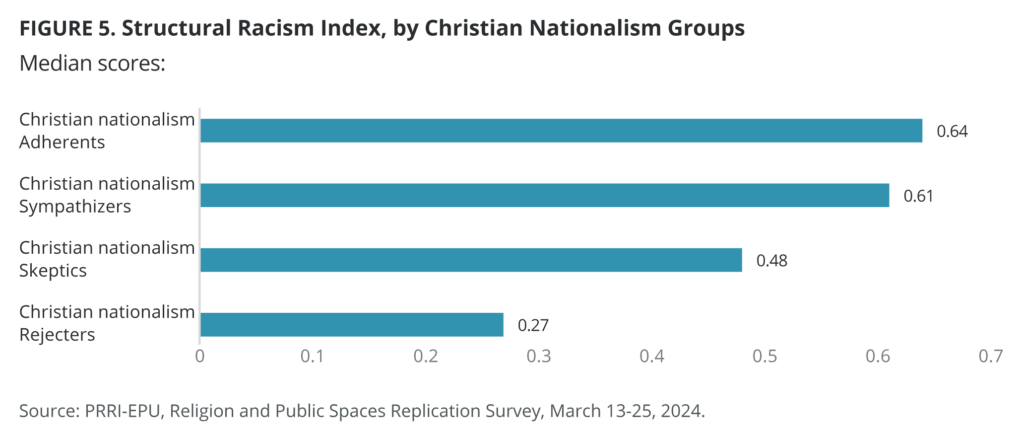
- PRRI used a battery of questions to create a “Structural Racism Index” to measure American’s views of racial minorities, particularly Black Americans. The index combines answers to these questions and rescales the scores to values from 0 (low) to 1 (high). Among all Americans, the median value is 0.47, near the center of the index.
- Additionally, PRRI used a battery of questions to develop four groups to assess Americans’ support for Christian nationalism: Adherents, who score highest on the Christian nationalism scale, followed by Sympathizers, Skeptics, and Rejecters.
- Attitudes toward Christian nationalism and structural racism index scores are closely correlated: Christian nationalism Adherents (0.64) and Sympathizers (0.61) score much higher on the structural racism index than Skeptics (0.48) or Rejecters (0.27).
- Three-quarters of Christian nationalism Adherents (77%) and Sympathizers (74%) support efforts to preserve the Confederacy in public spaces, compared with a slim majority of Christian nationalism Skeptics (55%), and just 27% of Christian nationalism Rejecters.
Introduction
In partnership with E Pluribus Unum, PRRI released a major national survey in 2022 that examined the role of race and racism in affecting American attitudes about the legacy of Confederate monuments and memorializing public spaces. Two years later, PRRI interviewed more than 5,500 adults across the United States to revisit how ongoing debates about Confederate statues and memorials in public spaces continue to shape American attitudes. In addition to revisiting how race, party, religion, education, and Southern residency impact American attitudes on these measures, this study breaks new ground by also considering the influence of generation and Christian nationalism on shaping such attitudes.
Structural Racism in America
In order to measure Americans’ views on race and structural racism, PRRI used a battery of 11 questions to create the “Structural Racism Index,” first developed for the EPU/PRRI Survey, which was based on data collected in June 2022 and released in the September 2022 survey report. (See Appendix A for full methodology). Americans’ attitudes about structural racism in 2024 remain largely similar to their views in 2022.
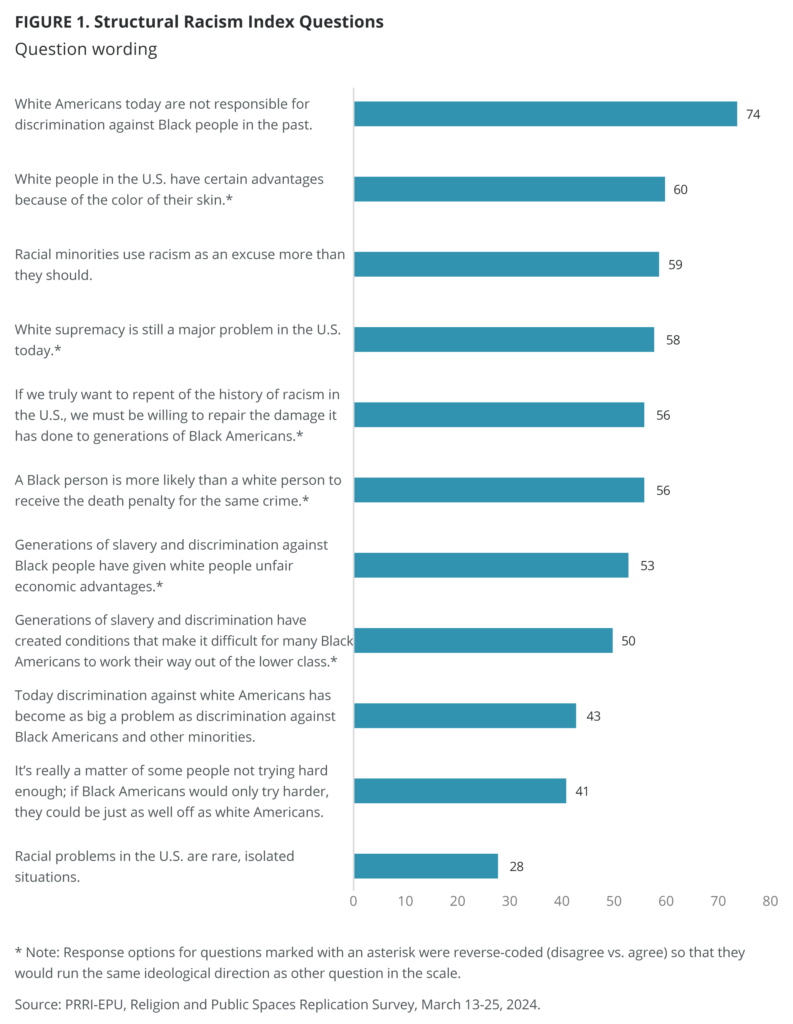
As in 2022, our structural racism index combines answers to these questions and rescales the scores to values from 0 (low) to 1 (high).[1] In 2024, among all Americans, the median value on the structural racism index is 0.47, near the center of the scale. This is a statistically similar score to all Americans in 2022 (0.45).
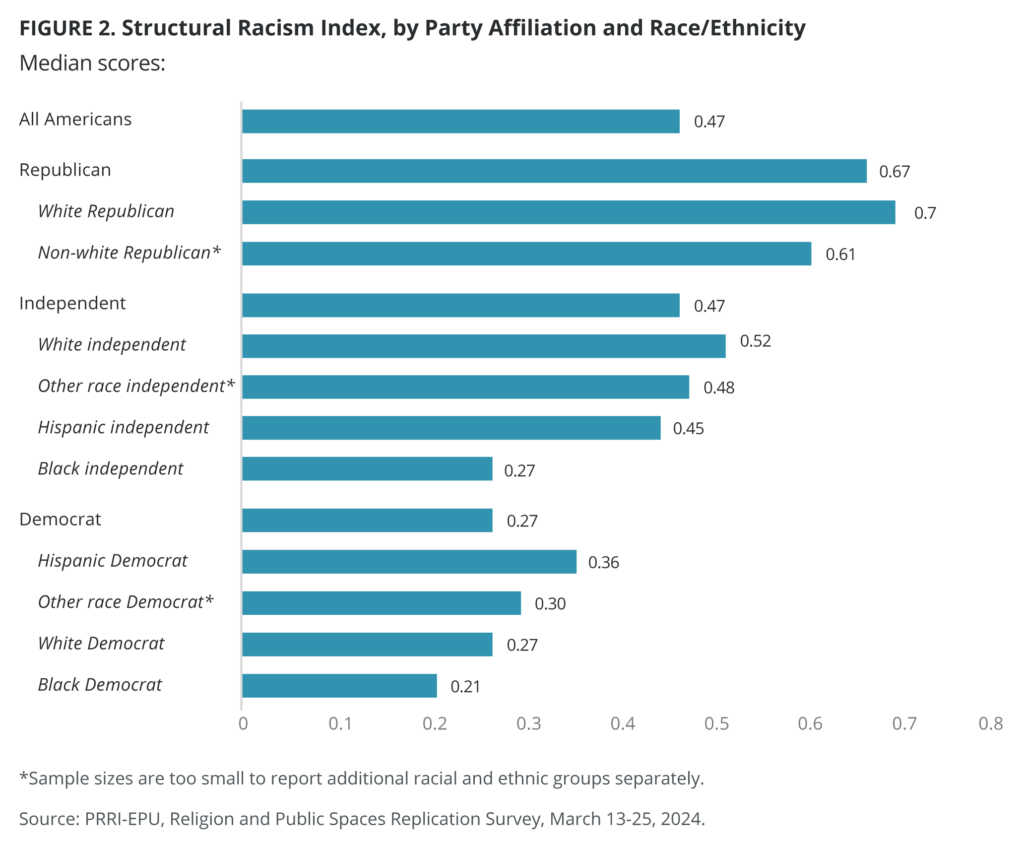
The median score on the structural racism index for Republicans is 0.67, compared with 0.47 for independents and 0.27 for Democrats. By race, white Republicans score 0.70 and non-white Republicans score 0.61, the highest among all groups. Among independents, whites (0.52) are about twice as likely as Black independents (0.27) to score high on the structural racism index. Whites also score higher than Hispanic independents (0.45), but do not differ much from other race independents (0.48). Though Democrats overall score the lowest on the structural racism index, among this group, Hispanic Democrats score higher (0.36) than other race Democrats (0.30), white Democrats (0.27), and Black Democrats (0.21). Except for other race independents, who have grown more likely to score high on the structural racism index (0.48 in 2024 vs. 0.36 in 2022), these scores have changed little since 2022.
White Americans score highest on the structural racism index, with a median score of 0.55. Hispanic Americans, Asian Americans and Pacific Islanders (AAPI), and multiracial Americans all have a median score of 0.42. Black Americans have the lowest median score, at 0.24. Only multiracial Americans differ notably from 2022, when their score was statistically lower (0.30).
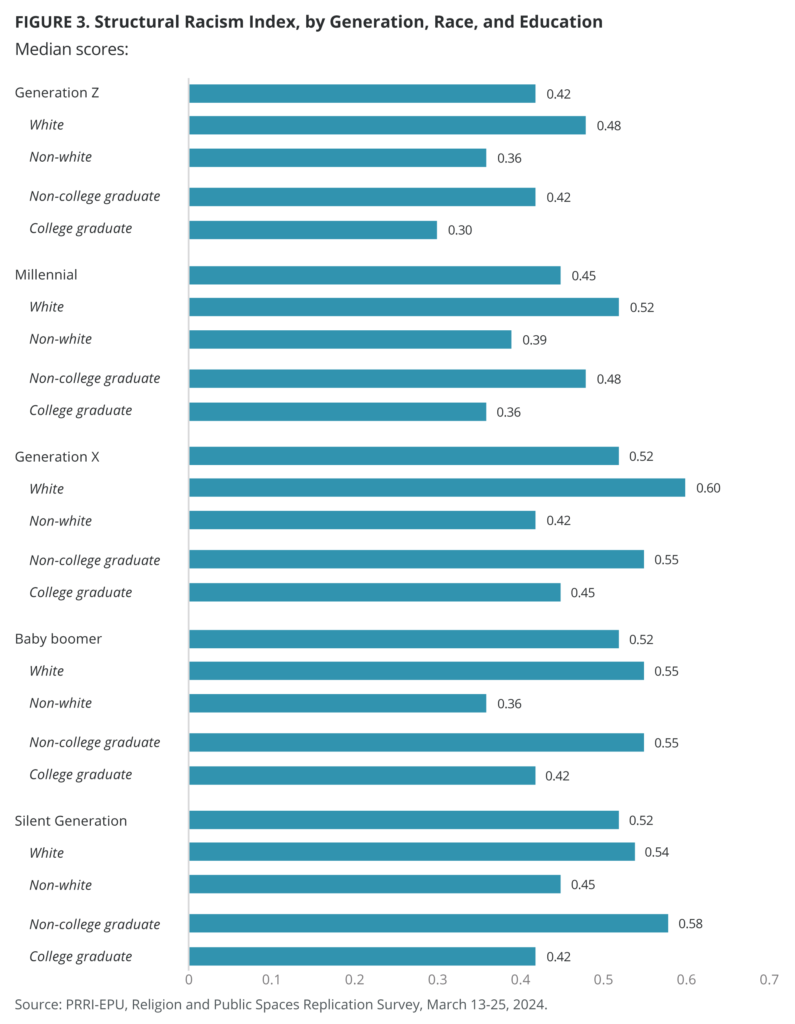
White Americans are divided by education, with a median score of 0.61 among those who do not have a four-year college degree and 0.42 among those who have a four-year degree or higher. These differences by education are less pronounced among Black Americans (0.27 without a four-year degree and 0.18 with a four-year college degree) and Hispanic Americans (0.42 without a four-year college degree and 0.36 with a four-year college degree).
Generation Z (0.42) and millennials (0.45) have a lower median score on the structural racism index, compared with Generation X (0.52), baby boomers (0.52), and the Silent Generation (0.52). Across all generations, white Americans score higher on the index than non-white Americans as do those without a four-year college education, compared with those with a four-year degree or higher.
Gen Xers (0.55 vs. 0.48), baby boomers (0.52 vs. 0.48), and members of the Silent Generation (0.58 vs. 0.48) in the South score higher on the structural racism index than those in the rest of the country, while there are no differences among Gen Zers and millennials.
Predominantly white religious groups score highest on the structural racism scale. White evangelical Protestants have the highest median score, at 0.67, while white Catholics have a median score of 0.58 and white mainline/non-evangelical Protestants have a median score of 0.55.
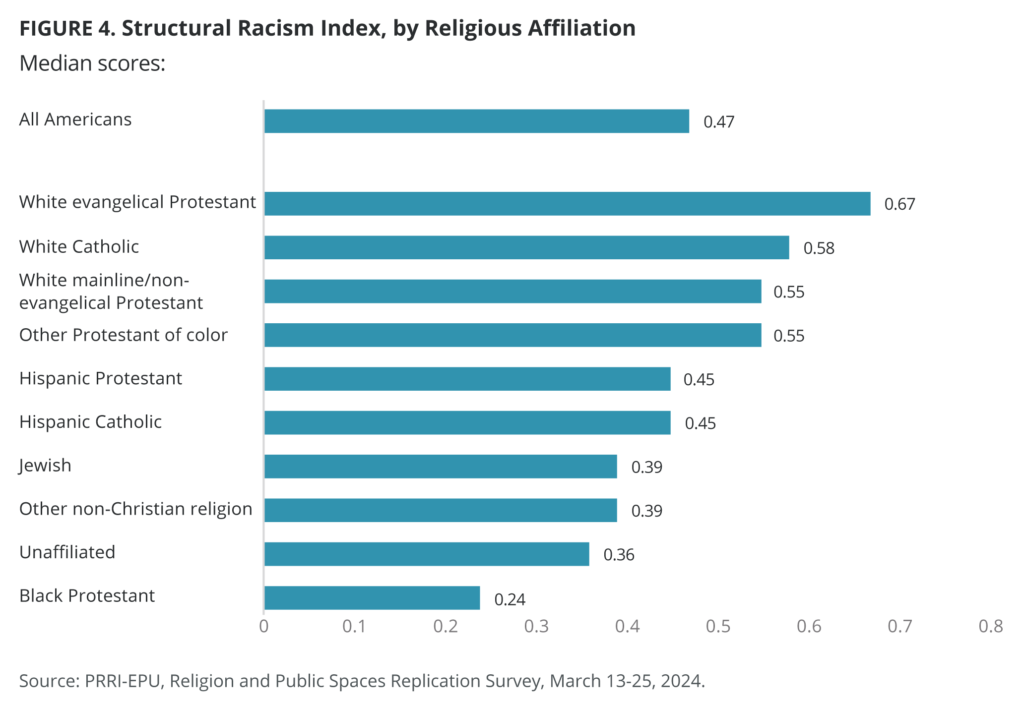
Other Protestants of color score at 0.55, higher than the national median of 0.47, while Hispanic Protestants (0.45) and Hispanic Catholics (0.45) score closer to the national median.[2] Religiously unaffiliated (0.36), Jewish Americans (0.39), and other non-Christian religious Americans (0.39) fall below the national median, and Black Protestants score the lowest at 0.24.
Structural Racism and Christian Nationalism
There is a strong correlation between Christian nationalism and beliefs that contribute to structural racism. Using PRRI’s Christian nationalism scale, which sorts respondents into four types depending on their responses to a battery of five questions gauging different tenets of Christian nationalism, PRRI finds that Christian nationalism Adherents (0.64) and Sympathizers (0.61) score significantly higher on the structural racism index than Skeptics (0.48) and Rejecters (0.27).[3]
The ‘Lost Cause’ and Confederate Memorials
Awareness of ‘Lost Cause’ Symbols and Confederate Monuments
Confederate Flag Displays
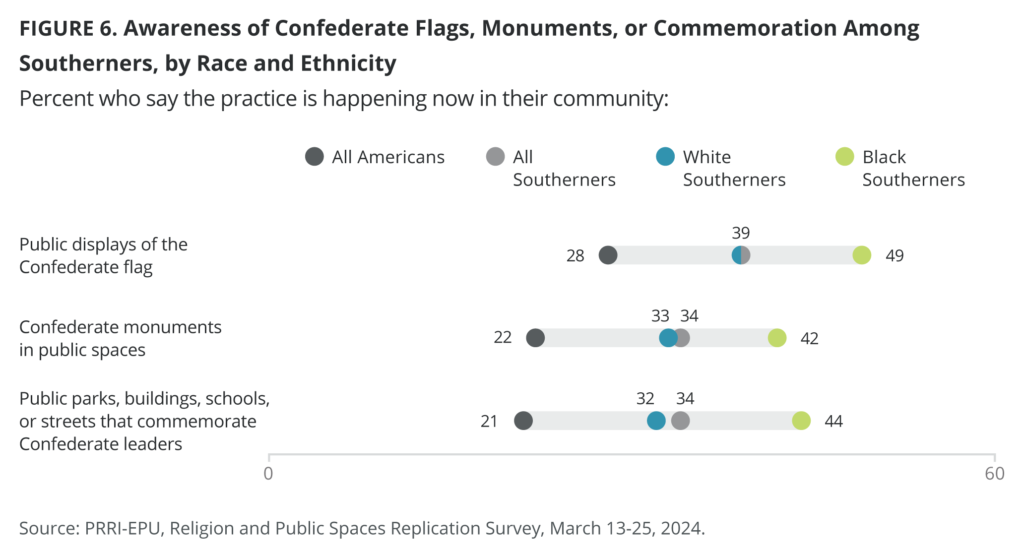
As in 2022, about three in ten Americans (28%) say they are aware of public displays of the Confederate flag in their community right now. Similarly, 27% say there were displays of Confederate flags in their community in the past, but not anymore. About four in ten Americans (42%) say there have never been displays of Confederate flags in their community. Unsurprisingly, residents of Southern states are about twice as likely than the rest of the country to report that there are current displays of the Confederate flag in their community (39% vs. 21%).
Republicans (22%) are notably less likely than Democrats (31%) and independents (30%) to say they are aware of current displays of the Confederate flag in their community. Republicans (31%) are also slightly more likely than independents (26%) and Democrats (24%) to say these displays existed in the past, but not anymore. A plurality of partisans say Confederate flag displays never existed in their community, including 44% of Republicans, 42% of Democrats, and 41% of independents. Even in the South, Republican Southerners are significantly less likely than Democrat Southerners to say they are aware of current Confederate flag displays in their community (31% vs. 45%).
Black Americans (41%) are more likely than white Americans (26%), Hispanic Americans (25%), and AAPI (19%) to say they are aware of public displays of Confederate flags in their community right now, but do not differ from multiracial Americans (32%). This pattern holds among Southerners: Black Southerners are notably more likely than white Southerners to say they are aware of current Confederate flag displays in their community (49% vs. 39%).
Confederate Monuments
There is little change in 2024, compared with 2022, regarding Americans’ awareness of Confederate monuments. About one in five Americans (22%) say they are aware of Confederate monuments in public spaces in their community right now, while 24% say there were such monuments in the past, but not anymore, and about half (49%) say these monuments have never existed in their community. Southerners (34%) are significantly more likely to report that they are aware of these monuments currently existing in their community, compared with the rest of the U.S. (14%).
There are no partisan differences in awareness of Confederate monuments in local communities nationally. In the South, however, Southern Democrats are more likely than Southern Republicans to say that Confederate monuments are currently present in their communities (37% vs. 30%). Compared with 2022, independents are more likely to say that monuments do not exist anymore (24% vs. 19%) and less likely to say they never existed (49% vs 56%). There are no significant shifts among Republicans and Democrats since 2022.
Black Americans (37%) are significantly more likely than Hispanic Americans (23%), multiracial Americans (22%), white Americans (19%) and AAPI (12%) to say that there are currently Confederate monuments in their community. In the South, Black Southerners are also nearly 10 percentage points more likely than white Southerners to report being aware of such monuments (42% vs. 33%).
Public Places Named for Confederate Leaders
About one in five Americans (21%) say they are aware of buildings, parks, schools, or streets that commemorate Confederate leaders in their community right now. One-quarter say these memorials used to exist but don’t anymore (26%) and about half say they have never existed in their community (48%), which are both slight significant increases from 2022 (22% and 51%, respectively). In the South, over one-third say these commemorations currently exist in their community (34%) or that they used to exist but don’t anymore (35%) and 26% say they never existed.
There are only small party differences in awareness of places named for Confederate leaders in local communities right now, that memorials used to exist but don’t anymore, or that they never existed in their community. Independents are the only group that has notably decreased in saying that places commemorating Confederate leaders never existed in their community, dropping by 6 percentage points, from 55% in 2022 to 49% in 2024. In the South, Southern Democrats (39%) and independents (38%) are significantly more likely than Southern Republicans (29%) to say that these memorials exist currently in their community.
Black Americans (34%) are more likely than multiracial Americans (27%), Hispanic Americans (24%), white Americans (19%), and AAPI (13%) to report that there are currently public spaces named for Confederate leaders in their community. This pattern continues in the South: Black Southerners are notably more likely than white Southerners to report awareness of these memorials in their community (44% vs. 32%).
Awareness of Discriminatory and Racist Practices
Public School Segregation
Fewer than one in ten Americans (7%) say there are currently laws or practices that segregate public schools by race in their community. About half say there were such laws in the past, but not anymore (48%), and 41% say that there have never been these laws or practices in their community. In the South, 9% say these laws or practices currently exist, 61% say they existed in the past, and 27% say they never existed. While there are no differences between 2022 and 2024 in the number of people who report current existence of these laws or practices, people are now more likely to acknowledge that these laws used to exist than they were in 2022, both in the U.S. as a whole (43% in 2022 and 48% in 2024) and specifically in the South (51% in 2022 and 61% in 2024).
Democrats (12%) are slightly more likely than independents (7%) and Republicans (3%) to say they are aware of current laws or practices that segregate public schools by race in their community. Democrats and independents (both 51%) are also slightly more likely than Republicans (45%) to say that these laws or practices existed in the past but do not anymore. On the other hand, Republicans (50%) are more likely than independents (39%) and Democrats (34%) to say that these laws or practices never existed in their community.
This pattern holds true in the South: Southern Democrats (15% and 63%) are more likely than Southern Republicans (3% and 59%) to say these laws or practices currently exist or that they existed in the past. Southern Democrats (57% in 2022 and 63% in 2024) and Southern Republicans (52% in 2022 and 59% in 2024) are more likely to say today these laws used to exist than they were two years ago.
About two in ten Black Americans (21%), 11% of Hispanic Americans, 8% of AAPI, and 4% of white Americans say there are currently laws or practices in their community that segregate public schools by race.[4]
Housing Segregation
As in 2022, about one in ten Americans (9%) say that there are currently laws or practices in their community that prevent people of color from living in areas of the city designed for white people, while 44% say these practices existed in the past, but not anymore, and another 44% say they have never heard of this happening in their community. Similar numbers of people in the South (10%) and the rest of the country (8%) say these laws exist now, but residents of the South (51%) are significantly more likely than the rest of the country (40%) to say that these laws used to exist.
Roughly one in ten Democrats (12%) and independents (9%) and just 3% of Republicans say they are aware of current laws or practices that segregate housing by race in their community. A majority of Democrats (55%) and four in ten independents (42%) and Republicans (40%) say these laws used to exist but don’t anymore. Conversely, a majority of Republicans (55%), nearly half of independents (47%), and 30% of Democrats say that these practices never existed in their community.
Southern Republicans (51%) are significantly more likely than Republicans in the rest of the country (32%) to say that these laws used to exist in their community. Democrats and Republicans in the South are now more likely to say these practices used to exist (55% and 40%, respectively) than they were in 2022 (46% and 32%).
Black Americans (24%) are more than twice as likely as Hispanic Americans (11%) and multiracial Americans (11%), and nearly five times as likely as white Americans (5%) to report that there are currently laws or practices that prevent people of color from living in certain areas of the city where they reside.[5]
Church Segregation
Attitudes regarding the racial segregation of churches have changed little since 2022. Six percent of Americans say that there are currently laws or practices in their community that prevent people of color from attending white churches or joining as congregation members, while 36% say these laws used to exist but don’t anymore, and 54% say these laws never existed. Similar shares of people in the South (8%) and the rest of the country (5%) say these laws and practices currently exist, but residents of the South (42%) are notably more likely than the rest of the country (31%) to say that these practices used to exist.
Fewer than one in ten Democrats (9%), independents (6%), and Republicans (3%) say there are laws or practices prohibiting people of color from attending white churches or joining as members, compared with 42% of Democrats, one-third of independents (35%), and three in ten Republicans (30%) who say these laws used to exist but don’t anymore. Additionally, the majority of Republicans (65%) and independents (56%) and 46% of Democrats say these practices never existed.
Southern Democrats (12% and 50%, respectively) are more likely than Southern Republicans (3% and 39%, respectively) to say that these laws currently exist or that they existed in the past. Southern Republicans (56%), on the other hand, are significantly more likely than Southern Democrats (34%) to say that these practices never existed in their community.
Black Americans (17%) are more likely than multiracial Americans (11%), Hispanic Americans (9%), white Americans (3%), and AAPI (2%) to say that there are currently laws or practices in their community that prevent people of color from attending or joining white churches. White (41%) and Black (49%) Southerners are more likely than white (30%) and Black (38%) Americans in the rest of the country to say that these practices used to exist.
Support for Preserving the Legacy of the Confederacy in Public
There is little change in support for preserving the legacy of the Confederacy through public memorials and statues since 2022. A slim majority of Americans (52%) support efforts to preserve the legacy and history of the Confederacy through public memorials and statues, compared with 44% who oppose such measures. Eight in ten Republicans (81%) support efforts to preserve the legacy of the Confederacy, as do 52% of independents (up from 46% in 2022). Democrats (30%) are by far the least likely to support these efforts. Americans from Southern states (58%) are more likely than Americans elsewhere (50%) to support efforts to preserve the legacy of the Confederacy.
Black Americans (25%) are the only racial group without majority support for efforts to preserve the legacy and history of the Confederacy. White (58%), multiracial (55%), and Hispanic Americans (54%) are all more than twice as likely as Black Americans to support such efforts.
White evangelical Protestants (77%) are the most likely to support efforts to memorialize the Confederacy in public spaces, followed by white mainline/non-evangelical Protestants (62%), white Catholics (61%), and Hispanic Catholics (61%). Less than half of members of other non-Christian religions (45%), religiously unaffiliated Americans (38%), and Black Protestants (27%) also support these efforts.
Majorities of most generations support efforts to preserve the legacy of the Confederacy in public spaces, including two-thirds of the Silent Generation (62%), 58% of Gen X, 56% of baby boomers, and 51% of millennials. The only generation without majority support for such efforts is Gen Z (41%).
Three-quarters of Christian nationalism Adherents (77%) and Sympathizers (74%) support efforts to preserve the Confederacy in public spaces, compared with a slim majority of Christian nationalism Skeptics (55%), and just 27% of Christian nationalism Rejecters. Nearly all white Christian nationalism Adherents (91%) support efforts to preserve the legacy of the Confederacy in public spaces.
Confederate Memorials and Consensus for Change
What Should Be Done with Confederate Memorials?
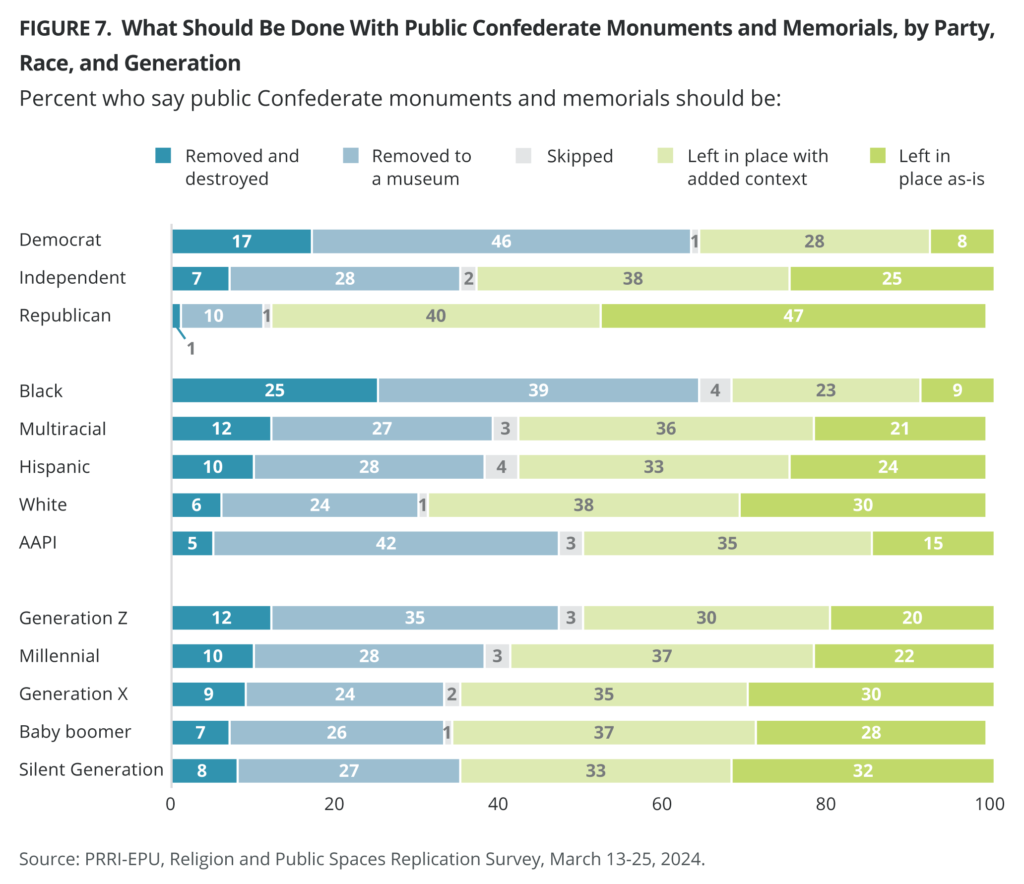
American attitudes on how to deal with Confederate memorials and monuments remain unchanged since 2022. Around one-quarter of Americans say they should be left in place as they are (26%), around one-third say they should be left in place and add information about the history of slavery and racism (35%), under three in ten Americans say Confederate memorials and monuments should be removed from public spaces and put in museums (28%), and 9% say they should be removed from public spaces and destroyed.
Just 1% of Republicans say monuments should be removed and destroyed, compared with 7% of independents and 17% of Democrats. Less than half of Democrats (46%) support moving the monuments to museums, compared with 28% of independents and 10% of Republicans. Republicans (40%) and independents (38%) are about 10 percentage points more likely than Democrats (28%) to support leaving memorials and statues in place with added historical context. Nearly half of Republicans (47%) support leaving the monuments as they are, compared with one-quarter of independents (25%) and 8% of Democrats.
As they were in 2022, Black Americans remain most supportive of removing Confederate memorials: 25% say they should be removed and destroyed and around four in ten say they should be placed in a museum (39%). One-quarter of Black Americans say Confederate memorials should remain in place with added context (23%), and less than one in ten say they should remain in place as they are (9%). Comparatively, three in ten white Americans say Confederate memorials should be removed (30%), including 6% who say these memorials should be removed and destroyed and 24% who say they should be placed in museums. Thirty-eight percent of white Americans say Confederate statues and memorials should remain in place with added context and 30% say the statues should remain in place as they are. These trends across race hold regardless of party affiliation.
There is a division among white Americans along education lines in their attitudes toward monuments. White Americans with at least a four-year college degree are about twice as likely as those without a degree to say monuments should be removed or destroyed (9% vs. 5%) or removed and placed in a museum (34% vs. 18%). In contrast, white Americans without a four-year college degree are slightly more likely than those with four-year degrees to support leaving monuments in place with added context (40% vs. 34%) or leaving them in place as they are (36% vs. 21%). Hispanic Americans with a four-year degree (43%) are more likely than those without a college education (24%) to say that Confederate statues and memorials should be removed and placed in a museum.[6]
While around just one in ten members of all generations support the removal and destruction of Confederate statues and memorials, Gen Zers (35%) are more likely than older generations to say that statues should be removed from public spaces and placed in a museum (28% of millennials, 27% of the Silent Generation, 26% of baby boomers, and 24% of Gen Xers). Around one-third of millennials (37%), baby boomers (37%), Gen Xers (35%), and the Silent Generation (33%), and 30% of Gen Zers say statues should be left in place with added context about slavery and racism. Except for Gen Xers (30%), agreement with the idea that Confederate statues and memorials should be left in place as they are decreases by generation: 32% of the Silent Generation, 28% of baby boomers, 22% of millennials, and 20% of Gen Zers.
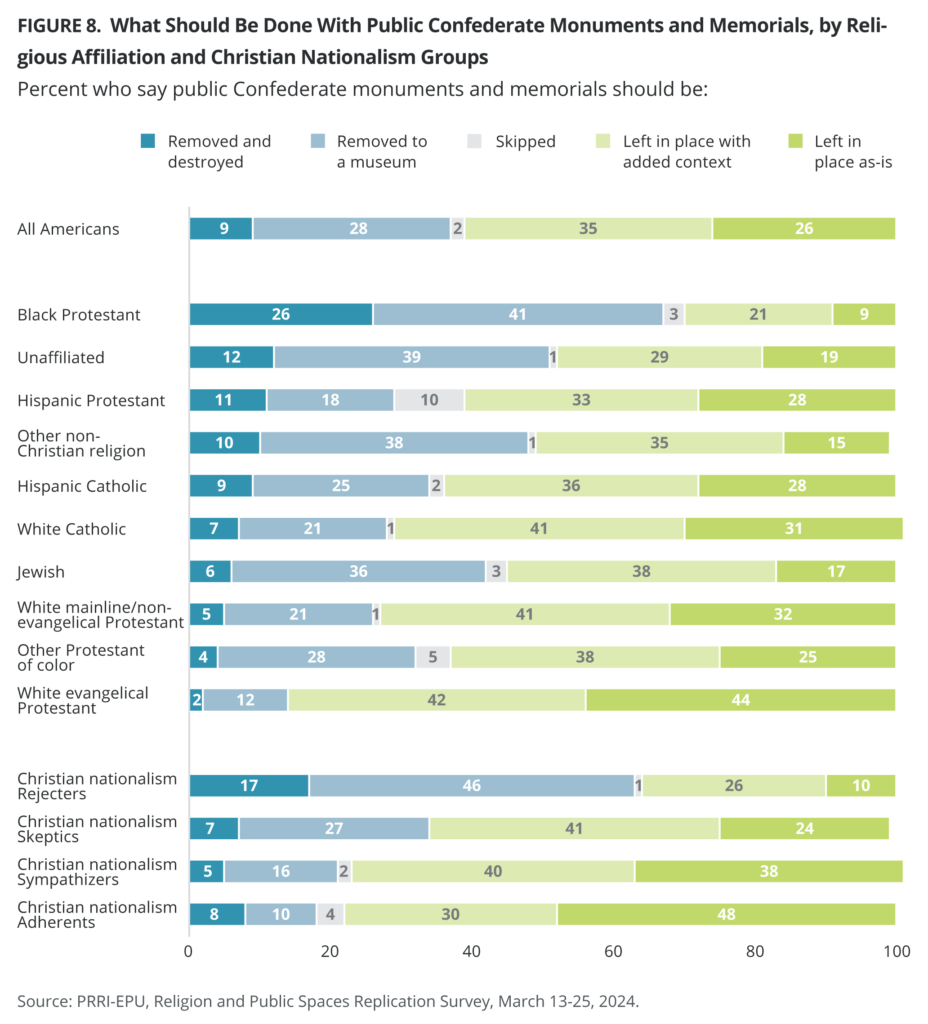
Around one in ten or fewer members of religious groups say Confederate statues or memorials should be removed and destroyed, including 12% of religiously unaffiliated Americans, 11% of Hispanic Protestants, 10% of other non-Christian religious Americans, 9% of Hispanic Catholics, 7% of white Catholics, and 6% of Jewish Americans. Just 5% of white mainline/non-evangelical Protestants, 4% of other Protestants of color, and 2% of white evangelical Protestants say the same. Black Protestants are the religious group most likely to want Confederate monuments removed and destroyed (26%).
About four in ten Black Protestants (41%), religiously unaffiliated Americans (39%), other non-Christian religious Americans (38%), and Jewish Americans (36%), along with about one-quarter of other Protestants of color (28%) and Hispanic Catholics (25%), favor moving Confederate monuments to museums. Two in ten white Catholics (21%) and Hispanic Protestants (18%) say the same. Only one in ten white evangelical Protestants (12%) support moving Confederate monuments to museums. Compared with 2022, there is little difference among religious groups on this question except for white mainline/non-evangelical Protestants, who are 5 percentage points less likely to support moving Confederate monuments to museums, from 26% in 2022 to 21% in 2024.
White Christian groups, including four in ten white evangelical Protestants (42%), white mainline/non-evangelical Protestants (41%), and white Catholics (41%), as well as Jewish Americans (38%) and other Protestants of color (38%), are the most likely to say monuments should remain in place with added context. Roughly one-third of other non-Christian religious Americans (35%) and Hispanic Protestants (33%), and nearly three in ten religiously unaffiliated Americans (29%) also share this opinion. Just one-fifth of Black Protestants (21%) say Confederate monuments should be left in place with added information about the history of slavery and racism.
White evangelical Protestants (44%) are the most likely to favor leaving monuments as they are now. In addition, 32% of white mainline/non-evangelical Protestants, 31% of white Catholics, 28% of both Hispanic Catholics and Hispanic Protestants, and 25% of other Protestants of color, along with about two in ten religiously unaffiliated Americans (19%), Jewish Americans (17%), and other non-Christian religious Americans (15%) also say the same. Just 9% of Black Protestants support leaving Confederate monuments in place as they are now.
Christian nationalism Rejecters (17%) are more likely to suggest that Confederate statues and memorials should be removed from public spaces and destroyed, compared with Adherents (8%), Skeptics (7%), and Sympathizers (5%). Nearly half of Christian nationalism Rejecters (46%) favor removing Confederate statues and memorials and putting them in museums. Around one-quarter of Christian nationalism Skeptics (27%), 16% of Sympathizers, and one in ten Adherents (10%) say the same. Similar percentages of Christian nationalism Skeptics (41%) and Sympathizers (40%) favor leaving in place Confederate statues and memorials with added information about the history of slavery and racism while around three in ten Adherents (30%) and Rejecters (26%) say the same. Nearly half of Christian nationalism Adherents (48%) say that Confederate statues should be left in place as they are. Around four in ten Sympathizers (38%), one-quarter of Skeptics (24%), and only one in ten Rejecters (10%) say the same.
Americans who support leaving Confederate monuments in place as they are have a much higher median score on the structural racism index (0.70) than those who say monuments should remain in place with added context (0.52), those who say monuments should be moved to a museum (0.30), or those who say monuments should be removed and destroyed (0.18).
Visions for the Future
Principles for Sharing Public Spaces
Support for Broadly Welcoming Spaces
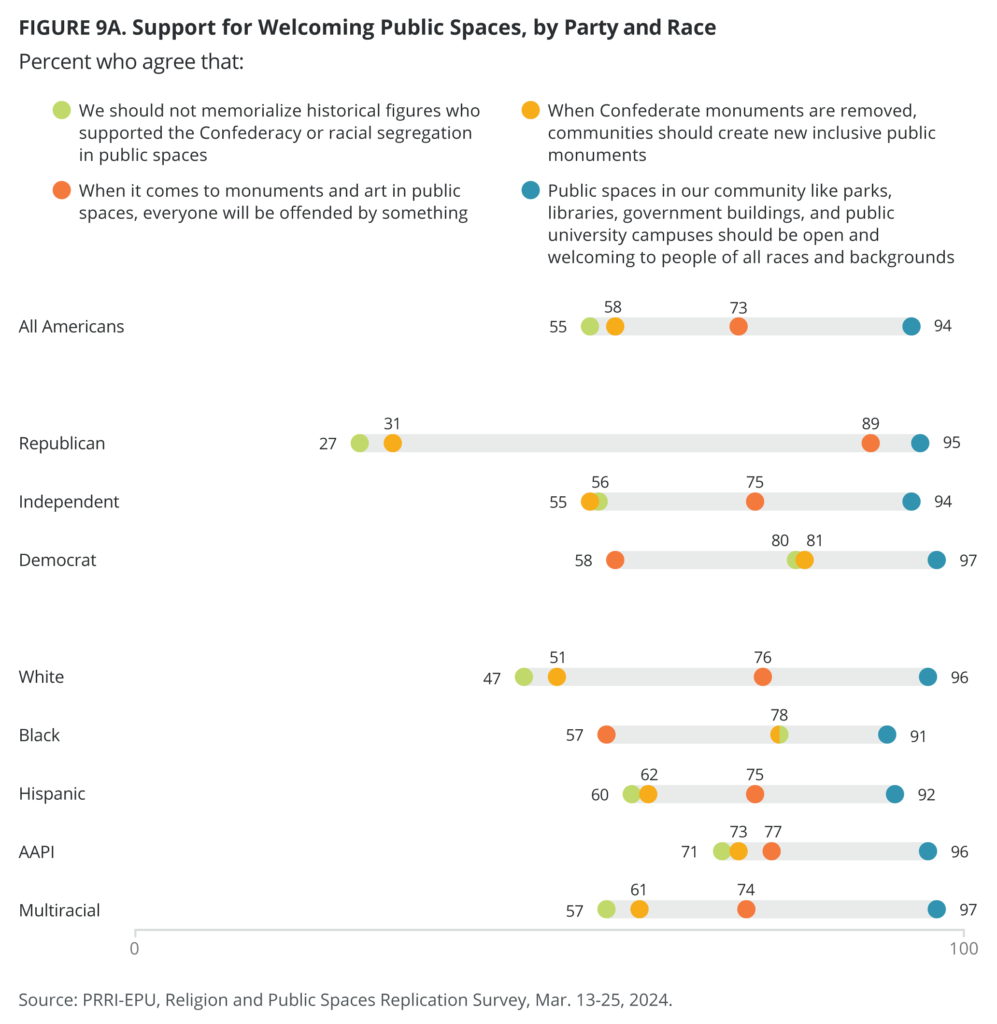
Almost all Americans (94%) agree with the statement “Public spaces in our community like parks, libraries, government buildings, and public university campuses should be open and welcoming to people of all races and backgrounds.” Similarly, in 2022, 96% of people agreed with this statement. Vast majorities of Americans across party, generation, religion, region, race, education, and by Christian nationalism group agree with this statement.
However, similar to 2022, views are more mixed when it comes to memorializing supporters of the Confederacy or racial segregation and deciding what to do after a Confederate monument is removed with respect to creating more inclusive public spaces.
Americans who agree that public spaces should be open and welcoming to people of all races and backgrounds have similar median scores on the structural racism index (0.45) than those who disagree (0.48).
Creating New Public Monuments
Americans are divided in their views on the statements “We should not memorialize historical figures who supported the Confederacy or racial segregation in public spaces” (55% agree and 43% disagree) and “When Confederate monuments are removed, communities should create new inclusive public monuments” (58% agree and 40% disagree). Democrats (80% and 81%, respectively) are more than twice as likely as Republicans (27% and 31%) to agree with these statements. Independents are more divided in their opinions on these statements (56% and 55% agree). There are no differences between Southerners and non-Southerners on these measures.
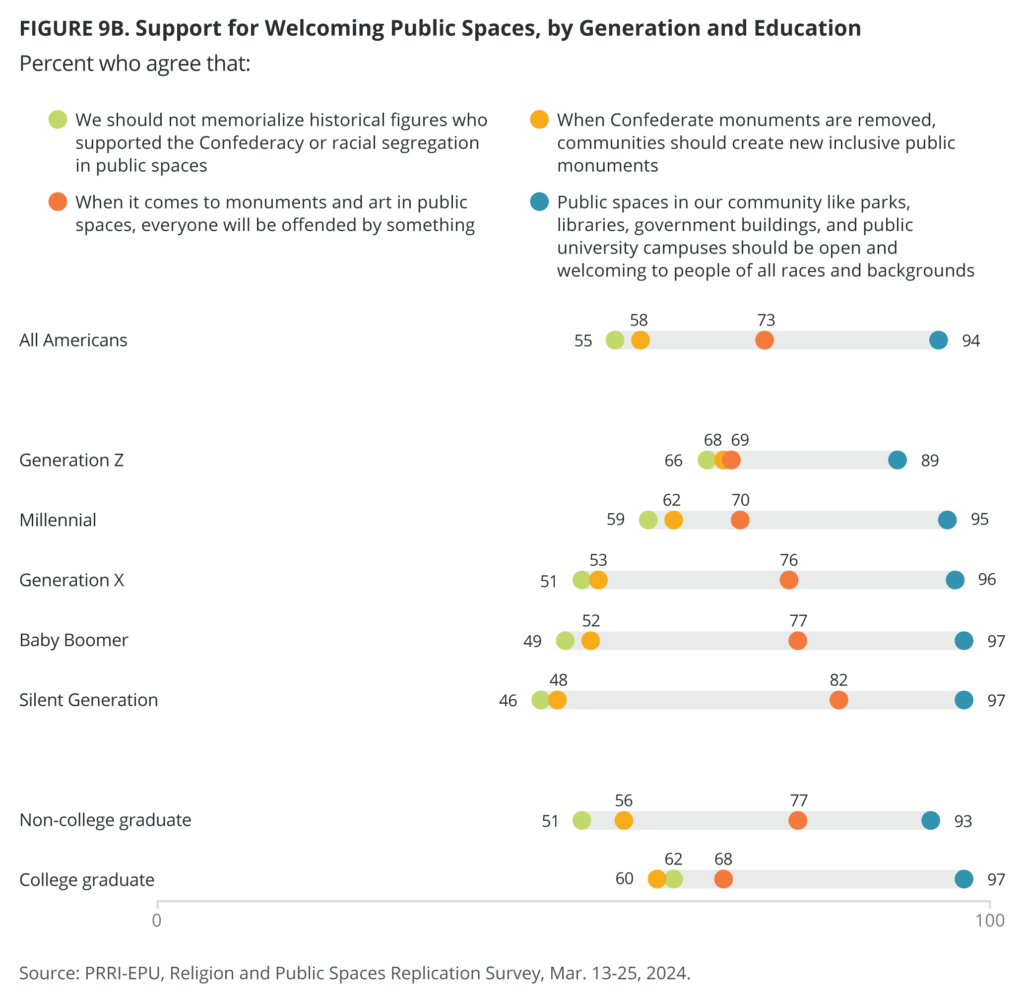
White Americans are the least likely to agree with both statements (47% and 51%), while Black Americans are the most likely to do so (both 78%). Majorities of AAPI (71% and 73%), Hispanic Americans (60% and 62%), and multiracial Americans (57% and 61%) also agree with these statements. White Americans with a four-year college degree (58% and 57%) are more likely to agree with both statements than white Americans without a four-year degree (41% and 47%). About half of those with a high school education or less (49% and 57%) and with some college education (53% and 54%) agree with these statements, while about six in ten of those with a college degree (60% and 59%) and a postgraduate degree (64% and 61%) agree.
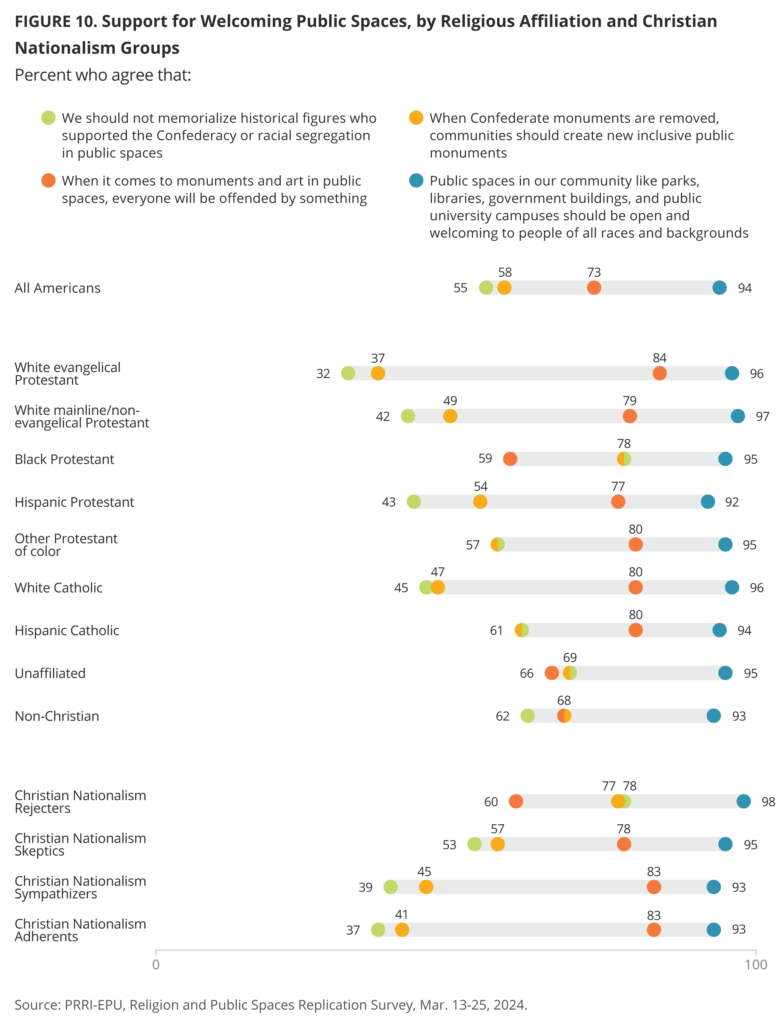
Except for white Christian groups and Hispanic Protestants, majorities of all other religious groups agree with both statements, including Black Protestants (both 78%), unaffiliated (both 69%), Jewish Americans (69% and 61%), other non-Christian groups (61% and 71%), Hispanic Catholics (both 61%), and other Protestants of color (both 57%). Hispanic Protestants are split (43% and 54%). Under half of white mainline/non-evangelical Protestants (42% and 49%), white Catholics (45% and 47%), and roughly one-third of white evangelical Protestants (32% and 37%) also agree with both statements. Majorities of Christian nationalism Rejecters (78% and 77%) and Skeptics (53% and 57%) agree with both statements, compared with around four in ten Christian nationalism Sympathizers (39% and 45%) and Adherents (37% and 41%) who agree with both statements.
Gen Zers are the most likely to agree with both statements (66% and 68%), followed closely by millennials (59% and 62%). Around half of Gen Xers (51% and 53%), baby boomers (49% and 52%), and the Silent Generation (46% and 48%) similarly agree with both statements.
Those who agree with the statements that we should not publicly memorialize historical figures who supported the Confederacy or segregation and that communities should create new inclusive public monuments when Confederate monuments are removed score much lower on the structural racism index (0.33 and 0.36) than those who disagree with the statements (0.64 and 0.67).
Signs of Fatigue and Cynicism: Everyone Will Be Offended by Something
There is little change in 2024 on this measure, compared with 2022. A majority of Americans (73%) agree with the statement “When it comes to monuments and art in public spaces, everyone will be offended by something,” compared with one-quarter who disagree (25%). About nine in ten Republicans (89%), 75% of independents, and 58% of Democrats also agree. There are no differences between Southern and non-Southern states.
Black Americans are the least likely to agree with this statement (57%), compared with similar rates of white Americans (76%), Hispanic Americans (75%), AAPI (77%), and multiracial Americans (74%). White Americans without a four-year college degree (81%) are more likely than white Americans with a college degree (68%) to agree with idea that when it comes to monuments and art in public spaces, everyone will be offended by something. Americans with a high school education or less (77%) or some college education (77%, up from 73% in 2022) are significantly more likely to agree with this statement than those with a college degree (70%) or a postgraduate degree (65%, up from 59% in 2022).
Majorities of all generations agree with the statement, but younger generations are less likely to agree than older generations: around seven in ten Gen Zers (69%) and millennials (70%), three in four Gen Xers (76%) and baby boomers (77%), and 82% of the Silent Generation.
While majorities across religious groups agree with this statement, Black Protestants are the least likely to agree (59%). Seven in ten other non-Christians (68%), two-thirds of unaffiliated Americans (66%) and six in ten Jewish Americans (63%) also agree, along with about eight in ten of white evangelical Protestants (84%), white mainline/non-evangelical Protestants (79%), Hispanic Protestants (77%), other Protestants of color (80%), and white Catholics (80%). Around eight in ten Christian nationalism Adherents (83%), Sympathizers (83%), Skeptics (78%), and 60% of Christian nationalism Rejecters agree that when it comes to monuments and art in public spaces, everyone will be offended by something.
Cynicism about the possibility of creating inclusive public spaces is positively correlated with higher scores on the structural racism index. Those who agree that everyone will be offended by something have a median structural racism index score of 0.55, compared with a median score of 0.27 among those who disagree with that statement, which has grown from 0.22 in 2022.
Changes in the Community
Renaming Public Schools and Changing Mascots
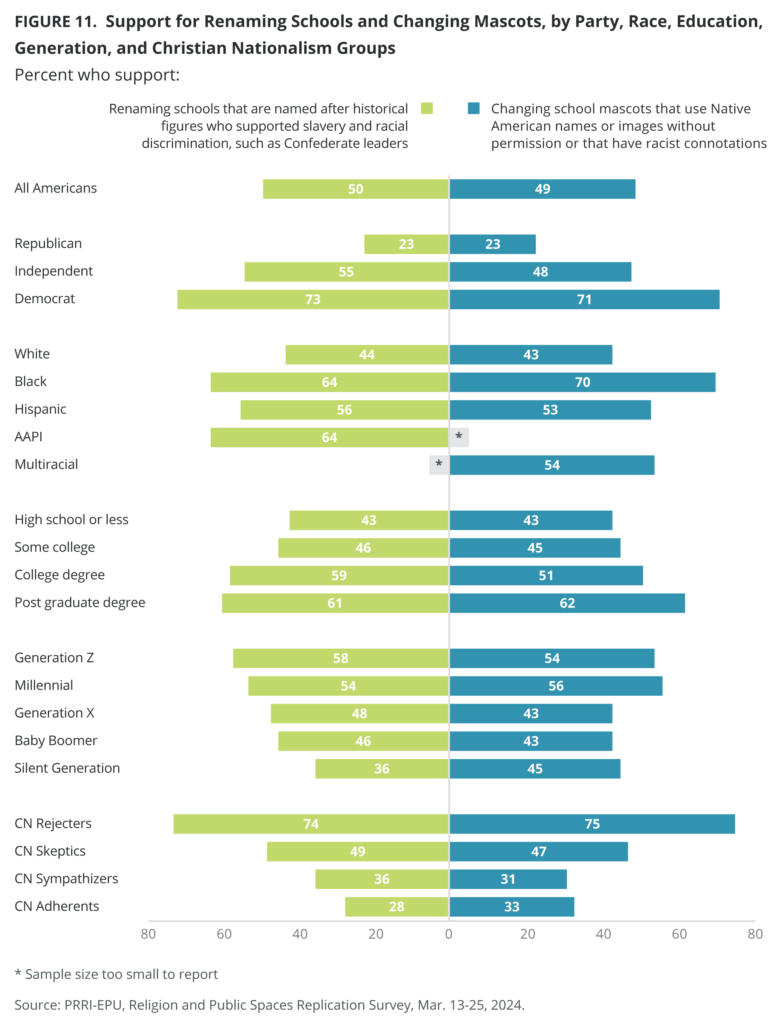
As in 2022, Americans remain divided on the issue of renaming public schools and changing mascots that have racist connotations. Half of Americans (50%) support efforts to rename schools that are named after individuals who supported slavery and racial discrimination, compared with 46% who oppose such measures. Equal shares of Americans support and oppose (both 49%) changing school mascots that use Native American names or images without permission, have racist connotations, or are offensive to certain groups. There is no difference in support for renaming public schools and changing mascots with racist connotations between Americans living in Southern states and the rest of the country.
Democrats remain the most likely to support renaming schools (73%) and changing mascots that have racist connotations (71%). Around half of independents still support both positions, with 55% who support renaming schools and 48% who support changing mascots. Republicans are still the least supportive of efforts to rename schools and change mascots, with 23% supporting each measure.
Just under two-thirds of Black and AAPI Americans (both 64%) support renaming schools. The majority of Hispanic Americans (56%) say the same, which represents a 10 percentage point drop since 2022 (66%). The share of white Americans who support renaming schools (44%) has remained the same.
Black Americans are the most likely to support changing mascots with racist connotations (70%). A slim majority of Hispanic (53%) and multiracial Americans (54%) support changing mascots with racist connotations, compared with 43% of white Americans who say the same. Half of white Americans with a college degree (52%) and over one-third of those without a college degree (36%) also agree.
Americans with a college degree (59% and 51%) or postgraduate degree (61% and 62%) are significantly more likely than Americans with a high school education or less (both 43%) and those with some college education (46% and 45%) to support measures to rename public schools and change mascots with racist connotations.
Gen Z (58% and 54%) and millennials (54% and 56%) are the only two generations with majority support for efforts to rename public schools or change mascots with racist connotations. Under half of Gen X (48%) and baby boomers (46%) support renaming public schools, while 43% of both Gen X and baby boomers support renaming mascots. In comparison, one-third of the Silent Generation (36%) supports renaming public schools and 45% support changing mascots.
Black Protestants are the most likely to support renaming public schools (67%) and changing mascots with racist connotations (66%), followed by religiously unaffiliated Americans (both 63%). There is similar support among Hispanic Catholics for renaming schools (56%) and changing mascots (55%).
Among white Christians, white evangelical Protestants are the least likely to support either position (28% and 27%). White Catholics and white mainline/non-evangelical Protestants show similar support for efforts to rename public schools (40% and 38%, respectively) or change mascots with racist connotations (35% and 38%, respectively). Among white Catholics, support for changing mascots has decreased since 2022 (from 46% to 35%).
Two-thirds of Christian nationalism Rejecters support efforts to rename public schools (74%) and change mascots (75%) with racist connotations. Just under half of Christian nationalism Skeptics support such efforts (49% and 47%, respectively). In comparison, between three in ten and one-third of Christian nationalism Sympathizers (36% and 31%) and Adherents (28% and 33%) say the same.
Americans who support renaming public schools named for Confederate figures have a median structural racism index score that is nearly half of those who oppose these changes (0.30 vs. 0.64). This pattern is almost identical to those who support changing school mascots that use Native American names or images without permission or have racist connotations (0.33 for those who support, 0.64 for those who oppose).
Efforts at Truth-Telling, Racial Healing, Reimagining Public Spaces, and Repairing the Damage from Past Discrimination
Nearly all Americans support “efforts to tell the truth about the history of slavery, violence, and discrimination against racial minorities in your community” (90%) and eight in ten support “efforts to promote racial healing by creating more inclusive public spaces in your community” (79%). Additionally, just under three-quarters support “efforts that reconfigure or reimagine public spaces, so they better represent everyone” (74%) and “efforts to repair the damage done by past violence or discrimination against racial minorities” (72%). There are no differences between Southerners and Americans residing in the rest of the country.
Support for each of the four positions has remained relatively stable among Democrats, Republicans, and independents since 2022. Democrats nearly unanimously support each position (96%, 94%, 93%, and 90%, respectively). Republicans are most likely to support efforts to tell the truth about the history of slavery, violence, and discrimination against racial minorities (87%), followed by efforts to promote racial healing through inclusive public spaces (64%). More than half of Republicans still support efforts to reconfigure public spaces so they better represent everyone (56%) and efforts to repair damage caused by past violence or discrimination (53%). Independents’ support across all statements closely resembles all Americans (91%, 81%, 77%, and 72%, respectively).
Vast majorities of all religious groups support efforts to tell the truth about the history of slavery, violence, and discrimination against racial minorities. More than three-quarters of all religious groups, except white evangelical Protestants (66%), support efforts to promote racial healing through inclusive public spaces. Additionally, white Christians as a whole (73%) are significantly less likely to support efforts to promote racial healing through inclusive public spaces than Christians of color (83%), religiously unaffiliated Americans (85%), or members of other non-Christian religious groups (87%).
However, among religious groups, support for efforts that reconfigure or reimagine public spaces and efforts to repair the damage done by past violence or discrimination against racial minorities tends to be lower among white Christians (66% and 62%), compared with members of other non-Christian religions (79% and 80%), other Christians of color (83% and 81%), and religiously unaffiliated Americans (82% and 79%). The majority of Hispanic Catholics support both positions (83% and 78%) in 2024. White evangelical Protestants (59%) are still the least likely to support efforts to reconfigure or reimagine public spaces.
Around two-thirds or more of Christian nationalism Adherents, Sympathizers, Skeptics, and Rejecters support efforts to reconfigure or reimagine public spaces (60%, 65%, 77%, and 89%, respectively), efforts to repair the damage from past discrimination (61%, 63%, 73%, 87%), and efforts to promote racial healing (66%, 69%, 82%, 92%). Interestingly, 83% of Christian nationalism Adherents, 90% of Sympathizers, 93% of Skeptics, and 97% of Rejecters support efforts to tell the truth about the history of slavery, violence, and discrimination against racial minorities.
Three-quarters of Gen Z (76%), millennials (77%), Gen X (74%), and baby boomers (74%), as well as 66% of the Silent Generation, support efforts to reconfigure or reimagine public spaces. Seven in ten Gen Xers and baby boomers (both 69%) and members of the Silent Generation (71%), 75% of millennials, and eight in ten Gen Zers (79%) support efforts to repair past damage from racial discrimination. Nearly all Gen Zers (87%), millennials (90%), baby boomers (91%), Gen Xers, and members of the Silent Generation (both 92%) support efforts to tell the truth about the history of slavery and discrimination against racial minorities. Around eight in ten of each generation support efforts to promote healing through inclusive public spaces, including 76% of Gen X, 78% of baby boomers, 79% of the Silent Generation, 80% of millennials, and 83% of Gen Z.
Americans who support efforts to tell the truth about the history of slavery, violence, and discrimination against racial minorities have a lower median score on the structural racism index (0.45) than those who oppose these efforts (0.70). Similarly, those who promote racial healing by creating more inclusive public spaces score much lower (0.42) on the structural racism index than those who oppose these efforts (0.73).
In addition, Americans who support efforts that reconfigure or reimagine public spaces so they better represent everyone and who support efforts to repair the damage done by past violence or discrimination against racial minorities score much lower on the structural racism index (both 0.39) than those who oppose (both 0.73).
Priorities for New Monuments
We asked Americans to select three values, out of a list of 12, that they believe would be the most important in guiding the creation of new monuments and art in public spaces. The values that garnered the most support were service and contributions to their community (48%), patriotism (42%), and the idea of a nation of immigrants (38%). About three in ten Americans selected racial equality (30%), American exceptionalism (30%), and racial diversity (27%). Over two in ten Americans selected the American story beginning in 1776 (22%) and about one in ten selected the American story beginning in 1619 (15%), religious diversity (14%), and gender diversity (12%). Just 6% of Americans selected Judeo-Christian heritage and 3% selected European heritage and civilization.
These results differ slightly from 2022. Selection of patriotism as a value has slightly increased (39% in 2022 vs. 42% in 2024), while the idea of a nation of immigrants has slightly decreased as an important value (42% in 2022 vs. 38% in 2024).
Party Affiliation
The values considered most important for the creation of new monuments and art in public spaces vary by party affiliation. There is little overlap in what Democrats and Republicans most commonly chose as their top three values, while independents had overlap with both Democrats and Republicans.
Among Republicans, 68% selected patriotism as a top value, followed by 47% who selected service and contributions to the community and 42% who selected American exceptionalism. Among Democrats, the most popular value selected was service and contributions to their community (51%), followed by the idea of a nation of immigrants (50%), racial equality (43%), and racial diversity (41%). Among independents, 51% selected service and contributions as a top value, followed by 43% who selected patriotism and 40% who selected the idea of a nation of immigrants. These values are similar to what each party selected in 2022.
White Christians More Often Select Patriotism as a Top Value
Overall, white Christians more often selected patriotism as a top value, compared with other groups. The values white evangelical Protestants and white Catholics most often placed in the top three were patriotism (59% and 60%, respectively) and service and contributions to their communities (both 49%). White mainline/non-evangelical Protestants also selected patriotism as a top value (54%), along with service and contributions to their community (52%), the idea of a nation of immigrants, and American exceptionalism (both 35%).
Black Protestants most commonly selected racial equality (61%) and racial diversity (52%) as top values, along with service and contributions to their communities (41%). Both Hispanic Protestants (46%) and Hispanic Catholics (48%) selected the idea of a nation of immigrants as a top value, along with patriotism (both 40%). However, the third value for Hispanic Protestants is service and contributions to their community (39%) and for Hispanic Catholics is racial equality (38%).
The top three values for Jewish Americans are service and contributions to their community (60%), a nation of immigrants (47%), and patriotism (36%). The religiously unaffiliated and members of other non-Christian religions both also selected service and contributions to their community (54% and 44%, respectively) and the idea of a nation of immigrants (47% and 38%, respectively) as top values. However, they differ on the third value. Religiously unaffiliated Americans selected racial equality (35%) and other non-Christians selected racial diversity (42%).
The values each religious group most commonly selected in 2024 are similar to the values selected in 2022.
Patriotism Ranks as Top Value for Christian Nationalists
For Christian nationalism Adherents, patriotism (55%) is their top value for creating new monuments and art in public spaces, followed by service and contributions in their community (39%) and American exceptionalism (33%). Christian nationalism Sympathizers selected the same top values (patriotism at 57%, service and contributions at 43%, and American exceptionalism at 38%), while Skeptics share the two top values: service and contributions to in their community (51%) and patriotism (45%). The third top value for Skeptics is the idea of a nation of immigrants (38%), which is the top value for Christian nationalism Rejecters (56%), followed by service and contributions (55%) and racial equality (34%).
Service and Contributions to Community Top Value for Younger Generations
For Gen Zers, service and contributions to their community (48%) is their top value for creating monuments and art in public spaces, followed by racial equality (37%) and both a nation of immigrants (33%) and racial diversity (33%). Similarly, the top priority for millennials is service and contributions to their community (49%), followed by a nation of immigrants (39%) and patriotism (34%). Gen Xers and baby boomers share the same top values: service and contributions to community (48% and 49%), patriotism (46% and 50%), and nation of immigrants (37% and 40%). The top values for the Silent Generation are patriotism (53%), service and contributions (44%), and both a nation of immigrants (35%) and American exceptionalism (35%).
Support for Policies That Would Compensate Descendants for Past Harm
Mortgage Assistance
Six in ten Americans (60%) favor the idea of local governments providing mortgage assistance for people or descendants of people who can prove they were denied home loans because of their race, including one-fifth who strongly favor it (22%), while 35% opposes it. There is a slight decrease in support on this measure from 2022 (64%). There is no difference between Southerners and Americans residing in the rest of the country in support for mortgage assistance.
While support for mortgage assistance has remained relatively the same among Democrats (83% in 2022 vs. 85% in 2024) and Republicans (38% in 2022 vs. 36% in 2024), support among independents has decreased from 67% to 60% in 2024.
White Americans (53%) are notably less likely than any other racial group, including 82% of Black Americans, 72% of Hispanic Americans, 65% of AAPI, and 64% of multiracial Americans, to support mortgage assistance for descendants of people who were denied home mortgages because of race. The percentage of white Americans who support mortgage assistance has decreased from 59% in 2022; there has been no change in support among any other racial group.
Black Protestants (87%) are the most likely to support mortgage assistance, followed by Jewish Americans (79%), Hispanic Catholics (74%), members of other non-Christian religions (70%), and religiously unaffiliated Americans (70%). Around six in ten Hispanic Protestants (62%) and other Protestants of color (58%) also support mortgage assistance. Support is much lower among white Christian groups: white mainline/non-evangelical Protestants (52%, down from 59% in 2022), white Catholics (48%), and white evangelical Protestants (38%).
Fewer than half of Christian nationalism Adherents (46%) and Sympathizers (48%) support mortgage assistance, compared with 62% of Christian nationalism Skeptics and 79% of Rejecters who support such efforts.
Majorities of all generations support mortgage assistance for descendants of people denied mortgages because of their race, including two-thirds of Gen Z (65%) and millennials (64%), six in ten Gen Xers (58%) and baby boomers (59%), and 54% of the Silent Generation.
Support for these programs correlates closely with the structural racism index. Americans who support mortgage assistance programs have a median structural racism index score of roughly half of those who oppose such programs (0.36 vs. 0.67).
Scholarships for Colleges and Universities
A slim majority of Americans (52%) favor colleges and universities providing scholarships for descendants of enslaved people who were forced to construct buildings and work on their campuses, compared with 44% who oppose such actions. The percentage of Americans who support such policies has decreased significantly, from 55% in 2022. Democrats (77%) are more than three times as likely as Republicans (23%) to favor these efforts, while independents fall in between and are notably less likely to favor this policy today (52%) than they were in 2022 (60%). There are no differences between Southerners and Americans residing in the rest of the country.
White Christian groups are the least likely to favor this idea, with only 40% of white mainline/non-evangelical Protestants, 35% of white Catholics, and 29% of white evangelical Protestants expressing support. White Catholics have seen a notable decrease in support since 2022, down from 44%. Eight in ten Black Protestants (82%), around six in ten Hispanic Catholics (64%), religiously unaffiliated (63%), members of other non-Christian religions (62%), and Jewish Americans (60%), and a slim majority of half of Hispanic Protestants (54%) and other Protestants of color (52%) support scholarship efforts.
The percentage of white Americans who favor scholarship efforts has decreased from 48% in 2022 to 43% in 2024, while the percentage of Black Americans who support these policies has increased significantly from 68% to 77%. Around six in ten Hispanic (62%), AAPI (60%), and multiracial Americans (57%) also support these efforts.
Christian nationalism Rejecters (74%) are nearly twice as likely as Christian nationalism Adherents (37%) and Sympathizers (38%) to support college scholarships for the descendants of enslaved people forced to build or work on their campuses. A slim majority of Christian nationalism Skeptics (51%) also support such efforts.
The Silent Generation (41%) is the least likely to support college scholarship efforts, followed by baby boomers (45%) and Gen X (48%). In comparison, six in ten Gen Zers and millennials (both 59%) support these efforts.
![]()
Americans who support these scholarship programs have a much lower median score on the structural racism index (0.33) than those who oppose these programs (0.64).
[1] There are no significant changes from 2022 across all questions that make up the index, except for “White supremacy is still a major problem in the U.S. today.” In 2024, 58% agreed with this question, which has gone down from 62% in 2022. This change did not result in any significant changes to Americans’ overall score on the structural racism index.
[2] Other Protestants of color include Protestants who are Asian American or Pacific Islander, Native American, multiracial, or any other race or ethnicity.
[3] For more information on the Christian nationalism scale and findings, see PRRI’s most recent report: https://www.prri.org/research/support-for-christian-nationalism-in-all-50-states/
[4] Sample sizes for multiracial Americans are too small to report.
[5] Sample sizes for AAPI are too small to report.
[6] Not enough cases for AAPI Americans without a college degree or multiracial Americans with a four-year degree.
APPENDIX A. Survey Methodology
The survey was designed and conducted by PRRI. The survey was made possible through the generous support of the Mellon Foundation. The survey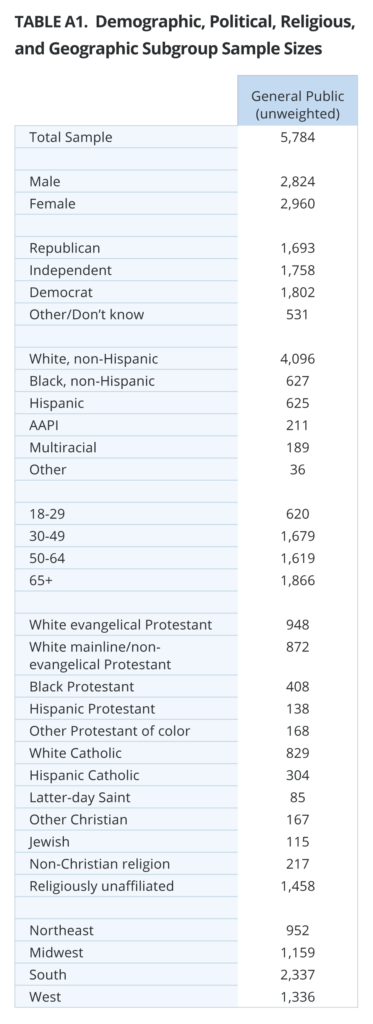 was conducted among a representative sample of 5,045 adults (age 18 and up) living in all 50 states in the United States, who are part of Ipsos’s Knowledge Panel and an additional 739 who were recruited by Ipsos using opt-in survey panels to increase the sample sizes in smaller states. Interviews were conducted online between March 13 and 25, 2024.
Respondents are recruited to the KnowledgePanel using an addressed-based sampling methodology from the Delivery Sequence File of the USPS – a database with full coverage of all delivery addresses in the U.S. As such, it covers all households regardless of their phone status, providing a representative online sample. Unlike opt-in panels, households are not permitted to “self-select” into the panel; and are generally limited to how many surveys they can take within a given time period.
The initial sample drawn from the KnowledgePanel was adjusted using pre-stratification weights so that it approximates the adult U.S. population. Next, a probability proportional to size (PPS) sampling scheme was used to select a representative sample.
To reduce the effects of any non-response bias, a post-stratification adjustment was applied. The needed benchmarks were obtained from the latest 2023 March supplement of the Current Population Survey (CPS), except language proficiency, which is not available from CPS, and was obtained from the 2022 American Community Survey (ACS). Additionally, the party affiliation benchmark was obtained from the Pew’s 2023 National Public Opinion Reference survey (NPORS). The post-stratification weight rebalanced the sample based on the following benchmarks: gender by age, race/ethnicity by gender, race/ethnicity by age, race/ethnicity by education, education, income, language proficiency, Census region by metropolitan status, and party affiliation. Additionally, we included individual states (50 states plus D.C.) to account for the oversampling of some states.
The margin of error for the national survey is +/- 1.52 percentage points at the 95% level of confidence, including the design effect for the survey of 1.4. In addition to sampling error, surveys may also be subject to error or bias due to question wording, context, and order effects. Additional details about the KnowledgePanel can be found on the Ipsos website: https://www.ipsos.com/en-us/solution/knowledgepanel
Appendix B. About E Pluribus Unum and PRRI
E Pluribus UnumFounded by former New Orleans Mayor Mitch Landrieu in 2018, E Pluribus Unum (EPU) is a nonprofit, nonpartisan organization whose mission is to build a more equitable and inclusiveSouth, uprooting the barriers that have long divided the region by race and class. EPU is focused on changing the divisive narratives that perpetuate systemic and interpersonal racism, cultivating and empowering courageous leaders who are advancing racial equity, and championing transformative policy change. Learn more at www.unumfund.org.