Executive Summary
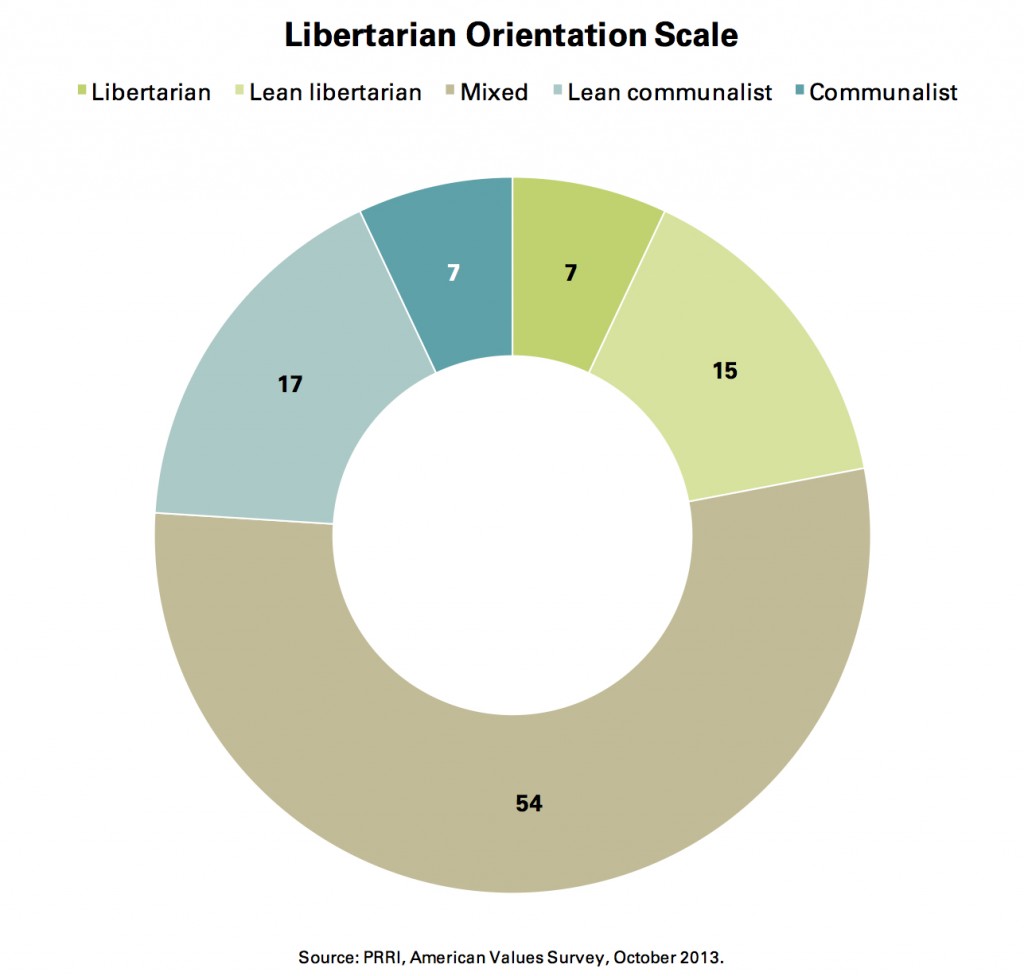
 According to a newly developed Libertarian Orientation Scale, less than 1-in-10 (7%) Americans are consistent libertarians, and an additional 15% lean libertarian. At the other end of the spectrum, an equal number of Americans are consistent communalists (7%), and an additional 17% lean communalist. A majority (54%) of Americans have a mixed ideological profile, falling in between libertarian and communalist orientations.
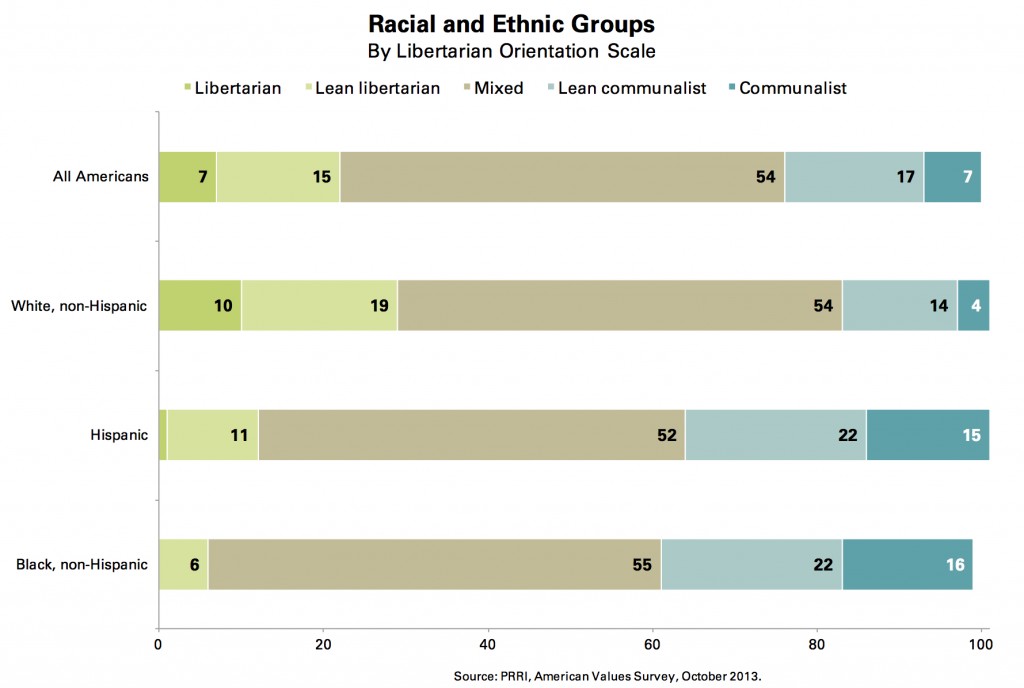
Compared to the general population, libertarians are significantly more likely to be non-Hispanic white, male, and young. Nearly all libertarians are non-Hispanic whites (94%), more than two-thirds (68%) are men, and more than 6-in-10 (62%) are under the age of 50.
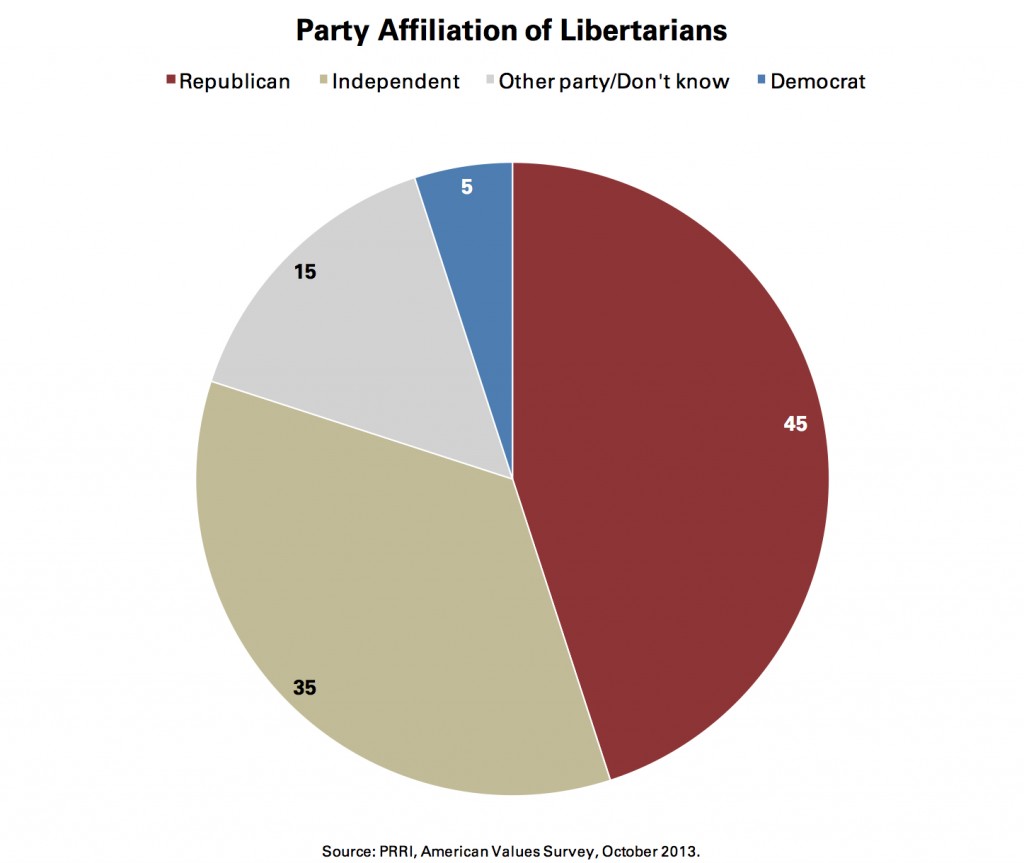
The party affiliation of libertarians skews significantly more Republican than Democratic. Close to half (45%) of libertarians identify as Republican, compared to only 5% who identify as Democrat. However, half of libertarians identify as politically independent (35%) or identify with a third political party (15%), including roughly 1-in-10 (8%) who identify with the Libertarian Party. Roughly 4-in-10 (39%) libertarians identify as part of the Tea Party movement, while 61% do not.
Libertarians make up a smaller proportion of the Republican Party than other key conservative groups. Only 12% of self-identified Republicans are libertarians, compared to 20% of Republicans who identify with the Tea Party, 33% who identify with the religious right or conservative Christian movement, and 37% who identify as white evangelical Protestant.
Libertarians also constitute a smaller proportion of the Tea Party movement than other core conservative groups. About one-quarter (26%) of Americans who identify with the Tea Party movement are libertarians, compared to a majority (52%) who say they are a part of the religious right or conservative Christian movement, and 35% who identify as white evangelical Protestant.
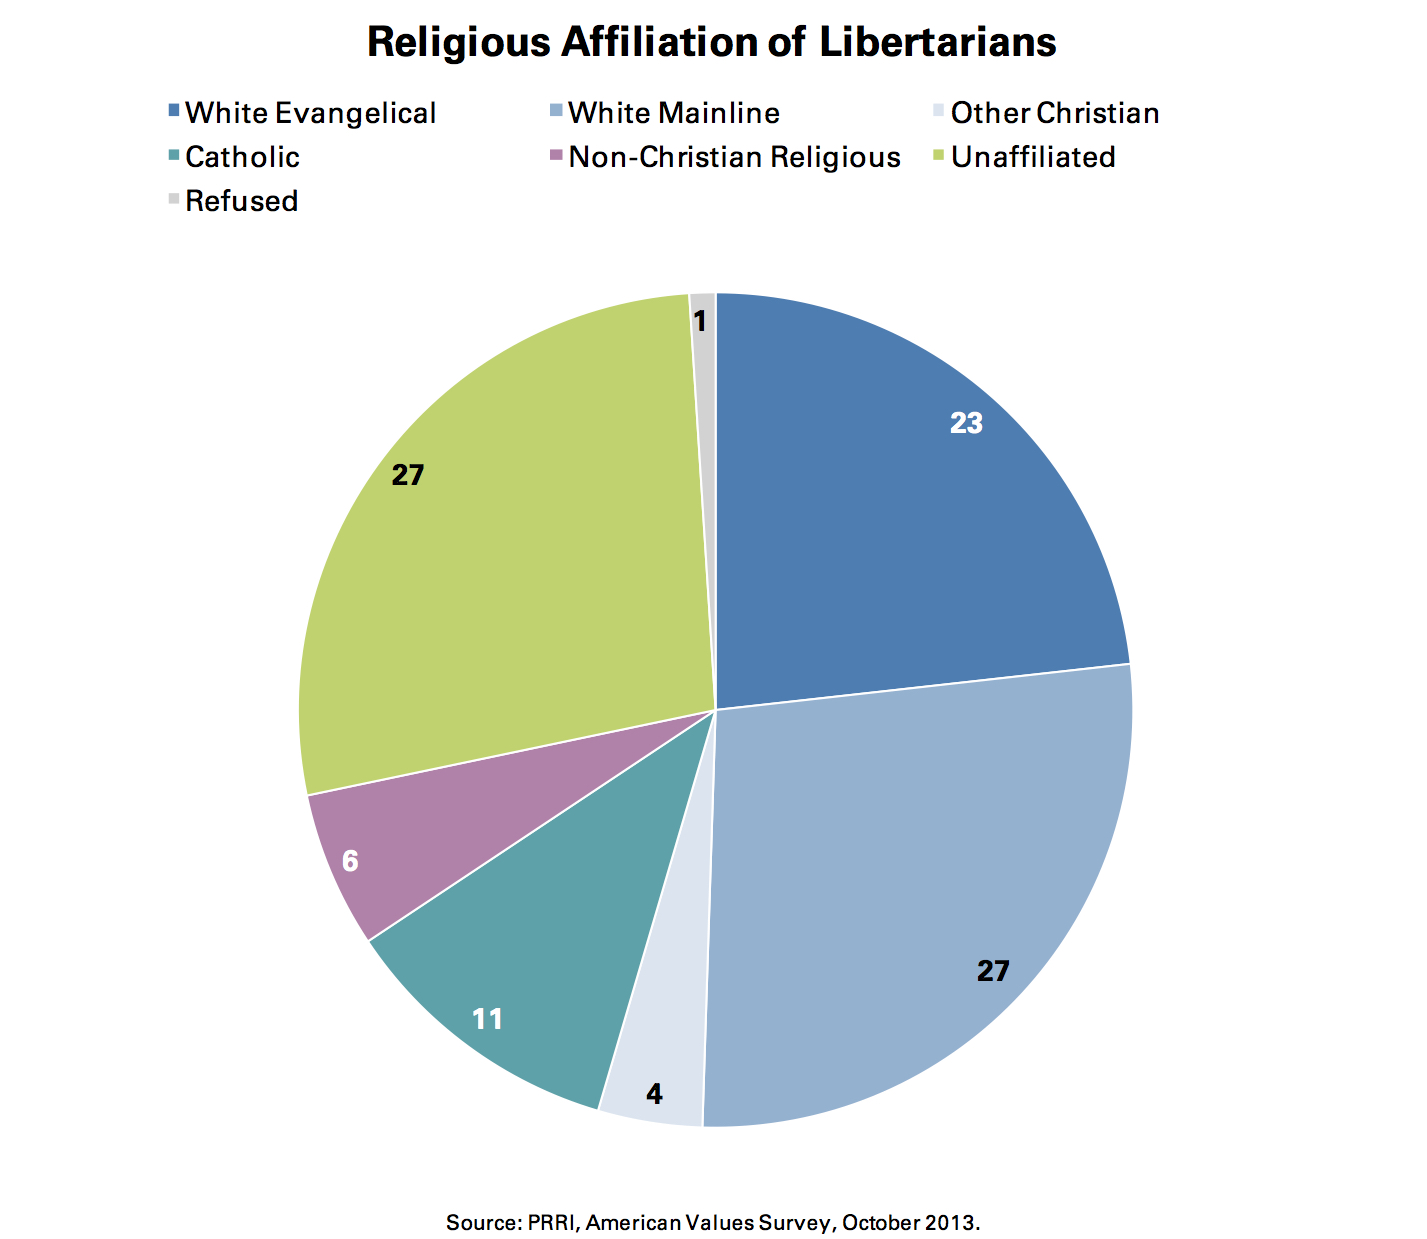
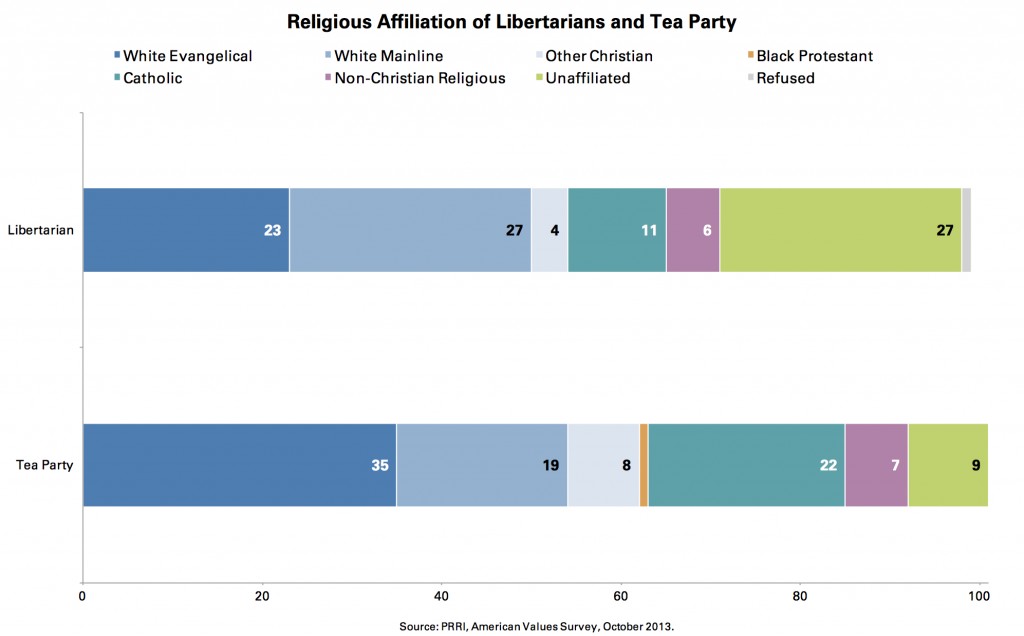
Libertarians are composed of a disproportionately high number of white mainline Protestants (27%) and religiously unaffiliated Americans (27%). Only about 1-in-10 (11%) libertarians identify as Catholic, and no libertarians identify as black Protestant.
Generally speaking, libertarians are more opposed than white evangelical Protestants, those affiliated with the Tea Party, and Republicans overall to government involvement across a range of economic policies, such as raising the minimum wage, Obamacare, and increasing environmental protections.
- Nearly two-thirds (65%) of libertarians oppose increasing the minimum wage from $7.25 an hour to $10.00 an hour, as do 57% of Americans who identify with the Tea Party. By contrast, 57% of Republicans overall and 61% of white evangelical Protestants support raising the minimum wage.
- Nearly all (96%) libertarians have an unfavorable view of the 2010 health care law, compared to 83% of white evangelical Protestants, 78% of Tea Party members, and 89% of Republicans.
- On the issue of passing tougher environmental laws, libertarians and Tea Party members are generally aligned in their strong opposition (73% and 74% oppose), while white evangelical Protestants and Republicans overall are also opposed but with less intensity (62% each opposed).
Unlike economic questions, on which libertarians are generally aligned with other conservative constituencies, libertarians have a more distinct profile on social issues.
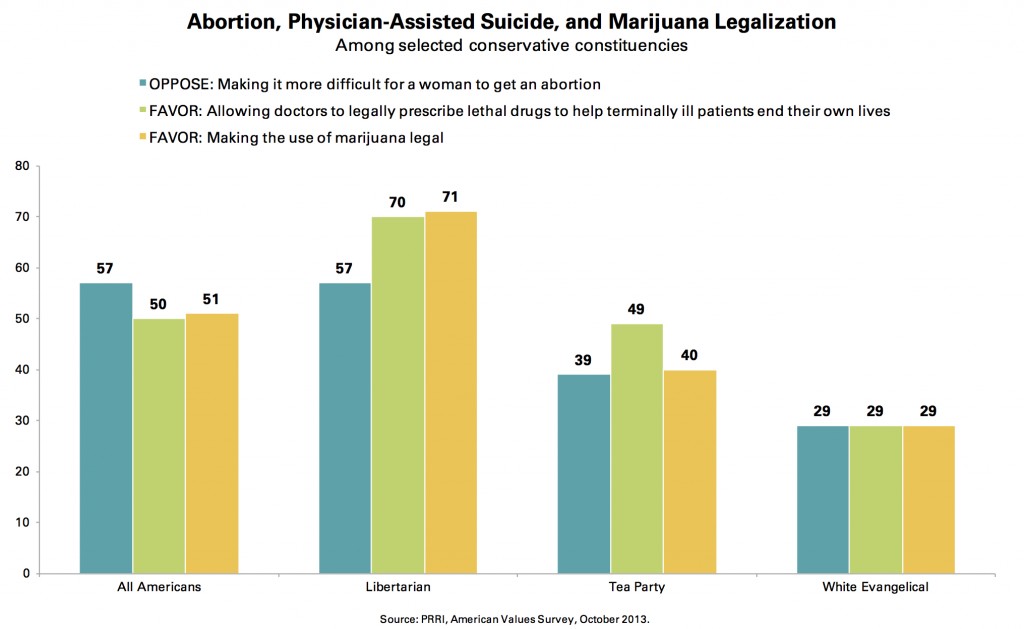
- Nearly 6-in-10 (57%) libertarians oppose making it more difficult for a woman to get an abortion, a proportion identical to the general population. By contrast, strong majorities of Republicans overall (58%), Americans affiliated with the Tea Party (58%), and white evangelical Protestants (68%) favor making it more difficult for a woman to get an abortion.
- Seven-in-ten (70%) libertarians favor allowing doctors to prescribe lethal drugs to help terminally ill patients end their lives. Americans who identify with the Tea Party are closely divided on this question (49% favor, 51% oppose). By contrast, strong majorities of Republicans (58%) and white evangelical Protestants (70%) oppose this policy.
- More than 7-in-10 (71%) libertarians favor legalizing marijuana. By contrast, approximately 6-in-10 Republicans (61%) and Tea Party members (59%), and nearly 7-in-10 (69%) white evangelical Protestants, oppose legalizing marijuana.
- Unlike most other social issues, libertarians remain socially conservative on same-sex marriage. While a majority (59%) of libertarians oppose same-sex marriage, they are significantly less opposed than Republicans overall (67%) and than other conservative-leaning groups such as Tea Party members (73%) and white evangelical Protestants (80%).
A majority (53%) of libertarian voters say they always vote in primary elections, a rate comparable to white evangelical Protestant voters (48%) and Republican voters overall (50%) but significantly lower than the participation rate among Tea Party voters (62%).
A majority (57%) of libertarians have a favorable view of the Republican Party, but a substantial minority (40%) have an unfavorable view of the GOP. Americans who identify with the Tea Party and white evangelical Protestants have a more positive view of the GOP than libertarians. Approximately two-thirds of Tea Party members (68%) and white evangelical Protestants (66%) have a favorable view of the Republican Party. Notably, libertarians hold more negative views of Democrats than they hold positive views of Republicans. Nearly 9-in-10 (89%) libertarians have an unfavorable view of the Democratic Party including nearly two-thirds (64%) who have a very unfavorable opinion of the party.
Among voters who identify with or lean toward the Republican Party, support is spread fairly evenly across the potential 2016 presidential field in a head-to-head question. Eighteen percent prefer Governor Chris Christie, 18% prefer Congressman Paul Ryan, 15% prefer former Governor Jeb Bush, 14% prefer Senator Marco Rubio, 11% prefer Senator Rand Paul, and 11% prefer Senator Ted Cruz.
- Among libertarian voters who identify with or lean toward the Republican Party, Paul (26%) was the most popular potential candidate, while 18% prefer Cruz, 16% prefer Rubio, and 13% prefer Ryan. Fewer libertarian voters prefer Christie (10%) or Bush (6%).
- Among Tea Party voters who identify or lean Republican, Cruz is the most preferred candidate (22%), followed by Rubio (18%), Ryan (14%), and Paul (13%). Roughly 1-in-10 Tea Party voters prefer Bush (11%) or Christie (12%).
- White evangelical Protestant voters have less clear candidate preferences than libertarian and Tea Party voters. Among white evangelical Protestant voters who identify or lean Republican, top preferences include Ryan (19%), Christie (16%), and Bush (15%), while roughly 1-in-10 prefer Rubio (13%), Paul (11%), or Cruz (10%).
I. Libertarianism in the 21st Century
Introduction
The Tea Party emerged on the national stage shortly after the 2008 election, largely in opposition to President Obama and his first-term legislative agenda. By 2010, the Tea Party’s political impact was evident in the role it played in electing candidates in Republican primaries, unseating incumbents with more conservative challengers. Most recently, the 16-day federal government shutdown, which was largely due to intense pressure on House Republican leadership from a contingent of Tea Party-affiliated House members, serves as a testament to the political influence the Tea Party continues to wield within the Republican caucus. From its inception, Tea Party leaders have generally described the movement as guided by a libertarian philosophy.
In 2010, Public Religion Research Institute conducted a study to more fully explore the nature of the Tea Party movement and provide a better understanding of how it fits into the broader conservative political ecosystem. PRRI’s 2010 American Values Survey found that Americans who identified with the Tea Party movement were not consistent libertarians, but rather were mostly social conservatives. Consistent with this finding, the PRRI study showed that the Tea Party movement borrowed heavily from the ranks of the Christian right movement. In 2010, approximately half (47%) of Americans who identified as part of the Tea Party movement also identified as members of the religious right or conservative Christian movement, a number that has remained relatively steady up to the present (52%). While these earlier findings upended the conventional wisdom that Tea Party members were primarily libertarians, it left unanswered larger questions about the size of a libertarian constituency in the general public and the degree of influence libertarians have on American politics and culture.
Since 2010, a number of other important developments have renewed the debate about the place of libertarians in American political life, and especially with respect to core Republican constituencies like white evangelical Protestants and the Tea Party. While most Republican core constituencies are more or less aligned on economic issues such as taxation, changing attitudes on social issues such as same-sex marriage and marijuana legalization have exposed new fault lines. Moreover, growing concerns about privacy in response to the National Security Agency’s domestic wiretapping program and shifting sentiments about the role the American military should play abroad have also created new tensions and alignments among factions of the Republican coalition.
The current survey takes up this important debate and paints a portrait of libertarians’ beliefs and political preferences. It also attempts to locate libertarians in relation to other important conservative constituencies, such as Tea Party members and white evangelical Protestants.
Defining Libertarianism
The influence of political ideology in American politics has been a perennial topic of debate in the field of public opinion research for more than half a century. Early work on political orientations among American voters found, for the most part, Americans were not reliably driven by ideological commitments. For example, Converse (1964) found most people did not fully adhere to a consistent set of beliefs, nor did they have a clear grasp of the concept of ideology(1). Public opinion research over the last few decades has largely confirmed that most Americans hold some combination of liberal and conservative attitudes, particularly across different kinds of issues.
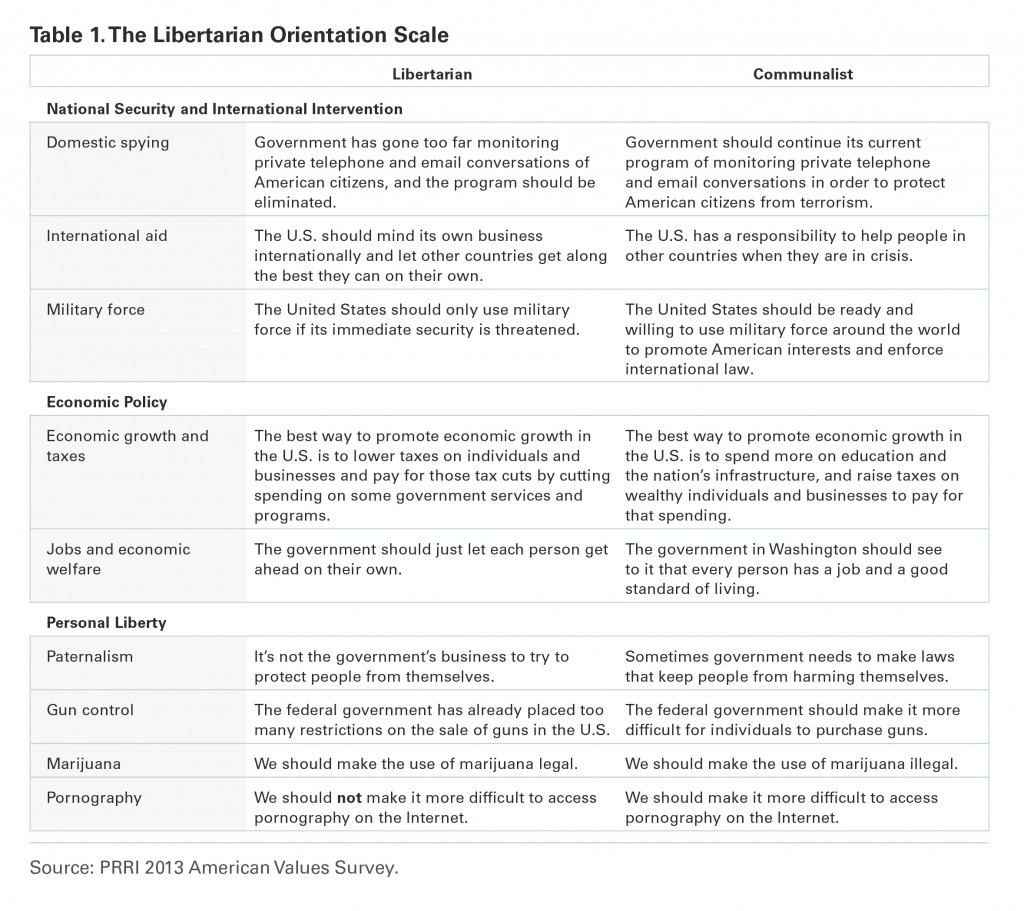
With these challenges in mind, PRRI set out to determine how many Americans hold relatively consistent libertarian views.(2) As Table 1 illustrates, we constructed an additive Libertarian Orientation Scale using nine questions across three dimensions: national security and international intervention, economic policy, and personal liberty issues. Answers to each of the nine component questions were scored from one to seven; answers consistent with a libertarian viewpoint were scored low, and answers inconsistent with a libertarian viewpoint were scored high. Respondents who scored generally low across this set of nine questions—indicating preferences for low government intervention in the international arena, in economic policy, and in issues related to personal liberties—were classified as libertarian. At the other end of the scale, respondents who scored generally high across these questions—indicating preferences for higher government intervention even at the cost of some personal liberties—were classified as communalist.
Based on this Libertarian Orientation Scale, consistent libertarians make up just 7% of the American public, with an additional 15% who lean libertarian. At the other end of the scale, an equally small number of Americans are consistent communalists (7%), with an additional 17% who lean communalist. A majority (54%) of the public has a mixed ideological profile, falling in between libertarian and communalist orientations.
In addition to the Libertarian Orientation Scale, the survey included a self-identification question where respondents could indicate whether they identified with the label “libertarian.” When asked directly about the term, slightly more than 1-in-10 (13%) Americans self-identify as libertarian. Analysis comparing libertarians identified with the Libertarian Orientation Scale to self-identified libertarians reveals, not surprisingly, that self-identified libertarians exhibit a significantly less consistent ideological orientation than either libertarians or libertarian leaners who were identified with the scale. For this reason, the analysis in the remainder of this report focuses on libertarians identified with the Libertarian Orientation Scale. For a comparison of libertarians identified with the Libertarian Orientation Scale and self-identified libertarians across a range of issues, see Appendix 2.
A Portrait of Libertarians and Communalists
Demographic Profile
Compared to Americans overall, libertarians are composed of a much larger proportion of men than women. More than two-thirds (68%) of libertarians are men, while 32% are women. Among libertarian leaners, a majority (53%) are also men. In contrast, roughly 6-in- 10 communalists (61%) and communalist leaners (59%) are women.
There are also large racial differences between communalists and libertarians. Nearly all libertarians are non-Hispanic whites (94%), and more than 8-in-10 (81%) libertarian leaners are also non-Hispanic whites. In contrast, communalists comprised nearly equal proportions of non-Hispanic whites (35%), blacks (27%), and Hispanics (31%). Communalist leaners are also composed of a larger share of non-white Americans, with 55% identifying as non-Hispanic white, 15% identifying as black, and 19% identifying as Hispanic.
There are also substantial generational differences between libertarians and communalists. More than 6-in-10 (62%) libertarians are under the age of 50, including one-quarter (25%) who are under the age of 30. By contrast, less than four-in-ten (39%) communalists are under the age of 50, and fewer than 1-in-10 (9%) are under the age of 30. Communalists are twice as likely as libertarians to be age 65 or older (24% vs. 12% respectively). The generational profiles of libertarian leaners and communalist leaners do not differ appreciably from Americans overall.
Ideological and Partisan Profile
Overall, nearly one-third of Americans identify as politically conservative, including 8% who self-identify as very conservative and 24% who identify as simply conservative. On the other end of the ideological spectrum, 1-in-5 Americans identify as politically liberal, with 4% identifying as very liberal and 16% identifying as simply liberal. A plurality (42%) of Americans identify as politically moderate.
Notably, the Libertarian Orientation Scale and traditional measures of political ideology that run along a liberal-conservative axis are only weakly correlated.(3) Generally speaking, however, libertarians are more likely to identify as politically conservative than politically liberal.
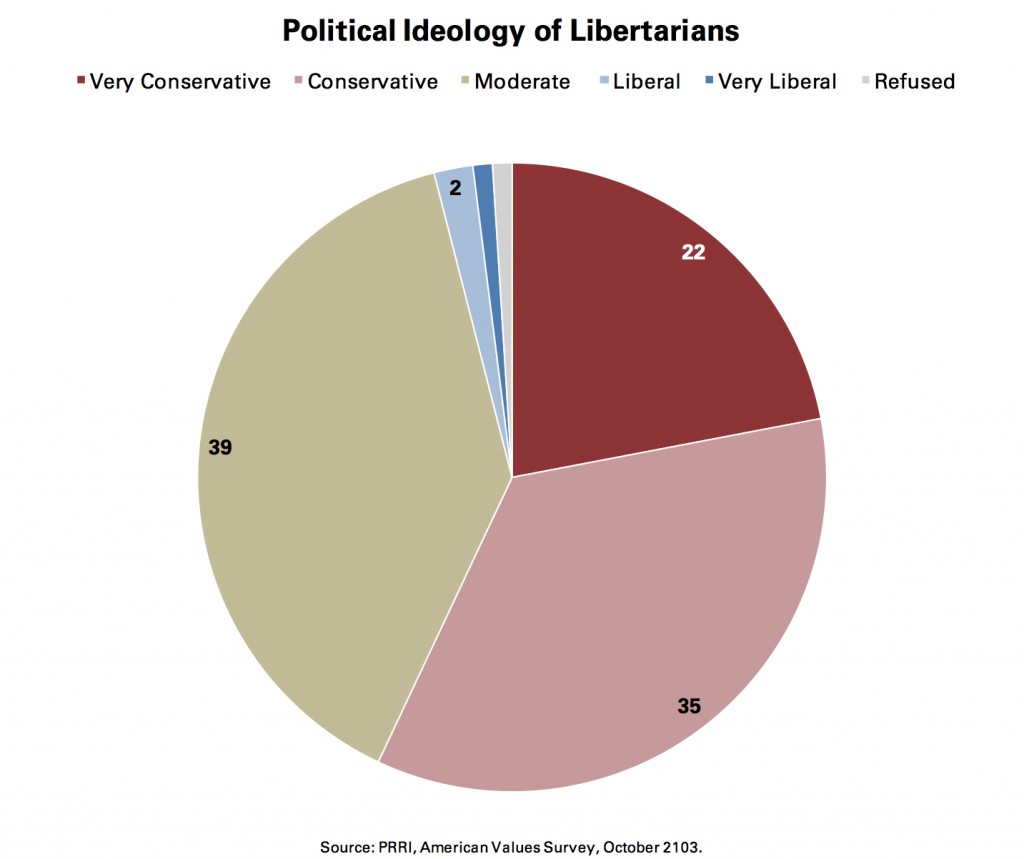
A majority (57%) of libertarians identify as conservative, while 39% identify as moderate and only 3% identify as politically liberal. By contrast, communalists are more likely to identify as liberal (33%) than conservative (18%), although a plurality identify as moderate (44%). The ideological profiles of libertarian leaners and communalist leaners closely resemble the ideological composition of libertarians and communalists respectively.
The party affiliation of libertarians skews significantly more Republican than Democratic. Close to half (45%) of libertarians identify as Republican, compared to only 5% who identify as Democrat. However, half of libertarians identify as politically independent (35%) or identify with a third political party (15%), including roughly 1-in-10 (8%) who identify with the Libertarian Party. Roughly 4-in-10 (39%) libertarians identify as part of the Tea Party movement, while 61% do not. Libertarian leaners are about half as likely as libertarians to identify with the Tea Party movement (20%). By contrast, among communalists, 6% identify as Republican, while 20% identify as independent and 69% identify as Democrat. No communalists identify with the Tea Party movement.
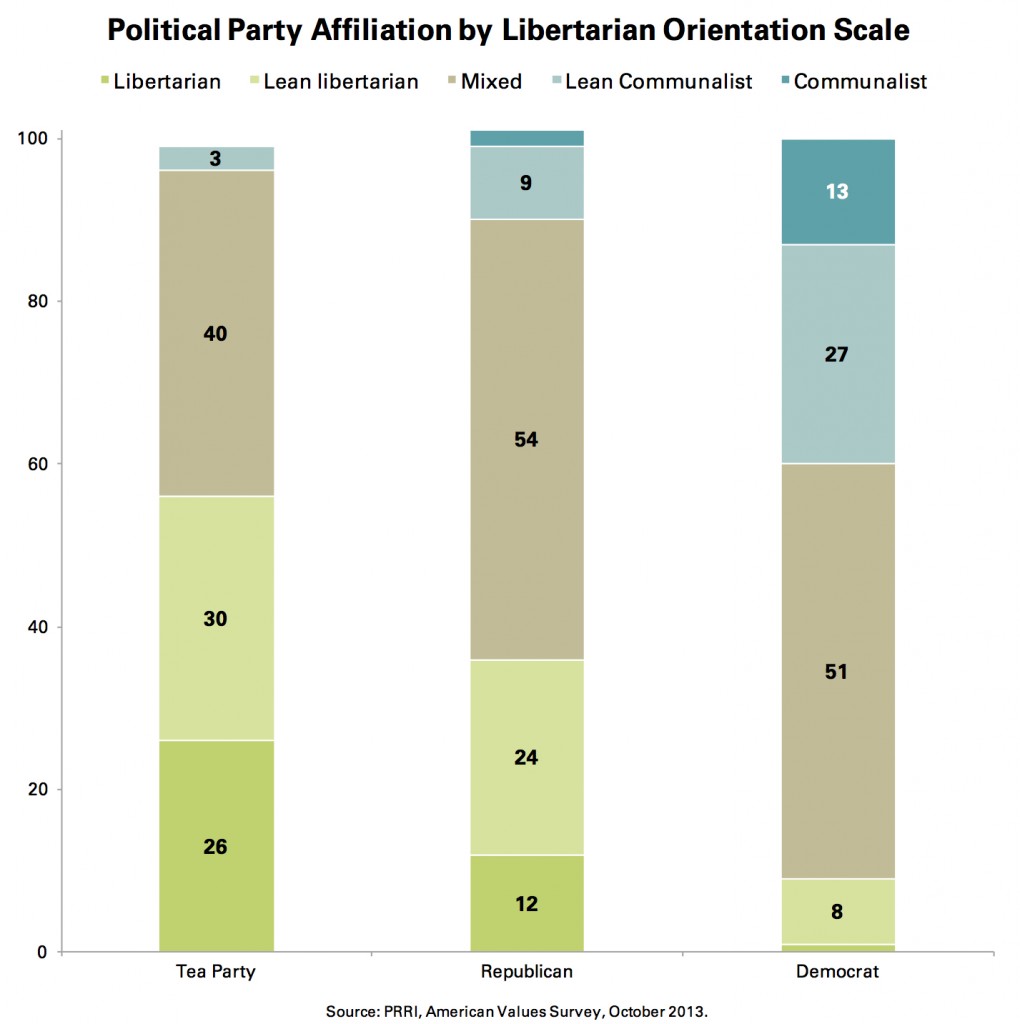
Libertarians make up a relatively small part of the Republican Party. About 1-in-10 (12%) Republicans are libertarian, compared to only 2% who are communalist.(4) By contrast, only 1% of Democrats are libertarian, compared to 13% who are communalist. Majorities of both Republicans (54%) and Democrats (51%) have a mixed ideological view on the Libertarian Orientation Scale. Notably, libertarians (12%) make up a smaller proportion of the Republican base than other key Republican base groups, such as white evangelical Protestants (37%), those who identify with the religious right or conservative Christian movement (33%), or those who identify with the Tea Party (20%).
Americans who identify with the Tea Party movement are significantly more likely to identify with the Christian right or as white evangelical Protestant than they are to identify as libertarian. A majority (52%) of Americans who identify with the Tea Party also say they are a part of the religious right or conservative Christian movement, and more than one-third (35%) identify as white evangelical Protestants. In contrast, about one-quarter (26%) of Americans who identify with the Tea Party are libertarian, although another 3-in-10 (30%) lean libertarian. Only 3% of Tea Party members lean communalist, and no Tea Party members are communalists.
Religious Profile
The religious profiles of libertarians and communalists are quite distinct. Libertarians are composed of a disproportionately high number of white mainline Protestants (27%) and religiously unaffiliated Americans (27%). Only about 1-in-10 (11%) libertarians identify as Catholic, and no libertarians identify as black Protestant.
By contrast, a majority of communalists identify as either Catholic (29%) or black Protestant (22%). Few communalists identify as white mainline (9%) or white evangelical Protestant (5%). Approximately 1-in-10 communalists are religiously unaffiliated (9%); are affiliated with non-Christian religious groups such as Jews, Muslims, or other Eastern religions (10%); or identify with Orthodox Christianity, some other Christian tradition or as a non-white Christian, such as Hispanic Protestant, Asian or mixed-race Protestant (13%).
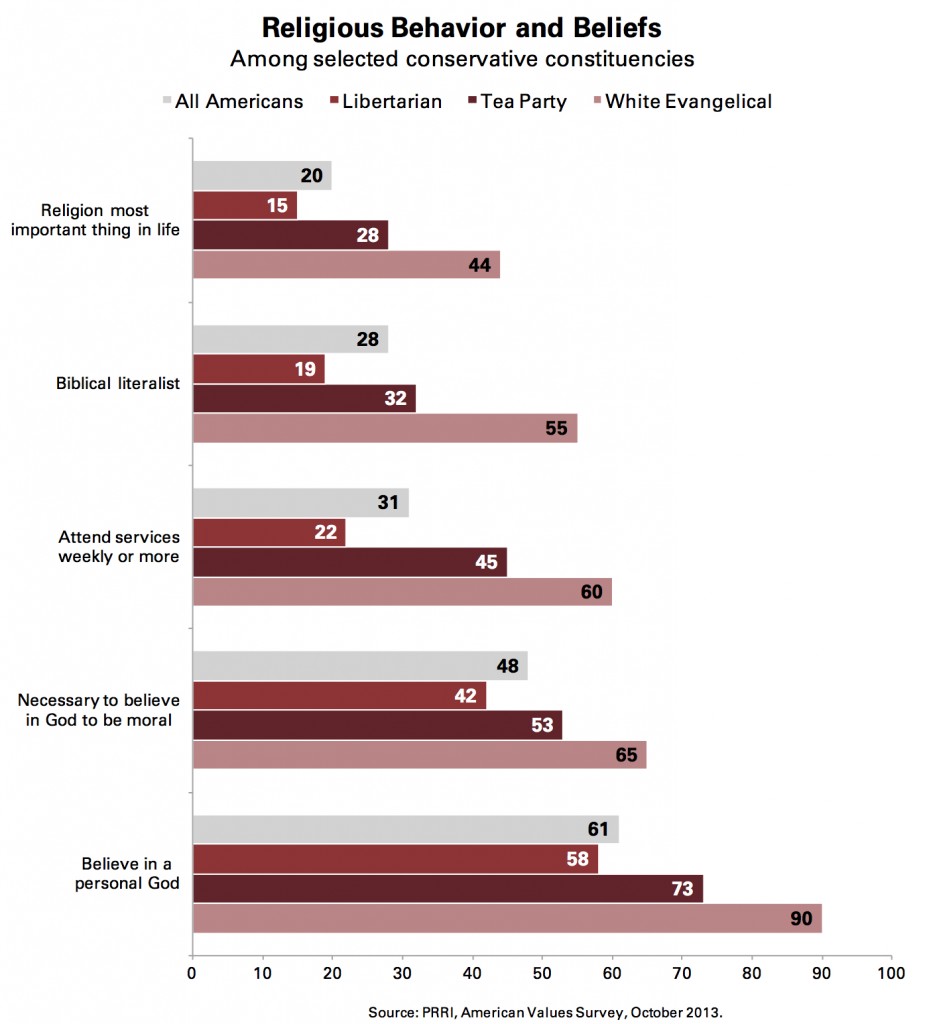
Libertarians are unique among conservative groups in their religious orientation, differing significantly from Tea Party members and white evangelical Protestants. Libertarians are about as likely as the general population—but significantly less likely than white evangelical Protestants or those who identify with the Tea Party—to say they consider themselves a part of the religious right or conservative Christian movement. While only about 1-in-5 (22%) libertarians say they consider themselves a part of the religious right or conservative Christian movement, approximately half of Tea Party members (52%) and white evangelical Protestants (48%) say they are part of the religious right movement.
Libertarians are significantly less likely than those who identify with the Tea Party or white evangelical Protestants to describe religion as important in their lives. Only 15% of libertarians say religion is the most important thing in their lives, and nearly 4-in-10 (38%) say religion is one among many important things in their lives. More than 4-in-10 libertarians say either that religion is not as important as other things in their lives (19%) or that religion is not important in their lives (25%). By contrast, nearly 3-in-10 (28%) Tea Party members say that religion is the most important thing in their lives, and nearly half (49%) say religion is one among many important things in their lives. Only 11% of Tea Party members say religion is not important in their lives. More than 9-in-10 white evangelical Protestants report that religion is the most important thing in their lives (44%) or one among many important things (50%). Only 1% of white evangelical Protestants say religion is not important in their lives.
Similarly, libertarians report much lower levels of religious attendance than members of the Tea Party or white evangelical Protestants. Roughly 1-in-5 (22%) libertarians report that they attend services at least once a week, 22% report they attend monthly or a few times a year, and a majority (55%) report that they seldom or never attend religious services. Among Tea Party members, close to half (45%) say they attend services at least once a week and less than one-third (31%) report they attend seldom or never. Six-in-ten (60%) white evangelical Protestants report that they attend services once a week or more, while less than 1-in-5 (17%) seldom or never attend.
Libertarians’ conceptions and views of God also differ starkly from white evangelical Protestants and members of the Tea Party. Fewer than 6-in-10 (58%) libertarians believe that God is a person with whom one can have a relationship, one-quarter (25%) believe God is an impersonal force in the universe, and 16% report that they do not believe in God. Nearly three-quarters (73%) of Americans who identify with the Tea Party hold a personal view of God, 19% believe God is an impersonal force, and only 6% report they do not believe in God. There is an even larger gap between libertarians and white evangelical Protestants. Nine-in-ten (90%) white evangelical Protestants believe in a personal God, 8% believe that God is an impersonal force, and less than 1% say they do not believe in God.
Libertarians are significantly less likely than white evangelical Protestants and those affiliated with the Tea Party to say that it is necessary to believe in God in order to be moral. Roughly 4-in-10 (42%) libertarians agree that it is necessary to believe in God to be moral, while a majority (56%) disagree. In contrast, a majority of Tea Party members (53%) and nearly two-thirds (65%) of white evangelical Protestants agree that it is necessary to believe in God to be moral.
Libertarian Views of Selected Cultural Minority Groups
American attitudes toward cultural minority groups such as immigrants, Muslims, gay and lesbian people, and atheists vary considerably across political orientations and religious affiliations. On a “feeling thermometer,” a scale that runs from 1 to 100 where 1 indicates very cool feelings and 100 indicates very warm feelings, Americans overall report modestly warm feelings toward immigrants (56) and gay and lesbian people (57), and more cool feelings toward Muslims (42) and atheists (43).
On average, libertarians (29), members of the Tea Party (27), and white evangelical Protestants (31) all report cool feelings toward Muslims. There are also few differences between these groups in their views of immigrants, though feelings toward immigrants are more neutral. Among libertarians (43), members of the Tea Party (52) and white evangelical Protestants (48), average scores stand around the 50-point mark, indicating a neutral disposition toward immigrants.
However, the feelings of libertarians diverge from the feelings of Tea Party members and white evangelical Protestants with regard to atheists and gay and lesbian people. On average, libertarians exhibit significantly more positive feelings toward atheists than either members of the Tea Party or white evangelical Protestants (46 vs. 33 and 25, respectively). Similarly, libertarians (49) have significantly warmer feelings toward gay and lesbian people than do members of the Tea Party (44) or white evangelical Protestants (38).
II. Libertarians on Political Issues
Economic Issues
Generally speaking, libertarians are more opposed than white evangelical Protestants, Tea Party members, and Republicans overall to a range of economic policies, such as Obamacare, raising the minimum wage, and increasing environmental protections.
The 2010 Health Care Law (Obamacare)
Americans’ views on the 2010 health care law, commonly known as Obamacare, are complex. More than 4-in-10 (44%) have a favorable view of the law, while a majority (54%) have an unfavorable view of the law. However, only 42% of Americans have an unfavorable view of the law because they think the law goes too far while 11% are unhappy with the law because it does not go far enough.(5)
Views about the Affordable Care Act differ sharply along partisan lines. Nearly 9-in-10 (89%) Republicans hold an unfavorable view of the law, including 79% who have an unfavorable view because they say it goes too far, a view shared by only 13% of Democrats. Among Democrats, more than three-quarters (76%) hold a favorable view of the law, and 10% hold an unfavorable view because they saw the law does not go far enough.
Libertarians are significantly more opposed to Obamacare than either Tea Party members or white evangelical Protestants. More than 9-in-10 (96%) libertarians have an unfavorable view of the health care law, while only 3% express a favorable view of the law. Although libertarians are more intensely opposed to the 2010 health care law, there is considerable alignment between key Republican constituencies. More than 8-in-10 (83%) white evangelical Protestants hold an unfavorable view of the law, as do 88% of Americans who identify as part of the Tea Party movement.
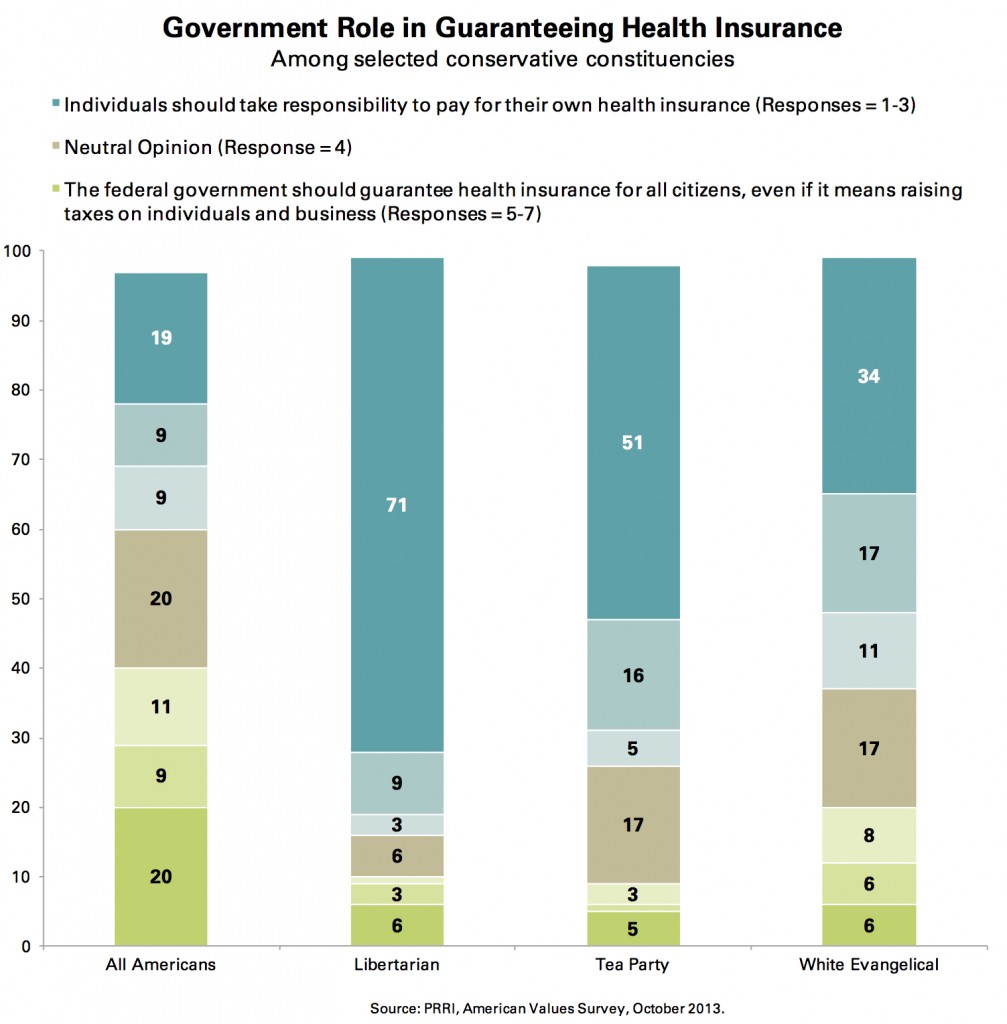
Overall, Americans are nearly evenly divided on the general principle of government provision of health insurance for all citizens. Nearly four-in-ten (37%) Americans agree that “individuals should take responsibility to pay for their own health insurance,” compared to 4-in-10 (40%) who agree with the opposite statement, that “the federal government should guarantee health insurance for all citizens, even if it means raising taxes on individuals and businesses.” Meanwhile, 1-in-5 (20%) Americans hold a neutral view on this question.(6) Americans are strongly divided along partisan lines, with 70% of Republicans agreeing with the former statement and 65% of Democrats agreeing with the latter.
Libertarians more strongly oppose the principle of government-provided health care than do either Tea Party members or white evangelical Protestants. More than 8-in-10 (83%) libertarians agree that “individuals should take responsibility to pay for their own health insurance,” including a remarkable 71% who fully agree with the statement. Only 10% of libertarians agree with the opposing statement, “the federal government should guarantee health insurance for all citizens, even if it means raising taxes on individuals and businesses.” Among Tea Party members, 72% agree that individuals should pay for their own health insurance, including a majority (51%) who fully agree with this statement. A majority (62%) of white evangelical Protestants also agree that individuals should pay for their own health insurance, but they hold less intense feelings, with only 34% fully agreeing with the statement.
Minimum Wage
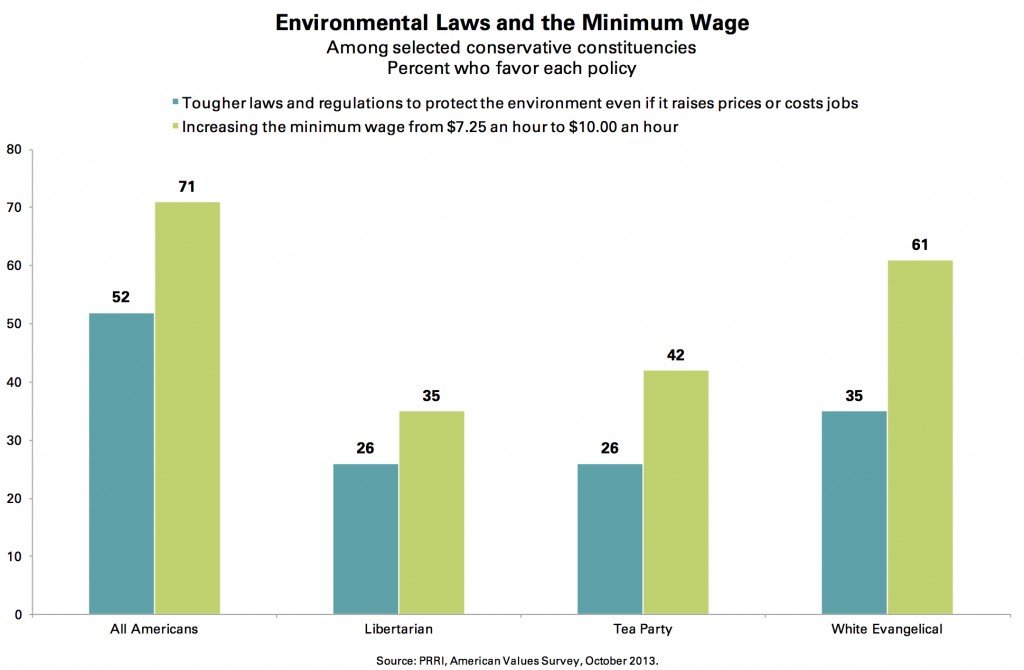
More than 7-in-10 (71%) Americans favor increasing the minimum wage from $7.25 per hour to $10.00 per hour. A majority of both Republicans (57%) and Democrats (89%) favor raising the minimum wage to $10.00 per hour.
Libertarians are significantly more likely than both white evangelical Protestants and members of the Tea Party to oppose raising the minimum wage. Nearly two-thirds (65%) of libertarians are opposed to increasing the minimum wage from $7.25 per hour to $10.00 an hour; only about one-third (35%) of libertarians support a minimum wage hike. A majority (57%) of Americans who identify with the Tea Party also oppose raising the minimum wage, but to a lesser degree than libertarians. By contrast, a solid majority (61%) of white evangelical Protestants favor raising the minimum wage to $10.00 per hour, compared to 37% who oppose.
Environmental Protections
A slim majority (52%) of Americans favor tougher laws and regulations to protect the environment, even if it raises prices or costs jobs. More than 4-in-10 (43%) Americans oppose this policy. Americans are also strongly divided on this issue along party lines, with 68% of Democrats favoring increased environmental laws, and 62% of Republicans opposing such laws; only 36% of Republicans favor tougher environmental laws and regulations if it would raise prices or cost jobs.
On the issue of increasing environmental laws, libertarians and Tea Party members are generally aligned in their strong opposition, while white evangelical Protestants also hold opposing views but are somewhat less intense in their opposition. Nearly three-quarters (73%) of libertarians oppose measures to enact stricter environmental laws and regulations if it raises prices or costs jobs; only 26% of libertarians favor these laws. Nearly identical numbers of Americans who identify with the Tea Party (74%) oppose stricter environmental laws and regulations. More than 6-in-10 (62%) white evangelical Protestants oppose stricter environmental laws.
Social Issues
Unlike economic questions where libertarians tend to be aligned with other Republican constituencies, libertarians have a distinct profile on social issues, though with varying levels of intensity.
Same-sex Marriage
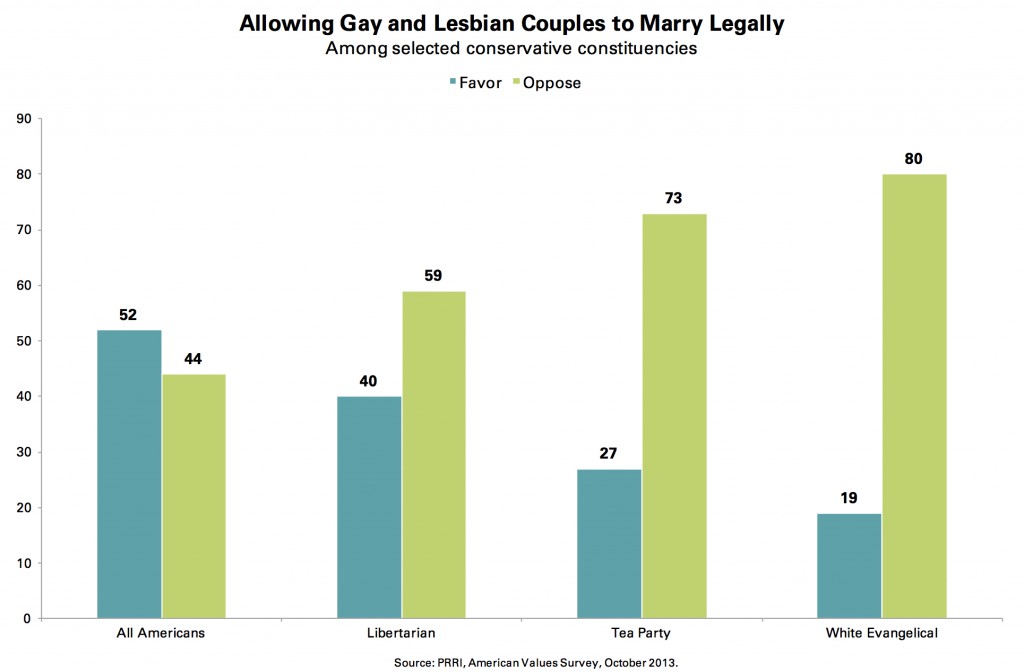
A slim majority (52%) of Americans favor allowing gay and lesbian couples to marry, while 44% are opposed. Americans are strongly divided on this issue along party lines, with two-thirds (67%) of Democrats favoring same-sex marriage and 67% of Republicans opposing it; roughly one-third (31%) of Republicans favor allowing gay and lesbian couples to marry.
While a majority of libertarians oppose same-sex marriage, they are significantly less opposed than Republicans overall and than other conservative-leaning groups such as Tea Party members and white evangelical Protestants. Nearly 6-in-10 (59%) libertarians oppose allowing gay and lesbian couples to marry, compared to 4-in-10 (40%) who favor this policy. Tea Party members are 14 percentage points more likely than libertarians to oppose same-sex marriage (73% oppose), and white evangelical Protestants are 21 percentage points more likely than libertarians to oppose same-sex marriage (80% oppose).
Access to Abortion Services
Nearly 6-in-10 (57%) Americans oppose making it more difficult for a woman to get an abortion, compared to 39% who favor making access more difficult. As with the issue of same-sex marriage, Americans are sharply divided along partisan lines on this issue. More than 7-in-10 (71%) Democrats oppose making it more difficult for a woman to get an abortion. Among Republicans, 58% favor making access to abortion services more difficult, while 39% oppose.
The views of libertarians on this issue are nearly identical to the general population, but diverge sharply from the views of Republicans and other conservative-leaning groups such as Tea Party members and white evangelical Protestants. Nearly 6-in-10 (57%) libertarians oppose making it more difficult for a woman to get an abortion, compared to roughly 4-in- 10 (41%) who favor making access to abortion services more difficult. By contrast, strong majorities of both Tea Party members (58%) and white evangelical Protestants (68%) favor making it more difficult for a woman to get an abortion.
Physician-Assisted Suicide
Americans overall are divided on the question of physician-assisted suicide. Half of the public (50%) favor allowing doctors to legally prescribe lethal drugs to help terminally ill patients end their own lives, while nearly as many (45%) oppose this policy. There are also significant partisan divides on this issue, although they are less pronounced than the divisions on other social issues such as abortion and same-sex marriage. A majority (53%) of Democrats favor the legalization of physician-assisted suicide, but a substantial minority (44%) oppose it. Among Republicans, about 4-in-10 (41%) support the legalization of physician-assisted suicide, compared to a majority (58%) who oppose it.
Notably, libertarians are strongly supportive of the legalization of physician-assisted suicide. Seven-in-ten (70%) libertarians favor allowing doctors to prescribe lethal drugs to help terminally ill patients end their lives, compared to only 29% of libertarians who oppose this policy. Americans who identify with the Tea Party are closely divided on this question, with 49% favoring the legalization of physician-assisted suicide and a slim majority (51%) opposing it. White evangelical Protestants, on the other hand, are strongly opposed to the legalization of physician-assisted suicide (29% favor vs. 70% oppose).
Marijuana Usage
The American public is also closely divided on the issue of marijuana legalization. A slim majority (51%) of the public favor making the use of marijuana legal, compared to 44% who oppose. Nearly two-thirds (64%) of Democrats favor the legalization of marijuana, while more than 6-in- 10 (61%) Republicans oppose it; only 36% of Republicans favor the legalization of marijuana.
Similar to the issue of physician-assisted suicide, libertarians also more closely resemble the views of Democrats than core Republican groups on the issue of marijuana use.(7) More than 7-in-10 (71%) libertarians favor making marijuana usage legal, while only 29% of libertarians oppose. By contrast, nearly 6-in-10 (59%) Tea Party members and nearly 7-in-10 (69%) white evangelical Protestants oppose the legalization of marijuana.
Access to Pornography on the Internet
There is broad public support for making it more difficult to access pornography on the Internet. Nearly two-thirds (65%) of Americans favor making pornography more difficult to access, while 3-in-10 (30%) oppose. There is bipartisan support for making Internet pornography more difficult to access, with two-thirds (67%) of Democrats and three-quarters (75%) of Republicans favoring increased restrictions.
By comparison, only about 3-in-10 (31%) libertarians favor making it more difficult to access Internet pornography, compared to nearly 7-in-10 (68%) who oppose. Libertarian views on this issue stand apart from the opinions of both Tea Party members (64% favor, 33% oppose) and white evangelical Protestants (82% favor, 17% oppose).
III. The Political Context: 2014 and Beyond
Political Engagement Levels
Political Attentiveness
Libertarians are much more likely than Americans overall to pay attention to what is going on in government and politics. Fewer than 4-in-10 (38%) Americans report paying attention to politics and government most of the time or always. About 1-in-5 (19%) Americans say they pay attention about half of the time, roughly one-third (32%) say they pay attention some of the time and 10% say they do not pay any attention. Among libertarians, a majority (56%) report that they pay attention to politics always or most of the time.
Libertarians and members of the Tea Party are equally likely to report regular engagement with politics. By contrast, white evangelical Protestants are significantly less likely to be politically engaged. More than 6-in-10 (61%) Tea Party members say they follow politics always or most of the time. In contrast, fewer than 4-in-10 (39%) white evangelical Protestants report paying attention to government and politics most of the time or always.
Voter Registration and Participation in Primary Elections
Overall, about three-quarters (76%) of Americans report that they are registered to vote. Republicans have a slight advantage in voter registration rates, with 85% of Republicans reporting that they are registered to vote, compared to 79% of Democrats. Eight-in-ten (80%) libertarians report that they are registered to vote, a rate comparable to Tea Party members (86%) and white evangelical Protestants (83%).
Overall, about 4-in-10 (41%) American voters say they always vote in primary elections. Significantly more Republican voters (50%) than Democratic voters (40%) report voting in primary elections. A majority (53%) of libertarian voters say they always vote in primary elections, a rate comparable to white evangelical voters (48%) but significantly lower than the participation rate among Tea Party voters (62%).
Favorability of the Political Parties
Although neither political party is viewed favorably by a majority of Americans, Americans hold more favorable views of the Democratic Party (44% favorable, 47% unfavorable) than the Republican Party (35% favorable, 55% unfavorable).(8)
Among libertarians, the Republican Party retains a considerable reputation advantage over the Democratic Party. However, libertarians view Democrats more negatively than they view Republicans positively. A majority (57%) of libertarians have a favorable view of the Republican Party, but a substantial minority (40%) have an unfavorable view of the GOP. However, only 6% of libertarians have a favorable view of Democrats. Nearly 9-in-10 (89%) libertarians have an unfavorable view of the Democratic Party, including nearly two-thirds (64%) who have a very unfavorable opinion of the party.
Americans who identify with the Tea Party are similarly negatively disposed toward the Democratic Party. Only 1-in-10 (10%) Americans who identify with the Tea Party movement view the Democratic Party favorably, while nearly 9-in-10 have an unfavorable (27%) or very unfavorable (61%) view. However, Americans who identify with the Tea Party have a more positive view of the GOP than libertarians. More than two-thirds (68%) of Tea Party members have a favorable view of the Republican Party.
White evangelical Protestants are also more favorably disposed toward the GOP than libertarians. About two-thirds (66%) of white evangelical Protestants have a favorable view of the Republican Party, while fewer than 3-in-10 (29%) have an unfavorable view. In contrast, about 8-in-10 (79%) white evangelical Protestants have an unfavorable view of the Democratic Party.
Perceptions of Political Parties’ Ideologies
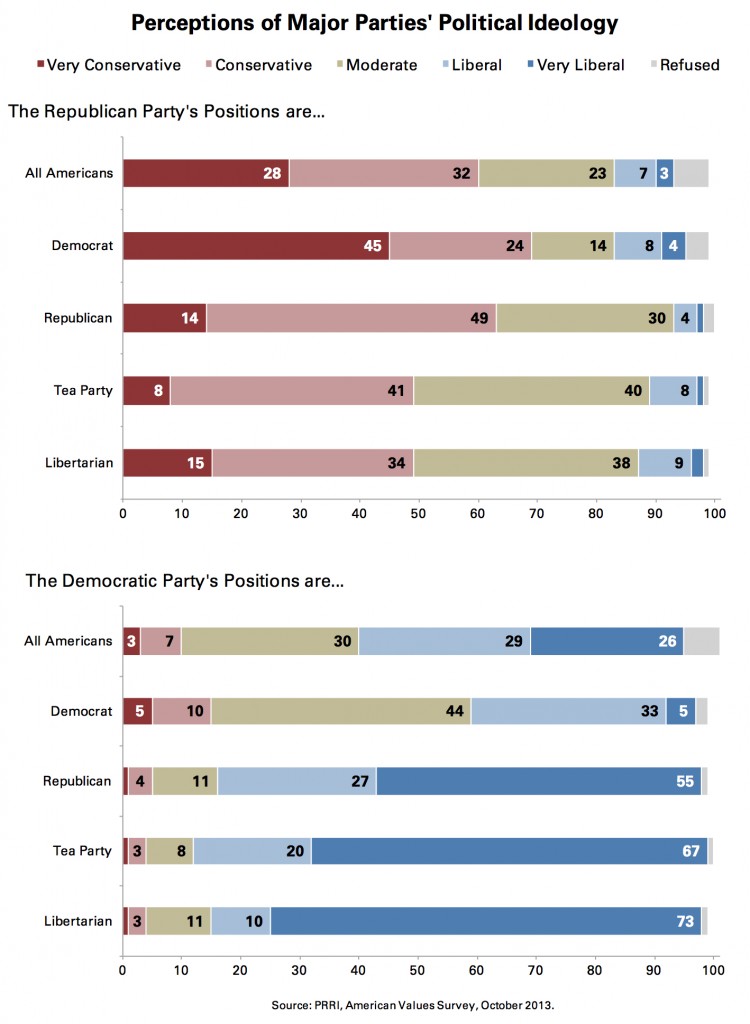
Among Americans overall, the two political parties are seen as ideological mirror images of one another. Six-in-ten (60%) Americans believe the Republican Party is conservative or very conservative in its political positions, while about one-quarter (23%) say it is moderate, and 1-in-10 (10%) believe it is liberal or very liberal. On the other hand, a majority (55%) of Americans say the Democratic Party is liberal or very liberal, while 3-in-10 (30%) say the Democratic Party is moderate, and 10% say the party is conservative or very conservative.
Self-identified Democrats and Republicans have very different conceptions of their respective parties. Roughly 4-in-10 (38%) Democrats believe their party is liberal, but a plurality (44%) of Democrats say their party is ideologically moderate in its positions. Among Republicans, more than 6-in-10 (63%) say their party is conservative, while 3-in-10 (30%) believe it is moderate. More than 8-in-10 (82%) Republicans say the Democratic Party is liberal, while fewer Democrats (69%) say the Republican Party is conservative.
Libertarians, members of the Tea Party, and white evangelical Protestants are all less likely to view the Republican Party as conservative than Americans overall. Fewer than half (49%) of libertarians believe the Republican Party is conservative (34%) or very conservative (15%), while about 4-in-10 (38%) say the party is moderate. Among Tea Party members, an equal number (49%) say the GOP is conservative in its political positions, while 4-in-10 (40%) say the party is moderate. Similarly, 55% of white evangelical Protestants say the Republican Party is conservative, while 34% say it is moderate.
Libertarians, members of the Tea Party, and white evangelical Protestants are also more likely to believe that the Democratic Party is liberal than Americans overall. More than 8-in-10 libertarians say the Democratic Party is liberal (10%) or very liberal (73%). Similarly, more than 8-in-10 Tea Party members view the Democratic Party as liberal (20%) or very liberal (67%). Nearly three-quarters of white evangelical Protestants say the Democratic Party is liberal (21%) or very liberal (53%). Few libertarians (11%), members of the Tea Party (8%), or white evangelical Protestants (15%) believe the Democratic Party is moderate in its positions.
Support for and Favorability of Political Candidates
The 2012 Presidential Election
Libertarian voters report that they supported Mitt Romney in 2012 at levels roughly comparable to other conservative-leaning groups. Fully 8-in-10 (80%) libertarian voters say they supported Mitt Romney in the 2012 election, while only 5% say they supported Barack Obama. Notably, however, 14% of libertarian voters report that they supported a third-party candidate. The levels of support for Mitt Romney were similar among white evangelical Protestant voters (79%) and Tea Party voters (86%). White evangelical Protestant voters and Americans who identify with the Tea Party movement, however, are significantly less likely to report that they voted for a third-party candidate (4% and 6% respectively).
Favorability of Potential 2016 Presidential Candidates
Senator Rand Paul has a significant advantage over other potential 2016 GOP nominees in how he is viewed among important Republican constituencies. However, some of Paul’s current advantage is based on having greater name recognition than his competitors.
Among voters who are libertarian or lean libertarian, a majority (56%) have a favorable view of Paul, compared to roughly 4-in-10 who have a favorable impression of Senator Ted Cruz (39%), Governor Chris Christie (44%), or Senator Marco Rubio (41%). Both Paul and Christie are more well known among libertarian and libertarian-leaning voters than Cruz and Rubio. Nearly 4-in-10 voters who are libertarian or lean libertarian do not know Cruz (37%), and nearly 3-in-10 do not know Rubio (28%). About 1-in-5 say they are unfamiliar with Paul (20%) or Christie (18%).
Tea Party voters have favorable views of all four potential candidates, but Paul remains more popular at this stage than any of his competitors. Three-quarters (75%) of Tea Party voters have a favorable view of Paul, compared to nearly two-thirds (65%) who view Rubio favorably and roughly 6-in-10 with favorable views of Cruz (61%) and Christie (58%). Among the potential candidates, Cruz has the most room for growth; nearly 1-in-4 (24%) Tea Party voters are unfamiliar with the Texas senator.
A majority (54%) of white evangelical Protestant voters report having a favorable view of Paul, compared to nearly half (49%) with a favorable view of Christie and roughly 4-in-10 with favorable views of Cruz (40%) and Rubio (36%). Importantly, Rubio and Cruz are less well known among evangelical voters than their competitors. More than 4-in-10 (43%) white evangelical Protestant voters report being unfamiliar with Rubio, while more than one-third (34%) report being unfamiliar with Cruz. Fewer white evangelical Protestant voters report being unfamiliar with Christie (23%), or Paul (21%).
Both former Secretary of State Hillary Clinton and Vice President Joe Biden are viewed positively among Democratic voters, although Clinton has an advantage in overall favorability and intensity. More than 9-in-10 (91%) Democratic voters have a favorable view of Clinton, while approximately three-quarters (77%) have a favorable view of Biden. However, Clinton is about twice as likely to be viewed very favorably as Biden (44% vs. 24%). These patterns remain consistent across most important Democratic subgroups.
2016 Presidential Nominee Preferences
Among voters who identify with or lean toward the Republican Party, support is spread fairly evenly across the potential 2016 presidential field in a head-to-head question.(9) Eighteen percent prefer Governor Chris Christie, 18% prefer Congressman Paul Ryan, 15% prefer former Governor Jeb Bush, 14% prefer Senator Marco Rubio, 11% prefer Senator Rand Paul, and 11% prefer Senator Ted Cruz.
Among libertarian voters who identify with or lean toward the Republican Party, Paul was the most popular potential candidate. More than one-quarter (26%) of libertarian voters say Paul would be their preferred candidate in 2016, while 18% prefer Cruz, 16% prefer Rubio, and 13% prefer Ryan. Fewer libertarian voters prefer Christie (10%) or Bush (6%).
Among Tea Party voters who identify or lean Republican, Cruz is the most preferred candidate (22%), followed by Rubio (18%), Ryan (14%), and Paul (13%). Roughly 1-in-10 Tea Party voters prefer Bush (11%) or Christie (12%).
White evangelical Protestant voters have less clear candidate preferences, compared to libertarian and Tea Party voters. Among white evangelical Protestant voters who identify or lean Republican, top preferences include Ryan (19%), Christie (16%), and Bush (15%), while roughly 1-in-10 prefer Rubio (13%), Paul (11%), or Cruz (10%).
Among voters who identify with or lean toward the Democratic Party, former Secretary of State Hillary Clinton is by far the preferred option.(10) More than two-thirds (68%) of Democratic voters say they would prefer that Hillary Clinton be the party’s nominee in 2016, while 13% prefer Vice President Joe Biden. Only about 1-in-20 Democratic voters prefer Senator Elizabeth Warren (5%) or Governor Andrew Cuomo (4%), and only 1% of Democratic voters prefer Governor Martin O’Malley. These patterns of support were fairly consistent across major Democratic subgroups.
Endnotes
1 Converse, Philip. E. 1964. “The Nature of Belief Systems Among Mass Publics.” In Ideology and Discontent, ed. David E. Apter. New York: Free Press, 206–61.
2 We are grateful to the work of Maddox and Lilie (1984), who developed a definition of libertarianism that combined two separate dimensions: personal freedom and government intervention. Maddox and Lilie relied on a series of questions that included economic attitudes as well as social issue policies like support for abortion and marijuana legalization. We took a different approach for two reasons: 1) the issue agenda has evolved significantly during the last 30 years, particularly with the emergence of national security and domestic surveillance concerns, and 2) the ideas of personal freedom and government intervention are closely related, and most questions we explored along these lines produced a single dimension rather than two discrete dimensions. Maddox, William S. and Stuart A. Lilie. 1984. Beyond Liberal and Conservative: Reassessing the Political Spectrum. Washington, DC: The Cato Institute.
3 The correlation between the Libertarian Orientation Scale and political ideology is 0.275.
4 Note that an additional 24% of Republicans and 8% of Democrats are libertarian leaners, but this group has a much less distinctive footprint than libertarians.
5 One percent of respondents reported that they were unsure why they had an unfavorable view of the law.
6 Response categories were on a seven-point scale. Answers on the low end of the scale (1-3) were categorized as agreement with statement one, while answers on the high end of the scale (5-7) were categorized as agreement with statement two. A response of four was considered a neutral response. This coding scheme is followed for all seven-point scale questions throughout the report.
7 Note that the strength of libertarian views on the issues of marijuana and pornography are influenced by the fact that these issues were included in the composition of the Libertarian Orientation Scale and therefore part of the defining characteristics of being classified as a libertarian.
8 Note that these favorability questions were asked prior to the government shutdown, which subsequent polling shows hurt the favorability ratings of both parties.
9 GOP candidate preferences were only asked of respondents who identify with or lean toward the Republican Party. The list of choices for the 2016 Republican presidential nominee included the following: Senator Rand Paul, Senator Ted Cruz, Senator Marco Rubio, Congressman Paul Ryan, Former Governor Jeb Bush and Governor Chris Christie.
10 Democratic candidate preferences were only asked of those who identify with or lean toward the Democratic Party. The list of choices for the 2016 Democratic presidential nominee included the following: former Secretary of State Hillary Clinton, Vice President Joe Biden, Senator Elizabeth Warren, Governor Andrew Cuomo, and Governor Martin O’Malley
11 The parameter for Internet access was obtained from the most recent special CPS supplemental survey (October 2010).
12 For the question of making it more difficult to access pornography, the strongly favor category was recoded to 7, the favor category was recoded to 5, the oppose category was recoded to 3, and the strongly oppose category was recoded to 1. The question about marijuana legalization was also recoded using this method.
Recommended citation:
Jones, Robert P., Daniel Cox, and Juhem Navarro-Rivera. “In Search of Libertarians in America.” PRRI. 2013. http://www.prri.org/research/2013-american-values-survey/.
